Embed Size (px)
Citation preview

A P R I L 2 0 1 6
How Healthy, Protein-Rich Foods are Nourishing Growth in the Consumer Packaged Goods Industry
P O I N T O F V I E W
POINT OF VIEW
1POINT OF VIEW: How Healthy, Protein-Rich Foods are Nourishing Growth in the Consumer Packaged Goods Industry IRIworldwide.com
The U.S. consumer packaged goods (CPG) industry registered its strongest growth in four years in 2015, and much of the fuel was provided by small and midsized producers of healthy, protein-rich foods and beverages. In fact, the research found that companies like Quest Nutrition, Fairlife, Bai, Vita Coco, and Sargento— all of which target high-protein foods and beverages and mindful snacks—are among the highest performers in the entire industry.
The growing popularity of healthier food options does not mean that U.S. consumers have lost their willingness to indulge. Several large,
high-performing CPG companies derived most of their growth in 2015 from such product categories as confections, ice cream, and alcoholic beverages. Strong sales in convenience stores—the fastest-growing retail channel last year—helped power these categories.
These findings are based on research by Information Resources Inc. (IRI) and The Boston Consulting Group (BCG). For the past four years, IRI and BCG have analyzed the growth performance of more than 400 CPG companies with annual U.S. retail sales of more than $100 million.
How Healthy, Protein-Rich Foods Are Nourishing Growth in the Consumer Packaged Goods Industry
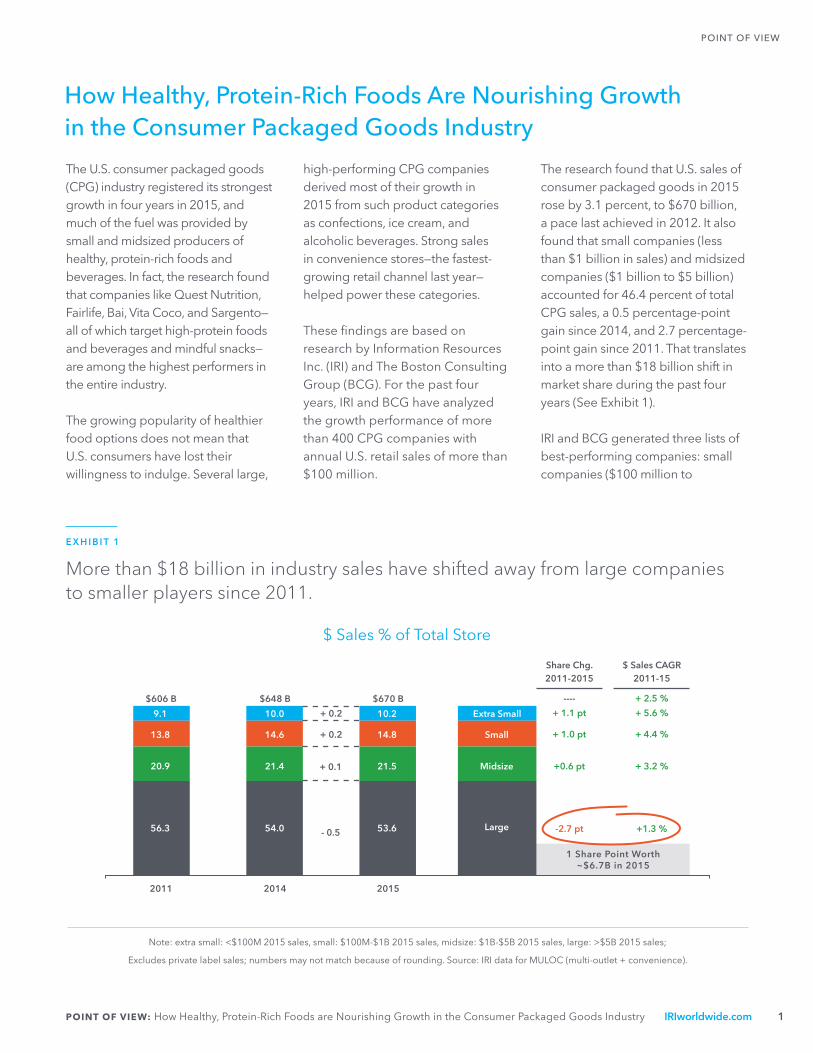
E X H I B I T 1
More than $18 billion in industry sales have shifted away from large companies to smaller players since 2011.
Note: extra small: <$100M 2015 sales, small: $100M-$1B 2015 sales, midsize: $1B-$5B 2015 sales, large: >$5B 2015 sales;
Excludes private label sales; numbers may not match because of rounding. Source: IRI data for MULOC (multi-outlet + convenience).
The research found that U.S. sales of consumer packaged goods in 2015 rose by 3.1 percent, to $670 billion, a pace last achieved in 2012. It also found that small companies (less than $1 billion in sales) and midsized companies ($1 billion to $5 billion) accounted for 46.4 percent of total CPG sales, a 0.5 percentage-point gain since 2014, and 2.7 percentage-point gain since 2011. That translates into a more than $18 billion shift in market share during the past four years (See Exhibit 1).
IRI and BCG generated three lists of best-performing companies: small companies ($100 million to
$ Sales % of Total Store
$606 B $648 B $670 B
9.1
13.8
20.9
56.3
2011 2014 2015
10.0
14.6
21.4
54.0
10.2
14.8
21.5
53.6
Extra Small
Small
Midsize
Large
+ 0.2
+ 0.2
+ 0.1
- 0.5
$ Sales CAGR2011-15
+ 2.5 %
+ 5.6 %
+ 4.4 %
+ 3.2 %
+1.3 %
Share Chg.2011-2015
----
+ 1.1 pt
+ 1.0 pt
+0.6 pt
-2.7 pt
1 Share Point Worth~$6.7B in 2015

POINT OF VIEW
2POINT OF VIEW: How Healthy, Protein-Rich Foods are Nourishing Growth in the Consumer Packaged Goods Industry IRIworldwide.com
$1 billion in IRI-measured retail sales), midsize companies ($1 billion to $5 billion), and large companies (more than $5 billion). The analysis covered both public and private CPG companies and focused on what consumers actually bought in measured channels, as opposed to what factories shipped. Companies are ranked on a combination of three metrics: dollar sales growth, volume sales growth, and market share gains. The study also analyzed trends driving performance in the sector.
Among large companies, the top growth leaders are Reynolds America (which acquired Lorillard), Unilever, Altria, Mars, and Dr. Pepper Snapple Group. The leaders among midsize companies are GlaxoSmithKline, Hostess, Starbucks, Eggland’s Best, and Sterilite. Topping the growth leader list of small companies are Quest Nutrition, Teva, Fairlife, Bai, and Idahoan (See Exhibit 2).
Findings confirm that consumers’ desire for more healthful eating
E X H I B I T 2
Trends around healthful eating are playing a powerful role in growth, yet the quest for indulgence remains influential, too.
remains a powerful trend that packaged foods companies can't ignore. The trend is particularly noticeable among companies with annual sales of less than $5 billion.
Quest Nutrition, a leader in protein bars, is the top-performing small company on the list. Fairlife, the third highest-performing small company, sells ultra-filtered milk, which is richer in protein than conventional milk. The brands
Note: small: $100M-$1B 2015 sales, midsize: $1B-$5B 2015 sales, large: >$5B 2015 sales; excludes private label sales.
Source: IRI data for MULOC (multi-outlet + convenience) 2014-2015.
2015 Large, Midsize, Small Growth Leaders in U.S.
Large: New to Top 10 List vs. 2014; Mid/Small: New to Top 15 List vs. 2014
3
1
2
6
4
5
7
10
8
9
5
1
3
7
9
11
6
2
4
8
10
12
13 14
15
5
1
3
7
9
11
6
2
4
8
10
12
13 14
15
3
Includes Lorillard
AllMarket
FifthGen
Large Midsize Small

POINT OF VIEW
3POINT OF VIEW: How Healthy, Protein-Rich Foods are Nourishing Growth in the Consumer Packaged Goods Industry IRIworldwide.com
E X H I B I T 3
Powerful healthier-for-you innovation spans food and beverage aisles.
of WhiteWave Foods, which is among the best-performing midsize companies, include Horizon organic dairy and Silk plant-based beverages. Vega, owned by WhiteWave, makes food and beverage products containing plant-based protein.
Several makers of mindful snacks, which promote health and wellness, also made best-performer lists. Bai is a maker of low-calorie, antioxidant fruit drinks infused with the outer layer of coffee berries. Vita Coco, which made the best-performing small CPG company list for the third year,
markets coconut beverages and oil. ReadyPac Foods makes a wide range of on-the-go salad bowls, and Kind makes whole-grain bars and clusters. The growth of Sargento, a top-performing midsize company, is driven by its Balanced Break brand of snacks, which include fruits, nuts, and cheese (See Exhibit 3).
Packaged Salad Bowls
Functional Beverages
Chip Alternatives
Fruit, Nut, Cheese Pack Healthy
Snack Bars

POINT OF VIEW
4POINT OF VIEW: How Healthy, Protein-Rich Foods are Nourishing Growth in the Consumer Packaged Goods Industry IRIworldwide.com
E X H I B I T 4
Established indulgent brands still contribute significantly to topline growth.
Source: IRI data for MULOC (multi-outlet + convenience), IRI and BCG analysis.
Most of the best-performing large companies also offer health-minded foods and beverages. Still, much of their growth continues to be driven by consumer indulgences. Strong sales growth in M&M's chocolate,
Juicy Fruit gum, and Dove chocolate and ice cream helped make Mars a leading performer in 2015, for example, while Ben & Jerry’s and Breyers ice cream lines were major contributor to sales growth at Unilever. (See Exhibit 4).
2014 2015
2014 2015
2014 2015 2014 2015 2014 2015
2014 2015 2014 2015 2014 2015
$10.6 B $10.9 B
$10.9 B $11.2 B
$1.6 B $1.7 B
$0.6 B $0.7 B
$0.1 B$0.2 B
$0.2 B $0.3 B
$0.1 B$0.2 B
$0.5 B $0.6 B
3%
4%
15%
84%
35%
30%
12%
25%
% of Net Mars$ Sales Growth
2%
25%34%
11%19%20%
% of Net Unilever$ Sales Growth
Soft drink giants Dr. Pepper Snapple, Coca-Cola, and PepsiCo were all among the top large-company performers, while Constellation Brands, whose growth was driven by Corona and Modelo beer, made the midsize list.

POINT OF VIEW
5POINT OF VIEW: How Healthy, Protein-Rich Foods are Nourishing Growth in the Consumer Packaged Goods Industry IRIworldwide.com
Strong sales growth in convenience stores, which was helped by lower gas prices and higher employment in 2015, contributed to solid sales of tobacco, beer, and soft drinks for such companies as Altria, PepsiCo, Red Bull, and Constellation Brands. Convenience stores registered 6.9 percent sales growth in 2015, compared with 3.1 percent for all outlets. Although convenience stores accounted for 18.7 percent of all measured channel sales, they contributed 39.6 percent of retail sales growth. Manufacturers of product categories that are top-sellers in convenience stores delivered some of the strongest growth (See Exhibit 5).
Several pharmaceutical manufacturers also ranked among
2015’s best performers, largely by successfully bringing prescription drugs to the over-the-counter market. For example, Pfizer and GlaxoSmithKline began marketing nonprescription Nexium and Flonase, respectively, while Teva introduced an over-the-counter contraception product, Plan B One-Step.
Another significant finding of the research was that small CPG performance leaders are achieving strong growth primarily through wider distribution of their products. In some cases, this is because small companies are getting better placement on retail shelves or having their brands distributed by large CPG companies. According
to BCG’s analysis, small companies are also boosting sales through online retailers and promotion via social media. By contrast, the growth of most high-performing large CPG companies is driven by higher sales of their products at existing retail channels, according to IRI data.
Despite challenging market conditions, growth opportunities in consumer packaged goods remain many and diverse. The top performers will invest to gain a granular understanding of key consumer trends and stimulate fundamental demand by dialing in to high-gain segments with tightly targeted pricing, promotion, and distribution strategies.
E X H I B I T 5
The convenience store channel is a key outlet for high-performing CPG categories and brands.
1US Energy Information Administration 2015. Source: IRI data for MULOC (multi-outlet + convenience); 2014-2015.
Many Growth Leaders Impacted by Convenience Momentum
Convenience Cont. to Growth
Fair Share IndexCompanies
105% 130
104% 130
79% 103
72% 158
70% 91
61% 191
54% 145
53% 165
48% 175
41% 96
40% 178
Note: growth leaders with >40% contribution to growth from convenience included; Fair Share Index = (Conv. Cont to Growth)/(Conv. Share)*100. All Market, Bai, Fairlife, Anheuser Busch, SABMiller, and Hershey’s also impacted by convenience tailwinds.
Low 2015 Gas Prices DrivingIncreased Sales in Convenience
U.S. Retail Gasoline Prices1
Largest Convenience Channel Categories
Dollar Sales % Chg.
2015 vs. 2014Acceleration
vs. 2014Category
SPORTS/ENERGY DRINKS 10.9% + 5.6
SNACKS 8.1% + 0.8
TOBACCO 6.9% + 5.8
CANDY 5.6% + 2.9
LIQUOR 5.2% + 1.9
CARBONATED BEVERAGES 3.8% + 3.0
TOTAL CONVENIENCE CHANNEL CPG GROWTH 6.9% + 4.2
$3.58 $3.68 $3.58$3.44
$2.52
2011 2012 2013 2014 2015
4
3
0

A B O U T T H E AU T H O R S
Jim Brennan is a partner and managing director in The Boston Consulting Group’s New York office, Krishnakumar Davey is president of IRI Strategic Analytics, Peri Edelstein is a principal in BCG’s New York office, Leslie Hinchcliffe is a knowledge expert in BCG’s Consumer practice, and Nagi Jonnalagadda is principal of IRI Strategic Analytics.
Mr. Davey can be reached at [email protected].
Mr. Jonnalagadda can be reached at [email protected].
A B O U T T H E P R AC T I C E
IRI Strategic Analytics helps manufacturers and retailers achieve high-impact business outcomes by determining which growth levers brands and categories should focus on to optimize results. With a unique combination of predictive analytical techniques, proprietary rapid modeling platforms, leading-edge automated solutions, a vast and granular CPG data set, and experienced analytics consulting talent, IRI Strategic Analytics uncovers hidden opportunities and insights that deliver growth to businesses.
About IRI IRI is a leader in delivering powerful market and shopper information, predictive analysis and the foresight that leads to action. We go beyond the data to ignite extraordinary growth for our clients in the CPG, retail and over-the-counter health care industries by pinpointing what matters and illuminating how it can impact their businesses. Move your company forward at IRIworldwide.com.
Corporate Headquarters: 150 North Clinton St., Chicago, IL 60661, USA, (312) 726-1221
Copyright © 2016 Information Resources, Inc. (IRI). All rights reserved. IRI, the IRI logo and the names of IRI products and services referenced herein are either trademarks or registered trademarks of IRI. All other trademarks are the property of their respective owners.