Embed Size (px)
Citation preview

LETTER
How the aggressiveness of rainfalls in the Mediterraneanlands is enhanced by climate change
Nazzareno Diodato & Gianni Bellocchi &Nunzio Romano & Giovanni Battista Chirico
# Springer Science+Business Media B.V. 2011
Abstract Rainfall and overland flow are fundamental processes for Earth’s ecosystems butcan also be land disturbing forces, particularly when triggered by extreme hydro-meteorological events. Examples of these extremes are rainstorms and related phenomenadue to rainfall aggressiveness. They produce high-impact land processes such as soilerosion and nutrient losses. Economic and social consequences of these processes can bequite severe. However, hydrological extremes and their environmental implications are stillpoorly understood, particularly if analyzed in the context of climate change. Here, weanalyze a 300 year long times series of historical rainfall patterns across the Mediterraneanin the last three centuries and we investigate changes in the erosive forcing as related toclimate changes. Our results show that the erosive forcing increased towards the end of theLittle Ice Age (~1850) over western and central Mediterranean and that has been increasingin the recent warming period at low Mediterranean latitudes, due to a higher frequency ofintensive storms. Such increased concentrated precipitation may lead to an intensification ofland degradation processes triggered by soil erosion and transport across a range of scalesfrom hillslopes to small catchments.
1 Introduction
Extreme rainfalls are the most accountable climatic agents triggering soil erosion processesworldwide (Hilton et al. 2008), causing serious land degradation and environmental
Climatic Change (2011) 108:591–599DOI 10.1007/s10584-011-0216-4
N. Diodato :G. BellocchiMet European Research Observatory, CEOP(GEWEX) Network—World Climate Research Programme,via Monte Pino snc, 82100 Benevento, Italy
G. BellocchiGrassland Ecosystem Research Unit, French National Institute of Agricultural Research,avenue du Brézet 234, 63000 Clermont-Ferrand, France
N. Romano : G. B. Chirico (*)Department of Agricultural Engineering, University of Naples Federico II, Via Università 100, Portici,Naples 80055, Italye-mail: [email protected]
Received: 21 March 2011 /Accepted: 9 August 2011 /Published online: 27 August 2011
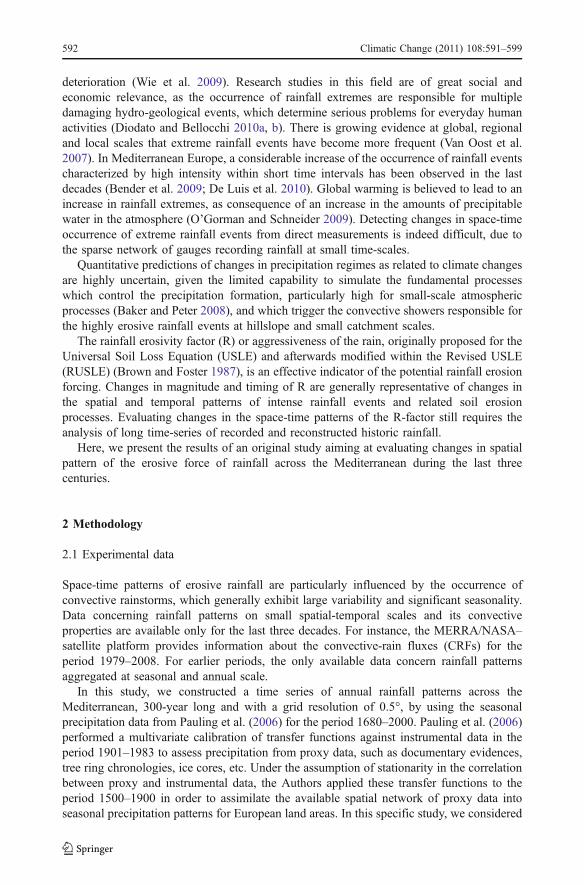
deterioration (Wie et al. 2009). Research studies in this field are of great social andeconomic relevance, as the occurrence of rainfall extremes are responsible for multipledamaging hydro-geological events, which determine serious problems for everyday humanactivities (Diodato and Bellocchi 2010a, b). There is growing evidence at global, regionaland local scales that extreme rainfall events have become more frequent (Van Oost et al.2007). In Mediterranean Europe, a considerable increase of the occurrence of rainfall eventscharacterized by high intensity within short time intervals has been observed in the lastdecades (Bender et al. 2009; De Luis et al. 2010). Global warming is believed to lead to anincrease in rainfall extremes, as consequence of an increase in the amounts of precipitablewater in the atmosphere (O’Gorman and Schneider 2009). Detecting changes in space-timeoccurrence of extreme rainfall events from direct measurements is indeed difficult, due tothe sparse network of gauges recording rainfall at small time-scales.
Quantitative predictions of changes in precipitation regimes as related to climate changesare highly uncertain, given the limited capability to simulate the fundamental processeswhich control the precipitation formation, particularly high for small-scale atmosphericprocesses (Baker and Peter 2008), and which trigger the convective showers responsible forthe highly erosive rainfall events at hillslope and small catchment scales.
The rainfall erosivity factor (R) or aggressiveness of the rain, originally proposed for theUniversal Soil Loss Equation (USLE) and afterwards modified within the Revised USLE(RUSLE) (Brown and Foster 1987), is an effective indicator of the potential rainfall erosionforcing. Changes in magnitude and timing of R are generally representative of changes inthe spatial and temporal patterns of intense rainfall events and related soil erosionprocesses. Evaluating changes in the space-time patterns of the R-factor still requires theanalysis of long time-series of recorded and reconstructed historic rainfall.
Here, we present the results of an original study aiming at evaluating changes in spatialpattern of the erosive force of rainfall across the Mediterranean during the last threecenturies.
2 Methodology
2.1 Experimental data
Space-time patterns of erosive rainfall are particularly influenced by the occurrence ofconvective rainstorms, which generally exhibit large variability and significant seasonality.Data concerning rainfall patterns on small spatial-temporal scales and its convectiveproperties are available only for the last three decades. For instance, the MERRA/NASA–satellite platform provides information about the convective-rain fluxes (CRFs) for theperiod 1979–2008. For earlier periods, the only available data concern rainfall patternsaggregated at seasonal and annual scale.
In this study, we constructed a time series of annual rainfall patterns across theMediterranean, 300-year long and with a grid resolution of 0.5°, by using the seasonalprecipitation data from Pauling et al. (2006) for the period 1680–2000. Pauling et al. (2006)performed a multivariate calibration of transfer functions against instrumental data in theperiod 1901–1983 to assess precipitation from proxy data, such as documentary evidences,tree ring chronologies, ice cores, etc. Under the assumption of stationarity in the correlationbetween proxy and instrumental data, the Authors applied these transfer functions to theperiod 1500–1900 in order to assimilate the available spatial network of proxy data intoseasonal precipitation patterns for European land areas. In this specific study, we considered
592 Climatic Change (2011) 108:591–599

only rainfall data reconstructed from 1680, as data referring to earlier periods are affectedby higher uncertainty due to lacking of proxy data. The performance of the reconstructionsvaries over centuries, being related to the number and the quality of the available predictorsacross Europe, which obviously increase from earlier to more recent periods. Pauling et al.(2006) provide an estimate of the spatially averaged uncertainty associated with thereconstructions at seasonal scale, expressed by the predictor standard deviation which is notcaptured by the transfer functions. The uncertainty is higher in the earlier centuries, withseasonal values of 40 mm in the 17th century, while it reduces to 20–25 mm in the 20thcentury. At annual scale, the spatially average uncertainty attached to the reconstructedrainfall fields is about 160 mm in the 17th and 18th centuries, 115 mm in 19th century and90 mm in the 20th century. Pauling et al. (2006) also show that the reconstructive skill ishighly variable in space, being mainly linked to the spatial density of the availablepredictors which changes significantly across the reconstructed centuries. For instance, poorreconstructive skill occurs over Turkey, southern Italy and southern France even in the early20th century, due to the limited number of monitoring stations available in these regions.Data for an effective assessment of the spatial variability of the uncertainty attached to thereconstructed rainfall fields in the different centuries are not available.
We extended the data until 2009 with the gridded dataset produced by the ClimateResearch Unit at the University of East Anglia, United Kingdom (URL: http://badc.nerc.ac.uk/data/cru) and we employed the time-series of annual rainfall patterns from 1680 to 2009in order to calculate patterns of R-factor values with a model specifically calibrated andvalidated for the Mediterranean, as illustrated below.
2.2 Estimation of mean annual rainfall erosivity at grid-points
Diodato and Bellocchi (2010a, b) showed that rainfall erosivity can be assessed across theMediterranean by a regression model of the annual maximum daily rainfall and the totalannual rainfall, scaled by a linear function of the site’s geographic longitude. In this study,in order to estimate the mean annual rainfall erosivity values from historical annual rainfalldata, we designed and calibrated a new regression model, hereafter referred to as theMediterranean Rainfall Erosivity Historical Model (RMedREHM):
RMedREHM ¼ P98 � A� B � Lð Þ ð1Þ
where RMedREHM is the predicted mean annual rainfall erosivity as defined by the RUSLER–factor (MJ mm ha−1 h−1year−1), P98 is the 98th percentile of the annual precipitation(mm year−1), L is the site’s geographic longitude (in decimal degrees), and A and B areregression coefficients. The 98th percentile of the annual rainfall was found to be the bestpredictor of the mean annual rainfall erosivity. The term in brackets l=(A–B·L) is alongitudinal factor controlling the conversion from P98 to annual erosivity, whileaccounting for the spatial variability of rainfall erosivity in the Mediterranean area. In theMediterranean basin, west-to-east decreasing gradient of rainfall erosivity is related to thecyclogenesis (Diodato and Bellocchi 2010a, b), thus the longitudinal factor l can bethought of as a proxy for the progressively less pronounced character of convective rainfallextremes as one moves from west to east in the study area.
In order to calibrate the regression model expressed by Eq. 1, we obtained daily rainfalltime series from the European Climate Assessment and Dataset (ECA&D) project (URL:http://eca.knmi.nl), keeping only those with a minimum time span of 20 years in the period1950–2000 (for a total of 36 series). We calculated annual P98 values from these series,
Climatic Change (2011) 108:591–599 593

while we took annual rainfall erosivity (Robs) values at the same locations from Diodato andBellocchi (2010a, b). The optimum parameter set, with A=1.1 and B=0.012, was found byleast-squares regression between the ratio Robs/P98 and L. Figure 1 shows the goodness offit with this parameter set. The Nash and Sutcliffe (1970) modeling efficiency is 0.9(optimum=1.0). The standard error σl associated with the estimated longitudinal factor l isequal to 0.11.
It is important to note that all predictions are associated with uncertainties, which canderive from errors in the input data as well as in the model structure and parameters (e.g.Chirico et al. 2010). In this specific case study, the overall uncertainty associated with theannual erosivity predicted with Eq. 1 is the sum of the uncertainties associated with bothP98 and the longitudinal factor l. This uncertainty can be expressed by the standard error ofRMedREHM, which can be analytically computed from the standard error σ and the mean μattached to P98 and l, as follows (Heuvelink et al. 1989):
sRMedREHM ¼ffiffiffiffiffiffiffiffiffiffiffiffiffiffiffiffiffiffiffiffiffiffiffiffiffiffiffiffiffiffiffiffiffiffiffiffiffiffiffiffiffiffiffiffiffiffiffiffiffiffis2P98
m2l þ s2
lm2P98
þ s2P98
s2l
qð2Þ
Provided that sP98 � 160 mm (Pauling et al. 2006), σl=0.11, mP98=1,088 mm and μl=
0.98, the expected uncertainty is equal to 197 MJ mm ha−1 h−1year−1, which is almostwithin 20% of the average observed annual rainfall erosivity. The uncertainty associatedwith the rainfall data is the main source of uncertainty, being equal tosP98ml=157 MJ mm ha−1 h−1year−1, almost 80% of the total uncertainty.
Analogously to Pauling et al. (2006), we assumed that the relationship between P98 andthe R-factor remains stationary during the study period. This hypothesis of stationarity isequivalent to assume that the regression model of Eq. 1 is able to capture the variability ofthe rainfall erosivity in the past, with the same level of uncertainty attached to the modelparameters and structure, as evaluated for the calibration period. This hypothesis is
010
0020
0030
00
0 1000 2000 3000
RUSLE based-Erosivity
Pre
dict
ed E
rosi
vity
a) b)
c)
Fig. 1 Comparison between RUSLE-based andMedREHM predicted annual erosivity (MJ mm ha−1 h−1year−1).a Scatterplot. b Histogram of the residuals. c Quantile-quantile (QQ)-plot
594 Climatic Change (2011) 108:591–599
acceptable, provided that the regression model itself is not the main source of uncertainty ascompared to the input rainfall data.
2.3 Exceedance probability maps of rainfall erosivity
We used a non-parametric type of ordinary kriging, called indicator kriging, for computingmaps of the probability of the annual rainfall erosivity being larger than a threshold value(e.g. Solow 1986). Compared to parametric approaches, indicator kriging has the advantageof being less affected by outliers. By means of the indicator kriging, we do not analyzedirectly the estimated values of RMedREHM, rather we evaluate an indicator functionrepresenting the exceedance of RMedREHM over a threshold value Rk in a generic location so:
I so;Rkð Þ ¼ 1 ! RMedREHM soð Þ > Rk
0 ! RMedREHM soð Þ � Rk:
(ð3Þ
The ordinary indicator kriging (OIK) estimator provides the least squares estimate of theindicator I(so; Rk), which corresponds also to the least squares estimate of its conditionalexpectation F, given the information provided in a sample set (n) in the neighborhood of thegeneric location so:
F so;Rk ðnÞjð Þ ¼ E I so;Rkð Þ j ðnÞf g ð4ÞWe employed this geostatistical method for evaluating space-time patterns of exceedance
probability of rainfall erosivity over the study region. Spatial correlations have beengeneralized in a correlation function of distance between any two points, i.e. the semi-variogram, which summarizes the main spatial continuity patterns of the chosen indicatorfunction. The methodology has been applied in two stages. In the first one, maps of rainfallerosivity have been computed with Eq. 1 applied to selected climatic periods andcorresponding indicator semi-variograms have been derived. In the second stage, theindicator kriging has been used to evaluate the spatial pattern of exceedance probability ofrainfall erosivity.
3 Results
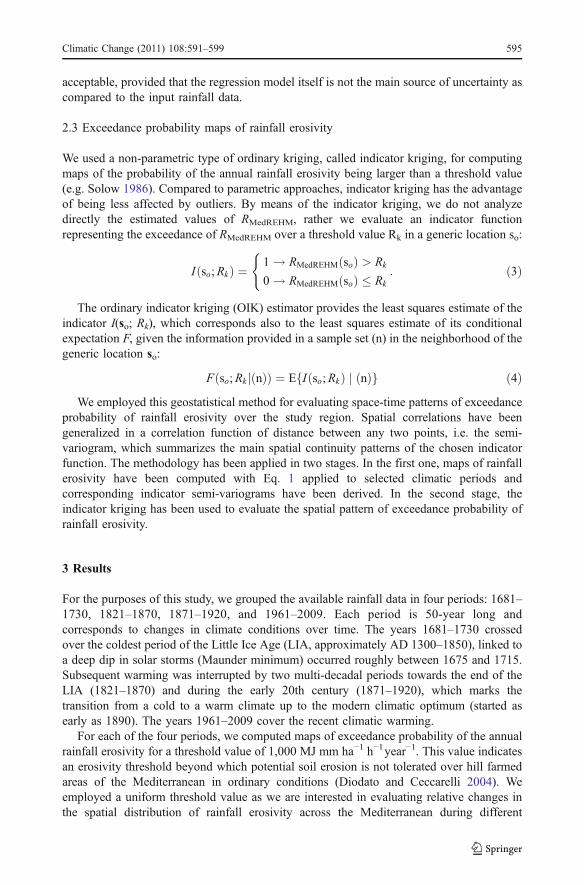
For the purposes of this study, we grouped the available rainfall data in four periods: 1681–1730, 1821–1870, 1871–1920, and 1961–2009. Each period is 50-year long andcorresponds to changes in climate conditions over time. The years 1681–1730 crossedover the coldest period of the Little Ice Age (LIA, approximately AD 1300–1850), linked toa deep dip in solar storms (Maunder minimum) occurred roughly between 1675 and 1715.Subsequent warming was interrupted by two multi-decadal periods towards the end of theLIA (1821–1870) and during the early 20th century (1871–1920), which marks thetransition from a cold to a warm climate up to the modern climatic optimum (started asearly as 1890). The years 1961–2009 cover the recent climatic warming.
For each of the four periods, we computed maps of exceedance probability of the annualrainfall erosivity for a threshold value of 1,000 MJ mm ha−1 h−1year−1. This value indicatesan erosivity threshold beyond which potential soil erosion is not tolerated over hill farmedareas of the Mediterranean in ordinary conditions (Diodato and Ceccarelli 2004). Weemployed a uniform threshold value as we are interested in evaluating relative changes inthe spatial distribution of rainfall erosivity across the Mediterranean during different
Climatic Change (2011) 108:591–599 595

climatic periods. If one is interested in evaluating actual changes in erosion risks, differentthreshold values should be considered according to the specific degree of exposure of eachportion of the study area to the rainfall aggressiveness during the different periods, as theexposure is related to the local soil properties and vegetation cover.
Figure 2 shows the kriged-probability map for each of these periods. The color scalefrom yellow to purple indicates an increasing probability that the critical value is exceeded.These maps are obviously affected by the uncertainty in the prediction model expressed byEq. 1 and in the reconstructed rainfall fields. As illustrated above, the uncertainty in thereconstructed rainfall fields is spatially and temporally variable, with decreasing valuesfrom earlier to more recent periods.
The most severe erosive phenomena occurred over Portugal, France, Balkans, westernGermany and Central Italy since the cold period 1680–1730 of the LIA (Fig. 2a). Signals ofsignificant variation are not apparent for the successive interval 1821–1870 (Fig. 2b). Theerosivity pattern depicted for these two periods corresponds to dominating Atlantic cyclonicfronts, reinforced by processes occurring in the Mediterranean basin and confined todefined regions and in proximity of the coasts (Lionello et al. 2006). After the end of theLIA, between 1871 and 1920, the erosive forcing expanded over a broad region of Spain,Northern Africa (north Morocco and Algeria) and Southern Italy.
During the most recent phase of warming (1961–2009), new processes kicked off furthererosive power eastwards and southwards around the Mediterranean coastal lands. Thissuggests the pulsing of extreme precipitations, although it may also have occurred overregions characterized by decreases in the annual precipitation (De Luis et al. 2010). Toclarify this issue, a comparative analysis of specific thermal convective phenomena withhigh-temporal resolution (generally occurring over May-October in the Mediterranean)would be useful. These details are generally not possible to ascertain due to lack of dataprior the 1970s. However, there are indications that small-scale processes mainly affected
0 0.2 0.4 0.6 0.8 1
Kriged-probability (R>1000 MJ mm ha-1 h-1 y -1)
0 800400 Kilometers
30°0'0"E
30°0'0"E
20°0'0"E
20°0'0"E
10°0'0"E
10°0'0"E
0°0'0"
0°0'0"
50°0
'0"N
43°0
'0"N
36°0
'0"N
1681-1730
0 800400 Kilometers
30°0'0"E
30°0'0"E
20°0'0"E
20°0'0"E
10°0'0"E
10°0'0"E
0°0'0"
0°0'0"
50°0
'0"N
43°0
'0"N
36°0
'0"N
1821-1870
0 800400 Kilometers
30°0'0"E
30°0'0"E
20°0'0"E
20°0'0"E
10°0'0"E
10°0'0"E
0°0'0"
0°0'0"
50°0
'0"N
43°0
'0"N
36°0
'0"N
1871-1920
0 800400 Kilometers
30°0'0"E
30°0'0"E
20°0'0"E
20°0'0"E
10°0'0"E
10°0'0"E
0°0'0"
0°0'0"
50°0
'0"N
43°0
'0"N
36°0
'0"N
1961-2009
a) b)
c) d)
Fig. 2 Spatial patterns of kriged-probability maps exceeding the erosivity threshold-value of1,000 MJ mm ha−1 h−1year−1 over Mediterranean area. a 1681–1730. b 1821–1870. c 1871–1920. d1961–2009
596 Climatic Change (2011) 108:591–599

rainfall variability over the last few centuries. For 1760–2000, Touchan et al. (2005) foundan insignificant and non-stationary correlation between major European-scale circulationpatterns and eastern Mediterranean spring/summer precipitations.
Though the LIA has been identified as the rainiest period at annual scale for theMediterranean central area, rainfall fluctuations have recently occurred in the Mediterra-nean, thus suggesting that important changes in extremes may occur at shorter than yearlyintervals (Diodato and Bellocchi 2010a, b). In general, it is difficult to detect signals ofclimate change in the seasonal modulation of convection associated with the extreme rainevents, due to large spatial variability. We addressed this issue by arranging convective-rainfluxes (CRFs) from MERRA/NASA–satellite platform (via Giovanni web-based applica-tion, URL: http://disc.sci.gsfc.nasa.gov/giovanni), mapped in Fig. 3a for 1979–2008. Forthe extreme values scheme, we observed a temporal evolution of the CRFs based on the95th percentile of monthly data with an intensifying trend during the recent warming phase(Fig. 3b).
Both the above erosivity maps (Fig. 2) and trends in extreme rainfall (Fig. 3) suggest anenhanced hazard associated with complex and more localized rainfall events overMediterranean in the last decades, where a strong convective component is coming upespecially in autumn season (Fig. 4).
In fact, rapidly developing mesoscale convective systems are typically responsiblefor the heaviest and most destructive rainfall and flood events in the Mediterraneanregion, provided that small catchments are recognized to be the most vulnerablesystems to storm-driven flash floods (Ruin et al. 2008). This agrees with experimentalresults obtained at sub-regional scale in Southern Italy (Diodato et al. 2009) and JordanRiver (Samuels et al. 2009). These studies show how an increase in extreme rainfallevents drives to changes in surface flow and to an increased risk of soil erosion andflooding at small catchment scales.
4 Conclusions
It is important to note that, similarly to other climatic studies, the outcomes of this study areaffected by the uncertainty in the historical reconstructed data employed. This uncertaintyincreases from the 20th to the 17th century and it is also highly variable in space withineach examined period, being directly linked to the quality of the reconstructed rainfall
30°0'0"E
30°0'0"E
20°0'0"E
20°0'0"E
10°0'0"E
10°0'0"E
0°0'0"
0°0'0"
50°0
'0"N
43°0
'0"N
36°0
'0"N
a)
0.005 0.43 0.72 1.10
m m m -2 s-1
4.0
4.5
5.0
5.5
19 80 1990 20 00 2010Year
CR
F9
5th
pe
rc
x 10-6 (m m m -2 s-1)b)
Fig. 3 Convective rainfall fluxes (CRFs). a Monthly spatial pattern of CRFs averaged over 1979–2008.b CRF time-series: 95th percentile of the 21-month moving average and spline curve (arranged fromGiovanni-MERRA online data system, developed and maintained by NASA\GES\DISC)
Climatic Change (2011) 108:591–599 597

fields. In the previous sections we provide an assessment of the expected spatially averageduncertainty at annual scale, while we do not have enough data to provide a quantitativeassessment of the spatial variability of the uncertainty within each examined period.
This study shows that climate changes caused periods of increased exposure to erosiverainfalls for almost all countries of the Mediterranean basin. With this climatic trend, anincreasing frequency of extreme rainfalls over shorter time intervals, accompanied by longdry periods, may represent a potentially dangerous combination for soil erosion. The resultsherein presented also show that the rainfall pattern is becoming less homogenous over theMediterranean.
Further studies should be devoted to analyze scaling properties of rainfall extremes, andrelated erosive forcing to better integrate climate research and land-management planning,also accounting for different rainfall generating mechanisms and improve the characteriza-tion and communication of uncertainty at all stages of analysis (Matti et al. 2009).
Acknowledgements The main idea and most analyses were by N.D., G.B. developed the model and G.B.C.performed the uncertainty analysis and edited the manuscript. We thank Danilo Russo, Lecturer at the Schoolof Biological Sciences, University of Bristol (United Kingdom), for his numerous valuable advices and hiscareful reading of the manuscript.
References
Baker MB, Peter T (2008) Small-scale cloud processes and climate. Nature 451:299–300Bender MA et al (2009) Modeled impact of anthropogenic warming on the frequency of intense Atlantic
hurricanes. Science 327:454–458Brown LC, Foster GR (1987) Storm erosivity using idealized intensity distributions. Trans ASABE 30:379–
386
Fig. 4 Convective availablepotential energy (CAPE): Spatialpattern of CAPE autumn anoma-lies upon recent decades (1991–2008 minus 1931–1990) at levelof 500 hPa across Old Word(Mediterranean area is boundedby dashed line). The colour bandsfrom yellow to red are positivetrend, while bands from green topurple. Note that the positiveanomalies upon western andcentral Mediterranean are com-parable with those of northernAfrica (arranged from 20thCentury Reanalysis Dataset onlinedata system, developed and main-tained by NASA\GES\DISC,URL:http://gdata1.sci.gsfc.nasa.gov/daac-bin/G3/gui.cgi?instance_id=MERRA_MONTH_2D)
598 Climatic Change (2011) 108:591–599

Chirico GB, Medina H, Romano N (2010) Functional evaluation of PTF prediction uncertainty: anapplication at hillslope scale. Geoderma 155:193–202
De Luis M, González-Hidalgo JC, Longares LA (2010) Is rainfall erosivity increasing in the MediterraneanIberian Peninsula? Land Degrad Dev 21:139–144
Diodato N, Bellocchi G (2010a) MedREM, a rainfall erosivity model for the Mediterranean region. J Hydrol387:119–127
Diodato N, Bellocchi G (2010b) Storminess and environmental changes in the Mediterranean central area.Earth Interact 14:1–16
Diodato N, Fagnano M, Alberico I (2009) CliFEM—Climate forcing and erosion modelling at long-termSele river research basin (Southern Italy). Nat Hazards Earth Syst 9:1693–1702
Diodato N, Ceccarelli M (2004) Multivariate indicator kriging approach using a GIS to classify soildegradation for Mediterranean agricultural lands. Ecol Indic 4:177–187
Heuvelink GBM, Burrough PA, Stein A (1989) Propagation of errors is spatial modelling with GIS. Int JGeogr Inform Syst 3:303–322
Hilton RG et al (2008) Tropical-cyclone-driven erosion of the terrestrial biosphere from mountains. NatGeosci 1:759–762
Lionello P et al (2006) Mediterranean climate variability. Elsevier, Amsterdam, pp 325–372Matti C, Pauling A, Küttel M, Wanner H (2009) Winter precipitation trends for two selected European
regions over the last 500 years and their possible dynamical background. Theor Appl Climatol 95:9–26Nash JE, Sutcliffe JV (1970) River flow forecasting through conceptual models part I—A discussion of
principles. J Hydrol 10:282–290O’Gorman PA, Schneider T (2009) The physical basis for increases in precipitation extremes in simulations
of 21st-century climate change. Proc Natl Acad Sci USA 106:14773–14777Pauling A, Luterbacher J, Casty C, Wanner H (2006) Five hundred years of gridded high-resolution
precipitation reconstructions over Europe and the connection to large-scale circulation. Clim Dynam26:387–405
Ruin I, Creutin JD, Anquetin S, Lutoff C (2008) Human exposure to flash-floods—Relation between floodparameter and human vulnerability during a storm of September 2002 in Southern France. J Hydrol361:199–213
Samuels R, Rimmer A, Alpert P (2009) Effect of extreme rainfall events on the water resources of the JordanRiver. J Hydrol 375:513–523
Solow AR (1986) Mapping by simple indicator kriging. Math Geol 18:335–352Touchan R et al (2005) Reconstructions of spring/summer precipitation for the Eastern Mediterranean from
tree-ring widths and its connection to large-scale atmospheric circulation. Clim Dyn 25:75–98Van Oost K et al (2007) The impact of agricultural soil erosion on the global carbon cycle. Science 318:626–
629Wie W, Chen L, Fu B (2009) Effects of rainfall change on water erosion processes in terrestrial ecosystems: a
review. Progr Phys Geogr 33:307–318
Climatic Change (2011) 108:591–599 599