Embed Size (px)
Citation preview
How to Define Design Space
Lynn Torbeck
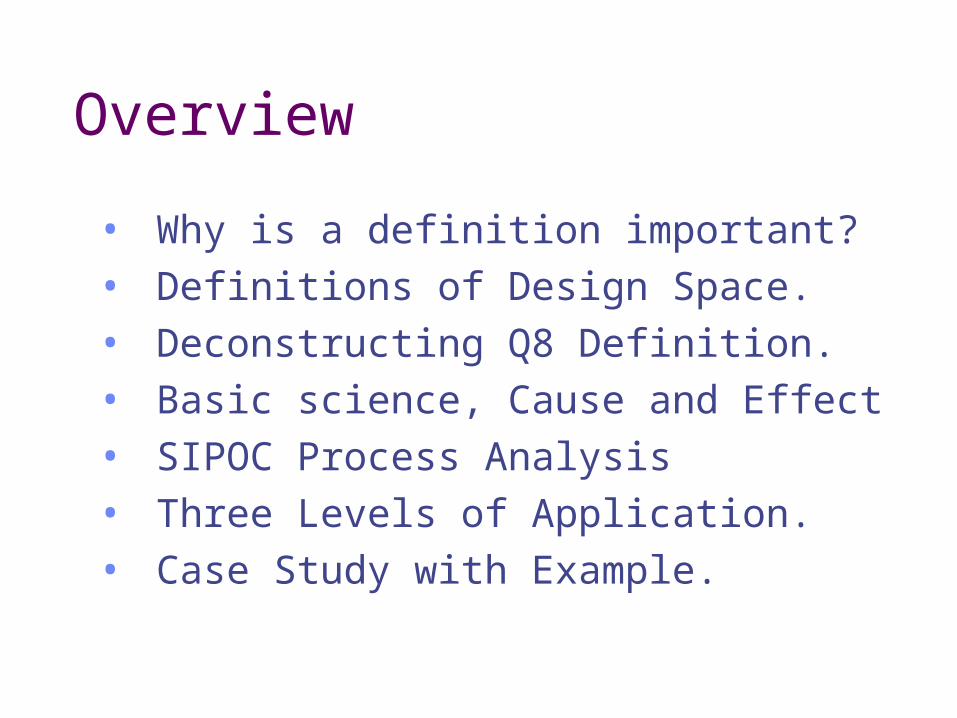
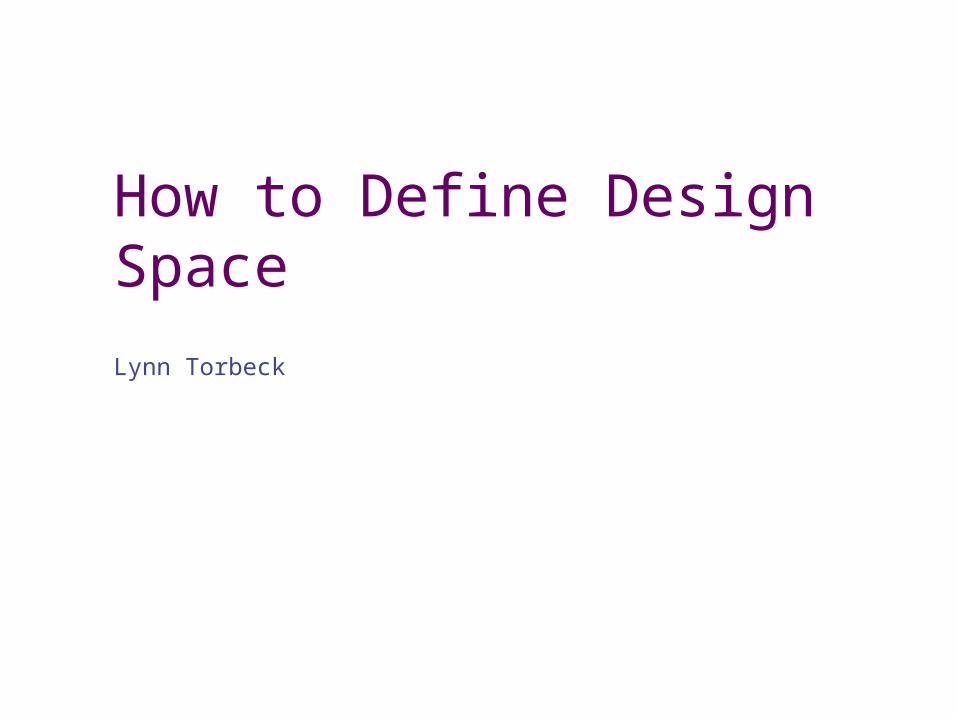
Overview
• Why is a definition important?• Definitions of Design Space.• Deconstructing Q8 Definition.• Basic science, Cause and Effect• SIPOC Process Analysis• Three Levels of Application.• Case Study with Example.
Why is this Important?
ICH Q8 is in its final version.Design Space is defined in Q8.Many presenters are using the term.All are repeating the same definition.Many presenters don’t understand the statistical implications of the issue.Need for a detailed ‘Operational Definition’
Regulatory Impact“Design space is proposed by the applicant and is subject to regulatory assessment and approval.”“Working within the design space is not considered a change.”“Movement out of the design space is considered to be a change and would normally initiate a regulatory post approval change process.”This is a big deal, it needs to be done correctly !The economic impact of this can be huge.
Potential Benefits
Real process understanding and knowledge, not just tables of raw data.Reduced rejects, deviations, discrepancies, lost time, scrap and rework.Fewer 483 citations and warning letters.Fewer investigations and CAPA.Freedom to operate with design space
ICH Q8 Definition
“The multidimensional combination and interaction of input variables and process parameters that have been demonstrated to provide assurance of quality.”This is not universally understood by all parties involved. We need to harmonize several viewpoints, statistical, scientific, engineering and regulatory.
Deconstructing the Definition
Need to deconstruct the definition to get to a day to day working Operational Definition that can be implemented.Need enough detail to write a Standard Operating Procedure or SOP.Need to see an example of what it looks like.
Multidimensional
Also called multivariable or multivariateMore than one variable at a time is considered.The practice of holding the world constant while only considering one-factor-at-a-time has been shown to be grossly inefficient and ineffective.
Interaction
Defined in the PAT guidance“Interactions essentially are the inability of one factor to produce the same effect on the response at different levels of another factor.”Interactions are the joint action of two or more factors working together.
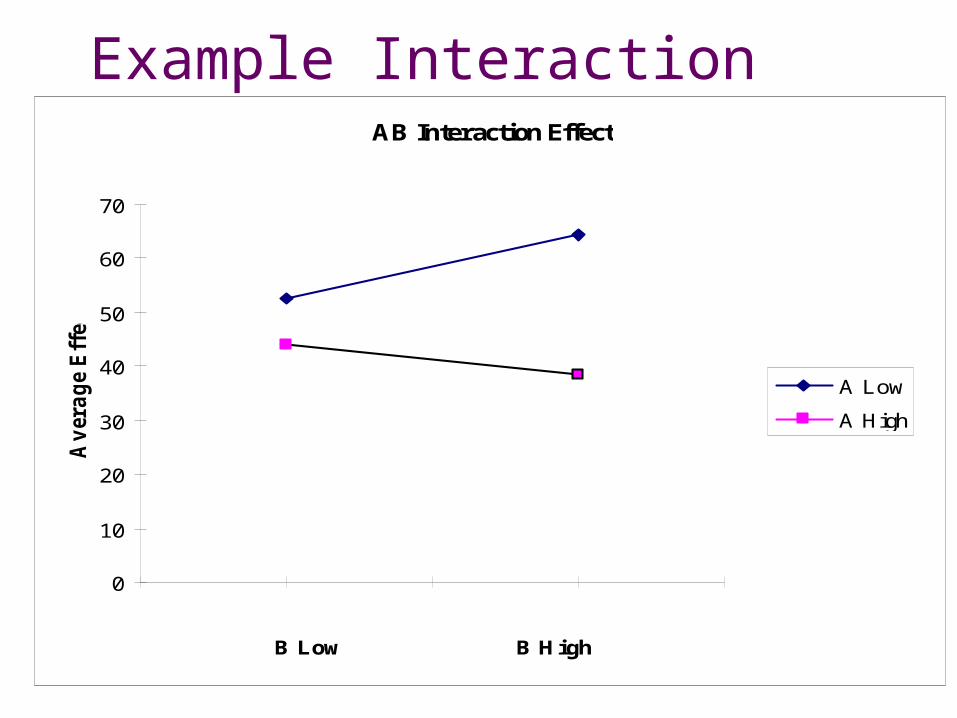
Example InteractionAB Interaction Effect
0
10
20
30
40
50
60
70
0.5 1 1.5 2 2.5
B Low B High
Av
era
ge
Eff
ect
A Low
A High
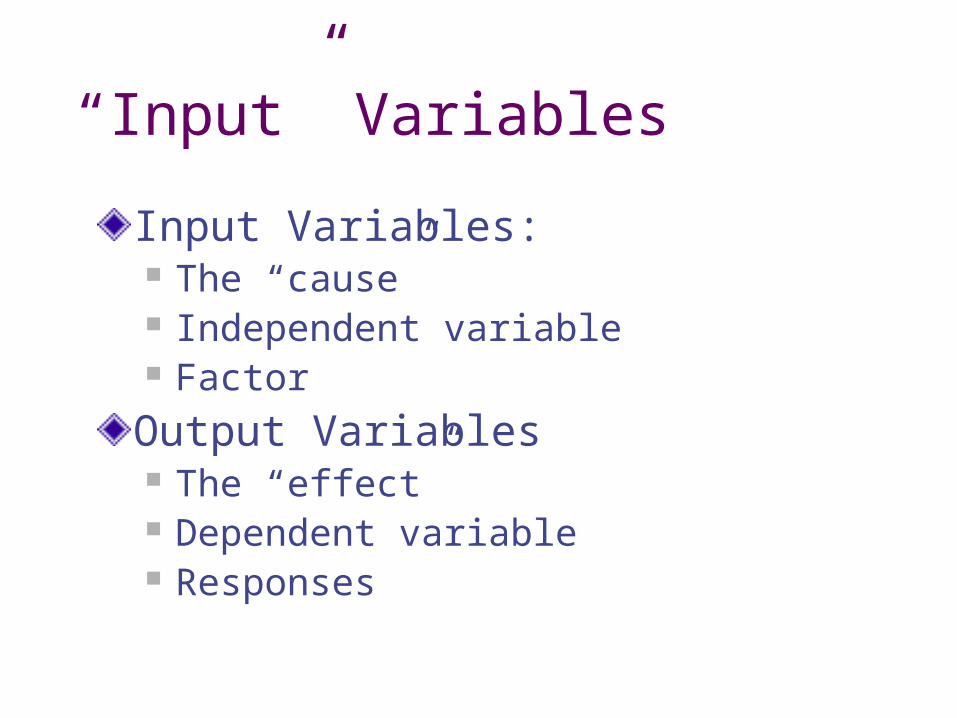
“Input” Variables
Input Variables: The “cause” Independent variable Factor
Output Variables The “effect” Dependent variable Responses
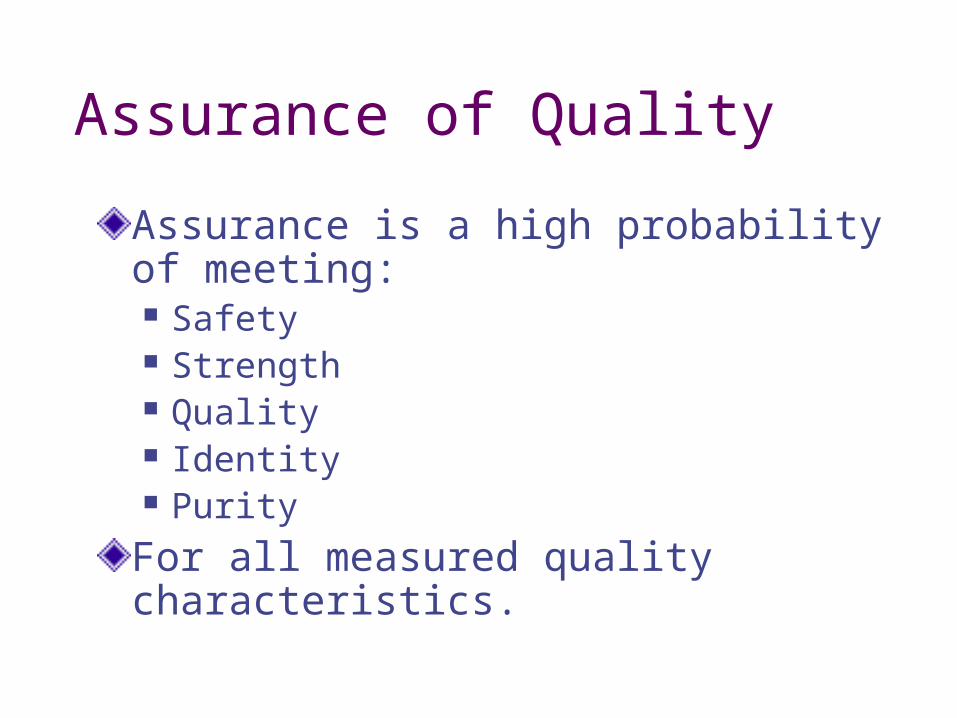
Assurance of Quality
Assurance is a high probability of meeting: Safety Strength Quality Identity Purity
For all measured quality characteristics.
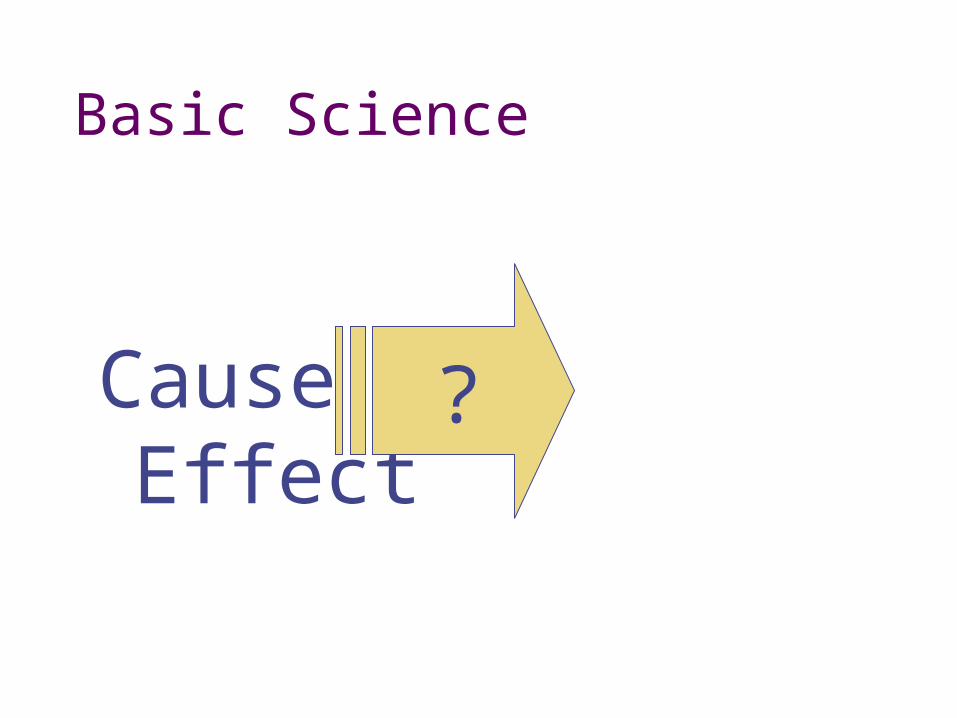
Basic Science
Cause Effect
?
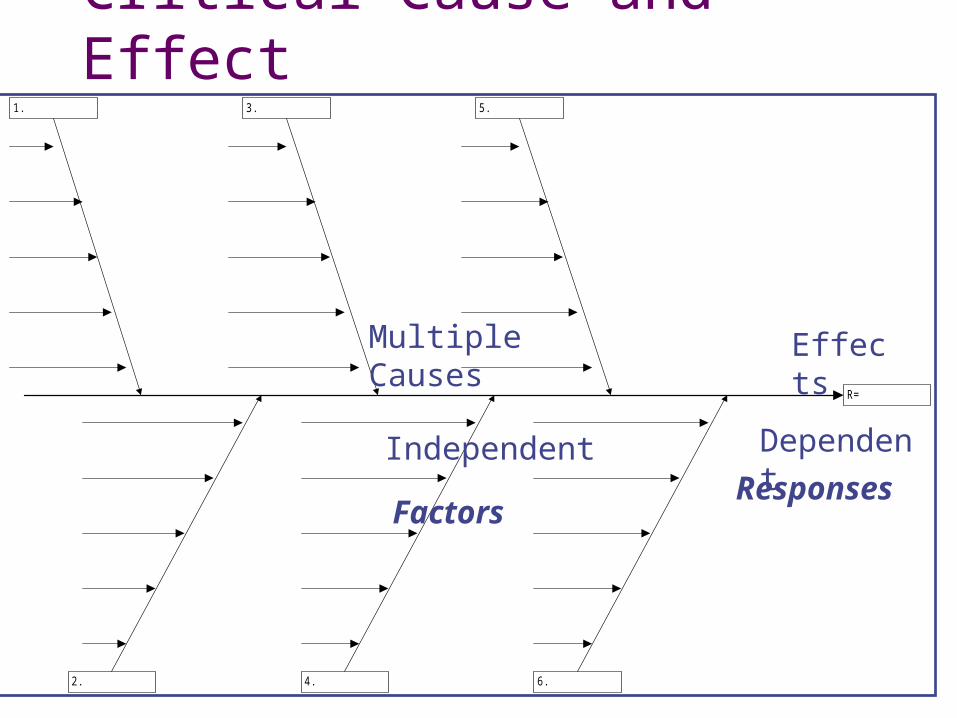
Critical Cause and Effect
R=
1.
2.
3.
4.
5.
6.
Effects
Dependent
Multiple Causes
Independent
FactorsResponses
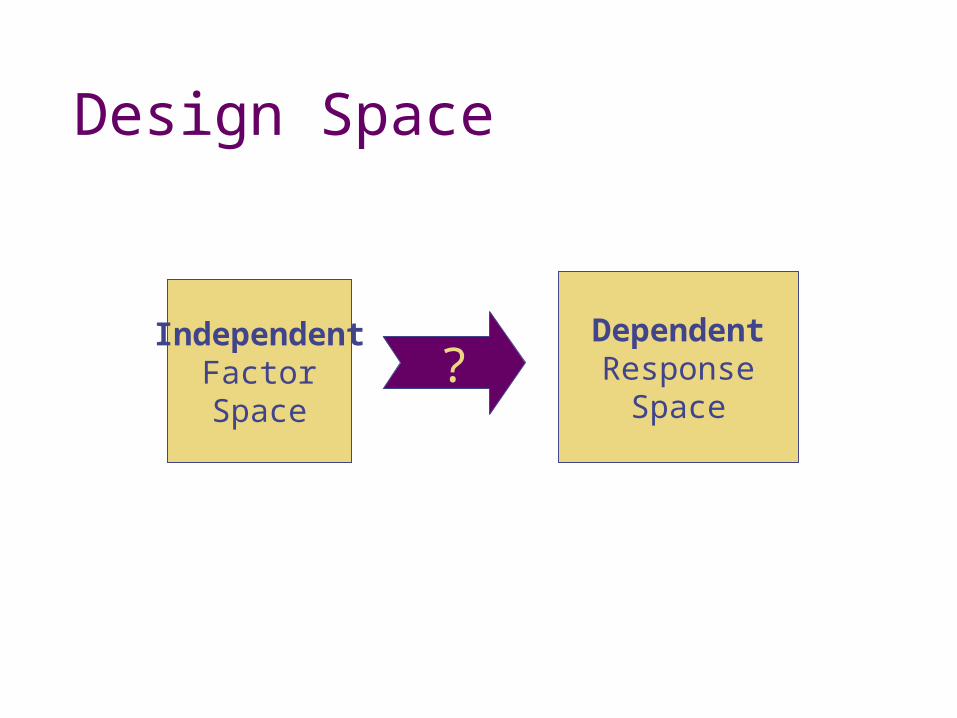
Design Space
IndependentFactorSpace
?DependentResponse
Space
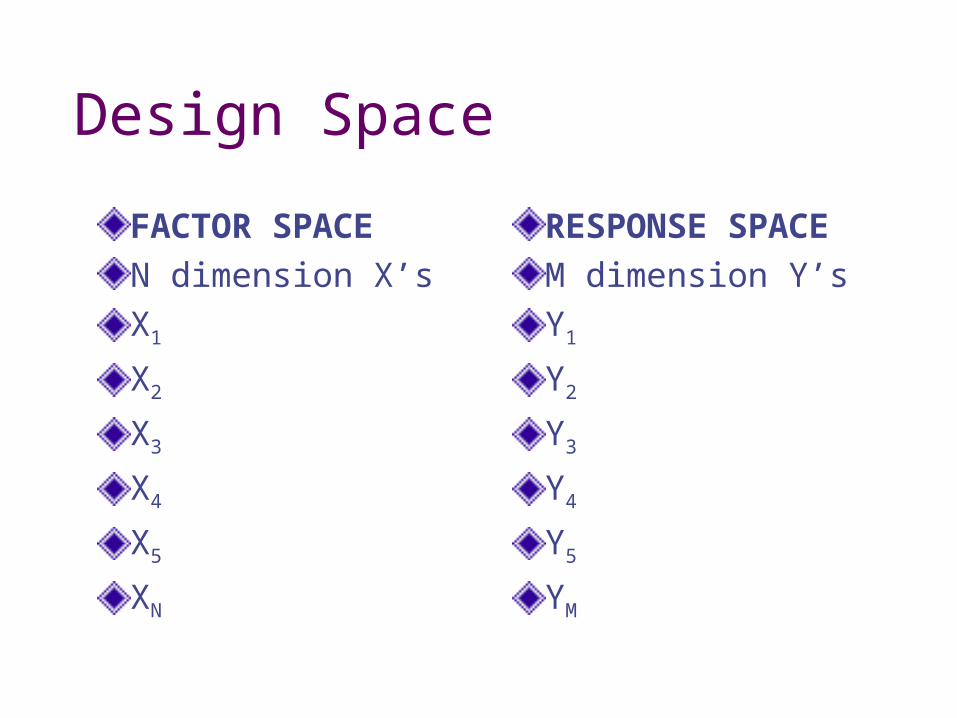
Design Space
FACTOR SPACEN dimension X’sX1
X2
X3
X4
X5
XN
RESPONSE SPACEM dimension Y’sY1
Y2
Y3
Y4
Y5
YM
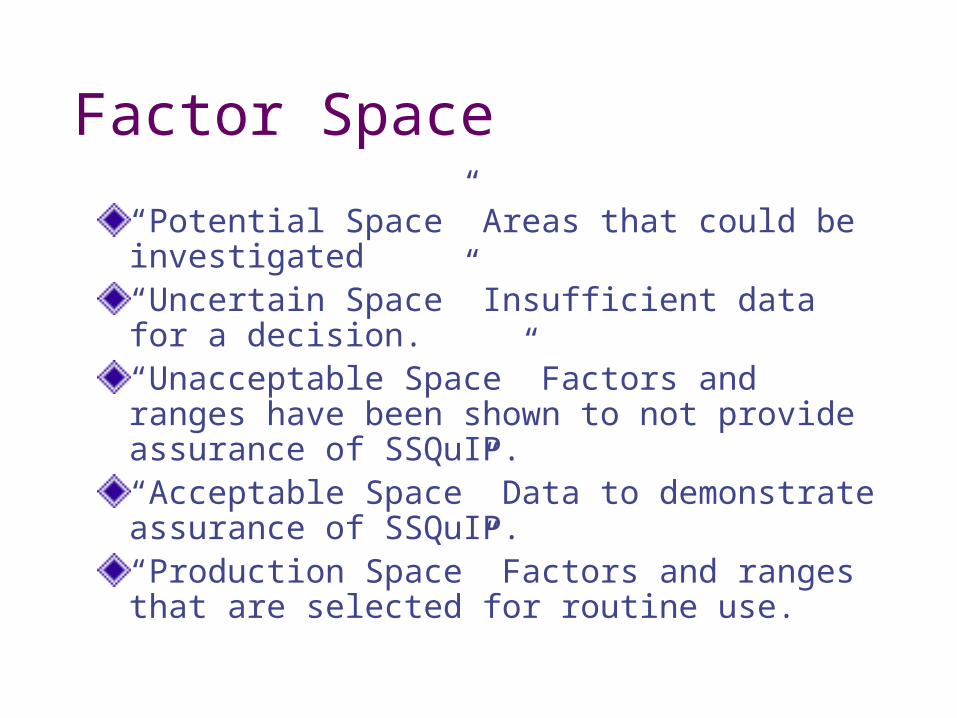
Factor Space
“Potential Space” Areas that could be investigated“Uncertain Space” Insufficient data for a decision.“Unacceptable Space” Factors and ranges have been shown to not provide assurance of SSQuIP.“Acceptable Space” Data to demonstrate assurance of SSQuIP.“Production Space” Factors and ranges that are selected for routine use.
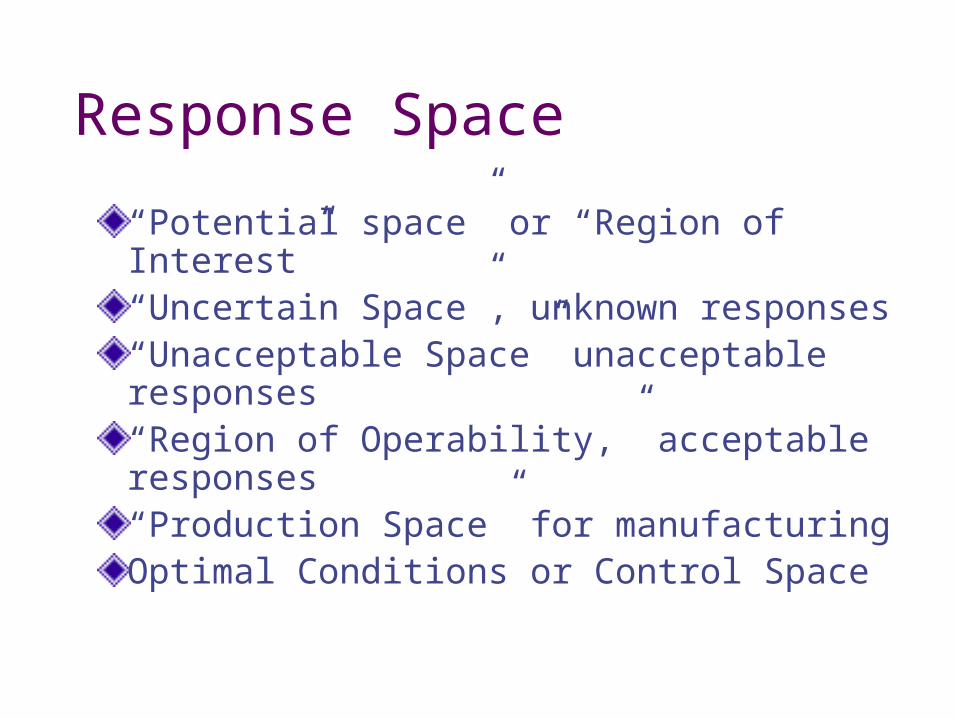
Response Space
“Potential space” or “Region of Interest”“Uncertain Space”, unknown responses“Unacceptable Space” unacceptable responses“Region of Operability,” acceptable responses“Production Space” for manufacturingOptimal Conditions or Control Space
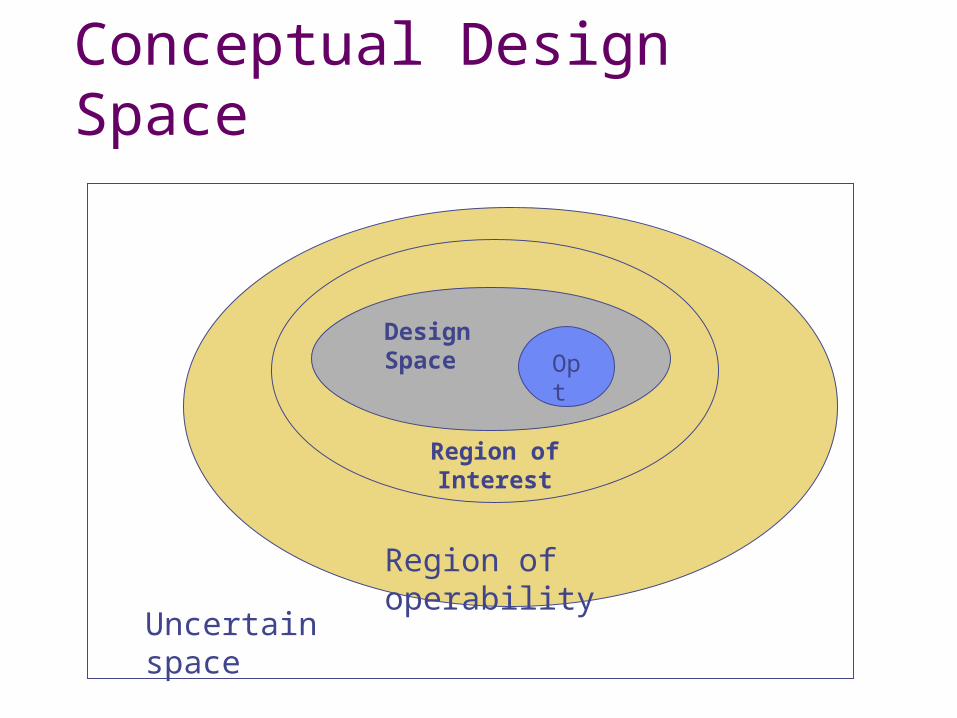
Conceptual Design Space
Uncertain space
Region of operability
Design Space Opt
Region of Interest
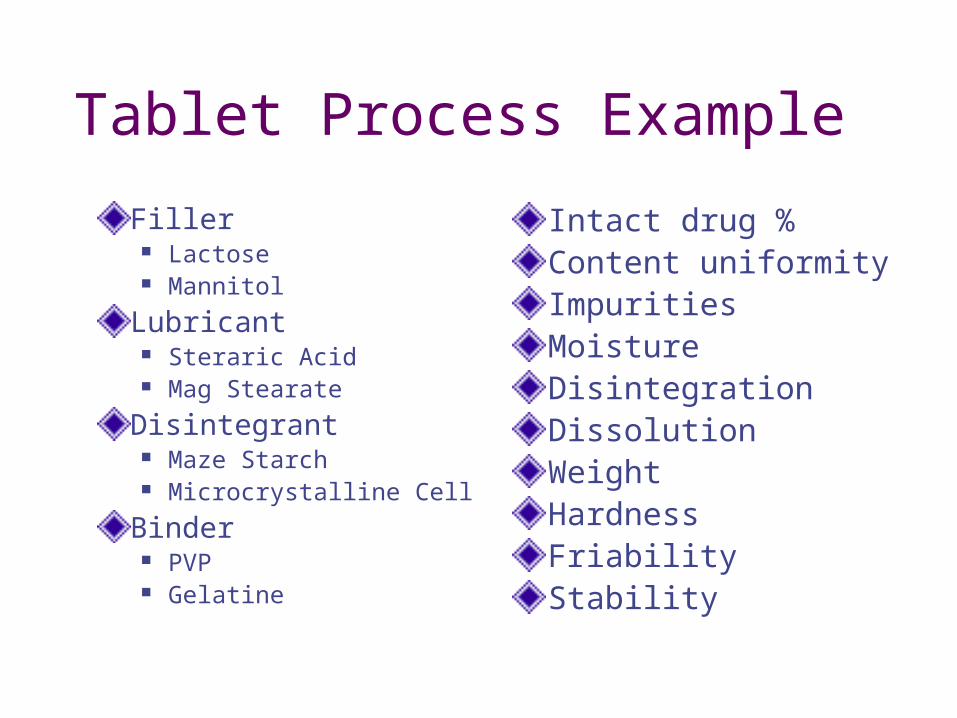
Tablet Process Example
Filler Lactose Mannitol
Lubricant Steraric Acid Mag Stearate
Disintegrant Maze Starch Microcrystalline Cell
Binder PVP Gelatine
Intact drug %Content uniformityImpuritiesMoistureDisintegrationDissolutionWeightHardnessFriabilityStability
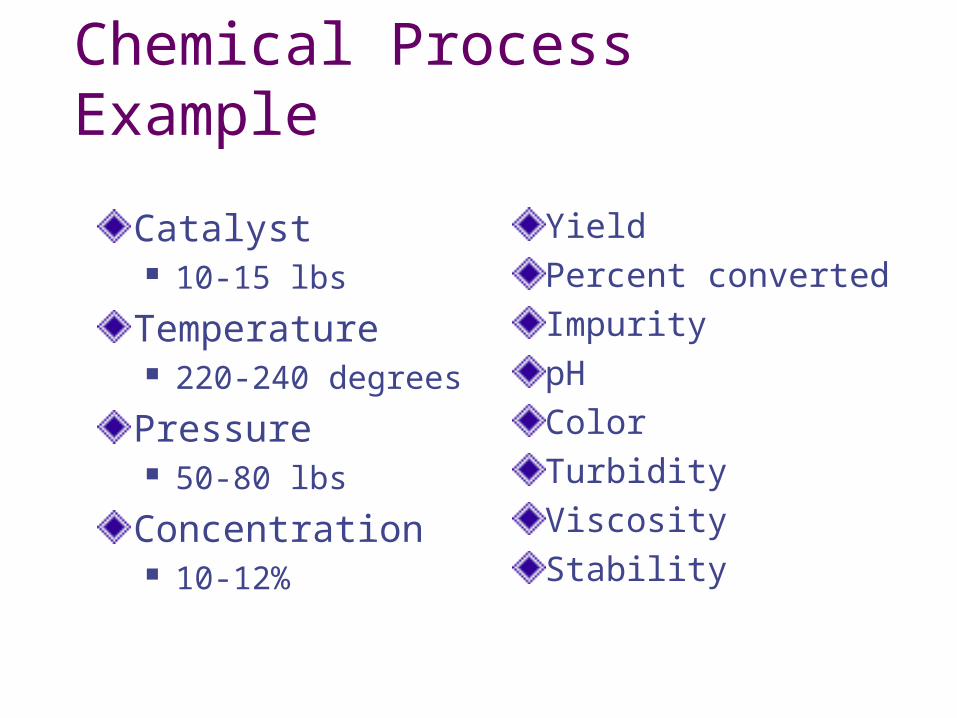
Chemical Process Example
Catalyst 10-15 lbs
Temperature 220-240 degrees
Pressure 50-80 lbs
Concentration 10-12%
YieldPercent convertedImpuritypHColorTurbidityViscosityStability
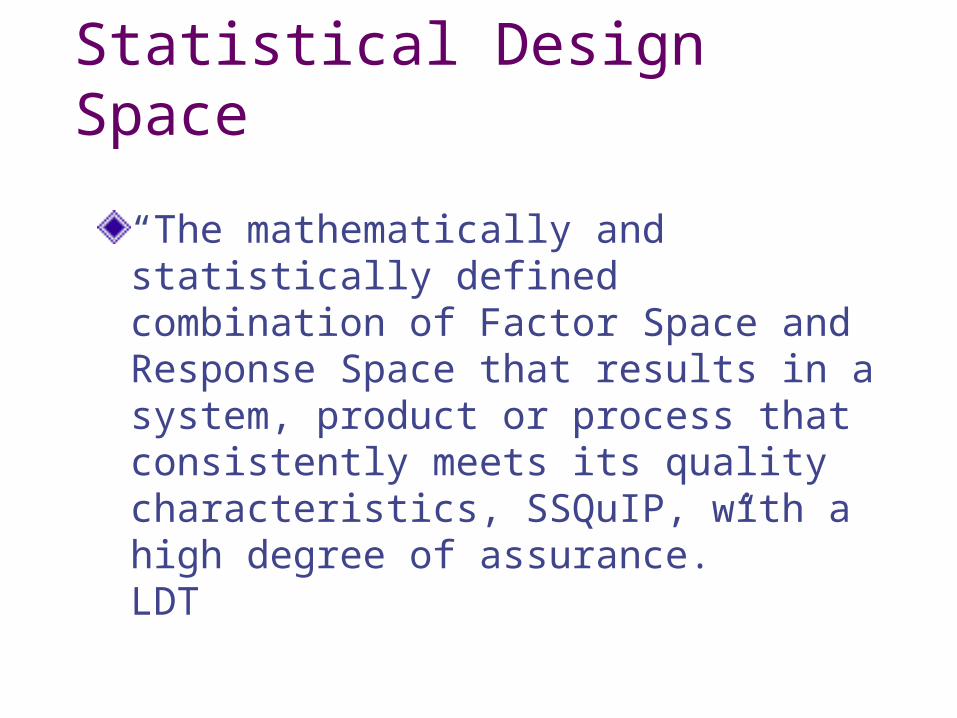
Statistical Design Space
“The mathematically and statistically defined combination of Factor Space and Response Space that results in a system, product or process that consistently meets its quality characteristics, SSQuIP, with a high degree of assurance.” LDT
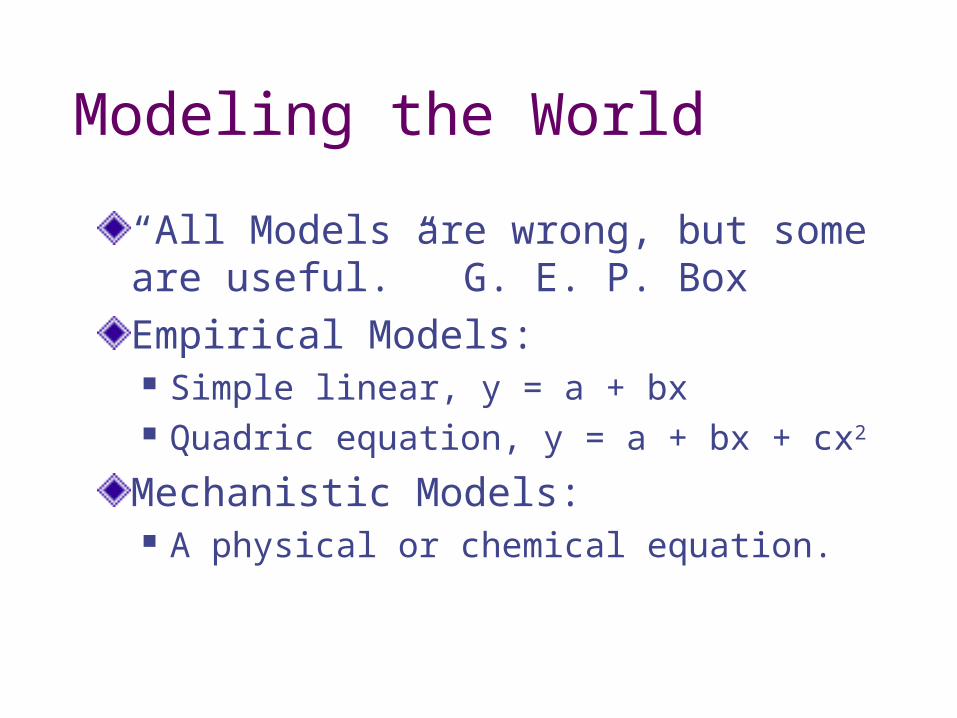
Modeling the World
“All Models are wrong, but some are useful.” G. E. P. BoxEmpirical Models: Simple linear, y = a + bx Quadric equation, y = a + bx + cx2
Mechanistic Models: A physical or chemical equation.
Model Prediction
Equations for critical factors and the mechanistic connection with the critical responses allow for the prediction of the quality characteristics in quantitative terms.Multidimensional in factors and responses.
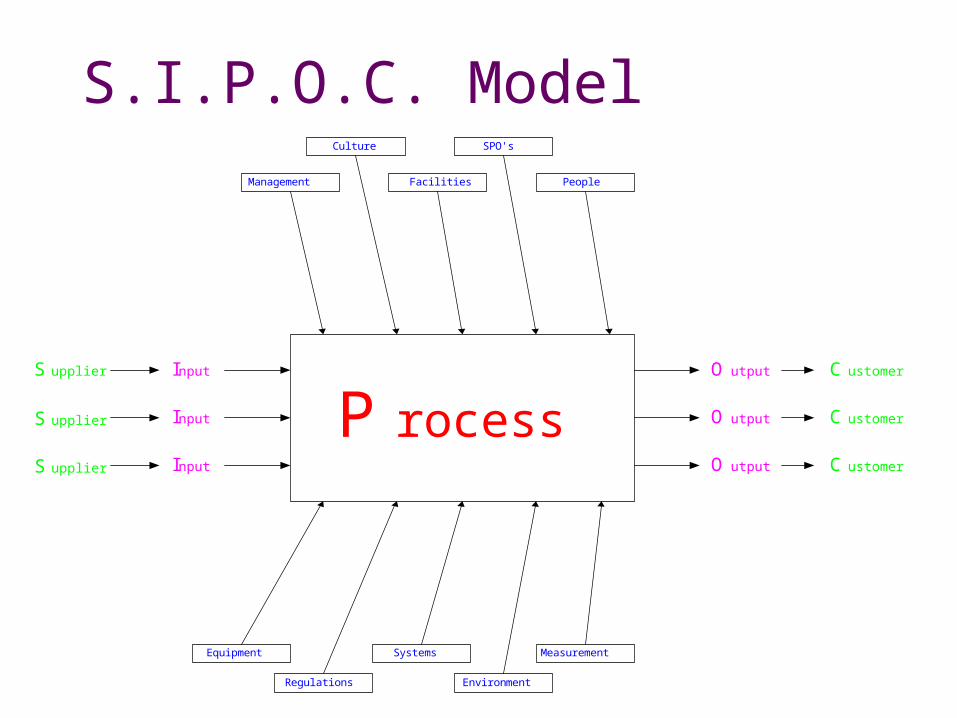
S.I.P.O.C. Model
P rocess
Management Facilities People
Culture SPO's
Input
Input
Input
S upplier
S upplier
S upplier
Equipment Systems
Environment
Measurement
Regulations
O utput
O utput
O utput
C ustomer
C ustomer
C ustomer
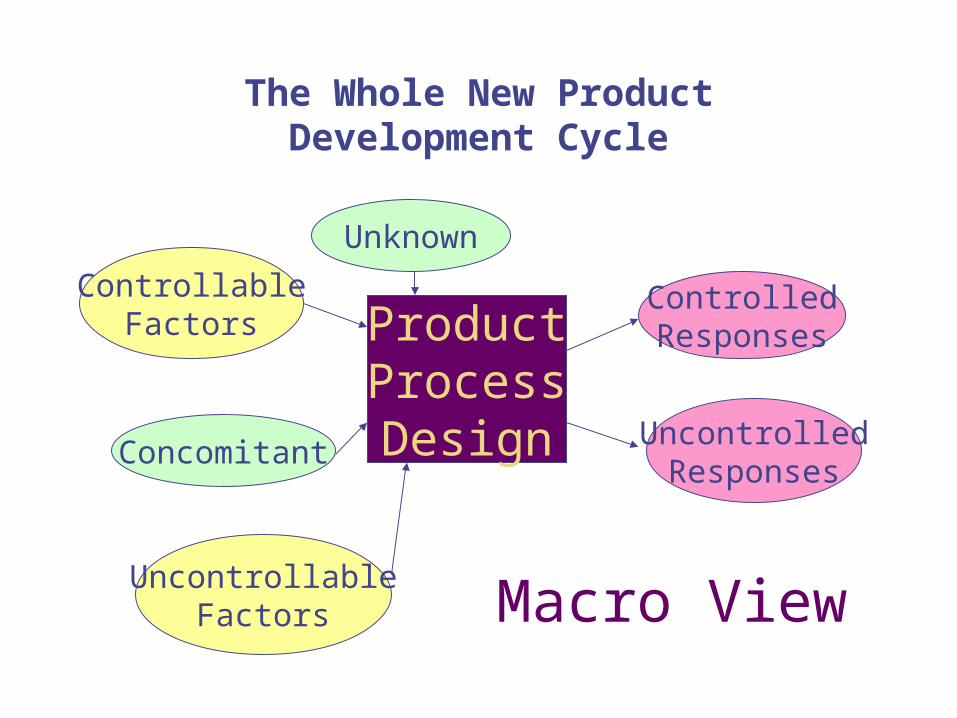
Macro View
ProductProcessDesign
ControllableFactors
Concomitant
UncontrollableFactors
ControlledResponses
UncontrolledResponses
Unknown
The Whole New Product Development Cycle
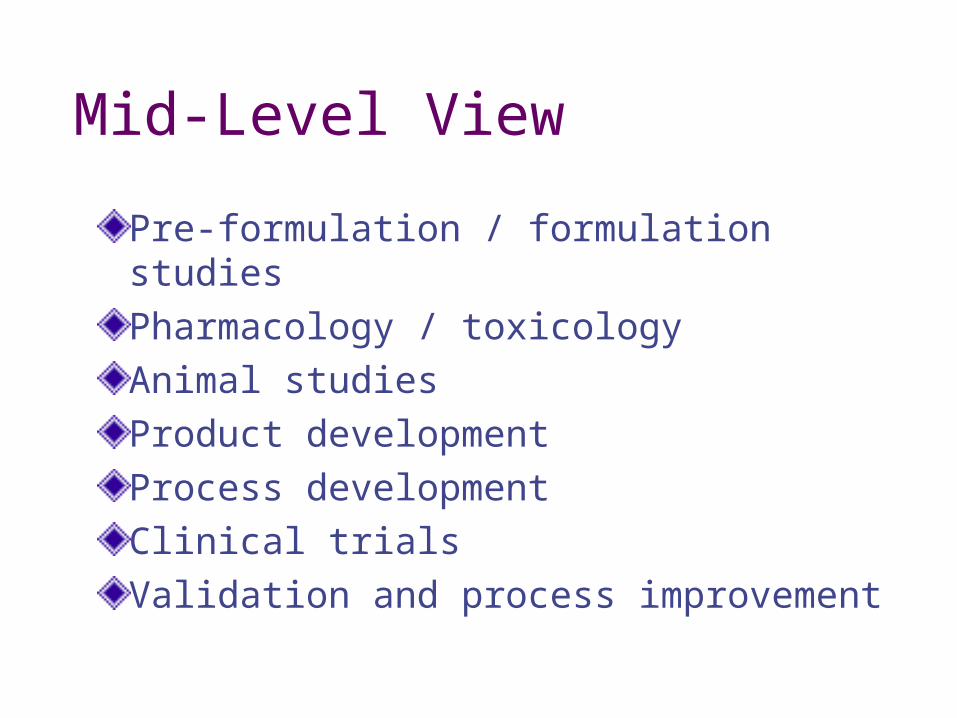
Mid-Level View
Pre-formulation / formulation studiesPharmacology / toxicologyAnimal studiesProduct developmentProcess developmentClinical trialsValidation and process improvement
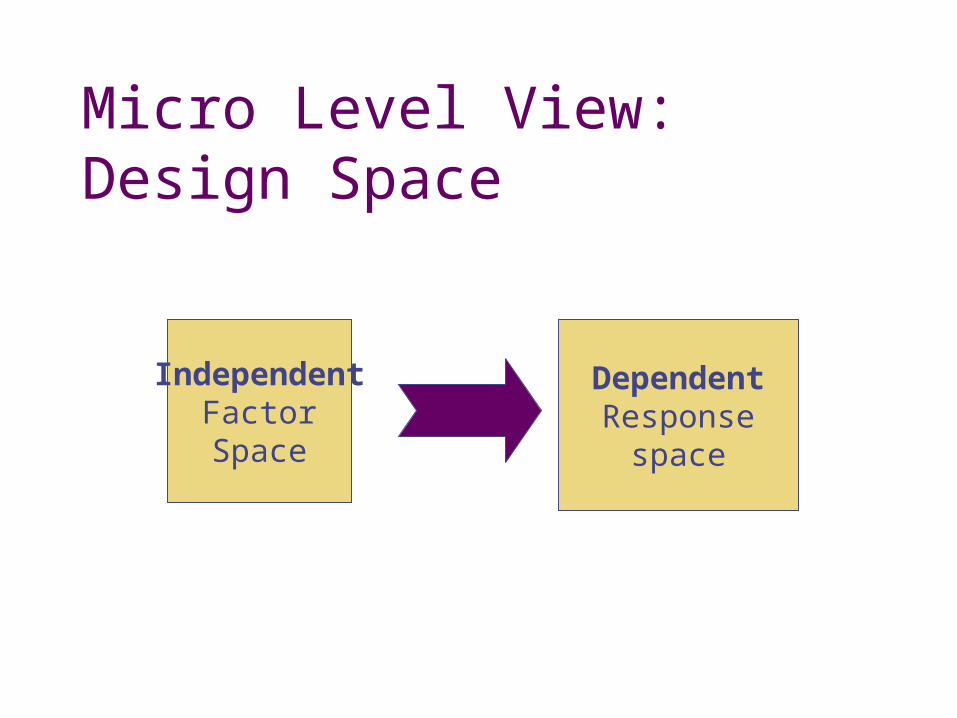
Micro Level View:Design Space
IndependentFactorSpace
DependentResponse
space
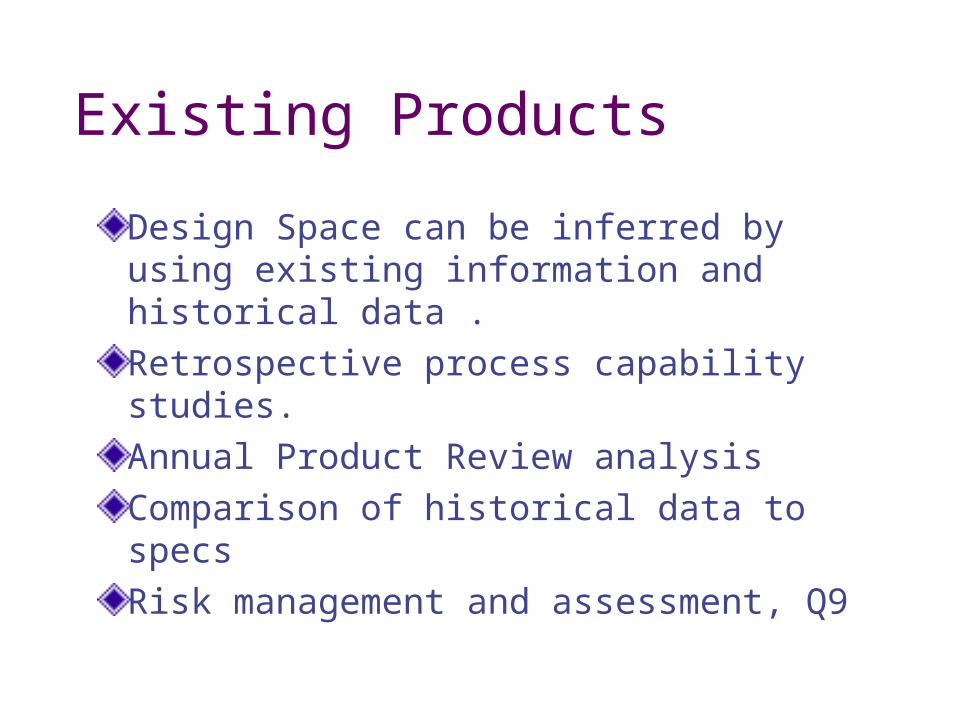
Existing Products
Design Space can be inferred by using existing information and historical data .Retrospective process capability studies.Annual Product Review analysisComparison of historical data to specsRisk management and assessment, Q9
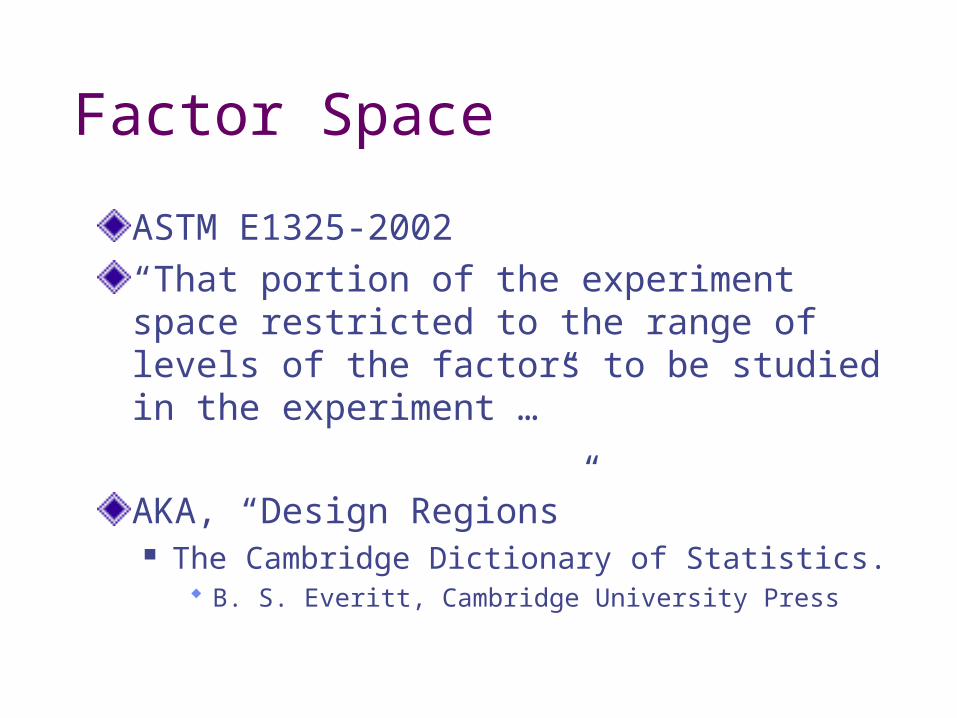
Factor Space
ASTM E1325-2002“That portion of the experiment space restricted to the range of levels of the factors to be studied in the experiment …”
AKA, “Design Regions” The Cambridge Dictionary of Statistics.
B. S. Everitt, Cambridge University Press
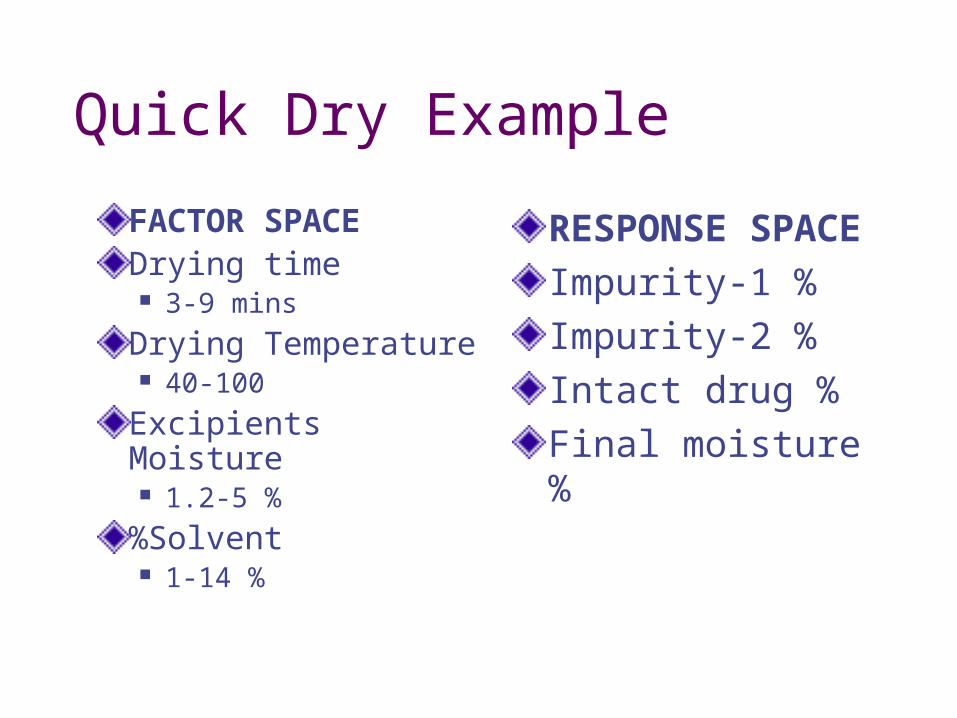
Quick Dry Example
Five batches of product had been lost to an impurity exceeding the criteriaThe criteria for impurity 1 was NMT 1.0%Four factors studied.Four responses.

Quick Dry Example
FACTOR SPACEDrying time 3-9 mins
Drying Temperature 40-100
Excipients Moisture 1.2-5 %
%Solvent 1-14 %
RESPONSE SPACEImpurity-1 %Impurity-2 %Intact drug %Final moisture %
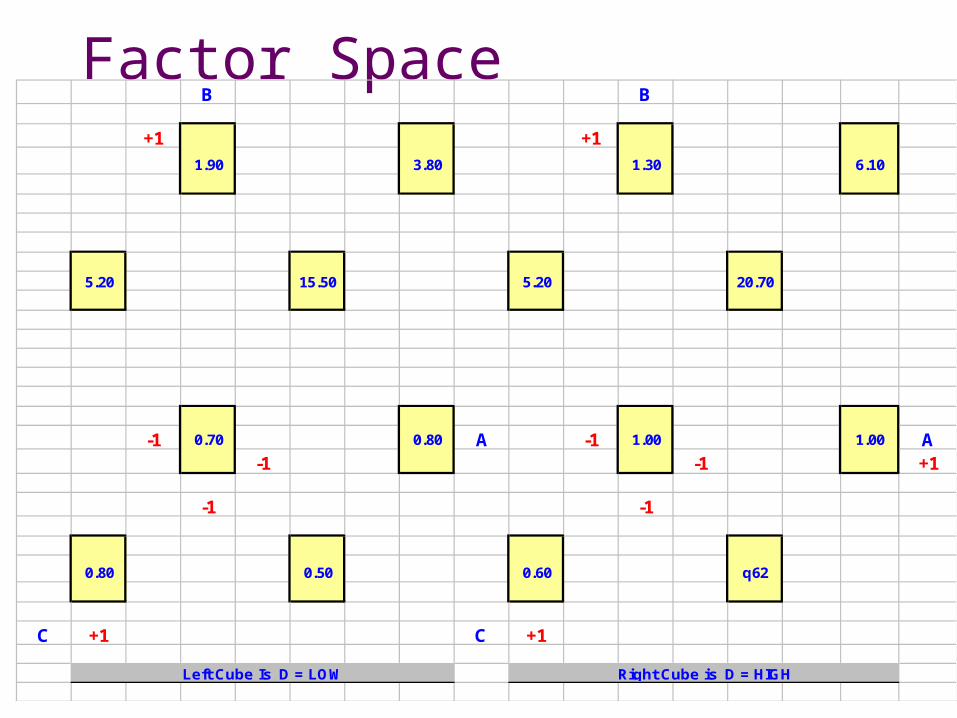
Factor SpaceB B
+1 +1
1.90 3.80 1.30 6.10
5.20 15.50 5.20 20.70
-1 0.70 0.80 A -1 1.00 1.00 A-1 -1 +1
-1 -1
0.80 0.50 0.60 q62
C +1 C +1
Right Cube is D = HIGHLeft Cube Is D = LOW
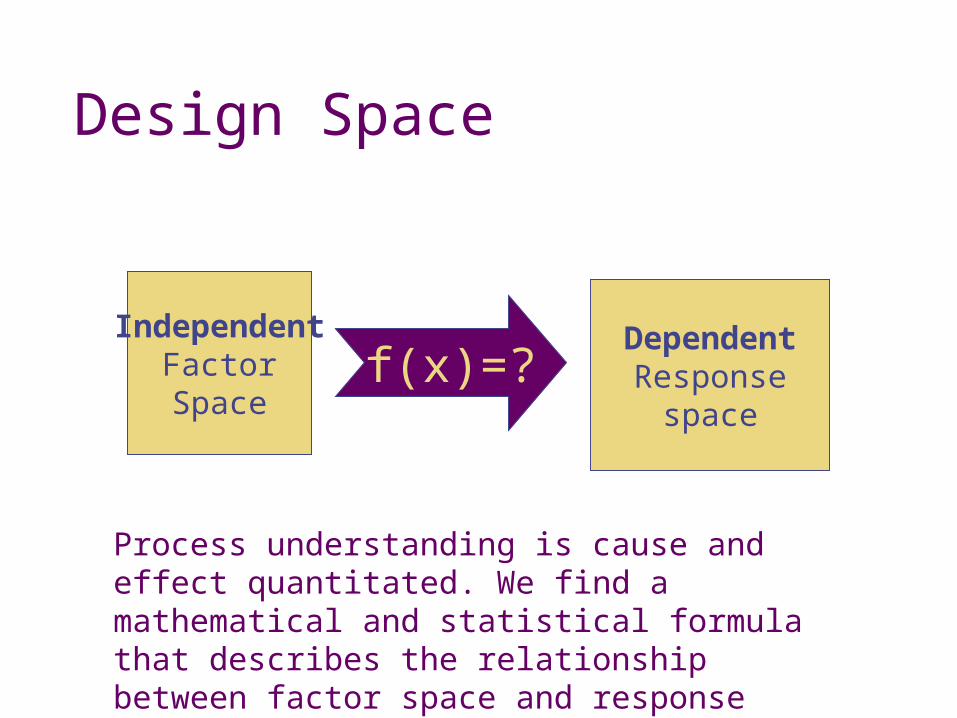
Design Space
IndependentFactorSpace
f(x)=?DependentResponse
space
Process understanding is cause and effect quantitated. We find a mathematical and statistical formula that describes the relationship between factor space and response space.
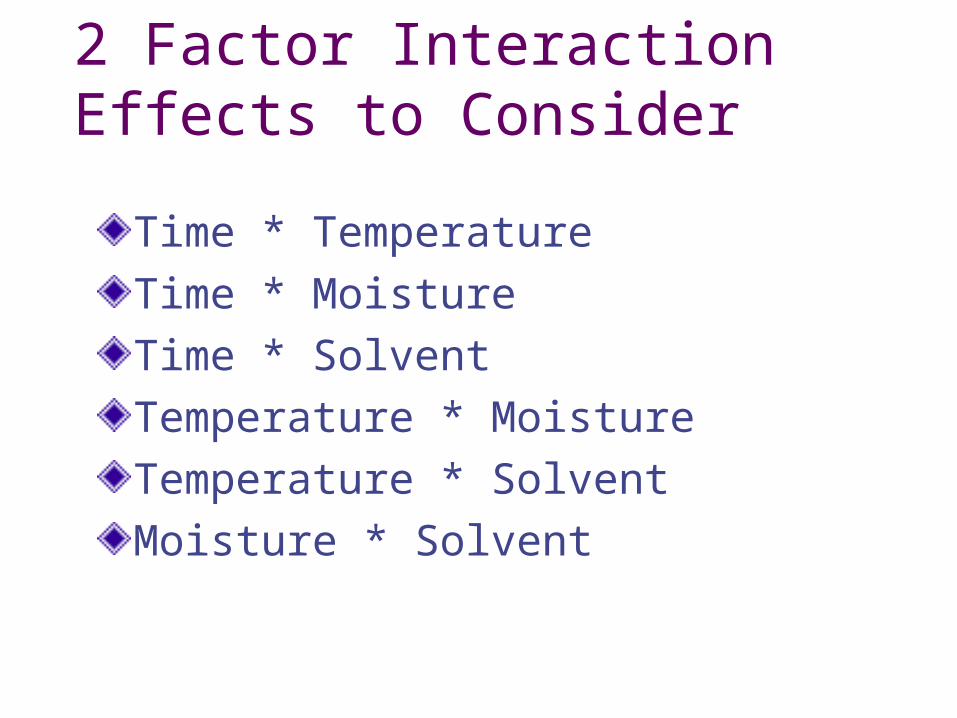
2 Factor InteractionEffects to Consider
Time * TemperatureTime * MoistureTime * SolventTemperature * MoistureTemperature * SolventMoisture * Solvent
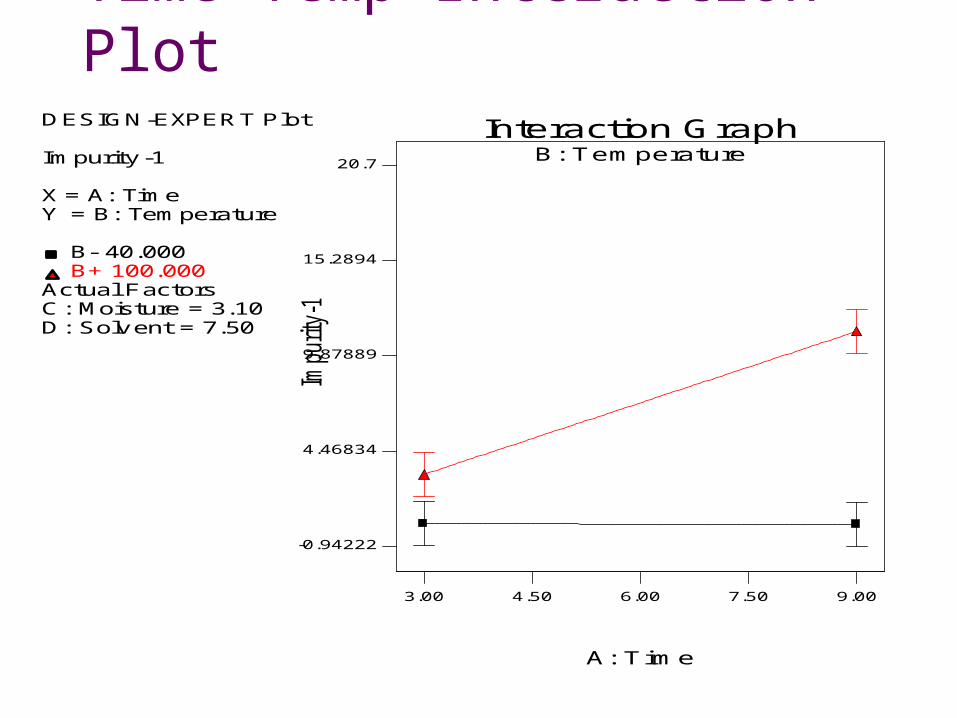
Time*Temp Interaction Plot
DESIGN-EXPERT Plot
Impurity -1
X = A: TimeY = B: Temperature
B- 40.000B+ 100.000
Actual FactorsC: Moisture = 3.10D: Solv ent = 7.50
B: TemperatureInteraction Graph
Impurity
-1
A: T ime
3.00 4.50 6.00 7.50 9.00
-0.94222
4.46834
9.87889
15.2894
20.7
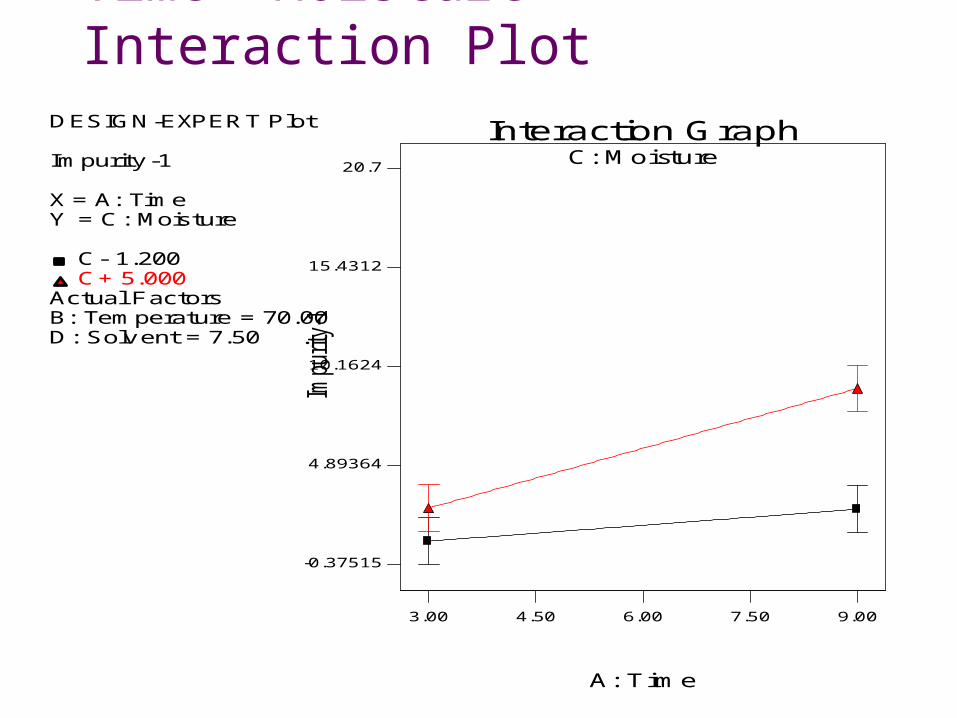
Time* Moisture Interaction Plot
DESIGN-EXPERT Plot
Impurity -1
X = A: TimeY = C: Moisture
C- 1.200C+ 5.000
Actual FactorsB: Temperature = 70.00D: Solv ent = 7.50
C: MoistureInteraction Graph
Impu
rity-
1
A: T ime
3.00 4.50 6.00 7.50 9.00
-0.37515
4.89364
10.1624
15.4312
20.7
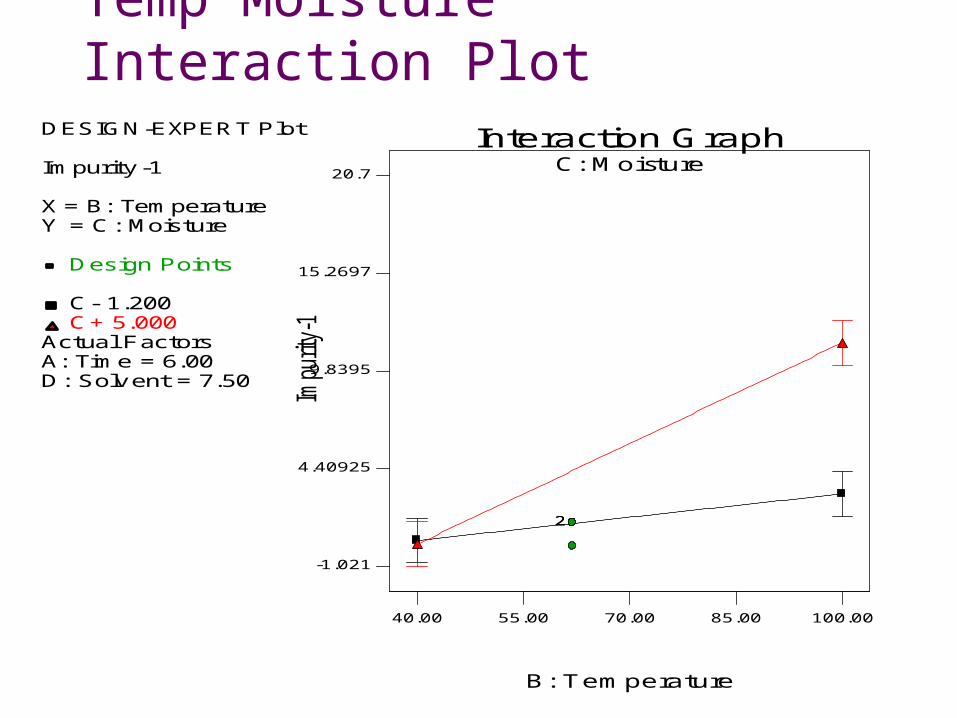
Temp*Moisture Interaction Plot
DESIGN-EXPERT Plot
Impurity -1
X = B: TemperatureY = C: Moisture
Design Points
C- 1.200C+ 5.000
Actual FactorsA: Time = 6.00D: Solv ent = 7.50
C: MoistureInteraction Graph
Impurity
-1
B: Temperature
40.00 55.00 70.00 85.00 100.00
-1.021
4.40925
9.8395
15.2697
20.7
22
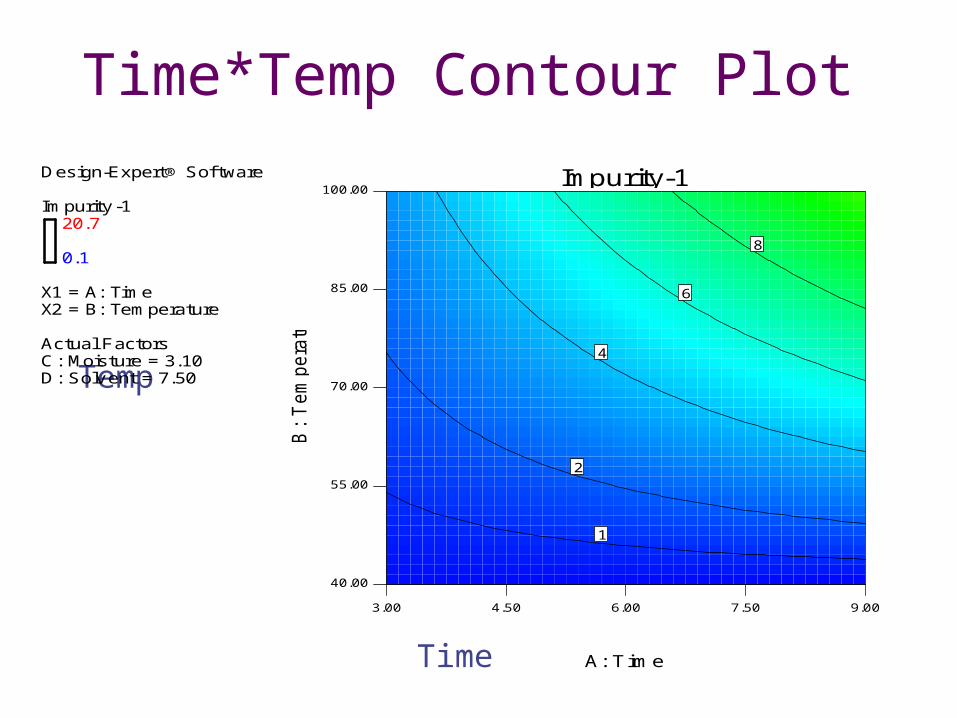
Time*Temp Contour Plot
Time
Temp
Design-Expert® Sof tware
Impurity -120.7
0.1
X1 = A: TimeX2 = B: Temperature
Actual FactorsC: Moisture = 3.10D: Solv ent = 7.50
3.00 4.50 6.00 7.50 9.00
40.00
55.00
70.00
85.00
100.00Impurity-1
A: T ime
B:
Tem
pera
ture
2
4
6
8
1
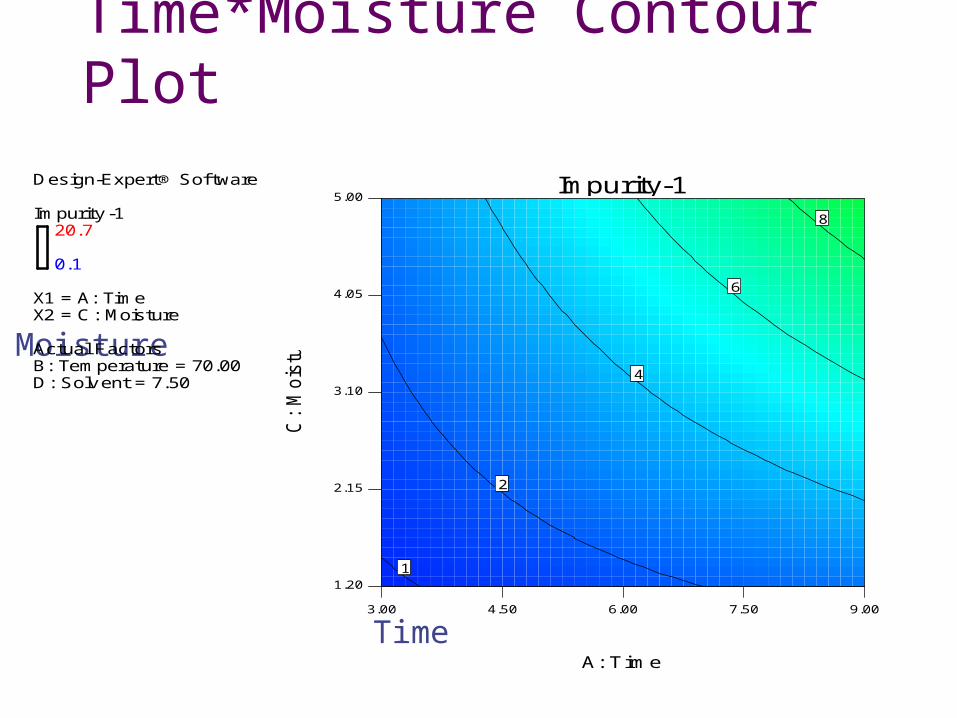
Time*Moisture Contour Plot
Time
Moisture
Design-Expert® Sof tware
Impurity -120.7
0.1
X1 = A: TimeX2 = C: Moisture
Actual FactorsB: Temperature = 70.00D: Solv ent = 7.50
3.00 4.50 6.00 7.50 9.00
1.20
2.15
3.10
4.05
5.00Impurity-1
A: T ime
C:
Mois
ture
2
4
6
8
1
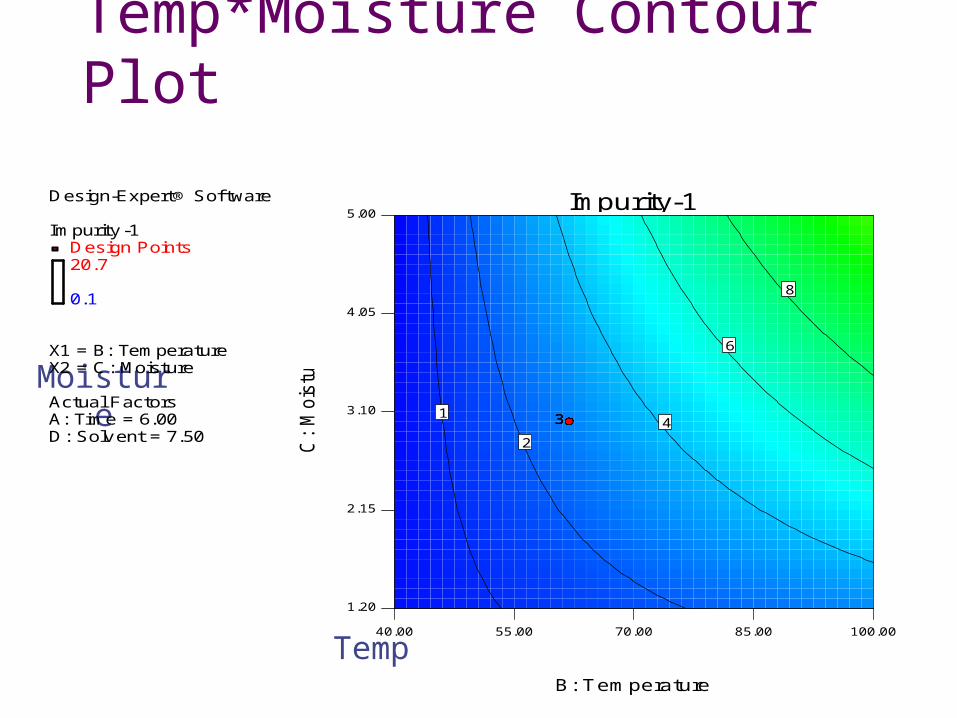
Temp*Moisture Contour Plot
Temp
Moisture
Design-Expert® Sof tware
Impurity -1Design Points20.7
0.1
X1 = B: TemperatureX2 = C: Moisture
Actual FactorsA: Time = 6.00D: Solv ent = 7.50
40.00 55.00 70.00 85.00 100.00
1.20
2.15
3.10
4.05
5.00Impurity-1
B: Temperature
C:
Mois
ture
2
4
6
8
1 333
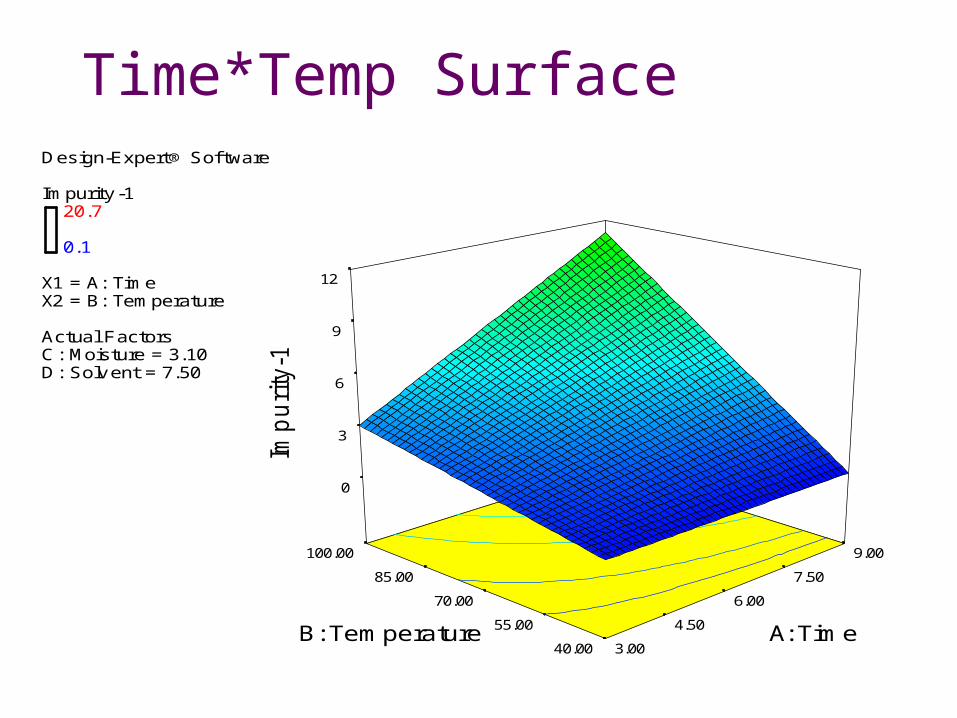
Time*Temp SurfaceDesign-Expert® Sof tware
Impurity -120.7
0.1
X1 = A: TimeX2 = B: Temperature
Actual FactorsC: Moisture = 3.10D: Solv ent = 7.50
3.00
4.50
6.00
7.50
9.00
40.00
55.00
70.00
85.00
100.00
0
3
6
9
12 Im
pu
rity
-1
A: Time B: Temperature
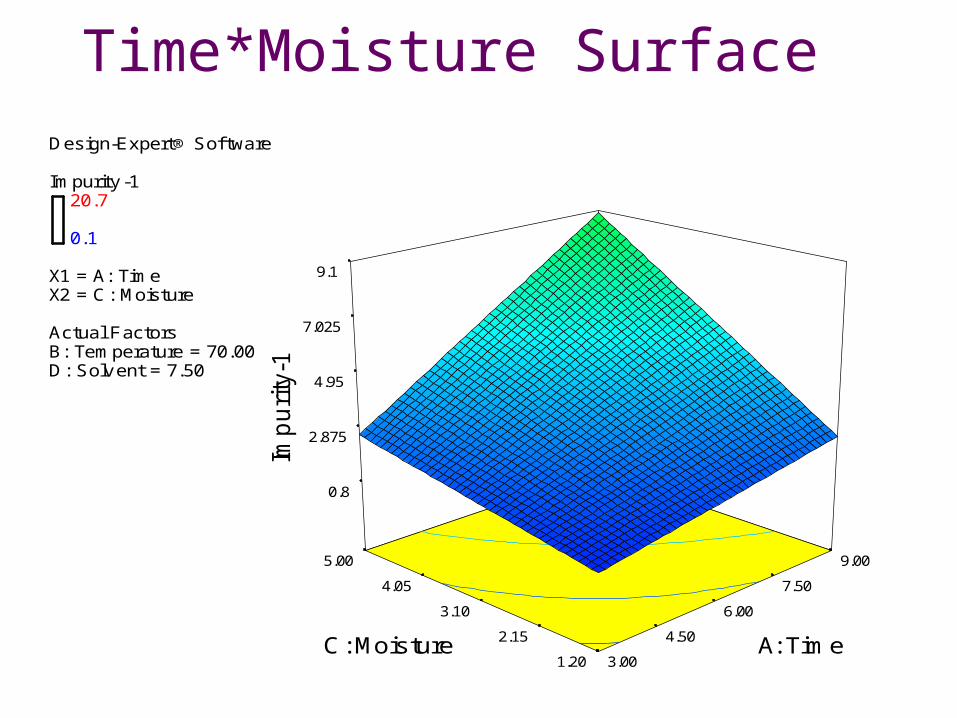
Time*Moisture SurfaceDesign-Expert® Sof tware
Impurity -120.7
0.1
X1 = A: TimeX2 = C: Moisture
Actual FactorsB: Temperature = 70.00D: Solv ent = 7.50
3.00
4.50
6.00
7.50
9.00
1.20
2.15
3.10
4.05
5.00
0.8
2.875
4.95
7.025
9.1 I
mp
uri
ty-1
A: Time C: Moisture
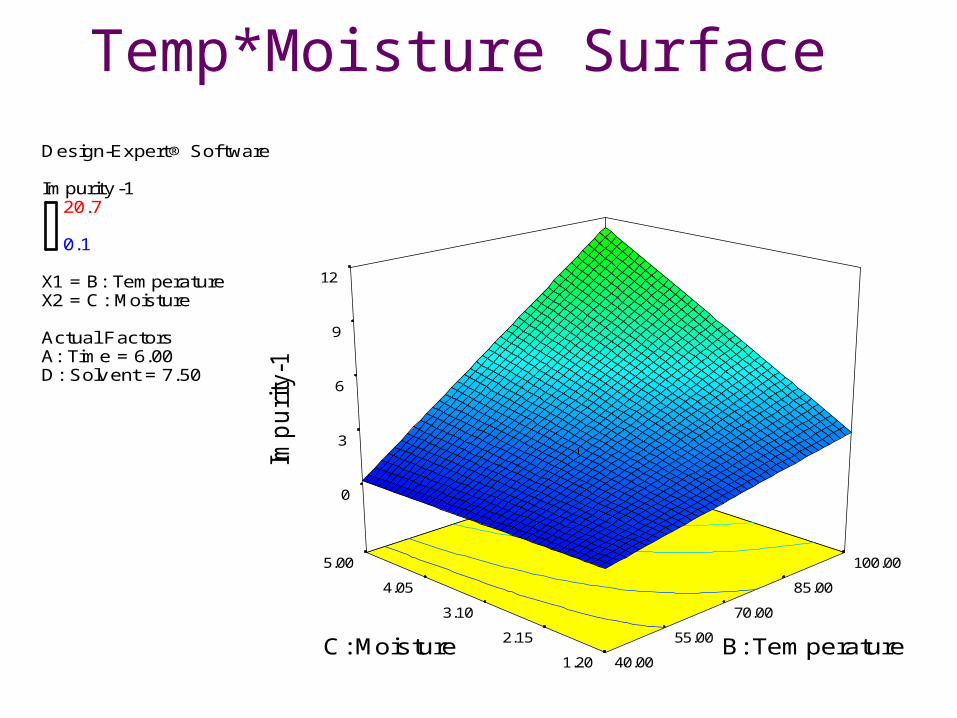
Temp*Moisture Surface
Design-Expert® Sof tware
Impurity -120.7
0.1
X1 = B: TemperatureX2 = C: Moisture
Actual FactorsA: Time = 6.00D: Solv ent = 7.50
40.00
55.00
70.00
85.00
100.00
1.20
2.15
3.10
4.05
5.00
0
3
6
9
12 Im
pu
rity
-1
B: Temperature C: Moisture
Quick Dry Example
FACTOR SPACEDrying time 3-9 mins
Drying Temperature 40-100
Excipients Moisture 1.2-5 %
%Solvent 1-14 %
RESPONSE SPACEImpurity-1 %Impurity-2 %Intact drug %Final moisture %
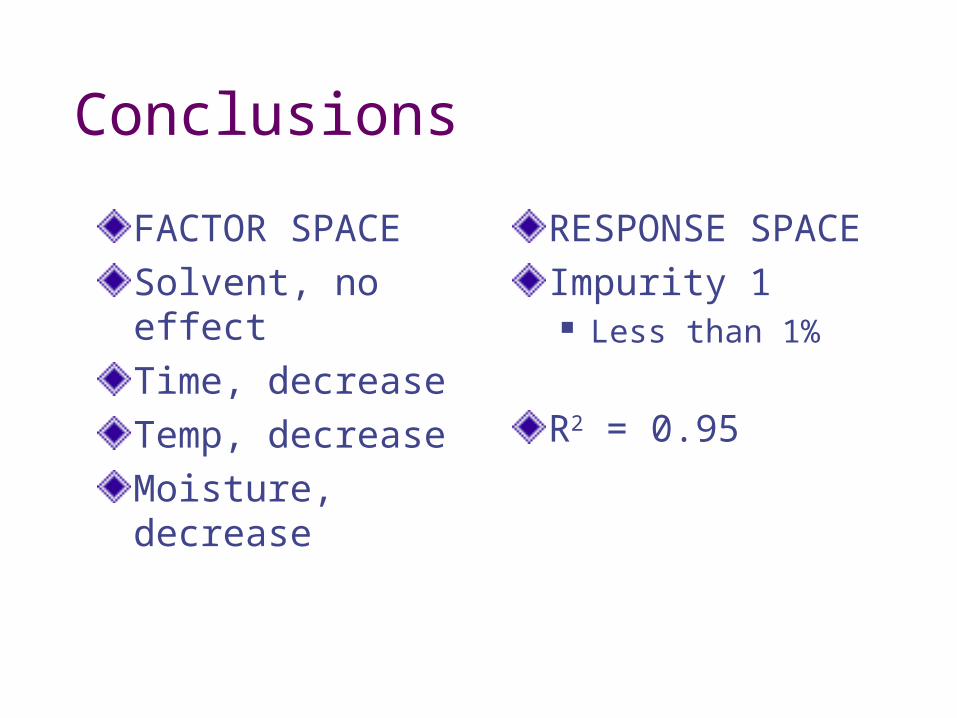
Conclusions
FACTOR SPACESolvent, no effectTime, decreaseTemp, decreaseMoisture, decrease
RESPONSE SPACEImpurity 1 Less than 1%
R2 = 0.95
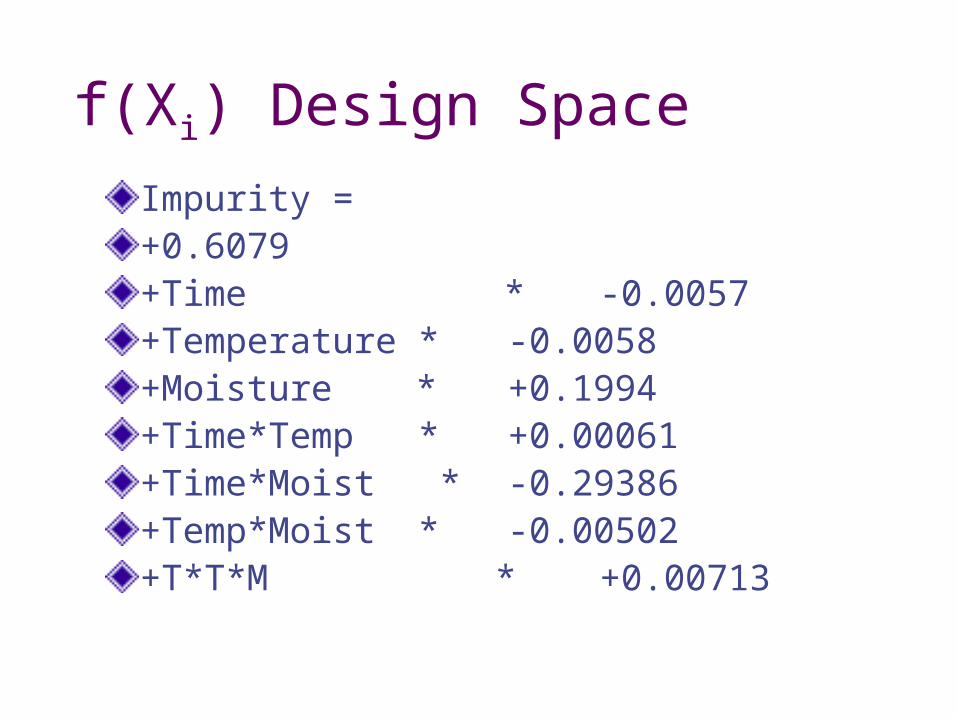
f(Xi) Design Space
Impurity =+0.6079 +Time *-0.0057+Temperature * -0.0058+Moisture * +0.1994+Time*Temp * +0.00061+Time*Moist * -0.29386+Temp*Moist * -0.00502+T*T*M * +0.00713
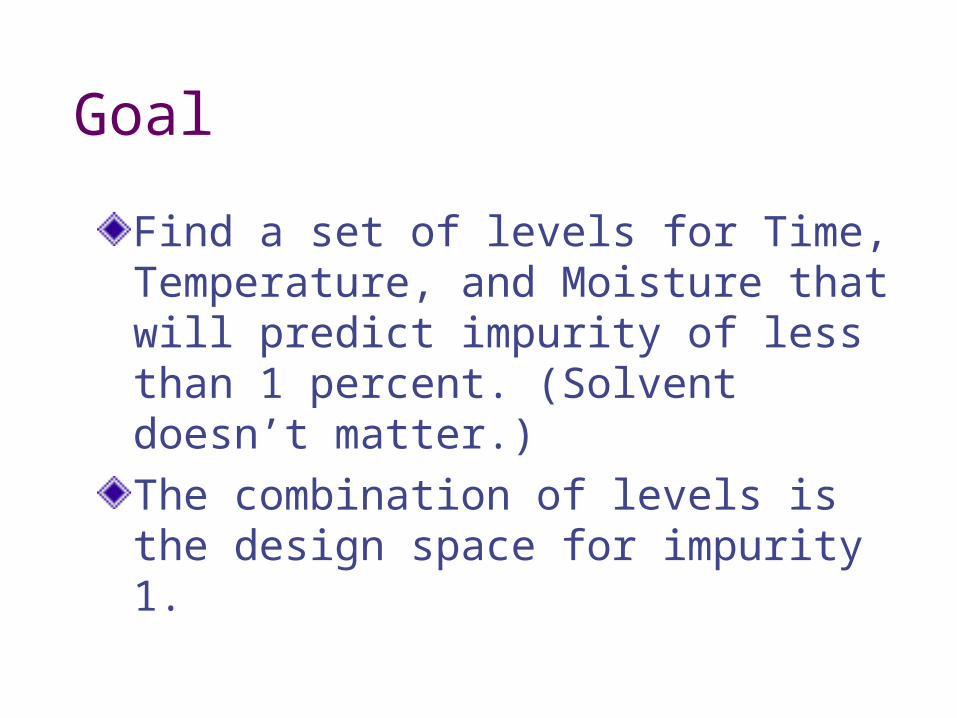
Goal
Find a set of levels for Time, Temperature, and Moisture that will predict impurity of less than 1 percent. (Solvent doesn’t matter.)The combination of levels is the design space for impurity 1.
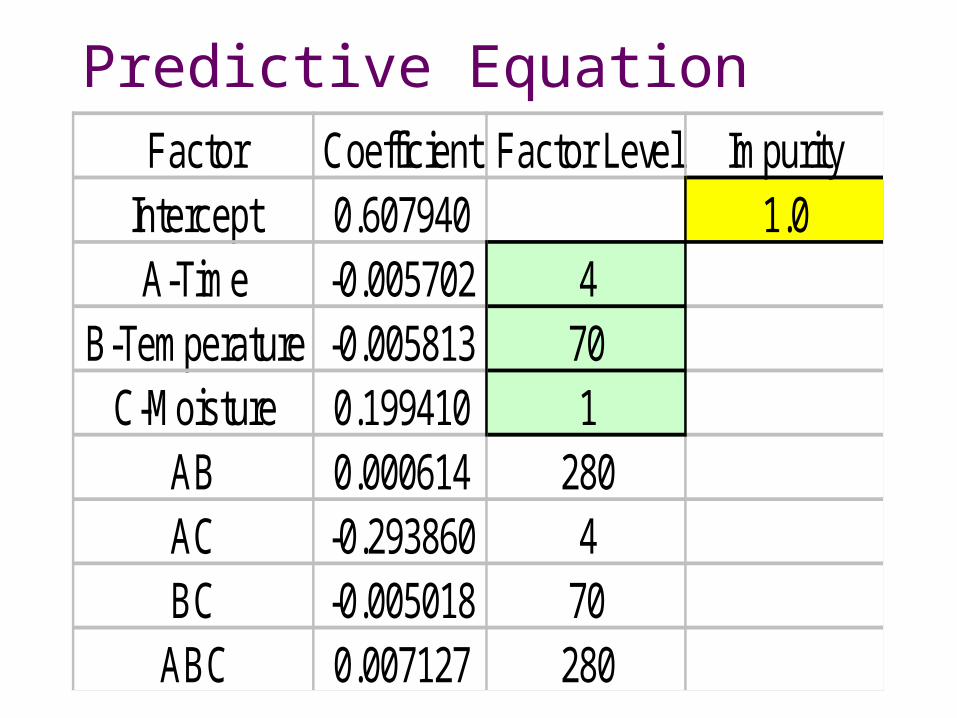
Predictive EquationFactor Coefficient Factor Level Impurity
Intercept 0.607940 1.0A-Time -0.005702 4
B-Temperature -0.005813 70C-Moisture 0.199410 1
AB 0.000614 280AC -0.293860 4BC -0.005018 70
ABC 0.007127 280
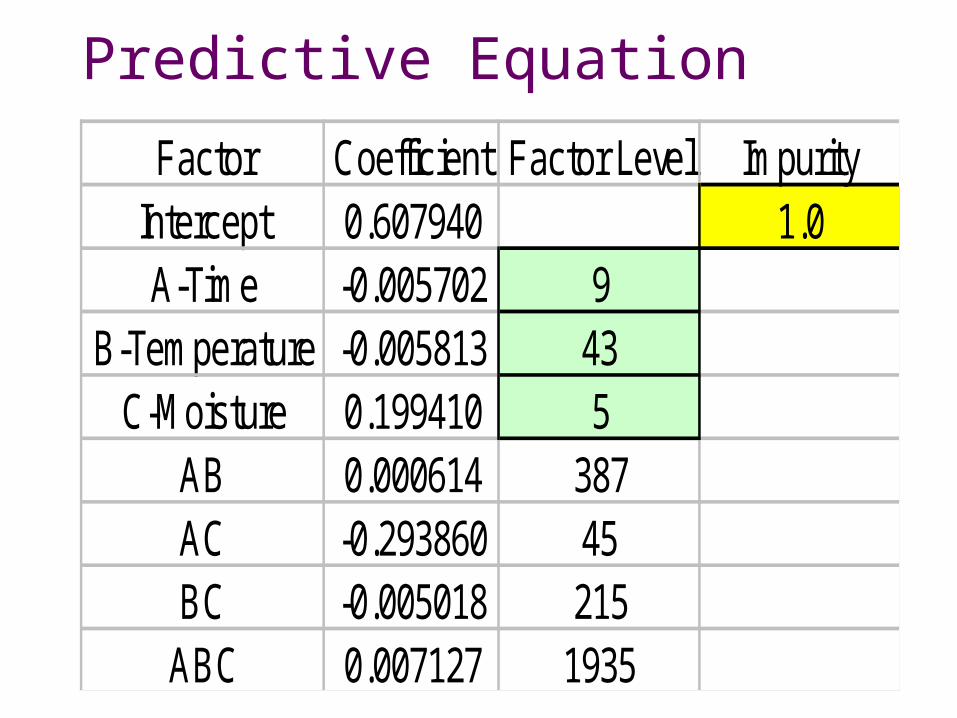
Predictive Equation
Factor Coefficient Factor Level ImpurityIntercept 0.607940 1.0A-Time -0.005702 9
B-Temperature -0.005813 43C-Moisture 0.199410 5
AB 0.000614 387AC -0.293860 45BC -0.005018 215
ABC 0.007127 1935
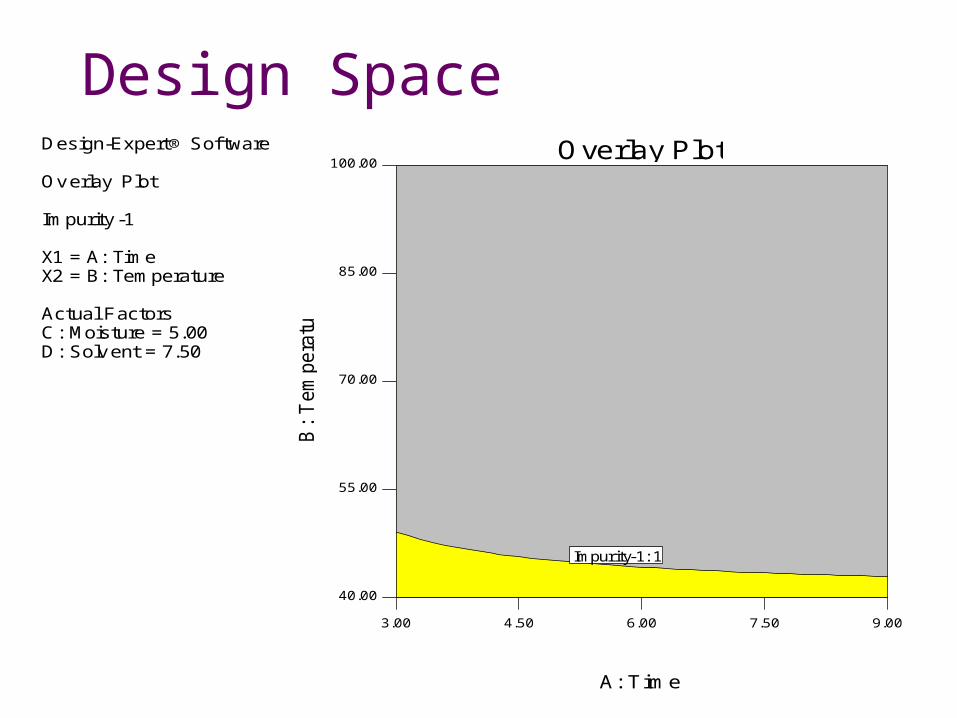
Design SpaceDesign-Expert® Sof tware
Ov erlay Plot
Impurity -1
X1 = A: TimeX2 = B: Temperature
Actual FactorsC: Moisture = 5.00D: Solv ent = 7.50
3.00 4.50 6.00 7.50 9.00
40.00
55.00
70.00
85.00
100.00Overlay Plot
A: Time
B:
Tem
pera
ture
Impurity-1: 1
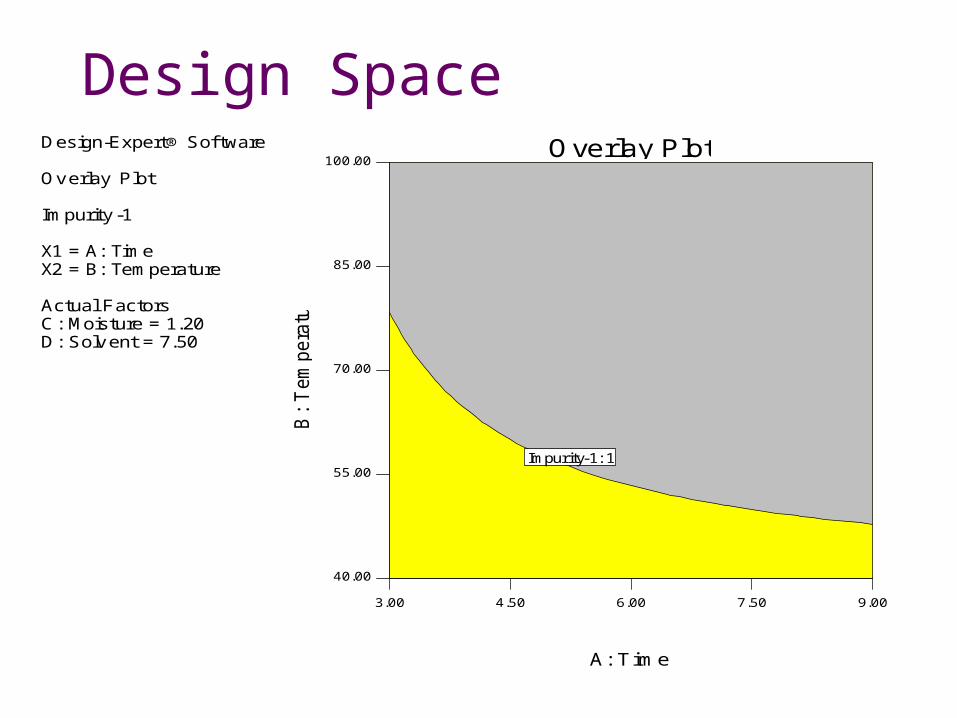
Design SpaceDesign-Expert® Sof tware
Ov erlay Plot
Impurity -1
X1 = A: TimeX2 = B: Temperature
Actual FactorsC: Moisture = 1.20D: Solv ent = 7.50
3.00 4.50 6.00 7.50 9.00
40.00
55.00
70.00
85.00
100.00Overlay Plot
A: T ime
B:
Tem
pera
ture
Impurity-1: 1
Multidimensional Specifications
Specifications should not be set one factor at a time.We need to consider all responses together.We need to do the same analysis for impurity 2, intact drug and final moisture and then overlay the four solutions to find the design space that will meet all of the criteria at the same time.
Scale-Up
Scale-up may not be linearAssume that the basic equations will applyAssume the design space will be somewhat robust and rugged.Need to do confirmation experiments to confirm assumptions.Or reestablish the design space.
Design Space Conclusions
ICH Q8 and the FDA are asking for designed experiments and predictive equations for each aspect of a new product.Descriptions need to be mathematical and statistical equations.Empirical equations are the most common, but a few mechanistic equations may be possible.
Design Space Conclusions
This is a new and perhaps confusing issue for the pharmaceutical industry.To implement this approach will require designed experiments with overlays of multiple responses for each new product.Sometimes retrospective studies of existing products can be done with historical data.