Embed Size (px)
Citation preview

How to improve your manufacturing business’ performance by
automating financial processes
Will begin shortly …
Today’s webinar presentation
Hosted by Prophix Software
Presented by Denise Feece

Event Notes
• Duration: 45 minutes, with 10 minutes Q&A (optional).
• Please ask questions on today’s topic via the “Questions”
box in your GoToWebinar control panel.
• Link to today’s presentation and recording of this webinar
will be sent out to all attendees within 48 hours.

Corporate Performance Management (CPM)
in Manufacturing Denise Feece
June 24, 2015

About me…
• 20 years finance experience
• 15 years manufacturing experience
• Controller
• Director of Planning and Analysis
• Director of Operational Accounting & Corporate Planning
• Vice-President Finance
• Divisional Controller
• Various sizes of businesses that have grown during my time there
• $50 – 200MM
• $200MM - $1B
• $5-6B
• Currently Division Controller at Brock Grain Systems

Why finance?
• Finance is the place where everything in the business comes together
• In the financial statements
• Provides access to dig deeper into any aspect of the business that you have a desire to understand
• Adds tremendous value through helping managers understand the numerical results (either financial or non-financial)
• Allows you to see the global picture of the business rather than just a small part
• It’s Math – I’ve always like it!
Finance
Manufacturing
Procurement
Sales
Human Resources

How can CPM help you? • Corporate Performance Management (CPM) tools can help
manage the performance of your business, not just measure it
• CPM tools help you eliminate many of the frustrations that you deal with today:
• Multiple excel workbooks
• Missing or broken links
• Missing or incorrect formulas
• Lack of security
• Difficulty in consolidating data
• Time for analysis
• CPM tools eliminate the data preparation time providing more time for analysis
• Multiple answers
• CPM tools help you to achieve a “one source of the truth” environment helping to change management discussions from “what is the answer?” to “what are we going to do about it?”

CPM at Coleman Cable, Inc. • Manufacturer of electrical and electronic wire and cable products
• Headquarters in Waukegan, IL
• ~$1B annual revenue, previously listed on NASDAQ as CCIX
• Recently acquired by Southwire Company, headquarters in Carrollton, GA
• Implemented a CPM tool which helped to change the reporting and analytical abilities of the organization
• Became the “one source of the truth” and changed the discussions in the board room

Prior to CPM
• Non-productive meetings
• Three different answers to the question at hand
• Spent time determining what was the right answer rather than how to improve the results
• Unable to answer ad-hoc questions
• Overuse of Excel
• Many critical linked workbooks
• Much time spent repairing broken links or missing formulas
• Changes were frustrating
• Common to add a new department, new account, or an alternate roll up
• Was not easy to do…change was frustrating
• No answers
• Some things were just too difficult to analyze

Evaluating the Options • So you decided you need a tool…what should you consider?
• Flexibility – solution should be able to handle a variety of applications
• Financial reporting, budgeting, and forecasting
• Operational metrics (financial and non-financial)
• Able to handle both detailed and summarized data
• Platform
• On-premise vs. cloud
• Need to consider the frequency with which your data needs to be updated
• Cloud applications limit the ability to update data on demand
• Compatibility with internal systems
• A good CPM tool can easily communicate directly with multiple sources
• End-User Experience
• Ease of use is important
• Especially when used cross functionally
• Customer focused vendor
• Select a vendor who focuses on providing services that customers need
CPM Solution

Demonstration and References • Demonstration
• Look for flexible business processes
• Request the vendor to demonstrate their solution using your data
• Will give you a good indication of ease of use if this can be completed quickly
• Helps you to visualize your potential solutions
• References
• Important step in the process – don’t skip it
• Ask to speak to other customers like you
• Same industry, same ERP or other core system, etc.
• Be prepared with questions that will help you confirm if the vendor can meet your requirements
• Look for blogs and other social commentary for feedback
CPM Solution

Implementation
• Implementation team
• Develop a team responsible for implementation
• Team should consist of 1 – 2 experts who will ultimately be responsible for further implementation
• Training
• General training performed with the vendor on overall use of CPM tool
• Train the trainer approach works well for others who will use the tool but not part of the implementation team
• Change management
• Consider the culture of your organization and how this implementation might challenge the tribal knowledge
• Start small and expand, building off of prior successes

Financial Reporting at Coleman
• Before CPM
• Financial Reporting
•Relied on AS400 based reports – not easily modified for new accounts or departments
•Relied heavily on Excel for formatting and making the statements more presentable
•Used multiple v-lookups within Excel for template formatting and segregation among responsible managers
•Approximately 60 individual emails would then be distributed
• Financial books distributed to upper management would take approximately 8 hours to print, collate, copy, and bind (about 14 books of 400 pages each)

Coleman solution with CPM
• Financial Cube
• Cube is a multi-dimensional data model
• Allows for easy slicing and dicing of the data
• Applications
• Financial Reporting
• Budgeting and Planning
• Forecasting
• Analysis

Financial Cube
Distributions to managers are
made automatically with
each financial statement
distribution
Financial Cube
Distributions to managers are
made automatically with
each financial statement
distribution
Report binder is set up to collate templates and add PDF cover pages where necessary

Financial Cube
• Benefits of CPM Solution – Entire process reduced from 8 to less than 2 hours
• 95% of the 2 hours is computer processing time
• Human resource time reduced from 8 hours to approx. 10 minutes

Sales Cube
• Before CPM Solution
• Inclusion of historical trend data with the forecast data was cumbersome to incorporate
• Multiple Excel sheets were necessary and difficult to consolidate for multiple business units
• Product categories of multiple business units would have to be manually consolidated prior to allocating production by category to multiple production facilities
• Updating data by business unit managers was performed in Excel
• They were often provided a blank sheet and asked to fill in all the details necessary to develop the forecast
• Analysis of forecast data was difficult
• Unable to compare forecasted sales by product category to actual results
• Graphically monitoring sales trends was performed manually by updating Excel templates each time the data changed
• Distribution of sales trends was limited to those who requested them
• Often there were multiple people creating similar trend charts from the same data set
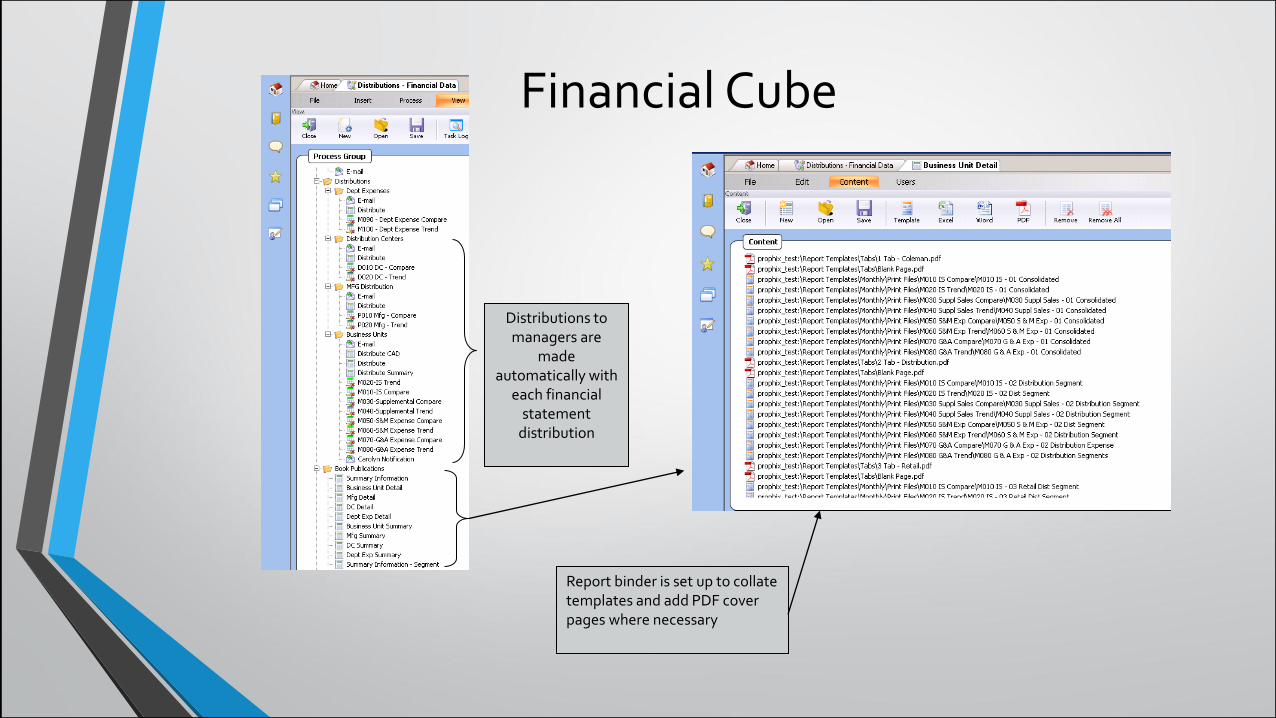
Sales Cube
Offline templates are distributed automatically to each business unit manager based on their area’s of responsibility (set in the security manager)
Transferring data from the Sales Cube to the Financial Cube (Sales forecast into the P&L) is performed using the Export/Import feature

Sales Cube
Offline templates are distributed automatically to each business unit manager based on their area’s of responsibility (set in the security manager)
Transferring data from the Sales Cube to the Financial Cube (Sales forecast into the P&L) is performed using the Export/Import feature

Sales Cube
Offline templates are distributed automatically to each business unit manager based on their area’s of responsibility (set in the security manager)
Transferring data from the Sales Cube to the Financial Cube (Sales forecast into the P&L) is performed using the Export/Import feature
Monitoring of file locations where offline templates are placed to be uploaded afterwards

Production Cube
• Before CPM Solution
• Daily production reporting was performed manually using Excel
• Typically this data was not updated during the month end closing process due to time constraints
• Plants would go without information or would have to produce their own
• Production reporting format and type of data gathered was inconsistent between facilities
• Month end forecasts of production were performed manually using Excel
• Often the production group had a different forecast than the finance group
• Month end production data were manually queried and then entered in the GL

Production Cube
Nightly scheduled process imports actual data, calculates month end forecast data, and distributes dashboard report

Production Cube
Data View 1
Data View 4
Data View 3
Data View 2
Data View 5
Data View 1
Data View 2
Data View 3
Data View 4
Data View 5
Report template contains 5 separate data views and various types of graphs to visually display the production data

Personnel Cube
• Used MS Access to manipulate Excel data provided by HR to create payroll JE
• Answering manager questions about allocations and charges to wage accounts was very cumbersome (had to comb through payroll data manually and trace back to what was recorded)
• Monitoring/Auditing allocations was very cumbersome as a manual spreadsheet had to be created
• Processing time was approximately 4 hours each week
• Month end accruals were calculated manually using Excel
• Planned at the headcount level, however comparison to actual results weren’t available

Personnel Cube
Data import processes import payroll data provided by HR
Distribution processes distribute the JE’s in ready format to upload to GL
Info-flex processes calculate month end accruals based on given parameters and distribute required reports
Account number is developed utilizing formulas within the template that combine Organizational and Account Key Codes
Debit/Credit signs are determined based on IF statements built into the template that reverse the signs for
Description is developed utilizing formulas within the template that combine data from the template

Personnel Cube
Headcount report based on uploaded payroll data allows managers to know the number of employees working in each department
Wage allocation audit report monitors for changes in wage allocations, allows us to review each allocation change that has occurred to determine its accuracy
Other potential reports: 1. Pay rate change audit reports 2. OT monitoring 3. Actual vs. Plan wages 4. Revenue or earnings /headcount

All Cubes Work Together
Personnel Cube
Exchange Rate Cube
Financial Cube
Sales Cube
Production Cube
Flash Processes
• A combination of Excel and email were used to gather known data and put it in a financial statement format
• Had several problems:
–Relied on sales input for revenue and margin levels (always overly optimistic = WRONG!)
–Relied on production input for plant volumes and expense levels (always overly pessimistic = WRONG!)
–Timing depended on many others to provide data into the process
–Consolidation was plagued with typical challenges of Excel

Workflow – Flash Processes

Workflow – Flash Processes
• Defined step-by-step activities to complete the flash process
• Workflow manager keeps the process moving with email notifications to participants
• Keeps instructions for the process in one place = greater consistency
• Easily integrates actual current data from multiple cubes to consolidate into one financial flash report
• Handles distribution of final report to required recipients
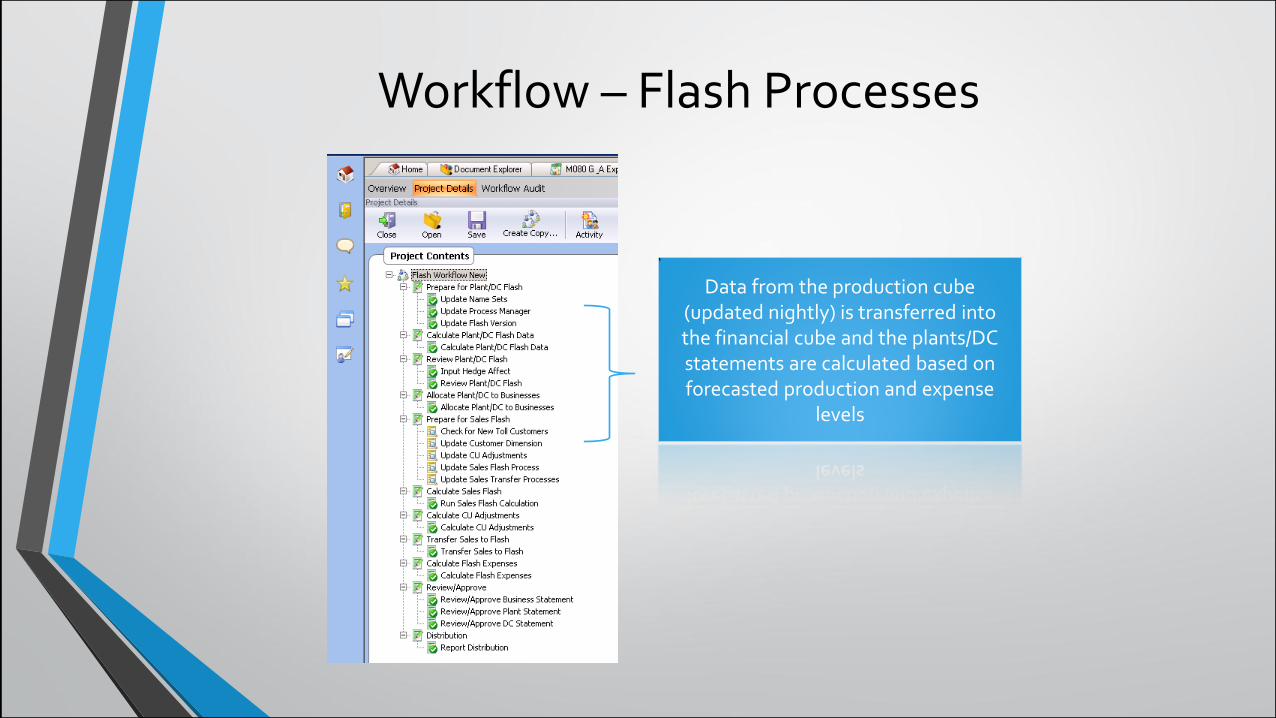
Workflow – Flash Processes
Data from the production cube (updated nightly) is transferred into the financial cube and the plants/DC statements are calculated based on forecasted production and expense
levels

Workflow – Flash Processes
Data from the production cube (updated nightly) is transferred into the financial cube and the plants/DC statements are calculated based on forecasted production and expense
levels
Actual sales and order data are updated and calculated in the sales
cube, the results of which are transferred into the financial cube
reflecting MTD sales and margin levels
Remaining expense levels are calculated and the flash statements are
reviewed and distributed

Inventory Transactions
E&O Cube
Inventory Reporting
Cube
Inventory Detailed
Transactions Cube
MUV Cube
Import inventory
transaction details from
As400
Inventory Roll Forward by
Part Number
Ready to book journal entry
to record inventory
movement in ledger
Management report
automated distribution
E&O Reserve analysis
performed
Inventory turns and
other inventory
reports
Ledger vs. Perpetual Inventory
Reconciliation
95% of transactions are common
Ready to book journal entry
to record variance in
ledger

Inventory Transactions
E&O Cube
Inventory Reporting
Cube
Inventory Detailed
Transactions Cube
MUV Cube
Import inventory
transaction details from
As400
Inventory Roll Forward by
Part Number
Ready to book journal entry
to record inventory
movement in ledger
Management report
automated distribution
E&O Reserve analysis
performed
Inventory turns and
other inventory
reports
Ledger v Perpetual Inventory
Reconciliation
95% of transactions are common
Ready to book journal entry
to record variance in
ledger
• 16 Hour Process Improvement during
month end close

Allocations Cube
Financial Cube
Allocations Cube
• Ledger Data is imported from AS400
• Data is transferred to Allocations Cube
• Allocation rates are applied to the data
• Allocated data is sent back to the Financial Cube via AJE

Freight Cube
• Built to help analyze freight spend
• By shipping location
• By customer
• By business segment
• By shipping method
• By weight class
• Measure of overspend
• Used to help determine savings opportunities

RGA Cube
RGA Dollars RGA Lines
PPM Manual
Order Entry RGA Dollars RGA Lines
PPM Manual
Order Entry
(Total_Service Rep) Total Service Rep $81,380 96 1,866 $619,077 643 2,937
(700 BREMEN) Bremen $2,349 2 215 $122,946 14 366
(700I) Bremen Internal $2,349 2 215 $122,946 14 366
(KAB) Katia B $1,427 1 10,870
(NC) Nancy C $50,989 3 300
(PR) Pat R $2,349 2 1,465 $5,348 6 1,087
(SM) Sandy M $65,183 4 352
• Tracks RGA’s by type, customer, location, and rep
• Calculates PPM for order entry errors
• Used to monitor rep performance

Warehouse Efficiency Cube Hours
All (-) 4,062
Angelo 162
Angelica 129
Anthony 78
Gary 1
Brandon 156
Dan 55
Daniel 169
Hours
001-800-LPN Pulls 7
001-800-Manifest By Container 0
001-800-Parcel Manifesting 1
001-800-Pk Parcel 1
001-800-Work with Picktickets 0
002-500-Pk Case Pick 4,062
002-500-Pk Flothru 120
002-500-Pk Parcel 215
002-500-Work with Picktickets 0
All (+) 100.0%
Retail - Hardware (+) 42.5%
Retail - Mass Merchant (+) 24.0%
Electrical Distribution (+) 16.3%
Electrical Distribution - Canada (+) 0.0%
Rec & Trans Distribution (+) 0.5%
Industrial Contractor Distribution (+) 7.2%
HVAC/R Distribution (+) 1.7%
Irrigation (+) 0.1%
Wire & Cable Distribution (+) 3.6%
Security/Home Technology (+) 2.6%
• Measures warehouse time spent by business unit
• Measures warehouse time spent by activity performed
• Measures warehouse productive time performed by employee

Transactions Cube
• Business need to instill accountability into a process and monitor that the right people were performing transactions
• Monitors inventory transactions made by
• Person/Department
• Type of transaction
• Time period
• Location

Commodity Price Cube
• Comex Price of copper is extremely important in our business
• Cube monitors and reports daily the movement in Comex
• Averages over time are calculated
• Pricing analytics are performed to understand impact on our business

KPI’s Reported via Dashboard
• With data available in each cube, KPI’s and visual charts monitoring the KPI’s can easily be created for different levels of the business
• Profitability per pound sold
• Plant/DC metrics on labor and variable cost per pound produced
• Sales and profitability by business segment vs. plan
• Balance sheet monitors of working capital, AR Days, and AP Days
• Pounds sold by product category
• Alternate hierarchies of product categories available
• Plant Scrap % of Production
• Daily production dashboard
• Forecast of ME position of plant absorption
• SEGA Expense and earnings per Headcount

Consolidated CPM Model
MUV Cube
Inventory Reporting
Cube
Personnel Cube
Personnel DPM Cube
Orders
Allocation Cube
Fixed Asset Cube
RGA Cube
Inventory Detailed
Transactions Cube
WMS Labor Cube
Customer Service
Cube
Sales Cube
Freight Cube
Company Dashboard
and Management
Reporting E&O Cube
Copper Cube
Production Labor
Financial Cube
Production Cube
Exchange Rate Cube
AP Distribution
Cube
Transactions Cube
Plant FC Cube

Rome wasn’t built in a day
• Started with
• One goal…single version of the truth
• One cube…the financial cube
• One problem…management reporting was cumbersome, time consuming, and prone to errors

Benefits of Corporate Performance Management
• Creates time for analysis rather than just reporting
• End-user automation of critical business processes without need for IT support
• Integrated Financial Planning
• Can truly start to perform business planning based on non-financial business indicators
• Flexible CPM applications can be used in any business situation
• If you can do it in Excel, you can do it better with a CPM tool
• Allows you to do more with less
• More accurate output
• More consistency in reporting and analysis
• Less time to complete these tasks

You too can benefit…
• See the need for a CPM tool
• Recognize the benefits that it would provide to your organization
• Evaluate possible solutions
• Vendor demonstrations
• Reference discussions
• Implement
• Start slow and build from successes
• Get creative
• The only limitation to the ability of CPM is your imagination

Thank You

Thank You
• Link to today’s presentation and recording of this webinar will sent out to all attendees within 48 hours.
• We appreciate your feedback in the exit survey.
• To learn more about how CPM software can help your organization, feel free to contact me directly at [email protected] or visit our website at www.prophix.com.