Embed Size (px)
Citation preview

Clim. Past, 12, 1933–1948, 2016www.clim-past.net/12/1933/2016/doi:10.5194/cp-12-1933-2016© Author(s) 2016. CC Attribution 3.0 License.
How warm was Greenland during the last interglacial period?Amaelle Landais1, Valérie Masson-Delmotte1, Emilie Capron2,3, Petra M. Langebroek4, Pepijn Bakker5,Emma J. Stone6, Niklaus Merz7, Christoph C. Raible7, Hubertus Fischer7, Anaïs Orsi1, Frédéric Prié1, Bo Vinther2,and Dorthe Dahl-Jensen2
1Laboratoire des Sciences du Climat et de l’Environnement – IPSL, UMR 8212, CEA-CNRS-UVSQ-Université Paris Saclay,Gif-sur-Yvette, France2Center for Ice and Climate, Niels Bohr Institute, University of Copenhagen, Juliane Maries Vej 30,2100 Copenhagen Ø, Denmark3British Antarctic Survey, High Cross Madingley Road, Cambridge CB3 0ET, UK4Uni Research Climate, Bjerknes Centre for Climate Research, Nygårdsgaten 112-114, 5008 Bergen, Norway5College of Earth, Ocean and Atmospheric Sciences, Oregon State University, Corvallis, OR 97331, USA6BRIDGE, School of Geographical Sciences, University of Bristol, Bristol, UK7Climate and Environmental Physics, Physics Institute, and Oeschger Centre for Climate Change Research,University of Bern, Sidlerstrasse 5, 3012 Bern, Switzerland
Correspondence to: Amaelle Landais ([email protected])
Received: 29 February 2016 – Published in Clim. Past Discuss.: 18 March 2016Revised: 18 July 2016 – Accepted: 17 September 2016 – Published: 29 September 2016
Abstract. The last interglacial period (LIG, ∼ 129–116thousand years ago) provides the most recent case study ofmultimillennial polar warming above the preindustrial leveland a response of the Greenland and Antarctic ice sheetsto this warming, as well as a test bed for climate and icesheet models. Past changes in Greenland ice sheet thicknessand surface temperature during this period were recently de-rived from the North Greenland Eemian Ice Drilling (NEEM)ice core records, northwest Greenland. The NEEM paradoxhas emerged from an estimated large local warming abovethe preindustrial level (7.5± 1.8 ◦C at the deposition site126 kyr ago without correction for any overall ice sheet al-titude changes between the LIG and the preindustrial period)based on water isotopes, together with limited local ice thin-ning, suggesting more resilience of the real Greenland icesheet than shown in some ice sheet models. Here, we pro-vide an independent assessment of the average LIG Green-land surface warming using ice core air isotopic composi-tion (δ15N) and relationships between accumulation rate andtemperature. The LIG surface temperature at the upstreamNEEM deposition site without ice sheet altitude correctionis estimated to be warmer by +8.5± 2.5 ◦C compared tothe preindustrial period. This temperature estimate is consis-tent with the 7.5± 1.8 ◦C warming initially determined from
NEEM water isotopes but at the upper end of the preindus-trial period to LIG temperature difference of +5.2± 2.3 ◦Cobtained at the NGRIP (North Greenland Ice Core Project)site by the same method. Climate simulations performed withpresent-day ice sheet topography lead in general to a warm-ing smaller than reconstructed, but sensitivity tests show thatlarger amplitudes (up to 5 ◦C) are produced in response toprescribed changes in sea ice extent and ice sheet topogra-phy.
1 Introduction
It remains challenging to understand the magnitude, timingand rate of the contributions of the Greenland and/or Antarc-tic ice sheets to the estimated 5 to 10 m increase in globalmean sea level during the last interglacial period (LIG, 129–116 thousand years before 1950, hereafter ka) and there-fore that of ice sheet vulnerability to multimillennial po-lar warming (Masson-Delmotte et al., 2013; Dutton et al.,2015). Therefore, constraints on past polar climate and icesheet response are required. Additionally, polar temperaturereconstructions provide a benchmark to assess the ability ofclimate models in capturing feedbacks which amplify the
Published by Copernicus Publications on behalf of the European Geosciences Union.
1934 A. Landais et al.: How warm was Greenland during the last interglacial period?
impact of orbital forcing on polar temperatures (Masson-Delmotte et al., 2011; Otto-Bliesner et al., 2013a; Capron etal., 2014). This is also relevant for future climate projections.
Since the 1960s, numerous Greenland deep ice corerecords have provided evidence for layers of ice locatednear bedrock characterized by high values of water stableisotopes (δ18Oice), well above preindustrial Holocene levels(Johnsen et al., 1997). The climate interpretation of the firstrecords was limited due to poor preservation of deep sam-ples (Camp Century, Dye 3) and the lack of remaining aircontent preventing any dating by synchronization with globalatmospheric records (i.e., atmospheric δ18O of O2, hereafterδ18Oatm, and CH4) from undisturbed Antarctic records. Thissynchronization method was applied for the LIG interval atSummit, where ice from the LIG was unequivocally iden-tified although not unambiguously datable, but sharp vari-ations in δ18Oice at GRIP (Greenland Ice Core Project) andGISP2 (Greenland Ice Sheet Project) were attributed to strati-graphic disturbances (Grootes et al., 1993; Landais et al.,2003, 2004; Suwa et al., 2006). At the NGRIP (North Green-land Ice Core Project), continuous climatic and environmen-tal records cover the last 123 kyr (NGRIP community mem-bers, 2004). The Greenland record was recently extendedback to 128 ka thanks to a 80 m segment of ice in strati-graphic order found in between disturbed layers at the bot-tom of the North Greenland Eemian Ice Drilling (NEEM)ice core (NEEM community members, 2013). The chronol-ogy of this core was tied to an Antarctic ice core age scale,based on common changes in atmospheric composition. Theunequivocal matching between the NEEM LIG layer and theAntarctic δ18Oatm records rules out stratigraphic disturbancewithin this segment (NEEM community members, 2013).
Changes in NEEM air content and δ18Oice were cor-rected for elevation changes due to the upstream displace-ment of the deposition site and combined to infer changesin ice sheet topography and changes in surface air tempera-ture (NEEM community members, 2013). This requires as-sumptions regarding NEEM δ18Oice–temperature relation-ships. While Greenland snow isotopic composition has longbeen related to temperature due to Rayleigh distillation asso-ciated with cooling along air mass pathways (Dansgaard etal., 1964), it has been increasingly documented that δ18Oice–temperature relationships are neither stable in time nor inspace (e.g., Jouzel et al., 1999) primarily due to changesin the precipitation intermittency but also evaporation con-ditions and atmospheric transport (e.g., Krinner et al., 1997;Masson-Delmotte et al., 2011).
The initial LIG temperature estimate (NEEM communitymembers, 2013) was performed using the average Holoceneδ18Oice–temperature relationship established from other cen-tral Greenland ice cores through calibration against boreholetemperature at 0.5 ‰ ◦C−1 (Vinther et al., 2009). This rela-tionship was also explored in simulations using isotopicallyenabled atmospheric general circulation models for climateconditions warmer than the preindustrial period, either in re-
sponse to increasing CO2 concentration in projections or inresponse to changes in orbital forcing. These models pro-duced slopes varying from 0.3 to 0.7 ‰ ◦C−1 in Greenland,depending on changes in moisture sources driven by changesin sea ice and sea surface temperature patterns (Masson-Delmotte et al., 2011; Sime et al., 2013). Based on these linesof evidence, a slope varying from 0.4 to 0.6 ‰ ◦C−1 was usedto estimate the range of changes in LIG temperature basedon NEEM δ18Oice (NEEM community members, 2013). At126 ka, and at the location of the initial snowfall depositionsite (about 205± 20 km upstream of the current NEEM site),δ18Oice was estimated to be 3.6 ‰ above the local preindus-trial level, which translated into local surface air tempera-ture warming of 7.5± 1.8 ◦C. After accounting for upstreameffects and for Greenland ice sheet elevation change basedon air content, this led to an estimate of a 8± 4 ◦C warmingat the NEEM deposition site at 126 ka (NEEM communitymembers, 2013). In parallel, ice sheet simulations forced bydifferent LIG climate scenarios were investigated to selectonly those compatible with a limited change in ice thicknessat NEEM, based on air content data. This implied limitedGreenland ice sheet deglaciation, with a contribution of 1.4to 4.3 m to the LIG sea level increase (Masson-Delmotte etal., 2013).
These results led to the NEEM paradox, according towhich the Greenland ice sheet appears resilient to large mul-timillennial surface warming. This paradox was further en-hanced by the difficulty of coupled ocean–atmosphere cli-mate models to capture such warming (Otto-Bliesner et al.,2013b; Capron et al., 2014), even during the warmest sum-mer months (van de Berg et al., 2013), and by the inconsis-tency of the Greenland ice sheet retreat simulated by ice sheetmodels in response to such warming (e.g., Stone et al., 2013;Helsen et al., 2013). When accounting for a reduced Green-land ice sheet and a retreat in sea ice cover in the NordicSeas, atmospheric simulations can explain up to 5 ◦C annualmean warming with respect to the preindustrial period (Merzet al., 2014a, 2016). Moreover, all LIG climate modelingstudies cited above strongly enhance summer precipitationseasonality in Greenland, suggesting a summer bias for LIGδ18Oice and weaker annual mean change than the initial es-timate of 8± 4 ◦C (Masson-Delmotte et al., 2011; Merz etal., 2014b). As an example, if we use surface temperatureand precipitation rate at a monthly resolution from the Nor-wegian Earth System Model (NorESM) at the NEEM LIGdeposition site, we observe a simulated increase in summertemperature (accumulation rate) of 3.5 ◦C (7 mm month−1)and a decrease in winter temperature (accumulation rate) of2 ◦C (3 mm month−1). This seasonality effect indeed leadsto a factor of 2 difference between the precipitation-weightedtemperature change and the annual mean temperature changebetween the preindustrial period and LIG.
Recently, new information on climatic controls on NEEMδ18Oice has emerged from present-day water isotope mon-itoring and multi-decadal trends from shallow ice cores
Clim. Past, 12, 1933–1948, 2016 www.clim-past.net/12/1933/2016/
A. Landais et al.: How warm was Greenland during the last interglacial period? 1935
(Steen-Larsen et al., 2011, 2014). All these datasets coher-ently document a surprisingly large present-day responseof NEEM δ18Oice to temperature, with a slope of [0.8–1.2] ‰ ◦C−1 (Masson-Delmotte et al., 2015). If relationshipsestablished from the intra-seasonal to the multi-decadal scaleremain valid for earlier warm periods such as the LIG, it alsoimplies that the initially reconstructed temperature changebased on NEEM δ18O was overestimated.
Here, we present new, independent information on LIG an-nual mean temperature change for several Greenland drillingsites, using the ice core air isotopic composition δ15N. TheseGreenland records are described in Sect. 2. Section 3 detailsthe temperature reconstructions with their associated uncer-tainties, with a focus on the NEEM deposition site. Thesetemperature estimates depend on assumptions regarding thepast relationship between temperature and accumulation rate.Section 4 presents a comparison to modeling outputs for dis-cussion before the conclusions.
2 Water and air isotope records of the lastinterglacial in Greenland
2.1 Records of water stable isotopes from multiple icecores on a coherent chronology
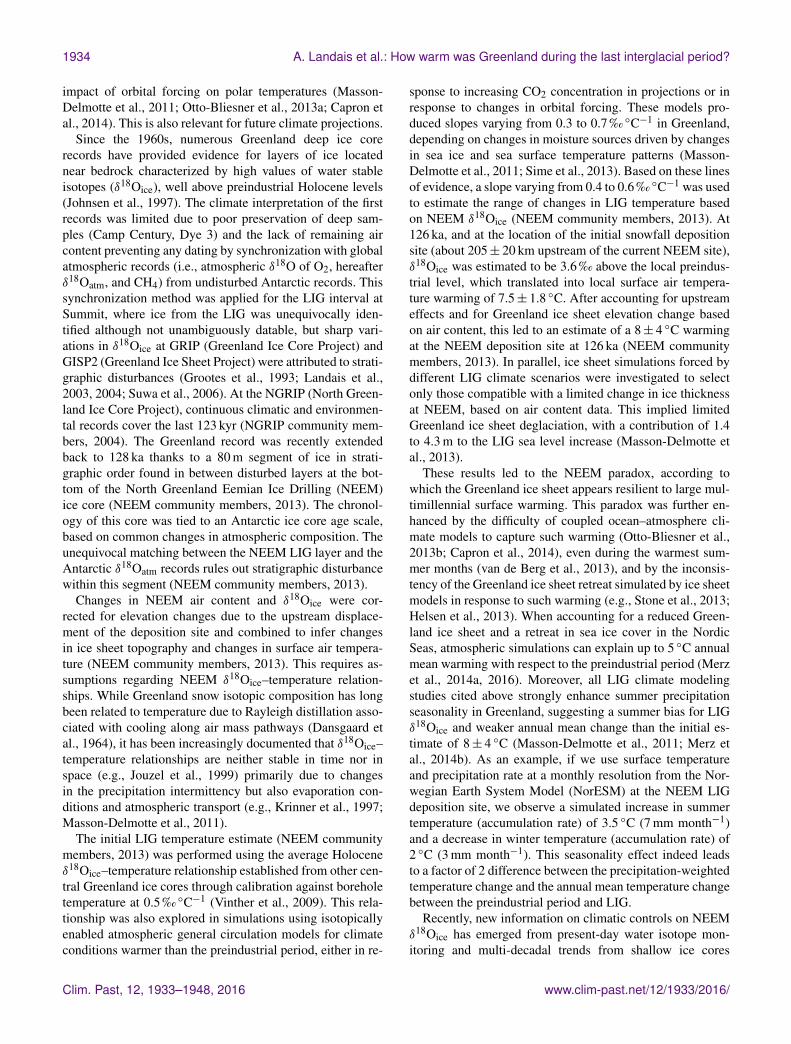
Figure 1 shows the compilation of the LIG δ18Oice recordsfrom NGRIP, GRIP and GISP2 sites on a coherent timescale.NEEM δ18Oice is presented on a parallel depth scale adjustedfor the alignment of δ18Oatm records over the LIG section. AsCH4 and δ18Oatm are globally well-mixed atmospheric trac-ers, comparable values are measured in the Greenland andAntarctic ice cores at the same time period, accounting forthe CH4 interpolar gradient leading to slightly higher CH4levels in Greenland than in Antarctica (e.g., Dällenbach etal., 2000). The synchronization between the records is there-fore based on parallel large variations in CH4 and δ18Oatmfrom measurements in the air trapped in bubbles. For theend of the LIG and the glacial inception, NGRIP recordswere placed on the AICC2012 (Antarctic ice core chronol-ogy) timescale (Bazin et al., 2013; Veres et al., 2013) usingCH4 and δ18Oatm tie points between NGRIP and the Antarc-tic EPICA Dronning Maud Land (EDML) ice core (Capronet al., 2010). However, the AICC2012 NGRIP chronologyis limited since (1) no synchronization points are availablefor ages older than 118 ka (Supplement in Bazin et al., 2013;Veres et al., 2013) and (2) the mean CH4 level is significantlyhigher at NGRIP than in the EPICA Dome C (EDC) record(Capron et al., 2012). The latter is interpreted in part to re-flect a strong increase in the interhemispheric CH4 gradient,which complicates the alignment of NGRIP and EDC CH4records (Capron et al., 2012). Additionally, a slight mismatchis observed between the LIG NGRIP and the recently pub-lished EDC δ18Oatm records (Fig. 1; Landais et al., 2013),suggesting that the AICC2012 NGRIP ice chronology maybe too young by up to 2 kyr at 121 ka.
Figure 1. Synchronized Greenland δ18Oice records. From top tobottom: summer solstice insolation at 77◦ N (black); δ18Oice fromNGRIP (light blue line), GRIP (open circles) and GISP2 (triangles)on the AICC2012 timescale (bottom axis) and NEEM δ18Oice (darkblue line) on its depth scale (top axis); CH4 records from NGRIP(light green line), GRIP (open circles), GISP2 (triangles) and EDC(dashed line) on the AICC2012 timescale and NEEM (dark greenline) on its depth axis; δ18Oatm records from NGRIP (light blue),GRIP (open circles), GISP2 (triangles) and EDC (dashed line) onthe AICC2012 timescale and NEEM δ18Oatm (turquoise) on itsdepth axis. The shaded grey rectangle highlights the deepest partof the NEEM records, where no gas synchronization with Antarcticice core records from the penultimate glaciation is feasible.
The dated GRIP and GISP2 δ18Oice records are discon-tinuous because of strong stratigraphic disturbances over thebottom 300 m of these Summit ice cores. They were initiallyplaced on the Vostok GT4 timescale (Petit et al., 1999) usingidentification of δ18Oatm /CH4 pairs and taking into accountthe interpolar CH4 gradient (Landais et al., 2003; Suwa etal., 2006). Here, we have transferred these δ18Oice recordson AICC2012 using the correspondence between the VostokGT4 and AICC2012 chronologies (Fig. 1).
Finally, the LIG section of NEEM can only be dated us-ing δ18Oatm because its CH4 record is contaminated by insitu production, relating to local summer melt during theLIG (NEEM community members, 2013). Figure 1 dis-plays the NEEM δ18Oice record on its depth scale between2350 and 2490 m, where the linear alignment of depth withAICC2012 is based on the resemblance between EDC andNEEM δ18Oatm records.
www.clim-past.net/12/1933/2016/ Clim. Past, 12, 1933–1948, 2016

1936 A. Landais et al.: How warm was Greenland during the last interglacial period?
The continuous NEEM section spanning the LIG ends justafter 128 ka (on the AICC2012 timescale). Indeed, the char-acteristic abrupt increase in CH4 and high δ18Oatm level iden-tified in Antarctic records at 128 ka is absent from the NEEMrecord. This reveals that the NEEM ice core does not en-compass any ice from the penultimate deglaciation at thatpoint, similar to GISP2, GRIP or NGRIP (Fig. 1). Whetherthis hiatus arises from the disappearance of this layer due tomelt under warm early LIG conditions or due to specific thin-ning and flow associated with different physical properties ofglacial versus transition ice remains to be fully assessed.
2.2 NEEM air δ15N record
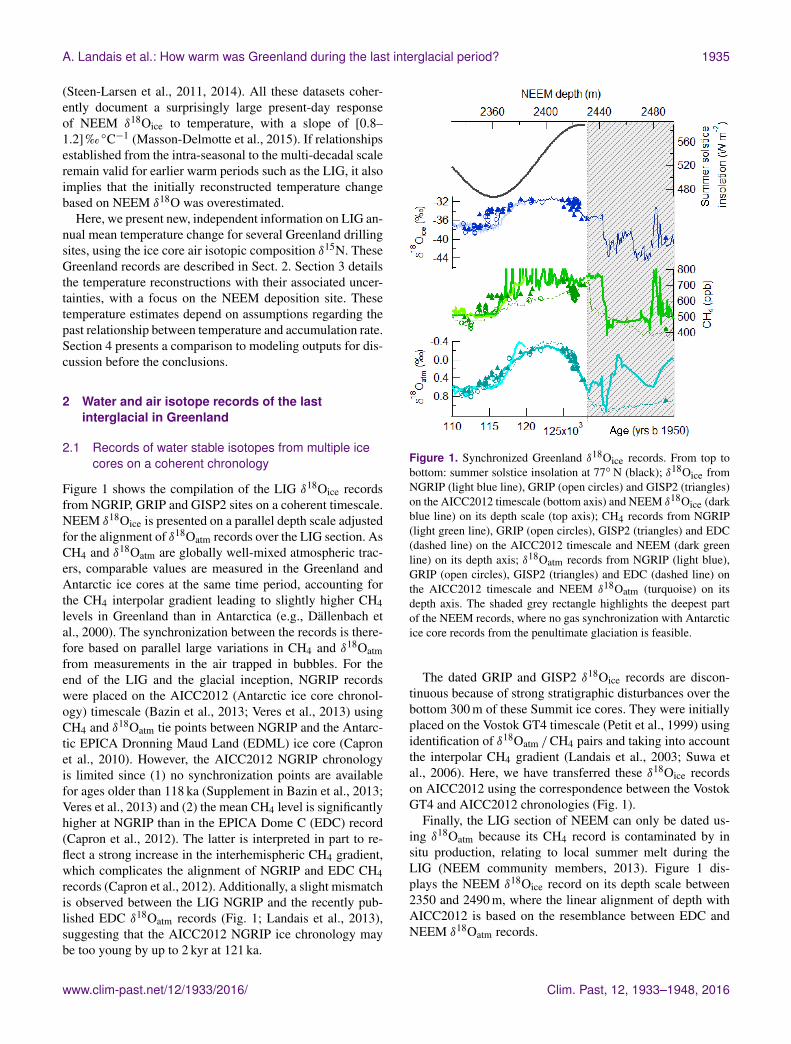
Relative to the free-atmosphere mean value, the δ15N valuein air trapped in ice cores is influenced by gravitational frac-tionation directly related to temperature and to the depth atwhich bubble lock-in occurs. Changes in firn lock-in depth(LID) can be related to changes in surface accumulation andtemperature: an increase in temperature leads to a decreasein the LID because of faster metamorphism, while higheraccumulation rates lead to an increase in the LID. The de-velopment of firn densification models allows the simula-tion of the LID evolution as a function of surface climaticconditions (e.g., Herron and Langway, 1980; Goujon et al.,2003; Li and Zwally, 2004; Helsen et al., 2008; Arthernet al., 2010; Ligtenberg et al., 2015). While there is stilla model–data mismatch at cold sites of central Antarctica(Capron et al., 2013), the comparison between firn mod-els and δ15N data can be used for testing quantitative tem-perature and accumulation rate reconstructions in Greenlandand high-accumulation sites in Antarctica (Guillevic et al.,2013; Kindler et al., 2014; Buizert et al., 2015). During rapidsurface temperature changes in Greenland (e.g., Dansgaard-Oeschger events), δ15N is also influenced by thermal frac-tionation (Severinghaus et al., 1998). However, no rapidδ18Oice changes are found during the LIG, and overall sta-ble NEEM δ15N values are also coherent with gravitationalfractionation occurring at a stable surface accumulation rateand temperature (Fig. 2).
The single exception is a negative spike recorded at2384 m depth, which coincides with the strongest CH4 spike,as well as a negative excursion of the 10Be record (Sturevik-Storm et al., 2014). We suggest that this singular event re-flects positive surface temperatures, leading to intense sur-face melt and large in situ CH4 production (Orsi et al., 2015).Firn air transport and thus δ15N are not expected to be sig-nificantly affected by melt layers at the surface (Keegan etal., 2014). This probably explains why most of the CH4spikes are not associated with any changes in the δ15N sig-nal. Still, for the negative 0.07 ‰ δ15N excursion at 2384 m(corresponding to ∼ 121 ka on the NEEM LIG age scale),we propose that positive surface temperatures led to a sud-den shrinking of the firn by about 15 m using the expression
-37
-36
-35
-34
-33
-32
-31
δ18O
ice
(‰)
2420240023802360234023202300Depth (m)
0.40
0.35
0.30
0.25
0.20
0.15
δ15N
(‰
)
2000
1500
1000
500
CH
4 (p
pbv)
(a)
(b)
(c)
Figure 2. NEEM δ18Oice (top), δ15N (middle) and CH4 (bottom)spanning the LIG. The hatched rectangle indicates the stratigraphicdisturbance identified in the upper part of the LIG section. Thelight grey rectangle highlights the single negative peak in δ15N atNEEM during the LIG, corresponding to the strongest positive peakin CH4, both peaks being identified at 2384 m depth. The grey andbold horizontal segment indicates the depth range over which theδ15N average has been done.
of δ15N gravitational settling in the firn column:
δ15N= exp(g×LIDR× Tmean
)− 1∼=
g×LIDR× Tmean
, (1)
where g is acceleration due to gravity, R the ideal gas con-stant and Tmean (K) the mean temperature of the firn whenbubbles are isolated.
For the rest of the LIG our δ15N record shows only verysubtle changes, and we take the mean δ15N value of 0.251 ‰over the time interval 122–126 ka to obtain a representativemean δ15N value (Table 1).
2.3 Spatial structure of isotopic anomalies
To assess the spatial extent of the isotopic anomalies, themagnitudes of δ15N are compared to the water stable isotope(δ18Oice and deuterium excess, hereafter d-excess) anoma-lies recorded in different Greenland ice cores between theLIG and the preindustrial period (Table 1).
For δ18Oice, the strongest increase from the preindus-trial period to the LIG is recorded at Summit (+3.4 ‰)and NGRIP (+3.3 ‰) and the smallest increase at NEEM(+2.1 ‰). However, the NEEM anomaly must be correctedfor upstream effects: due to ice flow, the LIG ice at NEEMoriginates from a 330 m higher upstream location (at the
Clim. Past, 12, 1933–1948, 2016 www.clim-past.net/12/1933/2016/

A. Landais et al.: How warm was Greenland during the last interglacial period? 1937
Table 1. Characteristics of Greenland deep ice core in the preindustrial period and during the LIG. The uncertainty corresponds to thestandard error of the mean. Where data was compiled from previous studies, the references for the number in this table are taken from 1.Buizert et al. (2012); 2. Guillevic et al. (2013); 3. Kobashi et al. (2008), Bender et al. (2006); 4. Masson-Delmotte et al. (2005); 5. Capron etal. (2012); 6. Jouzel et al. (2007); 7. NEEM community members (2013); 8. Masson-Delmotte et al. (2015).
Preindustriala LIGb
NEEM NEEM NGRIP GRIP GISP2 NEEM NGRIP GRIP GISP2Deposition site Deposition site
δ15N (‰) uncertainty: ±0.007 ‰ 0.2901 0.3102 0.305–0.3253 0.251 0.275 0.230 0.230δ18Oice (‰) uncertainty: ±0.1 ‰ −33.64
−357−35.54
−35.24−31.57
−32.2 −31.8 −31.8d-excess (‰) uncertainty: ±1.5 ‰ 114 11 10.54 9.54 11.5 9.95 10.86
Mean temperature (◦C) −28.58−317
−31.52−31.74
Accumulation (m ice equivalent yr−1) 0.228 0.192 0.232
a The accumulation rate, δ18O and d-excess values attributed to the preindustrial conditions correspond to averages over the last 200 years. For δ15N, it corresponds to the value at the bottom of the firn(itself built up over the last 200 years). The mean temperature is derived from borehole measurements. b For determining the δ18Oice, δ15N and d-excess values attributed to the LIG, we have taken theaverage of the corresponding records for NEEM, GRIP and GISP2 between 122 and 126 ka (excluding negative δ15N peak at 2384 m at NEEM). At NGRIP, we have probably missed the first part of theLIG and probably the optimum of the LIG. The values indicated here correspond to the average over the 1000 oldest years recorded in the NGRIP ice core (119 to 120 ka on the AICC2012 timescale).
southeast of NEEM) where mean annual δ18O today is ap-proximately −35 ‰ (NEEM comm members, 2013). At thisdeposition site, the LIG isotopic anomaly is therefore 3.6 ‰,close to the value at Summit. We conclude that changes inδ18Oice are rather homogeneously ∼ 3.2–3.6 ‰ higher in theLIG than in the preindustrial period in central and northwestGreenland (Table 1).D-excess is not significantly different between the LIG
and the preindustrial period at the different drilling siteslisted in Table 1. Preindustrial d-excess values are also verysimilar among these different sites. This is the reason why ex-trapolating the surface d-excess values in the NEEM-NGRIPregions enables us to estimate the preindustrial d-excess atthe upstream NEEM deposition site to a conservative valueof 11 ‰.
Assuming that no abrupt climate change took place from122 to 126 ka (a hypothesis supported by the relatively flatNEEM δ18Oice record), changes in mean δ15N are expectedto reflect changes in LID. The spatial structure of the δ15Nchanges differs from the pattern of δ18Oice. Indeed, the small-est δ15N increase is observed at NGRIP (−0.02 ‰) (but therecord ends at 120 ka) and the largest one at GRIP and GISP2(−0.07 to −0.09 ‰), with an intermediate signal at NEEM(−0.04 ‰), albeit with an inherent uncertainty due to thelack of data for the NEEM deposition site today. Because ofstratigraphic disruptions, no continuous record is available atSummit. We thus cannot exclude that low δ15N levels ob-served at GRIP and GISP2 on 122–126 ka ice sections re-flect a temporary δ15N decrease caused by thermal fractiona-tion or firn shrinking as for the NEEM δ15N value at 2384 m(121 ka). We therefore note regional differences for the dif-ferent available datasets but stress their heterogeneities (timespan, discontinuity, and lack of present-day reference) pre-venting any robust conclusion.
3 Temperature reconstructions
3.1 Reconstructions based on δ18Oice
Today, NW Greenland accumulation is biased towards sum-mer precipitation (based on regional and general circula-tion atmospheric models; Steen-Larsen et al., 2011). NEEMsummer δ18Oice was monitored through continuous measure-ments of surface water vapor isotopic composition in 2010–2012 (Steen-Larsen et al., 2013, 2014), revealing a δ18Oice–temperature slope of 0.85 ‰ ◦C−1 on the intra-summer scale.From 1979 to 2007, the increasing trend of δ18Oice recordedin NEEM shallow ice cores was scaled to simulated andestimated local surface air temperature trends, resulting ina multi-decadal slope of 1.05± 0.2 ‰ ◦C−1 for warmingabove preindustrial conditions (Masson-Delmotte, 2015).These various estimates suggested that the average Holoceneδ18O–temperature relationship of 0.5 ‰ ◦C−1 based on thecalibration with borehole temperature data at other Green-land ice core sites (Vinther et al., 2009, 2010) may not bevalid for NEEM. Differences between Greenland locationsare expected due to changes in the seasonality of precip-itation (summer bias at NEEM but not in central or southGreenland) and moisture origin as well as possible changesin boundary layer stability and relationships between the sur-face and temperature.
Applying the multi-decadal temporal slope given above,the LIG δ18Oice anomaly at the NEEM deposition site trans-lates into a warming of 2.9–4.2 ◦C, twice smaller than the ini-tial estimate based on Holocene calibrations for other sites.Still, it is difficult to assess whether the present-day calibra-tion can apply to the LIG, marked by a different orbital forc-ing than today, likely with a reduced sea ice extent and dif-ferent moisture transport pathways (Sime et al., 2013). Thesecond-order isotopic parameter, the d-excess, can provideinformation on evaporation conditions. Present-day monitor-ing studies depict low d-excess values for subtropical mois-ture, contrasting with high d-excess values for moisture from
www.clim-past.net/12/1933/2016/ Clim. Past, 12, 1933–1948, 2016
1938 A. Landais et al.: How warm was Greenland during the last interglacial period?
sea ice margin areas (e.g., Steen-Larsen et al., 2015; Pfahl etal., 2014). The d-excess is also affected by distillation andwill decrease in polar regions if δ18Oice increases withoutany moisture source change. As noted above, available LIGd-excess data (Table 1) are slightly (insignificantly) abovepreindustrial levels. A stable or higher d-excess level to-gether with an δ18Oice increase is therefore understood to re-flect a slight poleward shift of moisture sources. In turn, thiswould imply reduced distillation for δ18Oice and a reducedslope of the relationship between δ18Oice and temperature(Sime et al., 2013) more in line with the average Holocenecalibration.
3.2 Reconstructions based on air δ15N
In the absence of abrupt surface temperature changes, δ15Nis only affected by the gravitational signal linked to firn LID;the latter is directly related to changes in temperature and ac-cumulation rate. Thus, if accumulation is known, past tem-perature changes can be inferred from δ15N. As neither ac-cumulation nor temperature is independently known for theLIG, we have to constrain the accumulation–temperature re-lationship in the past based on observation and/or models.We now describe the different steps of our procedure to esti-mate the temperature of the NEEM deposition site during theLIG from δ15N measurements.
3.2.1 Different estimates of the link betweentemperature and accumulation rate in Greenland
i. Accumulation rate and temperature can be linkedthrough thermodynamic laws and ice sheet topography,despite significant uncertainties associated with atmo-spheric transport characteristics that lead to regionalvariability (Kapsner et al., 1995; Merz et al., 2014b).In a first approximation, temperature and moisture con-tent of an air mass are linked through saturation pressure(“Psat approach”). This first-order relationship betweenaccumulation rate and temperature has long been usedfor Antarctic ice core chronologies (Lorius et al., 1985;Ritz, 1992), with
A(t)= A(t0)×
[(∂Psat/(T + 273))/∂T
]t[
(∂Psat/(T + 273))/∂T]t0
, (2)
where A(t) and A(t0) are the accumulation rates at timet and t0, respectively, Psat the saturation pressure overice, and T the temperature in ◦C.
ii. Empirical relationships between accumulation rate andGreenland temperature have been provided by differentmethods. The dataset obtained in 1952–1955 by Ben-son (1962) remains a reference today for evaluating sur-face accumulation rate reconstructions above the Green-land ice sheet (e.g., Hawley et al., 2014; Munk et al.,2003). Surface accumulation rate and temperature data
from 146 sites show an exponential increase in accumu-lation rate versus temperature. Within the associated 1σenvelope, the increase encompasses the accumulationrate versus temperature increase deduced from the Psatapproach. This spatial relationship between accumula-tion rate and temperature is however associated with avery large uncertainty envelope challenging the validityof any relationship between temperature and accumula-tion in Greenland.
iii. Based on the GISP2 ice core records over the lastdeglaciation, Kapsner et al. (1995) showed that the re-lationship between Greenland accumulation rate andtemperature was not stable because of variations inatmospheric circulation. Still, they were able to pro-pose a temporal relationship between accumulation ratebased on annual layer counting and δ18O – or tem-perature reconstructed from δ18O – and a calibrationbased on borehole temperature measurements (leadingto a δ18O vs. temperature slope of 0.53 ‰ ◦C−1). Theinferred sensitivity of snow accumulation rate to tem-perature change during the interglacial period variesfrom 0.9 % ◦C−1 (Holocene) to 7.5 % ◦C−1 (Bølling-Allerød), with an uncertainty encompassing zero.
More recently, Buchardt et al. (2012) followed a similarapproach but using numerous ice cores. They used anarray of 52 shallow ice cores spanning the last decadesto centuries with accumulation rate estimates from an-nual layer counting on δ18Oice profiles. They identifieddifferent temperature vs. accumulation rate relation-ships from one region to another. In central and northGreenland corresponding to the location of the NEEM,NGRIP, GRIP and GISP2 deep ice cores, the Buchardtapproach suggests a sensitivity of 1.5 to 9.4 % ◦C−1
with an uncertainty encompassing zero. This sensitiv-ity is obtained with a δ18O vs. temperature sensitivityslope of 0.67 ‰ ◦C−1 so that the Kapsner and Buchardtestimates agree on a 0 to 14 % ‰−1 accumulation ratevs. δ18O sensitivity.
iv. Masson-Delmotte et al. (2015) used estimates of snowaccumulation rate and ice δ18O in four shallow coresin the NEEM area together with accumulation rate,temperature and when possible snowfall δ18O recon-structions from different model simulations (ECHAM5,Global Climate Model developed by the Max PlanckInstitute for Meteorology; LMDZ, Global ClimateModel developed by the Laboratoire de MétéorologieDynamique; MAR, Modèle Atmosphérique Régional)nudged to available climate reanalyses over the 1979–2007 period. In addition to model outputs or tempera-ture gridded reconstruction (Box et al., 2009), the am-plitude of temperature increase at NEEM can also beestimated using borehole temperature measurements.Gathering the different sources of information for the
Clim. Past, 12, 1933–1948, 2016 www.clim-past.net/12/1933/2016/

A. Landais et al.: How warm was Greenland during the last interglacial period? 1939
strong warming period of 1979–2007 leads to a rela-tively high slope between accumulation rate and tem-perature (10 to 15.9 % ◦C−1, the highest value beingobtained using outputs from the MAR model nudgedto ERA-40 and ERA-Interim reanalyses; Uppala et al.,2005; Dee et al., 2011). In this study, the sensitivity ofaccumulation rate vs. δ18O can be estimated through theregression between the NEEM δ18O and accumulationrate increases over the period 1979–2007, leading toa value of 10 % ‰−1, in agreement with the Buchardtestimate. Another solution is to use the δ18O vs. tem-perature estimate based on NEEM δ18O measurementsvs. borehole temperature over the recent warming trend(0.8 ‰ ◦C−1) together with the accumulation rate vs.temperature estimate given above, hence leading to amaximum accumulation rate vs. δ18O sensitivity of13 % ‰−1, again within the range of the Buchardt es-timate .
v. Alternative estimates of accumulation rate at the NEEMdeposition site are also provided by 10Be data. Sturevik-Storm et al. (2014) compiled the mean Holocene 10Beconcentration over eight Greenland sites and deter-mined the spatial relationship against mean accumula-tion rate estimates. This relationship was then appliedto LIG 10Be data from NEEM, leading to the conclu-sion that the accumulation rate was 65–90 % higher thantoday at the NEEM deposition site (“10Be approach”).However, the present-day spatial gradients in 10Be con-centration are caused by spatially varying contributionsof wet deposition to the overall 10Be deposition, as-suming a homogeneous atmospheric 10Be aerosol de-position over Greenland. This latter assumption impliesthat the atmosphere above Greenland is well mixedwith respect to 10Be after transport from the loca-tion of troposphere–stratosphere foldings. These are themain entrance pathways of stratospheric aerosols intothe extratropical Northern Hemisphere troposphere. TheLIG climate is characterized not only by likely en-hanced precipitation above Greenland (accumulation)but also higher wet deposition during aerosol transportto Greenland due to higher precipitation rates. As a re-sult, higher scavenging of 10Be-bearing aerosol en routemust have led also to a lower atmospheric 10Be concen-tration over Greenland than today. The LIG accumula-tion estimate by Sturevik-Storm et al. (2014) is there-fore most likely an overestimation and the assumptionof Sturevik-Storm et al. (2014) that 10Be concentrationis only controlled by the accumulation rate at the NEEMsite may be challenged. More generally, the use of otherchemical aerosol species as accumulation rate tracers ishampered by potential changes in the LIG atmosphericconcentrations due to emission changes. Qualitatively,a correction of deposition effects using the Buchardt etal. (2012) approach, representative of northwest Green-
land, leads to LIG atmospheric concentrations of allchemical aerosol tracers similar to today. In contrastmuch higher LIG accumulation rates as estimated bySturevik-Storm et al. (2014) or no changes in accumula-tion between the LIG and the Holocene imply an unre-alistic change in atmospheric aerosol concentrations forseveral aerosol tracers. Indeed, if we compare aerosolspecies that are dominated by wet deposition such asNa+ (sea salt aerosol) and NO−3 (lightning activity, bio-logical activity), we see that the concentration in the icein the LIG is lower than in the Holocene (about 50 %).As these species are mainly wet deposited, this is onlypossible if the atmospheric aerosol concentration wasalso reduced by 50 % at that time. It is unlikely thatboth Na+ and NO−3 (which have completely differentsources and transport pathways) have a 50 % reductionof source emissions. Another solution to explain the re-duction of 50 % in atmospheric Na+ and NO−3 concen-tration over the ice is to imply an increase in the pre-cipitation rate along the transport pathway and thus anincrease in wet deposition en route. The chemistry sug-gests that the precipitation rate during transport in theNorthern Hemisphere was significantly higher duringthe LIG than during the Holocene and there is no rea-son why Greenland would not be affected by this gen-eral increased accumulation rate. Based on the changesin various chemical tracers in the ice (sea salt aerosol,biogenic aerosol, mineral dust), we thus conclude thatthe LIG accumulation was likely 20 % higher than inthe preindustrial period and similar to the Buchardt ap-proach for northwest Greenland.
vi. Atmospheric general circulation model outputs do notsuggest important changes in accumulation rate for theLIG compared to preindustrial values, in line with thesmall simulated change in annual mean surface temper-ature (Sect. 3.3). A comparison of some of the modeloutputs (presented in Lunt et al., 2013) shows very lim-ited accumulation increase (less than 5 %) over cen-tral Greenland. Stronger increases in accumulation ratein the LIG associated with significantly warmer thanpreindustrial temperature were obtained in relation toa reduction of sea ice in the Nordic Seas (10 % increasein accumulation; Merz et al., 2016). Finally, it has beenshown that the geometry of the Greenland ice sheet andtopographic changes can lead to various local accumu-lation scenarios for the LIG at the upstream NEEM de-position site (Merz et al., 2014b): depending on the pre-scribed LIG ice sheet topography, the modeled accumu-lation rate at LIG can be 25 % lower to 13 % higher thanthe preindustrial accumulation rate. The lowest estimateis linked to a change in the trajectory of air mass to theNEEM deposition site, with an increased eastward ori-gin. The validity of such a scenario could be assessed bycomparing simulated and measured d-excess variations.
www.clim-past.net/12/1933/2016/ Clim. Past, 12, 1933–1948, 2016
1940 A. Landais et al.: How warm was Greenland during the last interglacial period?
The data presently available show similar d-excess lev-els in the LIG and preindustrial periods and thereforedo not support a significant change in moisture sourceand trajectory (Table 1). Often associated with relativelysmall temperature changes, these modeled accumula-tion rate scenarios for the LIG are at the lower end ofthe accumulation rate scenarios discussed above and en-compass the possibility of a scenario with no change inthe accumulation rate.
3.2.2 Measured vs. modeled evolution of δ15N withrespect to temperature and accumulation ratechanges
Our δ15N data are compared with those simulated using a firndensification model forced by these different accumulationrate versus temperature relationships for the LIG. The firni-fication model relates LID to accumulation rate and temper-ature. Here, we use the Goujon et al. (2003) model in steadystate to calculate LID and the barometric Eq. (1) to translateLID changes into δ15N changes.
The model correctly captures the present-day δ15N valuesfor NEEM and NGRIP, using the current mean values foraccumulation rate and temperature (Fig. 3). At NEEM andNGRIP, firn studies have recently provided an accurate de-termination of the LID and δ15N profiles (Guillevic et al.,2013; Buizert et al., 2013). At GISP2, there exists no properdetermination of the LID due to discontinuous sampling ofair bottles and a large scatter of δ15N values measured at thebottom of the firn, ranging between 0.305 and 0.325 ‰ (Ben-der et al., 2006). An average value of 0.31 ‰ is obtained fromhigh-resolution δ15N measurements over the last 4000 yearson the GISP2 core (Kobashi et al., 2008). For the present day,our simulation at GISP2 (δ15N of 0.325 ‰) therefore lies atthe upper limit of available measurements (Table 1).
3.2.3 Reconstructing Greenland LIG temperature
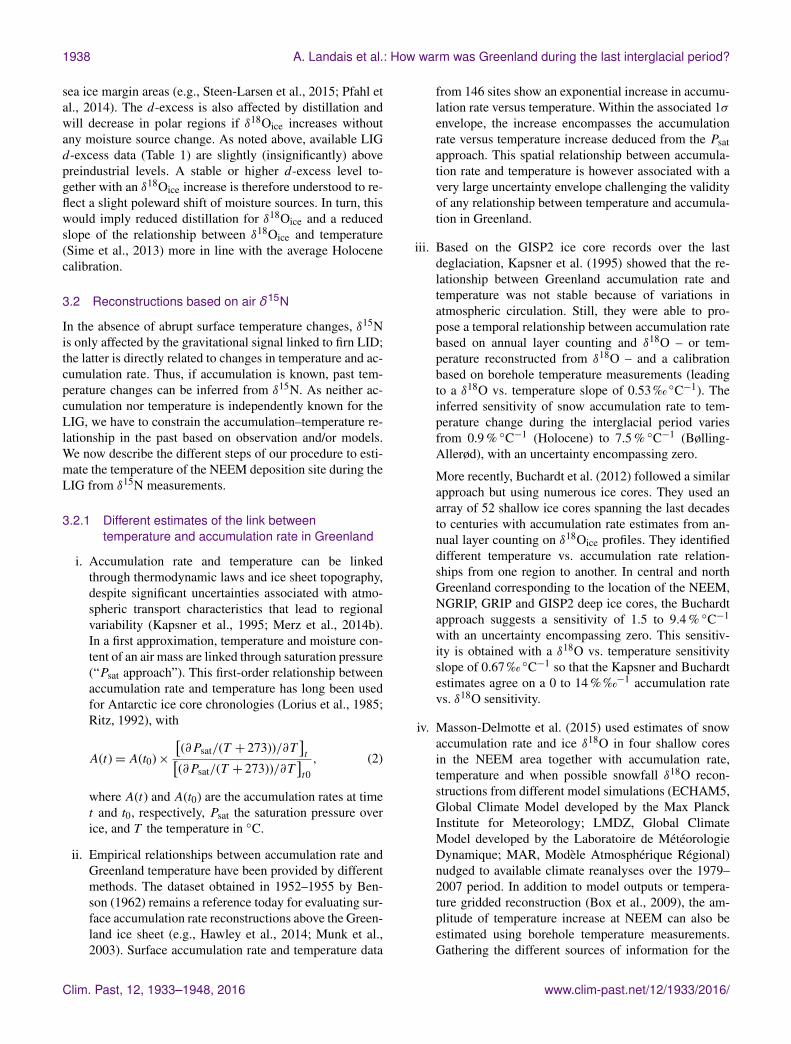
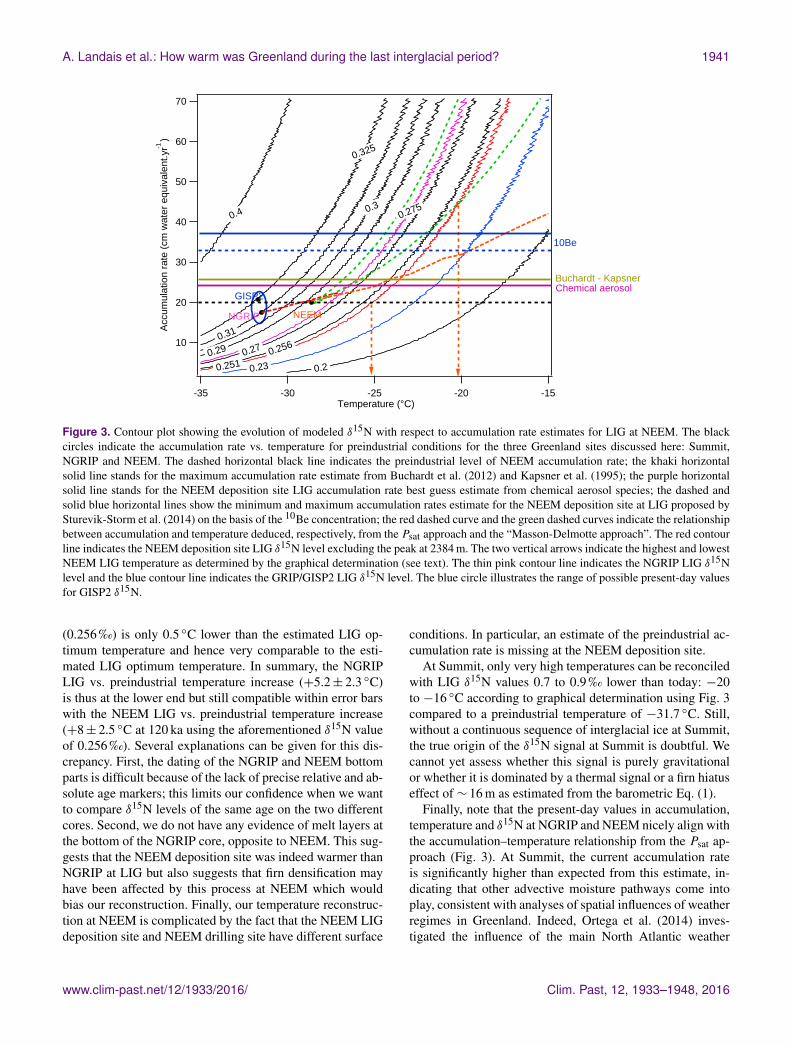
In order to estimate the LIG firn temperature (at the depo-sition sites), Fig. 3 displays the δ15N data points for eachice core site on contours of the simulated δ15N values as afunction of temperature and accumulation. In addition, wedisplay the different accumulation rate estimates detailed inSect. 3.2.1. We use the different relationships for accumu-lation rate vs. δ18O sensitivity together with the 2.1 ‰ in-crease between the present-day δ18O at NEEM and the LIGδ18O at the NEEM deposition site to infer a range of accu-mulation rates for the NEEM LIG, compatible with the ap-proaches of Buchardt et al. (2012), Kapsner et al. (1995) andMasson-Delmotte et al. (2015). We indicate the possibilityfor no change in accumulation rate. We also display the ac-cumulation rate vs. temperature relationships from the Psatapproach and from Masson-Delmotte et al. (2015).
For the NEEM LIG deposition site, we detail below thegraphical determination of the temperature of the firn col-
umn. The intersection between the δ15N contour and the “ac-cumulation rate vs. temperature” evolution curve or the hor-izontal lines showing LIG possible accumulation rate levelsgives the range of realistic LIG accumulation rate (y axis)and temperature (x axis). Let us assume that the LIG ac-cumulation rate at the NEEM deposition site was the sameas today at NEEM, despite increasing temperature. In thisconservative case, our δ15N data point to a 3.5 ◦C warmerfirn column. Assuming a 20 % accumulation increase at theNEEM deposition site leads to an estimate of 4.5 ◦C surfacewarming between the NEEM upstream deposition site andthe current NEEM firn temperature. From the intersectionbetween the δ15N level measured in the NEEM LIG sectionand the accumulation rate estimates from the Psat approachor the maximum accumulation rate deduced from Buchardtet al. (2012) and Kapsner et al. (1995), we obtain a larger esti-mate of 6–7 ◦C warming of the firn column at the NEEM LIGdeposition site compared to the current NEEM firn tempera-ture. This corresponds to an accumulation rate of 26–30 cmwater equivalent yr−1, i.e., 32–50 % higher than the present-day accumulation rate at NEEM. The highest LIG warmingcompatible with the δ15N data (almost −20 ◦C, i.e., about9 ◦C above present-day NEEM values at the upstream NEEMdeposition site) corresponds to an accumulation rate of 46 cmwater equivalent yr−1, i.e., 130% higher than the present-day accumulation rate at NEEM, using the slope for the re-lationship between accumulation rate vs. temperature givenin Masson-Delmotte et al. (2015). For the 10Be approach,which represents an upper limit of the possible accumulationincrease, we find a LIG temperature 7–8 ◦C warmer than atthe current drilling site. When corrected for the change indeposition site, this translates to a 6–11 ◦C higher tempera-ture at the NEEM deposition site for LIG compared to thepreindustrial temperature level.
At NGRIP, the same graphical approach leads to an es-timated temperature of −28.5 to −24 ◦C at the end ofthe LIG (120 ka on the AICC2012 timescale) compared to−31.5 ◦C for the preindustrial period, i.e., a difference of+5.2± 2.3 ◦C between 120 ka and the preindustrial period.Even if NGRIP is not on a dome, the upstream effect isquite small: the NGRIP LIG deposition site is estimated tolie 48 km upstream in the direction of Summit with smallassociated altitude gradients between NGRIP and Summit(Buchardt, 2012). Similar to the NEEM temperature recon-struction, the NGRIP LIG temperature uncertainty rangearises from the uncertainty in the accumulation rate vs. tem-perature relationship. The full range of estimates for the ac-cumulation difference at NGRIP from the preindustrial pe-riod to the LIG is hence estimated to be 0–100% of the prein-dustrial value. This+5.2± 2.3 ◦C warming at 120 ka may bean underestimation of the full warming range encompassedduring the LIG because the NGRIP ice core does not extendtowards the warmest part of the LIG. At the NEEM depo-sition site however, the temperature estimated following thegraphical method of Fig. 3 from the δ15N value at 120 ka
Clim. Past, 12, 1933–1948, 2016 www.clim-past.net/12/1933/2016/
A. Landais et al.: How warm was Greenland during the last interglacial period? 1941
70
60
50
40
30
20
10
Acc
umul
atio
n ra
te (
cm w
ater
equ
ival
ent.y
r)
-1
-35 -30 -25 -20 -15Temperature (°C)
NEEMNGRIP
GISP2
10Be
Buchardt - KapsnerChemical aerosol
0.4
0.325
0.31
0.3
0.29
0.275
0.27 0.256
0.251 0.23 0.2
Figure 3. Contour plot showing the evolution of modeled δ15N with respect to accumulation rate estimates for LIG at NEEM. The blackcircles indicate the accumulation rate vs. temperature for preindustrial conditions for the three Greenland sites discussed here: Summit,NGRIP and NEEM. The dashed horizontal black line indicates the preindustrial level of NEEM accumulation rate; the khaki horizontalsolid line stands for the maximum accumulation rate estimate from Buchardt et al. (2012) and Kapsner et al. (1995); the purple horizontalsolid line stands for the NEEM deposition site LIG accumulation rate best guess estimate from chemical aerosol species; the dashed andsolid blue horizontal lines show the minimum and maximum accumulation rates estimate for the NEEM deposition site at LIG proposed bySturevik-Storm et al. (2014) on the basis of the 10Be concentration; the red dashed curve and the green dashed curves indicate the relationshipbetween accumulation and temperature deduced, respectively, from the Psat approach and the “Masson-Delmotte approach”. The red contourline indicates the NEEM deposition site LIG δ15N level excluding the peak at 2384 m. The two vertical arrows indicate the highest and lowestNEEM LIG temperature as determined by the graphical determination (see text). The thin pink contour line indicates the NGRIP LIG δ15Nlevel and the blue contour line indicates the GRIP/GISP2 LIG δ15N level. The blue circle illustrates the range of possible present-day valuesfor GISP2 δ15N.
(0.256 ‰) is only 0.5 ◦C lower than the estimated LIG op-timum temperature and hence very comparable to the esti-mated LIG optimum temperature. In summary, the NGRIPLIG vs. preindustrial temperature increase (+5.2± 2.3 ◦C)is thus at the lower end but still compatible within error barswith the NEEM LIG vs. preindustrial temperature increase(+8± 2.5 ◦C at 120 ka using the aforementioned δ15N valueof 0.256 ‰). Several explanations can be given for this dis-crepancy. First, the dating of the NGRIP and NEEM bottomparts is difficult because of the lack of precise relative and ab-solute age markers; this limits our confidence when we wantto compare δ15N levels of the same age on the two differentcores. Second, we do not have any evidence of melt layers atthe bottom of the NGRIP core, opposite to NEEM. This sug-gests that the NEEM deposition site was indeed warmer thanNGRIP at LIG but also suggests that firn densification mayhave been affected by this process at NEEM which wouldbias our reconstruction. Finally, our temperature reconstruc-tion at NEEM is complicated by the fact that the NEEM LIGdeposition site and NEEM drilling site have different surface
conditions. In particular, an estimate of the preindustrial ac-cumulation rate is missing at the NEEM deposition site.
At Summit, only very high temperatures can be reconciledwith LIG δ15N values 0.7 to 0.9 ‰ lower than today: −20to −16 ◦C according to graphical determination using Fig. 3compared to a preindustrial temperature of −31.7 ◦C. Still,without a continuous sequence of interglacial ice at Summit,the true origin of the δ15N signal at Summit is doubtful. Wecannot yet assess whether this signal is purely gravitationalor whether it is dominated by a thermal signal or a firn hiatuseffect of ∼ 16 m as estimated from the barometric Eq. (1).
Finally, note that the present-day values in accumulation,temperature and δ15N at NGRIP and NEEM nicely align withthe accumulation–temperature relationship from the Psat ap-proach (Fig. 3). At Summit, the current accumulation rateis significantly higher than expected from this estimate, in-dicating that other advective moisture pathways come intoplay, consistent with analyses of spatial influences of weatherregimes in Greenland. Indeed, Ortega et al. (2014) inves-tigated the influence of the main North Atlantic weather
www.clim-past.net/12/1933/2016/ Clim. Past, 12, 1933–1948, 2016
1942 A. Landais et al.: How warm was Greenland during the last interglacial period?
regimes in Greenland and stressed differences between Sum-mit (affected by NAO+ and NAO− weather regimes) andnorth/northwest Greenland (more strongly affected by, e.g.,the North Atlantic Ridge regime). Accordingly, we do notinclude the Summit values in our conclusions.
3.2.4 Limitations of the δ15N-based temperaturereconstruction at the NEEM sites
In the following, limits inherent to this δ15N approach arehighlighted, which shall motivate further studies to refine thetemperature estimate. First, we have applied a firnificationmodel optimized for present-day central Greenland firn topast periods with different, warmer conditions, outside therange of model validation. For instance, the occurrence ofsubstantial summer melt could accelerate firn densificationand produce a smaller close-off depth (and therefore smallerδ15N values) than expected from the Goujon model for agiven temperature. In principle, the validity of firn models insuch a temperature range can be tested if firn studies are per-formed at Greenland sites which are today warmer than thecentral deep drilling sites of Summit, NGRIP and NEEM, butno data are yet available. Second, the relative changes in ac-cumulation rates and temperature between the NEEM depo-sition site and NEEM remain difficult to estimate. Finally, wehave identified a negative peak in the NEEM LIG δ15N pro-file, at 2384 m (121 ka), with no parallel signal in δ18Oice orin chemical records. This signal challenges our attribution ofδ15N variations solely to changes in accumulation rate and/ortemperature and suggests the potential influence of surfacemelt on firn depth, LID and therefore δ15N. While the over-all stability of the NEEM δ15N record over the LIG supportsa gravitational/climatic interpretation, a dominant influenceof surface melt explaining a removal of snow cannot be ex-cluded for the Summit ice core sections associated with verylow δ15N (0.23 ‰).
3.3 LIG temperatures in Greenland as estimated byclimate models
The LIG climate has been simulated by a suite of climatemodels of various complexities. Most of these simulationsare included in the model intercomparison studies of Lunt etal. (2013) and Bakker et al. (2013, 2014). The former studycompared equilibrium (“snap-shot”) simulations, coveringtime slices within the early LIG (125–130 ka), to tempera-ture proxy data, whereas the latter studies discussed transientsimulations covering the entire LIG. The equilibrium simu-lations are all described in detail in Lunt et al. (2013): theycomprise 11 general circulation models (GCMs) and 3 earthsystem models of intermediate complexity (EMICs). The res-olution varies between T21 (∼ 5.6× 5.6◦) for the EMICs toT85 (∼ 1.4◦) for the highest-resolution model. All the resultsare interpolated to grids of 3.75◦(longitude)× 2.5◦(latitude).The transient simulations are described in detail in Bakker et
al. (2013, 2014). These are also a combination of GCMs andEMICs, but the highest resolution is only about 3.75◦. Themain forcing for all the simulations is through orbital param-eters and greenhouse gasses. Note that in the majority of thesimulations the land–sea configuration, ice sheet extent andheight are kept the same as in their respective preindustrialsimulations.
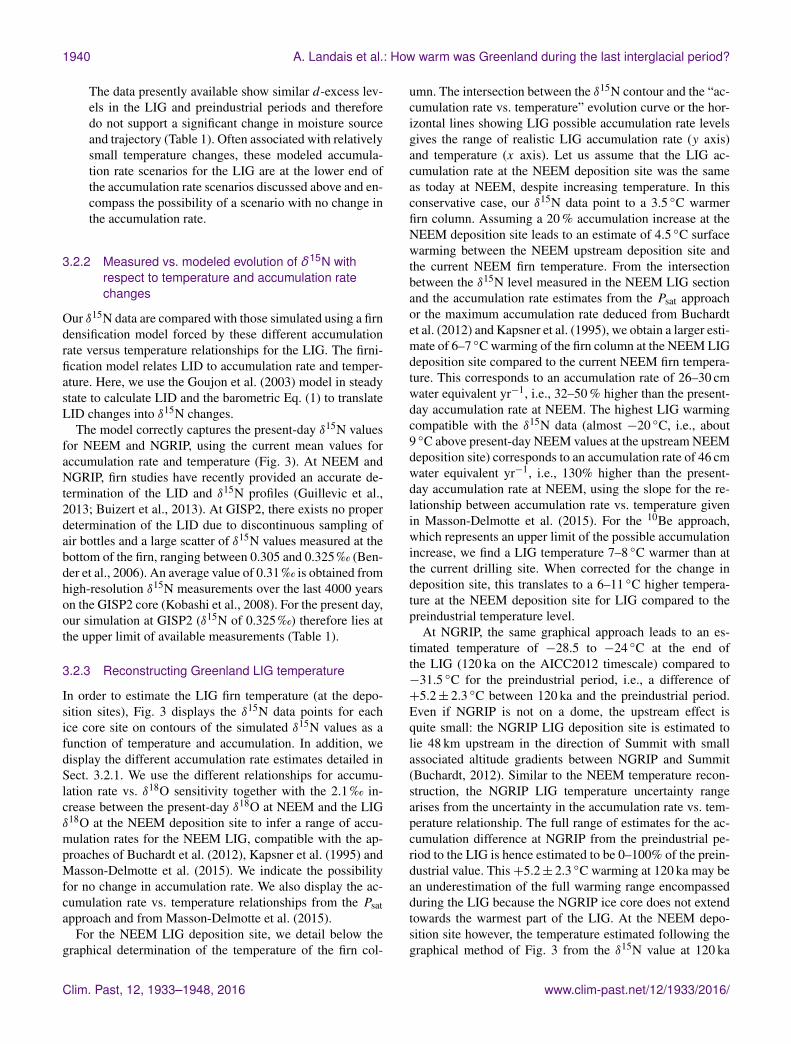
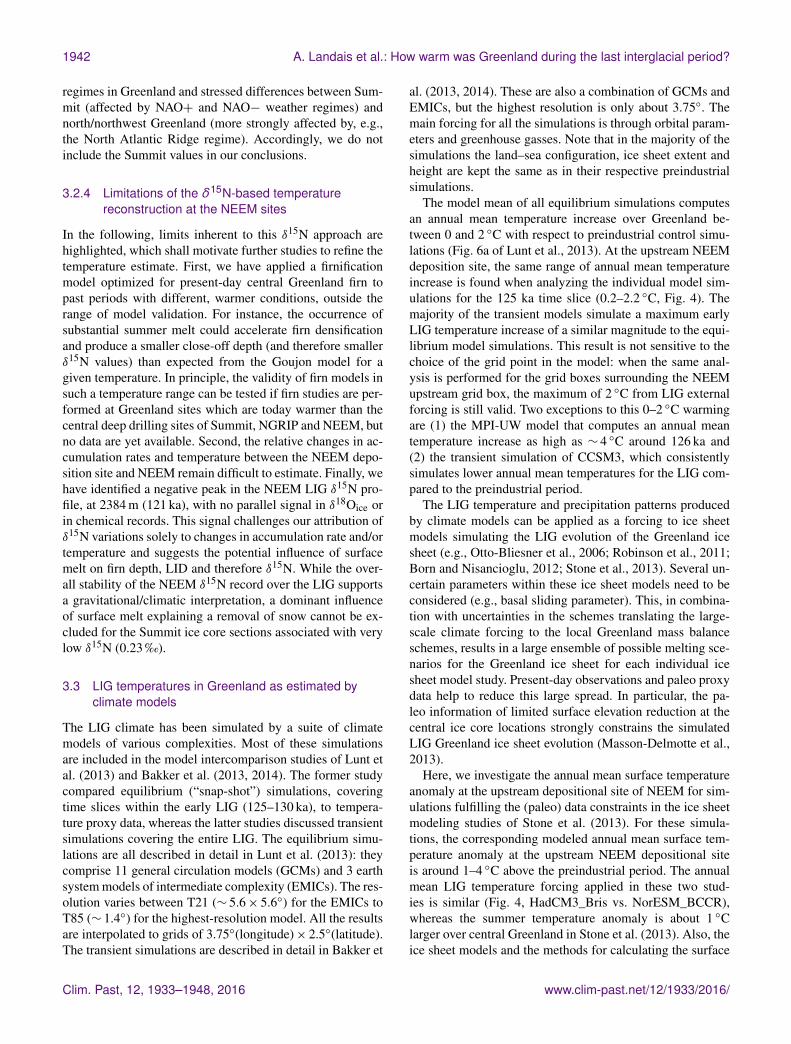
The model mean of all equilibrium simulations computesan annual mean temperature increase over Greenland be-tween 0 and 2 ◦C with respect to preindustrial control simu-lations (Fig. 6a of Lunt et al., 2013). At the upstream NEEMdeposition site, the same range of annual mean temperatureincrease is found when analyzing the individual model sim-ulations for the 125 ka time slice (0.2–2.2 ◦C, Fig. 4). Themajority of the transient models simulate a maximum earlyLIG temperature increase of a similar magnitude to the equi-librium model simulations. This result is not sensitive to thechoice of the grid point in the model: when the same anal-ysis is performed for the grid boxes surrounding the NEEMupstream grid box, the maximum of 2 ◦C from LIG externalforcing is still valid. Two exceptions to this 0–2 ◦C warmingare (1) the MPI-UW model that computes an annual meantemperature increase as high as ∼ 4 ◦C around 126 ka and(2) the transient simulation of CCSM3, which consistentlysimulates lower annual mean temperatures for the LIG com-pared to the preindustrial period.
The LIG temperature and precipitation patterns producedby climate models can be applied as a forcing to ice sheetmodels simulating the LIG evolution of the Greenland icesheet (e.g., Otto-Bliesner et al., 2006; Robinson et al., 2011;Born and Nisancioglu, 2012; Stone et al., 2013). Several un-certain parameters within these ice sheet models need to beconsidered (e.g., basal sliding parameter). This, in combina-tion with uncertainties in the schemes translating the large-scale climate forcing to the local Greenland mass balanceschemes, results in a large ensemble of possible melting sce-narios for the Greenland ice sheet for each individual icesheet model study. Present-day observations and paleo proxydata help to reduce this large spread. In particular, the pa-leo information of limited surface elevation reduction at thecentral ice core locations strongly constrains the simulatedLIG Greenland ice sheet evolution (Masson-Delmotte et al.,2013).
Here, we investigate the annual mean surface temperatureanomaly at the upstream depositional site of NEEM for sim-ulations fulfilling the (paleo) data constraints in the ice sheetmodeling studies of Stone et al. (2013). For these simula-tions, the corresponding modeled annual mean surface tem-perature anomaly at the upstream NEEM depositional siteis around 1–4 ◦C above the preindustrial period. The annualmean LIG temperature forcing applied in these two stud-ies is similar (Fig. 4, HadCM3_Bris vs. NorESM_BCCR),whereas the summer temperature anomaly is about 1 ◦Clarger over central Greenland in Stone et al. (2013). Also, theice sheet models and the methods for calculating the surface
Clim. Past, 12, 1933–1948, 2016 www.clim-past.net/12/1933/2016/
A. Landais et al.: How warm was Greenland during the last interglacial period? 1943
Figure 4. Annual mean temperature anomaly relative to preindustrial control simulations for the upstream NEEM depositional site extractedfrom transient and equilibrium climate model simulations. Note the similarity for the annual mean temperature increase at 125 and 130ka assimulated by HadCM3_Bris and NorESM_BCCR. For more information on the climate models and the simulations themselves, we refer tothe compilation studies and references therein (Bakker et al., 2013, 2014; Lunt et al., 2013).
mass balance from the climate forcing are different. How-ever, the surface temperature anomaly scenario in these stud-ies is mainly restricted by the limited surface elevation reduc-tion during the LIG implied by NEEM data (NEEM commu-nity members, 2013). Assuming this elevation reconstructionto be correct, ice sheet simulations associated with a surfacetemperature anomaly higher than approximately 4–5 ◦C areinterpreted to reflect too large an elevation lowering at the icecore locations and are therefore rejected.
In the modeling studies described above, the feedback ofchanges in surface elevations on the climate is either not in-cluded (surface topography is kept fixed) or not well resolveddue to coarse model resolution (Stone et al., 2013). However,Merz et al. (2014a) showed that a steeper surface slope cancause an additional 1–3 ◦C surface air temperature increasedue to an increase in katabatic winds which foster downwardflux of sensible heat. In order for this effect to be importantfor NEEM, the ice sheet geometry needs to change such thatits LIG depositional site is closer to the rim of the ice sheet,e.g., with large melting in northeast Greenland.
Confirming the suggestion of Sime et al. (2013), Merz etal. (2016) used the CCSM3 and CCSM4 models to demon-
strate that the large spread in Greenland SAT change amongthe LIG equilibrium simulations (Fig. 4, Lunt et al., 2013)is mostly due to differences in simulated sea ice extent.They showed that surface air temperature and accumulationchanges at the NEEM LIG deposition site are particularlysensitive to sea ice retreat in the Nordic Seas.
In summary, studies performed with atmospheric modelssuggest that a number of processes may combine to producelarger amplitude of warming as simulated in state-of-the-artcoupled climate models. They suggest that Greenland LIGsurface air temperature change can be amplified in responseto regional sea ice retreat and in response to a change in theice sheet topography. For the NEEM deposition site, LIG an-nual mean surface temperatures of approximately 5 ◦C abovepreindustrial temperatures can be obtained: 2 ◦C being due toLIG external forcing (orbital and greenhouse gases), 0.6 to2.3 ◦C to be attributed to a decrease in sea ice in the NordicSeas and 1 to 2 ◦C associated with a moderately smallerGreenland ice sheet (GrIS). Higher temperatures might bepossible in more extreme scenarios; however, then it is un-likely that the ice sheet can maintain surface elevations rela-tively close to modern values for all central deep ice core lo-
www.clim-past.net/12/1933/2016/ Clim. Past, 12, 1933–1948, 2016

1944 A. Landais et al.: How warm was Greenland during the last interglacial period?
cations as suggested by the ice core records. The coherencybetween scenarios of large surface air temperature warmingand the plausibility of the Greenland ice sheet response stillremains to be fully explored. This includes specific analysesof the seasonal aspects of the surface air temperature changebut also scrutinizing the elevation change reconstruction ofthe Greenland ice sheet during the LIG based on air contentmeasurements (NEEM community members, 2013).
4 Conclusions and perspectives
In this study, we have compiled the Greenland ice core dataand methods available to quantify LIG temperature change.New estimates of temperature change were provided basedon δ15N and firn densification modeling, largely independentof water stable isotope data. They imply that the mean an-nual firn temperature at the LIG deposition site, upstream ofthe current NEEM site, experienced 6–11 ◦C warming, with-out correcting for changes in elevation related to ice thick-ness change. As a comparison, the initial estimate of NEEMcommunity members (2013) based on δ18O–temperature re-lationships calibrated against Holocene data led to a LIG sur-face air temperature at the upstream NEEM deposition site5.7–9.3 ◦C warmer than in the preindustrial period (NEEMcommunity members, 2013).
In addition to the δ15N temperature reconstruction, icecore data provide multiple lines of evidence of significantlywarmer conditions, at least during summer, at the upstreamNEEM deposition site during the LIG than today at theNEEM site such as in situ CH4 production likely due to sum-mer melt and firn shrinking suggested by the δ15N peak at2384 m.
However, it shall be noted that our reconstruction is as-sociated with large uncertainties because the Greenland ac-cumulation rate during the LIG is not precisely constrained.In addition, uncertainties are enhanced at NEEM because ofthe distance between the locations of the NEEM drilling siteand the NEEM deposition site. The NGRIP site was less af-fected by ice flow and the temperature estimate is 3–7.5 ◦Chigher at 120 ka than for the preindustrial period. This tem-perature estimate corresponds to the lower limit of the LIGtemperature estimate for the NEEM deposition site and sug-gests that the upper limit of this temperature reconstructionat the NEEM deposition site is not realistic because of toohigh an accumulation rate.
The evidence of summer melt in the LIG section of theNEEM core is an additional limitation of our approach for theNEEM temperature reconstruction that shall be taken into ac-count. Melting and refreezing, which accelerates firnificationprocesses, is not included in our firnification model, which,strictly speaking, is only valid for the dry snow zone. Still, theoccurrence of extensive summer melt implies that mean sum-mer temperatures at the site of deposition frequently reachedthe melting point, which is about 5 ◦C higher than preindus-
trial mean summer temperatures at NEEM. Accordingly, theLIG surface conditions were very similar to the extraordinary2012 heat wave over Greenland, which led to substantial sur-face melting at the NEEM site.
Large warming at the NEEM deposition site is difficultto reconcile with climate simulations in response to orbitalforcing and greenhouse gas concentration forcing only whenkeeping the LIG ice sheet thickness similar to today’s value.State-of-the-art intermediate complexity or fully coupled cli-mate models mostly produce an annual mean temperatureincrease of less than 2 ◦C above preindustrial values duringthe LIG in NW Greenland. However, sea ice cover retreat inthe Nordic Seas and changes in Greenland ice sheet topog-raphy may significantly enhance surface warming (Merz etal., 2014a, 2016) and therefore reduce the gap with our esti-mate. Vice versa, relaxing the ice sheet thickness constraintderived from the ice core measurements (NEEM communitymembers, 2013) allows for much stronger surface warmingat the LIG deposition sites.
Further work is required to overcome the unavoidable lim-itations of firn in our temperature estimate. New firn monitor-ing studies in Greenland areas affected by summer melt andin today’s ablation zone are crucially needed to improve firnmodeling and interpretation of the δ15N signal, especiallyfor the sharp anomaly suggested to reflect 16 m firn shrink-ing. Similarly, monitoring of water stable isotopes in Arcticwater vapor is also critical to better understand and modelthe relationships between atmospheric circulation, moisturetransport pathways, snow–vapor isotopic exchanges and theisotopic composition above the Greenland ice sheet.
Acknowledgements. NEEM is directed and organized bythe Centre of Ice and Climate at the Niels Bohr Institute andUS NSF, Office of Polar Programs. It is supported by fundingagencies and institutions in Belgium (FNRS-CFB and FWO),Canada (NRCan/GSC), China (CAS), Denmark (FIST), France(IPEV, CNRS/INSU, CEA and ANR), Germany (AWI), Iceland(RannIs), Japan (NIPR), South Korea (KOPRI), the Netherlands(NWO/ALW), Sweden (VR), Switzerland, the United Kingdom(NERC) and the USA (USNSF, Office of Polar Programs) andthe EU Seventh Framework programs. The Division for Climateand Environmental Physics, Physics Institute, University of Bern,acknowledges continuing support by the Swiss National ScienceFoundation as well as access to the infrastructure at the SwissNational Supercomputing Centre. The HadCM3 climate modelsimulations were carried out using the computational facilities ofthe Advanced Computing Research Centre, University of Bristol– http://www.bris.ac.uk/acrc/. This project benefitted from supportfrom Past4Future “Climate change – Learning from the past cli-mate”, a collaborative project under the 7th Framework Programmeof the European Commission (grant agreement no. 243908).Petra M. Langebroek is funded by the Research Council of Norwaythrough the IceBed project (221598). This work was supportedby European Research Council Advanced Grant no. 246815WATERundertheICE. The research leading to these results hasreceived funding from the European Research Council under the
Clim. Past, 12, 1933–1948, 2016 www.clim-past.net/12/1933/2016/
A. Landais et al.: How warm was Greenland during the last interglacial period? 1945
European Union’s Seventh Framework Programme (FP7/2007-2013)/ERC grant agreement no. 306045 (COMBINISO) andfrom Agence Nationale de la Recherche (ANR-07-VULN-0009and ANR-10-CEPL-0008). We thank the two reviewers for theirhelpful comments that permitted us to significantly improve thefirst version of this manuscript.
Edited by: A. DuttonReviewed by: E. W. Wolff and one anonymous referee
References
Arthern, R. J., Vaughan, D. G., Rankin, A. M., Mulvaney, R., andThomas, E. R.: In situ measurements of Antarctic snow com-paction compared with predictions of models, J. Geophys. Res.-Earth Surf., 115, F03044, doi:10.1029/2009JF001543, 2010.
Bakker, P., Masson-Delmotte, V., Martrat, B., Charbit, S., Renssen,H., Gröger, M., Krebs-Kanzow, U., Lohmann, G., Lunt, D. J.,Pfeiffer, M., Phipps, S. J., Prange, M., Ritz, S. P., Stenni, B.,Stone, E. J., and Varma, V.: Temperature trends during thePresent and Last Interglacial periods – a multi-model-data com-parison, Quaternary Sci. Rev., 99, 224–243, 2014.
Bakker, P., Stone, E. J., Charbit, S., Gröger, M., Krebs-Kanzow, U.,Ritz, S. P., Varma, V., Khon, V., Lunt, D. J., Mikolajewicz, U.,Prange, M., Renssen, H., Schneider, B., and Schulz, M.: Lastinterglacial temperature evolution – a model inter-comparison,Clim. Past, 9, 605–619, doi:10.5194/cp-9-605-2013, 2013.
Bazin, L., Landais, A., Lemieux-Dudon, B., Toyé MahamadouKele, H., Veres, D., Parrenin, F., Martinerie, P., Ritz, C., Capron,E., Lipenkov, V., Loutre, M.-F., Raynaud, D., Vinther, B., Svens-son, A., Rasmussen, S. O., Severi, M., Blunier, T., Leuenberger,M., Fischer, H., Masson-Delmotte, V., Chappellaz, J., and Wolff,E.: An optimized multi-proxy, multi-site Antarctic ice and gas or-bital chronology (AICC2012): 120–800 ka, Clim. Past, 9, 1715–1731, doi:10.5194/cp-9-1715-2013, 2013.
Bender, M., Floch, G., Chappellaz, J., Suwa, M., Barnola, J.-M., Blunier, T., Dreyfus, G., Jouzel, J., and Parrenin, F.:Gas age-ice age differences and the chronology of the Vos-tok ice core, 0–100 ka, J. Geophys. Res., 111, D21115,doi:10.1029/2005JD006488, 2006.
Benson, C. S.: Stratigraphic studies in the snow and firn of theGreenland ice sheet, SIPRE Res. Rep., 70, 76–83, 1962.
Born, A. and Nisancioglu, K. H.: Melting of Northern Greenlandduring the last interglaciation, The Cryosphere, 6, 1239–1250,doi:10.5194/tc-6-1239-2012, 2012.
Box, J. E., Yang, L., Bromwich, D. H., and Bai, L.-S.: Greenland IceSheet Surface Air Temperature Variability: 1840–2007, J. Clim.,22, 4029–4049, 2009
Buchardt, S. L., Clausen, H. B., Vinther, B. M., and Dahl-Jensen,D.: Investigating the past and recent δ18O-accumulation rela-tionship seen in greenland ice cores, Clim. Past, 8, 2053–2059,10.5194/cp-8-2053-2012, 2012.
Buizert, C., Martinerie, P., Petrenko, V. V., Severinghaus, J. P.,Trudinger, C. M., Witrant, E., Rosen, J. L., Orsi, A. J., Rubino,M., Etheridge, D. M., Steele, L. P., Hogan, C., Laube, J. C.,Sturges, W. T., Levchenko, V. A., Smith, A. M., Levin, I., Con-way, T. J., Dlugokencky, E. J., Lang, P. M., Kawamura, K., Jenk,T. M., White, J. W. C., Sowers, T., Schwander, J., and Blunier, T.:
Gas transport in firn: multiple-tracer characterisation and modelintercomparison for NEEM, Northern Greenland, Atmos. Chem.Phys., 12, 4259–4277, doi:10.5194/acp-12-4259-2012, 2012.
Capron, E., Landais, A., Lemieux-Dudon, B., Schilt, A., Masson-Delmotte, V., Buiron, D., Chappellaz, J., Dahl-Jensen, D.,Johnsen, S., Leuenberger, M., Loulergue, L., and Oerter, H.: Syn-chronising EDML and NorthGRIP ice cores using δ18O of atmo-spheric oxygen and CH4 measurements over MIS5 (80–123 ka),Quaternary Sci. Rev., 29, 235–246, 2010.
Capron, E., Landais, A., Chappellaz, J., Buiron, D., Fischer, H.,Johnsen, S. J., Jouzel, J., Leuenberger, M., Masson-Delmotte, V.,and Stocker, T. F.: A global picture of the first abrupt climaticevent occurring during the last glacial inception, Geophys. Res.Lett., 39, L15703, doi:10.1029/2012GL052656, 2012.
Capron, E., Govin, A., Stone, E. J., Masson-Delmotte, V., Mulitza,S., Otto-Bliesner, B., Rasmussen, T. L., Sime, L. C., Waelbroeck,C., and Wolff, E. W.: Temporal and spatial structure of multi-millennial temperature changes at high latitudes during the LastInterglacial, Quaternary Sci. Rev., 103, 116–133, 2014.
Dällenbach, A., Blunier, T., Flückiger, J., Stauffer, B., Chappellaz,J., and Raynaud, D.: Changes in the atmospheric CH4 gradientbetween Greenland and Antarctica during the Last Glacial andthe transition to the Holocene, Geophys. Res. Lett., 27, 1005–1008, 2000.
Dansgaard, W.: Stable isotopes in precipitation, Tellus, 16, 436–468, 1964
Dee, D. P., Uppala, S. M., Simmons, A. J., Berrisford, P., Poli,P., Kobayashi, S., Andrae, U., Balmaseda, M. A., Balsamo, G.,Bauer, P., Bechtold, P., Beljaars, A. C. M., van de Berg, L., Bid-lot, J., Bormann, N., Delsol, C., Dragani, R., Fuentes, M., Geer,A. J., Haimberger, L., Healy, S. B., Hersbach, H., Hólm, E. V.,Isaksen, L., Kållberg, P., Köhler, M., Matricardi, M., McNally,A. P., Monge-Sanz, B. M., Morcrette, J.-J., Park, B.-K., Peubey,C., de Rosnay, P., Tavolato, C., Thépaut, J.-N., and Vitart, F.:The ERA-Interim reanalysis: configuration and performance ofthe data assimilation system, Q. J. R. Meteorol. Soc., 137, 656,553–597, 2011.
Dutton, A., Carlson, A. E., Long, A. J., Milne, G. A., Clark, P. U.,DeConto, R., Horton, B. P., Rahmstorf, S., and Raymo, M. E.:Sea-level rise due to polar ice-sheet mass loss during past warmperiods, Science, 349, aaa4019, doi:10.1126/science.aaa4019,2015.
Goujon, C., Barnola, J.-M., and Ritz, C.: Modeling the den-sification of polar firn including heat diffusion: Applicationto close-off characteristics and gas isotopic fractionation forAntarctica and Greenland sites, J. Geophys. Res., 108, 4800,doi:10.1029/2003JD003758, 2003.
Grootes, P. M., Stuiver, M., White, J. W. C., Johnsen, S. J., andJouzel, J.: Comparison of the oxygen isotope records from theGISP2 and GRIP Greenland ice cores, Nature, 366, 552–554,1993
Guillevic, M., Bazin, L., Landais, A., Kindler, P., Orsi, A., Masson-Delmotte, V., Blunier, T., Buchardt, S. L., Capron, E., Leuen-berger, M., Martinerie, P., Prié, F., and Vinther, B. M.: Spatialgradients of temperature, accumulation and δ18O-ice in Green-land over a series of Dansgaard–Oeschger events, Clim. Past, 9,1029–1051, doi:10.5194/cp-9-1029-2013, 2013.
Hawley, R., Courville, Z. R., Kehrk, L. M., Lutz, E. R., Oster-berg, E. C., Overly, T. B., and Wong, G. J.: Recent accumula-
www.clim-past.net/12/1933/2016/ Clim. Past, 12, 1933–1948, 2016

1946 A. Landais et al.: How warm was Greenland during the last interglacial period?
tion variability in northwest Greenland from ground-penetratingradar and shallow cores along the Greenland Inland Traverse, J.Glaciol., 60, 375–382, doi:10.3189/2014JoG13J141, 2014.
Helsen, M. M., van de Berg, W. J., van de Wal, R. S. W., van denBroeke, M. R., and Oerlemans, J.: Coupled regional climate-ice-sheet simulation shows limited greenland ice loss duringthe Eemian, Clim. Past, 9, 1773–1788, 10.5194/cp-9-1773-2013,2013.
Herron, M. M. and Langway, C. C.: Firn densification: an empiricalmodel, J. Glaciol., 25, 373–385, 1980.
Johnsen, S. J., Clausen, H. B., Dansgaard, W., Gundestrup, N. S.,Hammer, C. U., Andersen, U., Andersen, K. K., Dahl-Jensen,D., Steffensen, J. P., Sveinbjörnsdottir, A. E., White, J., Jouzel,J., and Fisher, D.: The δ18O record along the Greenland Ice CoreProject deep ice core and the problem of possible Eemian cli-matic instability, J. Geophys. Res., 102, 26397–26410, 1997.
Jouzel, J.: Calibrating the isotopic paleothermometer, Science, 286,910–911, 1999.
Jouzel, J., Masson-Delmotte, V., Cattani, O., Dreyfus, G., Falourd,S., Hoffmann, G., Minster, B., Nouet, J., Barnola, J.-M., Fisher,H., Gallet, J.-C., Johnsen, S., Leuenberger, M., Loulergue, L.,Luethi, D., Oerter, H., Parrenin, F., Raisbeck, G., Raynaud, D.,Schilt, A., Schwander, J., Selmo, J., Souchez, R., Spahni, R.,Stauffer, B., Steffensen, J.-P., Stenni, B., Stocker, T. F., Tison, J.-L., Werner, M., and Wolff, E. W.: Orbital and millennial Antarc-tic climate variability over the past 800,000 years, Science, 317,793–796, 2007.
Kapsner, W. R., Alley, R. B., Shuman, A., Anandakrishnan, S., andGrootes, P. M.: Dominant influence of atmospheric circulationon snow accumulation in Greenland over the past 18,000 years,Nature, 373, 52–54, 1995.
Keegan, K., Albert, M. R., and Baker, I.: The impact of ice lay-ers on gas transport through firn at the North Greenland EemianIce Drilling (NEEM) site, Greenland, The Cryosphere, 8, 1801–1806, doi:10.5194/tc-8-1801-2014, 2014.
Kindler, P., Guillevic, M., Baumgartner, M., Schwander, J., Landais,A., and Leuenberger, M.: Temperature reconstruction from 10 to120 kyr b2k from the NGRIP ice core, Clim. Past, 10, 887–902,doi:10.5194/cp-10-887-2014, 2014.
Kobashi, T., Severinghaus, J. P., and Kawamura, K.: Argon and ni-trogen isotopes of trapped air in the GISP2 ice core during theHolocene epoch (0–11,500 B.P.): Methodology and implicationsfor gas loss processes, Geochim. Cosmochim. Acta, 72, 4675–4686, 2008.
Krinner, G., Genthon, C., and Jouzel, J.: GCM analysis of local in-fluences on ice core d signals, Geophys. Res. Lett., 24, 2825–2828, 1997.
Landais, A., Chappellaz, J., Delmotte, M., Jouzel, J., Blunier,T., Bourg, C., Caillon, N., Cherrier, S., Malaize, B., Masson-Delmotte, V., Raynaud, D., Schwander, J., and Steffensen, J.: Atentative reconstruction of the last interglacial and glacial incep-tion in greenland based on new gas measurements in the green-land ice core project (grip) ice core, J. Geophys. Res.-Atmos.,108, D184563, doi:10.1029/2002jd003147, 2003.
Landais, A., Steffensen, J. P., Caillon, N., Jouzel, J., Masson-Delmotte, V., and Schwander, J.: Evidence for stratigraphic dis-tortion in the Greenland Ice Core Project (GRIP) ice core duringEvent 5e1 (120 kyr BP) from gas isotopes, J. Geophys. Res., 109,D06214, doi:10.1029/2003JD004193, 2004.
Landais, A., Dreyfus, G., Capron, E., Jouzel, J., Masson-Delmotte,V., Roche, D. M., Prié, F., Caillon, N., Chappellaz, J., Leuen-berger, M., Lourantou, A., Parrenin, F., Raynaud, D., and Teste,G.: Two-phase change in CO2, Antarctic temperature and globalclimate during Termination II, Nat. Geosci., 6, 1062–1065, 2013.
Li, J. and Zwally, H. J.: Modeling the density variation in the shal-low firn layer, Ann. Glaciol., 38, 309–313, 2004.
Ligtenberg, S. R. M., Medley, B., Van den Broeke, M. R., andMunneke, P. K.: Antarctic firn compaction rates from repeat-track airborne radar data: II. Firn model evaluation, Ann.Glaciol., 56, 167–174, 2015.
Lorius, C., Ritz, C., Jouzel, J., Merlivat, L., and Barkov, N. I.: A150 000-year climatic record from Antarctic ice, Nature, 316,591–596, 1985.
Lunt, D. J., Abe-Ouchi, A., Bakker, P., Berger, A., Braconnot, P.,Charbit, S., Fischer, N., Herold, N., Jungclaus, J. H., Khon, V.C., Krebs-Kanzow, U., Langebroek, P. M., Lohmann, G., Nisan-cioglu, K. H., Otto-Bliesner, B. L., Park, W., Pfeiffer, M., Phipps,S. J., Prange, M., Rachmayani, R., Renssen, H., Rosenbloom, N.,Schneider, B., Stone, E. J., Takahashi, K., Wei, W., Yin, Q., andZhang, Z. S.: A multi-model assessment of last interglacial tem-peratures, Clim. Past, 9, 699–717, doi:10.5194/cp-9-699-2013,2013.
Masson-Delmotte, V., Landais, A., Stievenard, M., Hoffmann,G., Cattani, O., Falourd, S., Johnsen, S. J., Jouzel, J., Dahl-Jensen, D., Sveinsbjornsdottir, A., White, J. C. W., Popp,T., and Fischer, H.: Holocene climatic changes in Green-land: Different deuterium excess signals at Greenland Ice CoreProject (GRIP) and NorthGRIP, J. Geophys. Res., 110, D14102,doi:10.1029/2004JD005575, 2005.
Masson-Delmotte, V., Braconnot, P., Hoffmann, G., Jouzel, J.,Kageyama, M., Landais, A., Lejeune, Q., Risi, C., Sime, L.,Sjolte, J., Swingedouw, D., and Vinther, B.: Sensitivity of in-terglacial greenland temperature and delta o-18: Ice core data,orbital and increased CO2 climate simulations, Clim. Past, 7,1041–1059, doi:10.5194/cp-7-1041-2011, 2011.
Masson-Delmotte, V., Schulz, M., Abe-Ouchi, A., Beer, J.,Ganopolski, A., González Rouco, J. F., Jansen, E., Lambeck, K.,Luterbacher, J., Naish, T., Osborn, T., Otto-Bliesner, B., Quinn,T., Ramesh, R., Rojas, M., Shao, X., and Timmermann, A.: In-formation from Paleoclimate Archives, in: Stocker, T. F., Qin, D.,Plattner, G.-K., Tignor, M., Allen, S. K., Boschung, J., Nauels,A., Xia, Y., Bex, V., and Midgley, P. M., Climate Change 2013:The Physical Science Basis. Contribution of Working Group Ito the Fifth Assessment Report of the Intergovernmental Panelon Climate Change. Cambridge University Press, Cambridge,United Kingdom and New York, NY, USA, 383–464, 2013.
Masson-Delmotte, V., Steen-Larsen, H. C., Ortega, P., Swingedouw,D., Popp, T., Vinther, B. M., Oerter, H., Sveinbjornsdottir, A. E.,Gudlaugsdottir, H., Box, J. E., Falourd, S., Fettweis, X., Gallée,H., Garnier, E., Gkinis, V., Jouzel, J., Landais, A., Minster, B.,Paradis, N., Orsi, A., Risi, C., Werner, M., and White, J. W. C.:Recent changes in north-west Greenland climate documented byNEEM shallow ice core data and simulations, and implicationsfor past-temperature reconstructions, The Cryosphere, 9, 1481–1504, doi:10.5194/tc-9-1481-2015, 2015.
Merz, N., Born, A., Raible, C. C., Fischer, H., and Stocker, T.F.: Dependence of Eemian Greenland temperature reconstruc-
Clim. Past, 12, 1933–1948, 2016 www.clim-past.net/12/1933/2016/

A. Landais et al.: How warm was Greenland during the last interglacial period? 1947
tions on the ice sheet topography, Clim. Past, 10, 1221–1238,doi:10.5194/cp-10-1221-2014, 2014a.
Merz, N., Gfeller, G., Born, A., Raible, C. C., Stocker, T. F., andFischer, H.: Influence of ice sheet topography on Greenland pre-cipitation during the Eemian interglacial, J. Geophys. Res., 119,10749–10768, 2014b.
Merz, N., Born, A., Raible, C. C., and Stocker, T. F.: Warm Green-land during the last interglacial: the role of regional changes insea ice cover, Clim. Past Discuss., doi:10.5194/cp-2016-12, inreview, 2016.
Munk, J., Jezek, K. C., Forster, R. R., and Gogieni, S. P.: Anaccumulation map for the Greenland dry-snow facies derivedfrom spaceborn radar, J. Geophys. Res.-Atmos., 108, 4297,doi:10.1029/2002JD002481, 2003.
NEEM community members: Eemian interglacial reconstructedfrom a greenland folded ice core, Nature, 493, 489–494, 2013.
NorthGRIP community members: High resolution climate recordof the northern hemisphere reaching into last interglacial period,Nature, 431, 147–151, 2004.
Orsi, A. J., Kawamura, K., Fegyveresi, J. M., Headly, M. A., Alley,R. B., and Severinghaus, J. P.: Differentiating bubble-free layersfrom melt layers in ice cores using noble gases, J. Glaciol., 61,585–594, 2015
Ortega, P., Swingedouw, D., Masson-Delmotte, V., Risi, C., Vinther,B., Yiou, P., Vautard, R., and Yoshimura, K.: Characterizing at-mospheric circulation signals in Greenland ice cores: insightsfrom a weather regime approach, Clim. Dynam., 43, 2585–2605,2014
Otto-Bliesner, B. L., Marshall, S. J., Overpeck, J. T., Miller, G. H.,Hu, A., and CAPE Last Interglacial Project members: Simulat-ing Arctic Climate Warmth and Icefield Retreat in the Last Inter-glaciation, Science, 311, 1751–1753, 2006.
Otto-Bliesner, B. L., Park, W., Pfeiffer, M., Phipps, S. J., Prange,M., Rachmayani, R., Renssen, H., Rosenbloom, N., Schneider,B., Stone, E. J., Takahashi, E., Wei, W., Yin, Q., and Zang, Z.S.: A multi-model assessment of last interglacial temperatures,Clim. Past, 9, 699–717, doi:10.5194/cp-9-699-2013, 2013a.
Otto-Bliesner, B. L., Rosenbloom, N., Stone, E. J., McKay, N. P.,Lunt, D. J., Brady, E. C., and Overpeck, J. T.: How warm was thelast interglacial? New model-data comparisons, P. T. Roy. Soc.A, 371, 20130097, doi:10.1098/rsta.2013.0097, 2013b.
Petit, J. R., Jouzel, J., Raynaud, D., Barkov, N. I., Barnola, J.-M.,Basile, I., Bender, M., Chappellaz, J., Davis, M., Delaygue, G.,Delmotte, M., Kotlyakov, V. M., Legrand, M., Lipenkov, V. Y.,Lorius, C., Pepin, L., Ritz, C., Saltzman, E., and Stievenard, M.:Climate and atmospheric history of the past 420,000 years fromthe Vostok ice core, Antarctica, Nature, 399, 429–436, 1999.
Pfahl, S. and Sodemann, H.: What controls deuterium excess inglobal precipitation?, Clim. Past, 10, 771–781, doi:10.5194/cp-10-771-2014, 2014
Ritz, C.: Un modèle thermo-mécanique d’évolution pour lebassin glaciaire Antarctique Vostok-Glacier Byrd: Sensibilitéaux valeurs des paramètres mal connus, Ph.D. thesis, UniversitéJoseph Fourier – Grenoble I, 1992.
Robinson, A., Calov, R., and Ganopolski, A.: Greenland ice sheetmodel parameters constrained using simulations of the EemianInterglacial, Clim. Past, 7, 381–396, doi:10.5194/cp-7-381-2011,2011.
Severinghaus, J. P., Sowers, T., Brook, E. J., Alley, R. B., and Ben-der, M. L.: Timing of abrupt climate change at the end of theYounger Dryas interval from thermally fractionated gases in po-lar ice, Nature, 391, 6663, 141–146, 1998.
Sime, L. C., Risi, C., Tindall, J. C., Sjolte, J., Wolff, E. W., Masson-Delmotte, V., and Capron, E.: Warm climate isotopic simula-tions: What do we learn about interglacial signals in greenlandice cores?, Quaternary Sci. Rev., 67, 59–80, 2013.
Steen-Larsen, H. C., Masson-Delmotte, V., Sjolte, J., Johnsen, S. J.,Vinther, B. M., Breon, F. M., Clausen, H. B., Dahl-Jensen, D.,Falourd, S., Fettweis, X., Gallee, H., Jouzel, J., Kageyama, M.,Lerche, H., Minster, B., Picard, G., Punge, H. J., Risi, C., Salas,D., Schwander, J., Steffen, K., Sveinbjornsdottir, A. E., Svens-son, A., and White, J.: Understanding the climatic signal in thewater stable isotope records from the neem shallow firn/ice coresin northwest Greenland, J. Geophys. Res.-Atmos., 116, D06108,doi:10.1029/2010jd014311, 2011.
Steen-Larsen, H. C., Johnsen, S. J., Masson-Delmotte, V., Stenni,B., Risi, C., Sodemann, H., Balslev-Clausen, D., Blunier, T.,Dahl-Jensen, D., Ellehoj, M. D., Falourd, S., Grindsted, A., Gki-nis, V., Jouzel, J., Popp, T., Sheldon, S., Simonsen, S. B., Sjolte,J., Steffensen, J. P., Sperlich, P., Sveinbjnorsdottir, A. E., Vinther,B. M., and White, J. W. C.: Continuous monitoring of summersurface water vapor isotopic composition above the greenlandice sheet, Atmos. Chem. Phys., 13, 4815–4828, 10.5194/acp-13-4815-2013, 2013.
Steen-Larsen, H. C., Masson-Delmotte, V., Hirabayashi, M., Win-kler, R., Satow, K., Prié, F., Bayou, N., Brun, E., Cuffey, K.M., Dahl-Jensen, D., Dumont, M., Guillevic, M., Kipfstuhl, J.,Landais, A., Popp, T., Risi, C., Steffen, K., Stenni, B., and Svein-björnsdottír, A.: What controls the isotopic composition of green-land surface snow?, Clim. Past, 10, 377–392, doi:10.5194/cp-10-377-2014, 2014.
Steen-Larsen, H. C., Sveinbjörnsdottir, A. E., Jonsson, T., Ritter,F., Bonne, J.-L., Masson-Delmotte, V., Sodemann, H., Blunier,T., Dahl-Jensen, D., and Vinther, B.: Moisture sources and syn-optic to seasonal variability of North Atlantic water vapor iso-topic composition, J. Geophys. Res.-Atmos., 120, 5721–6304,doi:10.1002/2015JD023234, 2015.
Stone, E. J., Lunt, D. J., Annan, J. D., and Hargreaves, J. C.: Quan-tification of the greenland ice sheet contribution to last inter-glacial sea level rise, Clim. Past, 9, 621–639, doi:10.5194/cp-9-621-2013, 2013.
Sturevik-Storm, A. S., Aldahan, A., Possnert, G., Berggren, A.M., Muscheler, R., Dahl-Jensen, D., Vinter, B., and Usoskin, I.G.: 10Be climate fingerprints during the Eemian in the NEEMice core, Greenland, Sci. Rep., 4, 6408, doi:10.1038/srep06408,2014.
Suwa, M., Fischer, J. C., Bender, M. L., Landais, A., and Brook,E. J.: Chronology reconstruction for the disturbed bottom sec-tion of the gisp2 and the grip ice cores: Implications for ter-mination II in Greenland, J. Geophys. Res., 111, D02101,doi:10.1029/2005JD006032, 2006.
Uppala, S. M., KÅllberg, P. W., Simmons, A. J., Andrae, U., Bech-told, V. D. C., Fiorino, M., Gibson, J. K., Haseler, J., Hernandez,A., Kelly, G. A., Li, X., Onogi, K., Saarinen, S., Sokka, N., Al-lan, R. P., Andersson, E., Arpe, K., Balmaseda, M. A., Beljaars,A. C. M., Van De Berg, L., Bidlot, J., Bormann, N., Caires, S.,Chevallier, F., Dethof, A., Dragosavac, M., Fisher, M., Fuentes,
www.clim-past.net/12/1933/2016/ Clim. Past, 12, 1933–1948, 2016
1948 A. Landais et al.: How warm was Greenland during the last interglacial period?
M., Hagemann, S., Hólm, E., Hoskins, B. J., Isaksen, L., Janssen,P., Jenne, R., Mcnally, A. P., Mahfouf, J.-F., Morcrette, J.-J.,Rayner, N. A., Saunders, R. W., Simon, P., Sterl, A., Trenberth,K., Untch, A., Vasiljevic, D., Viterbo, P., and Woollen, J.: TheERA-40 re-analysis, Q. J. R. Meteorol. Soc., 131, 2961–3012,2005.
van de Berg, W. J., van den Broeke, M. R., van Meijgaard, E., andKaspar, F.: Importance of precipitation seasonality for the in-terpretation of eemian ice core isotope records from greenland,Clim. Past, 9, 1589–1600, doi:10.5194/cp-9-1589-2013, 2013.
Veres, D., Bazin, L., Landais, A., Toyé Mahamadou Kele, H.,Lemieux-Dudon, B., Parrenin, F., Martinerie, P., Blayo, E., Blu-nier, T., Capron, E., Chappellaz, J., Rasmussen, S. O., Severi,M., Svensson, A., Vinther, B., and Wolff, E. W.: The Antarcticice core chronology (AICC2012): an optimized multi-parameterand multi-site dating approach for the last 120 thousand years,Clim. Past, 9, 1733–1748, doi:10.5194/cp-9-1733-2013, 2013.
Vinther, B. M., Buchardt, S. L., Clausen, H. B., Dahl-Jensen, D.,Johnsen, S. J., Fisher, D. A., Koerner, R. M., Raynaud, D.,Lipenkov, V., Andersen, K. K., Blunier, T., Rasmussen, S. O.,Steffensen, J. P., and Svensson, A. M.: Holocene thinning of thegreenland ice sheet, Nature, 461, 385–388, 2009.
Vinther, B. M., Jones, P., Briffa, K., Clausen, H., Andersen, K.,Dahl-Jensen, D., and Johnsen, S.: Climatic signals in multiplehighly resolved stable isotope records from greenland, Quater-nary Sci. Rev., 29, 522–538, 2010.
Clim. Past, 12, 1933–1948, 2016 www.clim-past.net/12/1933/2016/