Embed Size (px)
Citation preview

1
How Will Future Oil Prices Affect Geopolitics?
Evan Hillebrand*
Associate Professor of International Economics
Patterson School of Diplomacy and International Commerce
University of Kentucky
Lexington, KY 40506
Phone: 859-257-6928, Fax: 859-257-4676, Email: [email protected]
Paper prepared for the 2008 International Studies Association Annual Conference, 24-31
March, 2008, San Francisco, California. This version: March 15, 2008
Abstract: This paper takes the low-world-oil production/high energy price scenario from
the US Department of Energy’s 2007 International Energy Outlook (IEO) and uses the
International Futures Model to speculate about geopolitical futures to 2030. It finds that
if non-OPEC oil production is low, a malign dynamic of shifting alliances, increased
cartelization, and even de-marketization of the global system could ensue. In particular,
the scenario analysis suggests that OPEC, especially Saudi Arabia, might not be very
interested in increasing oil production anywhere near as much as that suggested in the
IEO’s reference case (and moderate price) scenario.
Key Words: energy security, global, world, economic, forecast, international futures
JEL codes: F02, F50, F47, Q34, Q43
* With the assistance of Barry B. Hughes, University of Denver.

2
1. Introduction
Two standard sources of long range forecasts of world energy demand and supply
are the OECD’s International Energy Agency (IEA) and the US government’s Energy
Information Agency (EIA). Both groups produce annual energy forecasts that project
world energy demand and supply by country and by fuel source. Both basecase—or
reference--forecasts are benign—energy supplies continue to grow at a pace sufficient to
fuel continued rapid world economic growth for the next 25 years at market-determined
prices that are less than those of today.
These forecasts are based on geological estimates that there is enough oil, gas,
and coal available to meet steadily rising world demand without a large increase in the
relative price of energy. Unstated in these forecasts, however, are the underlying
assumptions about global security arrangements and national security policies of the key
energy producers and consumers. Implicitly global security and economic relationships
remain unchanged: a) most energy crosses international borders in response to voluntary
market transactions, and b) OPEC, if it continues to exist, does not try to exert significant
upward pressure on prices by restraining supply.
I have used the International Futures Model to examine the geopolitical future if
the benign basecase energy future proves too optimistic. I will show that if oil production
growth in the non-OPEC countries is less robust than the EIA/IEA basecase projections,
OPEC’s economic interests will tempt it to limit its own production increases, making the

3
EIA’s low production/high price scenario much more likely than the basecase scenario. I
further show that an Islamist political realignment in the Middle East—as posited in the
National Intelligence Council’s Mapping the Global Future—could result in further
OPEC production cuts, shifting more economic and geopolitical power toward that
region, away from the OECD countries. OPEC would be motivated in this case to reach
out to Russia to build an even more inclusive energy cartel that could further drive up
prices while still generating higher revenues for the oil exporters. In one of many
possible responses to sharply higher energy prices I show how the Chinese quest for
energy security could finally destroy the current market-oriented energy economy.
2. The Basecase Scenario—IEA and EIA
Every year, the Energy Information Agency (EIA) of the US Department of
Energy publishes an Annual Energy Outlook and an International Energy Outlook that
project world energy demand and supply under a variety of economic and technological
assumptions. While these publications are extremely useful to the energy analyst, they
do not delve deeply into the economic and political interconnections implicit, or
potentially implicit, in the widely varying price and production scenarios. To examine
those interconnections I adapted the International Futures Model1 (IFs) to reproduce the
price paths in the International Energy Outlook 2007 (IEO2007), and tried to build
detailed economic, political, and geopolitical scenarios around them. The IFs model is a
hugely complex computational device that is helpful for keeping a vast amount of detail
1 See http://www.du.edu/~bhughes/ifs.html for details, also Hughes and Hillebrand (2006).

4
consistent, but to build scenarios this complex and involving assumptions about the
actions of so many decision-makers the final analysis reflects mainly the judgment of the
author, not the mechanical workings of the IFs or any other model.
In the EIA work (see figure 35, reproduced below) world oil prices are assumed
to take three possible widely divergent paths, from mid 2006 to 2030. Divergent price
paths could be motivated in many different ways, such as differences in growth of
demand, differences in assumptions about the technology of energy usage, or most
importantly, differences in assumptions about the geological accessibility of oil. In the
IEO2007 the different price paths result mainly from the assumption of different oil-
production paths outside of the United States. Further, it is assumed that those paths are
dictated more by geological considerations than by policy choices or political constraints.

5
I constrained the IFs model to roughly replicate the world oil production
assumptions portrayed in the IEO2007 scenarios. These scenarios show world oil
production in 2030 ranging from 101.9 million barrels per day (mbd) in the high
price/low production scenario, to 117.8 mbd in the reference case, to 127.7 mbd in the
low price/high production case. The IEO scenarios are not integrated with a world
economic model, nor are alternate fuels considered except in the US case. Thus I had to
fill in the details, as it were, using the IFs model, which does integrate global demand and
supply of 6 fuel sources (oil, coal, natural gas, hydro, nuclear, and other) with economic
growth and energy demand in 182 countries. In the IFs model, economic growth in every
country responds endogenously to change in energy production and energy prices. In
addition, the IFs model projects quite substantial shifts among energy sources given large
swings in relative prices. Thus the final results cannot be in any way construed to be
implied by the DOE analysis: the DOE results are too sparse for that. The results
reported are my own scenarios—based loosely on the DOE price and oil production
assumptions—but using the IFs model as the basic platform for analysis. The different
oil market assumptions, it will become clear, have quite dramatically different
implications for global economic and political futures.
In this work, as in the IEO2007 and in most other long-run forecasting work,2 the
basecase is for continued strong global economic growth and some degree of
convergence between the OECD and non-OECD countries. Growth rates are projected
basically as a continuation of trends: strong technological growth in the OECD countries,
2 See, for example, the economic growth projections underlying the IPCC climate change projections at
http://sedac.ciesin.columbia.edu/ddc/sres/index.html (2000), or Maddison (2007). One major exception is
Meadows et al. (2004)

6
strong investment coupled with continued modernization in non-OECD Asia, but a
gradual slowing from the very high growth rates of recent decades. For the other non-
OECD regions, the forecast assumes a gradual improvement in economic governance that
leads to a more efficient use of capital and more domestic competition. Embedded in the
base case is increasing globalization, a lack of major conflicts, and reasonably successful
fiscal management by OECD and non-OECD governments.
Table 1
Economic Growth In the IEO2007 Reference Case1
average annual growth
2006-2030 1980-2005
World 4.1 3.2
OECD 2.5 2.6
Non-OECD 5.3 3.9
United States 2.9 3.1
China 6.5 7.6
Russia 3.7 0.1
OECD Europe 2.3 2.0
1Real GDP, Purchasing Power Parity Terms
Source: Projected data from Reference Case, Table A3, IEO 2007
Historical data from author's extensions of Maddison's 2003 estimates
Note: The IEO scenario assumes energy prices remain roughly equal
to the 2006 price, on average.
I imposed these energy and economic numbers on the IFs model3 and used the
model to generate its own long range geopolitical scenario. The IFs model projects
variables such as the level of democratization, geopolitical power, risk of domestic
instability, and the risk of war4. Under the base case energy and economic assumptions,
and under the myriad assumptions underlying the IFs model, the geopolitical landscape
shifts in a benign direction.
3 Approximately. Differences in base year purchasing power parity GDP numbers and difference in
coverage between the IEO and the IFs model make it impossible to exactly line up the numbers. 4 See the appendix for details on how these variables are measured.

7
Table 2
Key Geopolitical MeasuresCalculations and Projections with the International Futures Model, Basecase
Democracy Political Power
Risk of
Internal
Extreme
Instability Risk of Interstate War
2005 2030 2005 2030 2005 2030 2005 2030
World 11.6 15.5 100 100
OECD 19.3 19.9 63.9 47.5
Non-OECD 9.9 14.7 36.1 52.5
`
United States 20.0 20.0 28.6 21.5 0.0% 0.0% 10.6% 8.6%
China 3.0 8.6 8 17.9 4.9% 0.6% 5.9% 5.8%
Russia 17.0 19.6 4.6 4.9 50.0% 0.9% 11.3% 9.0%
EU27 19.6 19.9 21.3 15.4 0.0% 0.0%
Middle East-OPEC 3.1 9.0 2.3 3.8 5.3% 3.4%
Iran 6.0 9.0 0.7 1.1 9.4% 2.5% 7.4% 5.4%
Note: See Appendix 1 for detailed descriptions of the measures reported above.
Rising GDP per capita and generational change leading to larger percentages of
populations growing up without want lead to growing democratization (Inglehart, 2000).
Faster economic growth in China and the other non-OECD countries leads to a gradual
decline in the share of world power held by the United States and the EU and a rise by
China. Economic growth and consolidation of democracy lead to a diminution almost
everywhere in the risk of internal war (Goldstone, 2004). The rise of great powers such
as China and India compared to the relative decline of US power could lead to an
increase in the risk of interstate war (Tamen, 2000), but this scenario assumes China and
India, in particular, are satisfied powers (Kugler, 2006), that have adapted peacefully to
the existing international order and see no need for warfare to validate their rising status.
This result also conforms with Gartzke’s “Capitalist Peace” (2007) in which spreading
economic interdependence erodes incentives for interstate war.

8
What if the oil supply situation was not so promising? What if an extra 20 or 40
mbd of oil are not forthcoming, resulting in far higher prices for the available oil? The
IEO report posits one such price path but it does not draw any geopolitical inferences—
world politics are unchanged in IEO scenarios. But could a tightening of the world
energy market upset the benign political outcomes of the base case?
3. Alternate Scenario 1: A More Aggressive OPEC
In the IEO low oil production, high oil price scenario, world oil production rises
by only 4.1 mbd between 2005 and 2015, 9 mbd less than in the basecase. Almost all of
the shortfall in production in this scenario compared to the basecase is accounted for by
OPEC and especially by Saudi Arabia. Because the Middle East oil producers clearly
have the potential to increase production much more over the next decade than this
scenario portrays (CERA, 2008) I choose to interpret this scenario itself as a more
aggressive OPEC:5 OPEC has chosen to keep production low and prices high in order to
increase revenues.6
5 The EIA does not explain why oil production is so much less in this scenario. (pg 12-15)
6 All the cutbacks in production are assumed to originate in the OPEC countries, thus oil production
remains the same as in the reference case for Mexico, Russia, and the Caspian region. This assumption
necessitates a further 1.1 mbd OPEC production drop in 2015 and a 2.1 mbd drop in 2030, compared to
IEO’s reference scenario.
9
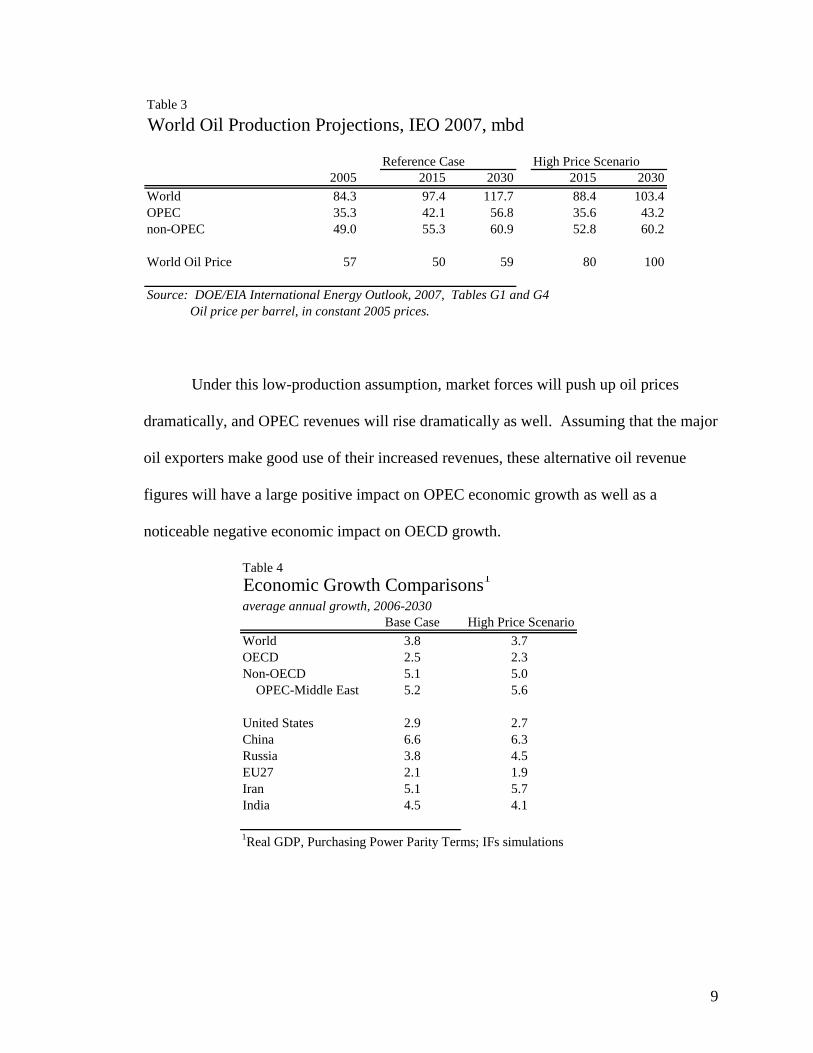
Table 3
World Oil Production Projections, IEO 2007, mbd
Reference Case High Price Scenario
2005 2015 2030 2015 2030
World 84.3 97.4 117.7 88.4 103.4
OPEC 35.3 42.1 56.8 35.6 43.2
non-OPEC 49.0 55.3 60.9 52.8 60.2
World Oil Price 57 50 59 80 100
Source: DOE/EIA International Energy Outlook, 2007, Tables G1 and G4
Oil price per barrel, in constant 2005 prices.
Under this low-production assumption, market forces will push up oil prices
dramatically, and OPEC revenues will rise dramatically as well. Assuming that the major
oil exporters make good use of their increased revenues, these alternative oil revenue
figures will have a large positive impact on OPEC economic growth as well as a
noticeable negative economic impact on OECD growth.
Table 4
Economic Growth Comparisons1
average annual growth, 2006-2030
Base Case High Price Scenario
World 3.8 3.7
OECD 2.5 2.3
Non-OECD 5.1 5.0
OPEC-Middle East 5.2 5.6
United States 2.9 2.7
China 6.6 6.3
Russia 3.8 4.5
EU27 2.1 1.9
Iran 5.1 5.7
India 4.5 4.1
1Real GDP, Purchasing Power Parity Terms; IFs simulations

10
OPEC production is 6.5 mbd less in 2015 and 13.6 mbd less in 2030, while oil
prices rise $25 per barrel in 2015 and $42 per barrel in 2030 (adjusted for inflation in the
price of other goods and services), compared to the reference case. Assuming 80% of the
revenue rise goes to Middle East governments and firms, Middle East revenue rises about
4.5 trillion 2005 dollars, 2006-2030, and calculations using the International Futures
Model suggests that revenue increases of this magnitude--spent efficiently-- could boost
real GDP growths by 0.4 percent a year through 2030, and push up per capita
consumption rates even more. Iran’s GDP growth rate would be about 0.6 percentage
point a year higher. The huge wealth transfers resulting from this use of market power
will probably tend to increase military spending in the region (Stern, 2006). The region
gains global political power—up by about 1 point on the 100-point global share index. If
the region chose to use its new wealth and power to accumulate nuclear weapons, the
Middle East OPEC regions cumulative power index could increase by two thirds from the
basecase estimate.
Simulations with the International Futures Model also suggest that the risk of
domestic instability would be reduced because of increased economic growth and the risk
of interstate wars would be roughly unchanged.
The geopolitical clout of the region, and especially the major exporters—Saudi
Arabia, Iran, and Iraq grows. The Western importers become even more beholden to
OPEC because politically motivated short-term restrictions in oil supply could have a
devastating economic impact.

11
This simulation assumes the Middle East states only spend half the extra revenues
on private consumption and fixed investment, accumulating the rest in sovereign wealth
funds. Starting from about $1.6 trillion in 20077, the value of these funds rise to about
$11 trillion (in 2005 prices) by 2030 in the base case, and $13 trillion in the high-price
scenario. Assuming this money is invested mostly in the OECD countries, the rise in
holdings of government bonds, equity stakes, and outright control of companies will
increase the leverage of the oil-rich states.
Table 5
A More Aggressive OPECall results compared to basecase forecast, either 2006-2030 averages, or 2030 level
Change in average
annual GDP Growth rate
Percent Change in Real
GDP Level, 2030
Change in Aggregate
Power Index, 2030
Change in Power if OPEC
Middle East goes nuclear
OPEC Middle East 0.4% 10.0% 0.9 2.4
Iran 0.6% 15.7% 0.3 0.5
Russia 0.7% 17.0% 1.1 0.5
China -0.3% -6.8% -1.3 -1.5
EU27 -0.2% -5.2% -0.2 -0.3
USA -0.2% -5.5% -0.5 -0.9
Source: simulations with the International Futures Model
OPEC might be tempted to pursue this low-production strategy which seems to
generate significant economic and geopolitical gains, but there are several key
uncertainties that might restrain it: uncertainty over oil demand and supply elasticities,
lack of faith in the cartel itself, and fear of violence.
7 The Economist, Jan 19-25, 2008, pg 78.

12
Elasticities. The DOE high price scenario envisions a 12.3 percent production
decline in 2030 and a 72.4 percent price increase, with world GDP unchanged. This
suggests an implicit price elasticity of about -0.25 over 25 years. This is a forecast that
may be correct (IMF, 2005), but there is great uncertainty about the long term price
sensitivity of oil and some analysts think it is much higher, perhaps approaching -1
(Energy Modeling Forum, 1981). Given that OPEC’s 2005 share of the world market is
only about 42 percent, an elasticity higher (in absolute terms) than -.5 or so would
suggest that production cutbacks, while raising the world price of oil would result in a
reduction in OPEC revenues and hence investment, consumption, and GDP growth.8
Cartel fragility. Another constraint on this strategy is the age-old problem of
cartel cheating. If Saudi Arabia or some combination of OPEC exporters really commits
to this strategy of low or no growth in production, other OPEC producers have a powerful
incentive to cheat on the agreed-upon cutbacks. Saudi Arabia has been in that position
before (1984-1986) and is reluctant to find itself in such a position again.
Free riders. While this production scenario could have significant gains for
OPEC, the greatest gainers would be non-OPEC exporters such as Russia. Russia’s
cumulative oil export revenues (2006-2030) are almost $2 trillion higher in this scenario.
Simulations with our growth model suggest an additional economic growth of 0.7 percent
8 The long-range energy price elasticity imputed from the IEO2007 and used here implicitly assumes only a
modest amount of technological change enhancing the attractiveness of alternative energy sources. A more
optimistic assumption about technology would of course reduce the negative implications of these
scenarios.

13
per year. Saudi Arabia becomes the number two oil producer to Russia, which has given
up nothing and profited heavily by OPEC and Saudi Arabia’s cutbacks in production.
Despite these risks, the results from this scenario suggest that OPEC, especially
Saudi Arabia, might not be very interested in increasing oil production as much as the
IEO basecase scenario requires. OPEC has little to gain financially—given these
elasticity values--from an effort to dramatically increase oil production.9
4. Alternate Scenario 2: A New Caliphate
A big drawback to OPEC cashing in on its market power is the fragility of the
cartel--the temptation and tendency of each member to cheat on its agreed quota. This
weakness could be reduced if the Persian Gulf oil exporters became more unified
politically. Such a scenario was explored in the National Intelligence Council’s Mapping
the Global Future in which a spiritual Caliphate was declared and was honored
throughout the region but had not yet—by 2020—established a unified government. But
what if such a unified Islamist government was established, including Egypt, Saudi
Arabia, the United Arab Emirates, Kuwait, and if not Iraq and Iran, at least more closely
aligning those countries with the Sunni lands than now? It might also include Muslim oil
exporters that are not now part of OPEC, such as Bahrain, Oman, Azerbaijan, and
Kazakhstan.
9 Stern (2006) argues that OPEC has long been exerting its market power by constraining invesment, not
production.

14
If the new Caliphate was as interested in economic gains as the current
governments then the only difference from the first scenario would be less fear of cartel
cheating. In this new order, only a very small part of the cartel’s total output would not
be under the direct control of a single authority. Thus reaching for the gains outlined in
scenario 1 would be much less risky an undertaking.
If, however, the new regime was more interested in spiritual/psychological and/or
political gains than economic ones, the impact of Islamic unification could be much more
severe for the oil-importing nations. In this case punishment of the West might take
policy priority over long-term economic calculations.
In alternate scenario 1 OPEC did not increase production over the next 25 years
sufficiently to meet demand without a rise in real prices—the changes were gradual and
long-term and the economic pain to the oil-importers was not severe. In alternate
scenario 2, I assume that for political and economic reasons OPEC starts to withhold oil
from the market in 2015, both to enjoy higher revenues and to punish the West for its
support of Israel and/or other perceived misdeeds. The new Caliphate would have an
enormous amount of power to inflict damage on the oil importers without suffering
much, if any, economic damage itself.
If OPEC (or OPEC and some of the newly aligned Caliphate states) cut oil
production by 5 mbd in 201510
, I estimate11
that the world oil price would rise 114
10
Compared to estimated production levels in Scenario 1.

15
percent in 2015, to $171 per barrel (in 2005 prices). This price spike would cause an
enormous shift in revenues between the oil-importing and the oil-exporting states. Oil
prices would adjust downward after 2015 because of lags in response to the price surge
response, but it would still be $27 higher in 2020, than in the previous scenario.
This production cut would result in a boost in Middle East GDP growth, 2016-
2020, a larger increase in per capita consumption, and $1.5 trillion new infusion over 5
years to OPEC sovereign wealth funds.12
The United States, on the other hand, would
plunge into recession13
, with real GDP dropping an estimated 7 percent over two years.
The EU would be hurt nearly as much.
Russia, again, is a big winner from the OPEC action. The Kremlin can keep
selling all the oil it produces at the new higher price, despite the slowdown in economic
activity in Europe and the United States. Gas export volume is similarly unchanged
while gas prices increase some. Total energy export revenues, 2015-2020 increase by
about $550 billion. Russian GDP growth increases by an average of about 0.3 percent
per year, 2016-2020, and private and government consumption increase far more, as do
holdings of overseas financial assets.14
11
Using the IMF’s short-term oil demand elasticity of -0.05, and the DOE’s implicit long-term price
elasticity of -0.25. 12
This assumes that a quarter of the new revenue goes to consumption, a quarter to investment, and half to
the sovereign wealth funds. 13
See Hamilton (1996) and Blanchard and Gali (2007), for differing views on the impact of oil prices on
the macroeconomy. 14
These results assume that the additional energy export revenues go in equal shares to private
consumption (much of it imported), government consumption (much of it for the military), investment, and
overseas financial asset accumulation.

16
Aggregate national power, as measured by the IFs model, continues to shift away
from the United States and the EU toward the Middle East and Russia, all based on
policy choices that were perhaps easy and costless for the Middle East. Russia gains as
free rider, it does nothing at all for its increase in power except choose to invest its
windfall wisely. China suffers a sharp decrease in growth from higher energy prices and
lower OECD growth, but it, like the United States and the EU, is assumed to not respond
politically to the OPEC/Middle East actions.
Table 6
A New Caliphateall results compared to Aggressive OPEC scenario except colum 4
Change in average
annual GDP Growth
rate (2016-2020)
Percent Change in
Real GDP Level,
2020
Change in Aggregate Power
Index, 2020, from Aggressive
OPEC Scenario
Change in Aggregate
Power Index, 2020, from
Basecase Scenario
Caliphate 0.4% 5.8% 3.5 4.3
Iran 0.4% 3.7% 0.2 0.4
Russia 0.4% 2.0% 0.5 0.7
China -0.4% -2.5% -0.4 -0.7
EU27 -0.5% -2.9% -0.5 -0.7
USA -0.4% -2.0% -0.6 -1.4
Source: simulations with the International Futures Model
Notes: Caliphate is defined here as OPEC Middle East plus Egypt, Syria, Oman, and Bahrain, Azerbaijan, and Kazahkstan.
This scenario assumes the Middle East states have aquired nuclear weapons.
The change in power for the Caliphate uses OPEC Middle East as the comparator.
5. Alternate Scenario 3: A More Aggressive Russia
The previous two scenarios assumed Russia was a passive actor, enjoying the
increase in revenues brought about by the supply-constraining policies of OPEC or parts
of OPEC. Assuming that the extra revenues are split evenly between consumption,
military spending, domestic investment, and foreign investment, Russian average real

17
GDP growth increases by about 1.0 percent per year from 2007, and the sovereign wealth
fund accumulates another $700 billion (in 2005 prices) by the year 2030.
Russia, acting alone, can push up world oil prices by cutting production, but given
its small share of the market, it will only reduce its oil export revenues by doing so, even
though it can benefit greatly from being a free rider on OPEC’s actions. Starting from
the low-production scenario, there is much more incentive for Russia to cooperate with
OPEC and for OPEC (or the Caliphate) to encourage—or even insist on--Russia joining
OPEC in supply cuts.
Starting from the already low world production figure of 88.4 mbd in 2015 in the
New Caliphate scenario, if Russia and the Caliphate agreed to cut production further,
proportionately (the Caliphate would cut production by about 4 times as much as Russia),
oil export revenues would go up for both partners. If Russia cut oil production and
exports by about 0.5 mbd and the Caliphate cut production by about 2 mbd, Russian net
export revenues would increase by about $150 billion, 2015-2020, from the estimated
revenues in the Caliphate scenario, and Caliphate revenues would increase by about $600
billion, and the gains would continue to mount through 2030.
The price of a barrel of oil in 2015, in 2005 real terms, would increase from $170
a barrel in the Caliphate scenario to $215 a barrel. Russia and the Caliphate might be
tempted, in 2015, to attempt such cooperation purely on economic grounds. The scenario
is based on the assumption that supply opportunities are limited in the non-OPEC
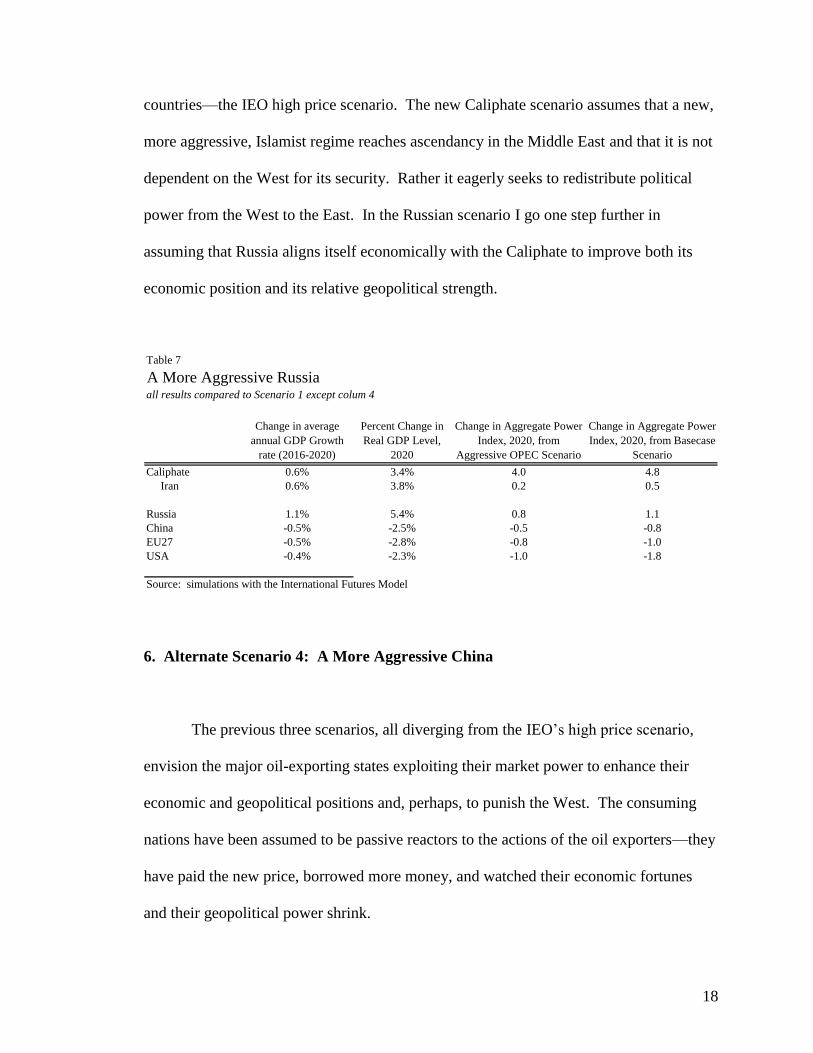
18
countries—the IEO high price scenario. The new Caliphate scenario assumes that a new,
more aggressive, Islamist regime reaches ascendancy in the Middle East and that it is not
dependent on the West for its security. Rather it eagerly seeks to redistribute political
power from the West to the East. In the Russian scenario I go one step further in
assuming that Russia aligns itself economically with the Caliphate to improve both its
economic position and its relative geopolitical strength.
Table 7
A More Aggressive Russiaall results compared to Scenario 1 except colum 4
Change in average
annual GDP Growth
rate (2016-2020)
Percent Change in
Real GDP Level,
2020
Change in Aggregate Power
Index, 2020, from
Aggressive OPEC Scenario
Change in Aggregate Power
Index, 2020, from Basecase
Scenario
Caliphate 0.6% 3.4% 4.0 4.8
Iran 0.6% 3.8% 0.2 0.5
Russia 1.1% 5.4% 0.8 1.1
China -0.5% -2.5% -0.5 -0.8
EU27 -0.5% -2.8% -0.8 -1.0
USA -0.4% -2.3% -1.0 -1.8
Source: simulations with the International Futures Model
6. Alternate Scenario 4: A More Aggressive China
The previous three scenarios, all diverging from the IEO’s high price scenario,
envision the major oil-exporting states exploiting their market power to enhance their
economic and geopolitical positions and, perhaps, to punish the West. The consuming
nations have been assumed to be passive reactors to the actions of the oil exporters—they
have paid the new price, borrowed more money, and watched their economic fortunes
and their geopolitical power shrink.

19
China, however, is already acting in ways that reflect its fear for the long-run
dependability of the global oil market. China has chosen to establish long-term supply
and production relations with Middle East as well as African and Latin American nations
(USCC, 2007, pp 175-181). In the short term these policies tend to increase the global
supply of oil; in the long term it is not clear that they can protect China very much from
the vagaries of the market and OPEC’s market power (Gholz and Press, 2007). But in
these bleak scenarios, where world oil prices have been pushed above $200 a barrel by a
combination of disappointing non-OPEC production and OPEC and Russian supply
restraint, China might be tempted to act more aggressively.
In such a scenario, global confidence in the ability of the market to deliver needed
energy supplies and confidence in the United States to continue to undergird the physical
security of the global energy market (Yetiv, 2004, pp 55-76) are undermined by years of
diminishing US financial clout and its weakening geopolitical power.
I assume that in these circumstances China attempts to ensure its energy supplies
at prices it wants. This could mean outright military force in the Middle East or Africa,
but more likely it would mean putting political and economic pressure on weak African
states to honor old, concessionary contracts they have with the Chinese, rather than
attempt to modify them in response to higher oil prices as they would be tempted to do in
light of much higher world market prices. In this scenario, China’s long-declared policy
of non-interference in domestic affairs of foreign states would be cast aside when it

20
becomes geopolitically possible—because of waning US power--and desirable—because
of soaring oil prices.
Apart from the geopolitical dangers associated with this shift of the Chinese to
statecraft-driven energy acquisition, such a Chinese move would affect the rest of the
global market because it would only be undertaken so that China could enjoy less-than-
market prices. At these lower prices China will naturally consume more oil than it would
at the higher, global market price. This higher demand causes the burden of adjusting to
constrained supply to fall more heavily on the United States and other oil consuming
nations, through higher prices, reduced economic activity, and probably an intensified
arms race as confidence in a peaceful international economic system recedes.
Competition over resources, in this scenario, could at its worst lead to a
breakdown in the “Capitalist Peace”. Gartzke (2007, p 170) said, “Governments, like
individuals, choose between trade and theft in obtaining goods and services”. In the
resource-constrained world we have described here, the choice is not as clear-cut as it has
been for the last half century.
7. Conclusions
I have used the International Futures Model to show the importance of oil futures
to geopolitics. All of the quantitative results reported here are merely indicative of the
potential problems that may develop based on a less benign energy forecast than the ones
reported as the EIA and the IEA’s basecase forecasts. If oil production does not rise
21
sharply in the non-OPEC countries 2008-2030, OPEC might easily find it in its own
interest to go very slowly in developing new productive capacity as envisioned in
scenario 1 above. A general hesitancy to expand production when doing so might lead to
enhanced revenues that might be much more easily achieved by the Cartel than agreeing
to shut-in capacity that is already available and saleable at a high price. In alternate
scenarios 2 and 3 I showed how political realignment in the Middle East could encourage
oil producers there to use their enhanced market power to capture new economic and
political rents, and, even, perhaps, encourage Russia to join in production-restraining
agreements. In alternative scenario 4 I posit that China might respond to these aggressive
actions by the major oil exporters in ways that would fundamentally upset the existing
global system of voluntary exchange and state sovereignty.

22
Appendix: Geopolitical Measures
The geopolitical measures—democracy, political power, risk of internal war, and
risk of interstate war—referred to in Table 2 and in the text are based on historical
measures taken from standard sources and projected into the future by the IFs model
The democracy variable is based on the Polity IV data bank from the Center for
International Development and Conflict Management (CIDCM) at the University of
Maryland. The data base is found at http://www.systemicpeace.org/polity/polity4.htm.
The CIDCM data base assigns a value to each year for each country on a scale of 0 to 10
for democracy (10 is more democratic) and 0 to 10 for autocracy (10 is more autocratic).
In 2004, the US scores a 10 for democracy and a 0 for autocracy, China scores a 0 for
democracy and a 7 for autocracy. For simplicity, the IFs Model combines the two scores
into one by adding 10 to the democracy score and subtracting the autocracy score, hence
the US scores 20 and China scores 3.
The IFs model’s basecase assumes there is a strong world-wide trend toward
democracy following the findings of Huntington (1991) and Diamond (2003), but the
trend for each country is influenced by changes in GDP per capita and changes in a
sociological value called the survival/self expression index. Inglehart and Baker (2000)
have suggested that it is not just higher levels of economic welfare per se that leads to the
development of democratic institutions but also the duration of time various age cohorts
have lived in societies where basic economic needs seem more or less assured.
Attempts to quantify political power have produced a large literature surveyed by
Kugler and Arbetman (1989) and Tellis et al. (1999) but no consensus and a wide variety

23
of opinions from using very parsimonious measures (Kugler and Arbetman favor using
GDP alone) to extremely elaborate measures quantifying dozens or scores of indicators of
actual or potential power as shown in Pillsbury’s translation of Chinese works on
comprehensive national power (Pillsbury, 2000). The IFs model allows the user to
choose among (and weight) up to seven variables that are often mentioned in the
literature and that are projected in model simulations. This paper uses the following
measures and weights:
Measure Weight
GDP in 1995 purchasing power parity dollars .25
GDP in nominal dollars .25
Population .125
Military spending in constant dollars .25
Nuclear weapons .062
Technological sophistication .062
The risk of extreme internal instability is based on work by the State Failure
(now Political Instability) Task Force at the University of Maryland and available at
http://cidcm.umd.edu/inscr/stfail. The IFs model has attempted to use insights from the
Political Instability Task Force’s decade-long effort to model various forms of state
instability (see especially Goldstone et al., 2004). The IFs model projects changes from
the historical likelihood of each country falling into instability as a function of infant
mortality, trade openness, democratization, and the level of education.
The IFs model estimates the risk of interstate war based on historical data from
the Militarized Interstate Dispute (MIDS) data base compiled by Jones, Bremer, and
Singer (1996), work on power transition theory by Tamen et al. (2000), and work on
trade and war by Mansfield (1994). The model calculates the dyadic risk of war as a
function of power asymmetries, political structure, and trade interconnectedness.

24
References:
Blanchard, O. J. and Gali, J., “The Macroeconomic Effects of Oil Shocks: Why are the
2000s so different from the 1970s?”, NBER Working Paper 13368, September 2007.
Diamond, L., (2003), “Universal Democracy,” Policy Review, pp 3-25, June.
CERA (2008), “Finding the Critical Numbers”, press release 17 January, 2008,
http://www.cera.com/aspx/cda/public1/news/pressReleases/pressReleaseDetails.aspx?CI
D=9203
Energy Modeling Forum, “Aggregate Elasticity of Energy Demand,” EMF report 4, Vol.
2, Nov 1981 (available at http://www.stanford.edu/group/EMF/publications/search.htm).
Gartzke, E. (2007), “The Capitalist Peace”, American Journal of Political Science, Vol.
51, No. 1, January 2007, pp 166-91.
Gholz, E, and Press, D. (2007), “Energy Alarmism: The Myths That Make Americans
Worry About Oil”, Cato Policy Analysis No. 589,
http://www.cato.org/pub_display.php?pub_id=8161
Goldstone, J., Gurr, T. R, Marshall, M., and Ulfelder, J., (2004), “It’s all about State
Structure—New Findings on Revolutionary Origins from Global Data”, Homo
Oeconomicus 21:3, pp. 429-455.
Hamilton, J. D., “This is what happened to the oil price macroeconomy relation”,
Journal of Monetary Economics, 38 (1996).
Huntington, S. P., (1991), The 3rd
Wave: Democratization in the Late 20th
Century.
Norman, Oklahoma: Oklahoma University Press, 1991.
Hughes, B. B., and Hillebrand, E. E., Exploring and Shaping International Futures,
Paradigm Publishers, 2006.
Inglehart, R. and Baker, W., (2000), “Modernization, Cultural Change, and the
Persistence of Traditional value,” American Sociological Review, 2000, vol. 65, (Feb), pp
19-51.
Intergovernmental Panel on Climate Change (IPCC) (2000), “Third Assessment Report
(Special Report on Emissions Scenarios - SRES)”.
http://sedac.ciesin.columbia.edu/ddc/sres/index.html

25
Jones, D.M., Bremer, S. A., and Singer, J. D., (1996) ."Militarized Interstate Disputes,
1816-1992: Rationale, Coding Rules, and Empirical Patterns." Conflict Management
and Peace Science, 15(2): 163:213.
Krichene, N. (2005) “A Simultaneous Model for World Crude Oil and Natural Gas
Markets”, IMF Working Paper, WP/05/02.
Kugler, J. and Arbetman, M. (1989), “Choosing Among Measures or Power: A Review
of the Empirical Record”, Chapter 4 in Power and World Politics by Richard Stoll and
Michael Ward. Lynne Reinner Publishers.
Kugler, J. (2006), “Asia Ascent: Opportunity for Peace or Precondition for War?”
International Studies Perspectives, Feb 2006, Vol. 7, pp 36-42.
Maddison, A., (2003), The World Economy: Historical Statistics. Paris: OECD, 2003.
Maddison, A., (2007). Contours of the World Economy, 1-2030, AD. Oxford University
Press.
Mansfield, Edward D. (1994). Power, Trade, and War, Princeton University Press.
Meadows, D., Randers, J., and Meadows, R., (2004). Limits to Growth: The 30-year Update.
Chelsea Green Publishing Co.
National Intelligence Council, Mapping the Global Future, December 2004, available at the
Government Printing Office (GPO stock number 041-015-00240-6) or on the web at
http://www.dni.gov/nic/NIC_globaltrend2020.html.
Pillsbury, M., (2000), China Debates the Future Security Environment, National Defense
University Press.
Tammen, R. L, Lemke, D., Alsharabati, C., Efird, B., Kugler, J., Allan C. Stam, A. C.,
Abollahian, M. A., Organski, A. F. K., (2000), Power Transitions: Strategies for the 21st
Century. Chatham House Publishers.
Tellis, A., Sollinger, J., Layne, C., Bially, J., and McPherson, M. (1999), Measuring
National Power in the Postindustrial Age. Rand Corporation.
Stern, R. (2006), “Oil market power and United States national security”, National Academy of
Scnieces of the USA, www.pnas.org/cgi/doi/10.1073/pnas.0503705102.
USCC. (2007). US-China Economic and Security Review Commission Report to Congress 2007.
http://www.uscc.gov/annual_report/2007/07_report_chapters.php
Yetiv, S. A. (2004), Crude Awakenings: Global Oil Security and American Foreign Policy.
Cornell University Press.