Embed Size (px)
Citation preview

866.975.6232 | nada.com/b2b
NADA Used Car Guide
Q4 2014
How Redesigns Affect Used
Vehicle Prices
AT A GLANCE
History of redesigns
Impact of redesigns on used vehicle price premiums
Key factors determining a redesign's overall value
Expectations for top 2015 redesigns

866.975.6232 | nada.com/b2b
How Redesigns Affect Used Vehicle Prices
2
INTRODUCTIONAutomakers have a lot on the line when it comes to redesigning an existing model.1 They invest years of planning and millions of dollars in each launch with no guarantee the market will embrace their efforts. A miss can force a manufacturer to divert precious resources to fixing perceived shortcomings, while a hit can bring an entire brand to a higher level of success.
Redesigns present automakers with their best opportunity for market growth. Studies have shown that new or extensively updated models offer manufacturers the opportunity to expand their presence within various segments, but a lack of updates virtually condemns manufacturers to stagnation or decay.
For these reasons, the 2015 model year will be one of the most important in recent memory for shaping the automotive landscape. Thirty-four redesigned models will hit the marketplace. For context, redesigns have averaged 22 per year since 1989; only 2007, with a total 41 redesigns, saw a higher number of redesigns than is scheduled for 2015.
It is critical for an automaker to accurately estimate the impact of a redesign on key performance areas. Among other things, how a redesign (or series of redesigns and new model introductions) will affect market share is of keen interest to shareholders. Plus, automakers must have a firm grasp on expected sales volumes in order to create effective production plans, manage supplier relations and account for future R&D costs.
From a pricing standpoint, a redesign’s projected impact on demand influences new vehicle pricing, incentive strategy and used vehicle residual values — which in turn influences lease strategy. Measuring the projected impact of changes in horsepower and fuel economy on used vehicle prices is fairly straightforward. But the most important part of a model redesign — changes to the design itself — is highly subjective, which makes it harder to estimate the total redesign effect.
This report presents NADA Used Car Guide’s methodology for measuring the value of the various price-influencing factors related to model redesigns.1 A redesign encompasses significant alterations to the exterior and interior design of a pre-existing model. Redesigns include major revisions to
mechanical or functional components and frequently include heavily revised powertrains and different platform architecture. Redesigns shouldn't be confused with model refreshes, which occur more frequently, are largely cosmetic in nature, involve a milder (if any) reworking of powertrain components and do not include a platform change.

866.975.6232 | nada.com/b2b
How Redesigns Affect Used Vehicle Prices
3
HISTORY OF REDESIGNSNADA maintains a comprehensive database of design changes, including new models, redesigns and refreshes, dating back to the 1989 model year.
It is important to note that the number of annual redesigns is affected in part by the total number of models available on the market. The number of new models introduced each year went from an average of 16 in the 1990s to more than 22 between the years 2000 and 2007. The Great Recession and its aftereffects reduced new model growth to an average of 15 per year from 2008 to 2014, but introductions are scheduled to jump to 23 for the 2015 model year. Since new model introductions have repeatedly outpaced model exits over the past 25 years, the total number of models available has steadily increased. For the 2015 model year, it’s expected that consumers will have 283 models to choose from, up 99% from 1990’s 142 models (figure 1).
Calendar Year
Num
ber
of M
odel
s
Source: NADA Used Car Guide
NET LIGHT VEHICLE MODEL GROWTH
300
250
200
150
100
50
0
1989
1990
1991
1992
1993
1994
1995
1996
1997
1998
1999
2000
2001
2002
2003
2004
2005
2006
2007
2008
2009
2010
2011
2012
2013
2014
2015
Figure 1

866.975.6232 | nada.com/b2b
How Redesigns Affect Used Vehicle Prices
4
Although not as dramatic as overall model growth, figure 2 shows that the number of redesigned models has also gradually trended up over the last few decades. Overhauls averaged respective figures of 20 and 24 per year in the 1990s and 2000s, and redesigns are set to rise to an average of 26 per year over the first half of the current decade.
Redesigns define the success of a manufacturer in today’s environment, where quality and durability have become standard. Therefore, it’s important to understand the positive effects redesigned models have — not only in the new market, but in the used market as well.
Model Year
45
40
35
30
25
20
15
10
5
0
Num
ber
of M
odel
s Re
desi
gned
Source: NADA Used Car Guide
NUMBER OF LIGHT VEHICLE REDESIGNS Total and by manufacturer type.
Domestic Import Total
1989
1990
1991
1992
1993
1994
1995
1996
1997
1998
1999
2000
2001
2002
2003
2004
2005
2006
2007
2008
2009
2010
2011
2012
2013
2014
2015
Figure 2

866.975.6232 | nada.com/b2b
How Redesigns Affect Used Vehicle Prices
5
MEASURING REDESIGN IMPACTWith relatively few exceptions, history has shown that a thorough overhaul dramatically improves the outlook for a model in both the new and used vehicle markets.
After controlling for factors such as changes in the economy, advertising expenditures and new car prices, researchers at Virginia Commonwealth University found that a full redesign yielded, on average, a nearly 20% increase in new market share for the initial model year.2 By comparison, a 10% reduction in price was found to increase share by just 2.1%, while automakers would have to raise advertising outlays by 100% to match the benefit of a redesign. The authors concluded that “new product, as measured by restyling, represents the most consistent, dominant determinant of demand.”
As far as used vehicles are concerned, NADA Used Car Guide’s analysis has shown that redesigns have a substantial impact on used prices. Within a design generation, a one-year-old vehicle is generally 15–20% more expensive than a two-year-old vehicle. A redesign increases this spread significantly, adding another 15–20% on top of the premium already held by the one-year-old model (table 1).
Say, for example, that we have a two-year-old vehicle worth $20,000. The price of a redesigned one-year-old vehicle would be 17.5% more (the median of our 15–20% range) simply because it’s newer, with an additional 17.5% tacked on due to the redesign. Therefore, the total lift in price would equal 35%, and the final price of the redesigned one-year-old vehicle would be $27,000.
2 Korenok, Oleg, George E. Hoffer and Edward L. Millner. “Non-Price Determinants of Automotive Demand: Restyling Matters Most.” Working paper. Virginia Commonwealth University, 2009.

866.975.6232 | nada.com/b2b
How Redesigns Affect Used Vehicle Prices
6
Table 1
15–20% Age Premium
15–20% Redesign Premium
30–40% Total Age + Redesign Premium
The average amount a 1-year-old model sells for over a 2-year-old model, both being sold at the
same time.
The average amount a redesign adds to the 1-year-old premium.
The total average premium of a redesigned 1-year-old model versus a 2-year-old
unchanged model.
Source: NADA Used Car Guide
Used Price Premiums: 1-Year-Old Versus 2-Year-Old Models
NADA Used Car Guide’s research has revealed several characteristics that strongly influence the degree to which used values are raised as a result of a redesign. We’ve found that the number of years since the last redesign (or life cycle duration), the amount of competition within a segment and the quality of the design itself all play primary roles in determining the overall value of a redesign. Powertrain traits — horsepower, torque and fuel economy — also wield considerable clout in dictating impact. These factors overshadow issues such as reliability, warranty and safety regarding the value of a redesign.
Key Factor #1: Lifecycle DurationExperience tells us that products generally become less valuable as their design ages. This is especially true for products like automobiles, where design encompasses equal parts fashion and technology. Excluding collectibles, if we were to park a new car in a garage and let it sit for a number of years, we know intuitively that it would lose value simply because its design would age while the designs of competitive cars would evolve.

866.975.6232 | nada.com/b2b
How Redesigns Affect Used Vehicle Prices
7
After accounting for other price-influencing factors (e.g., mileage), NADA Used Car Guide’s statistical analysis has revealed that on average, a model’s used value drops 1.4 percentage points every year it carries the same design. The declines are slightly heavier in the first year after the introduction, and are relatively steady thereafter. So over a five-year life cycle, on average a model will lose 8% of its value because of design aging (figure 3).
6.0%
5.0%
4.0%
3.0%
2.0%
1.0%
0.0%
-1.0%
-2.0%
-3.0%
-4.0%
Design Age Relative to Segment Average
Pric
e Re
lativ
e to
Seg
men
t Ave
rage
Source: NADA Used Car Guide
VALUE OF A DESIGN BY AGEThe difference in used vehicle price based on a design's age, both relative to the segment average (denoted by 0). For example, prices of a model carrying a design 3 years older than the average age of the segment (0) are generally 3% lower than the average segment price.
-2 -1 0 1 2 3
A model's used value drops by 1.4 pointsevery year it carries the same design.
NADA has found that, depending on the extent of the change, more substantial refreshes can reduce but not remove the impact of design aging, while minor refreshes have no significant impact. For example, a model receiving a successful major refresh in year three is likely to have lost less value — perhaps 7% — by year five, rather than the 8% loss suffered by the model left unchanged over the period.
Figure 3

866.975.6232 | nada.com/b2b
How Redesigns Affect Used Vehicle Prices
8
Key Factor #2: Competitive Concentration Similar to age, the degree of competitive concentration within a segment can significantly impact the change in value associated with a redesign. NADA Used Car Guide’s analysis has found that redesign value is greater in segments where competition is highly concentrated on a small percentage of models, while the opposite is true in segments where competition is more evenly distributed across a larger percentage of models.
An example of a highly concentrated segment is luxury midsize cars, where just two models out of 16 — the BMW 5 Series and Mercedes-Benz E-Class — are responsible for nearly 50% of the segment’s new vehicle sales. Compact utilities provide an example of a less-concentrated segment, as five models out of 20 are responsible for 50% of new sales, with the sales tightly grouped among a large number of remaining models.
Comparatively, our analysis revealed that redesigns in the most heavily concentrated segments provided 3–4% more lift in used value than redesigns in the least concentrated segments. Essentially, redesign impact is more significant in situations when relatively few models capture the attention of the majority of consumers because redesigns stand out much more clearly. This makes intuitive sense as well. It’s much more likely that a redesign in the hypercompetitive midsize car segment (Ford Fusion, Honda Accord, etc.) will receive less attention, and consequently generate less of an impact, than in the decidedly less competitive luxury large car segment (BMW 7 Series, Mercedes S-Class, etc.).
866.975.6232 | nada.com/b2b
How Redesigns Affect Used Vehicle Prices
9
Key Factor #3: Design QualityThe most important factor in determining the degree of value change is the success of the design itself. Great design can radically improve the outlook for a brand. The Korean brand Hyundai is an excellent example of this. In its early years in the U.S. market, Hyundai’s approach to design fell woefully short of the competition. The company’s designs lacked cohesion, both for a given model and across the entire brand lineup, and practically screamed “economy.”
The release of the redesigned Hyundai Sonata in 2011 set in motion a transformation for the automaker. At the time, the Sonata’s fluidic design starkly contrasted with both the outgoing model and its competitors in the midsize car segment. And consumers flocked to the model in droves because of this contrast. Today, Hyundai has arguably one of the best-looking lineups in the industry, and the value of the brand has improved substantially as a result of its appealing designs.
Measuring the effectiveness of a new design and how it will affect used vehicle prices can be something of a challenge. Good design doesn’t mean the same thing to everyone, and an element considered bold by one may be gaudy to another. NADA Used Car Guide rates redesigns based on the severity and quality of the design change; i.e., how significantly the interior and exterior designs change between generations and how impressed we are with the change.

866.975.6232 | nada.com/b2b
How Redesigns Affect Used Vehicle Prices
10
To better control for the inherent subjectivity in design, NADA’s team of analysts is tasked with rating the severity and quality of a redesign across a standardized list of factors centering on three areas: exterior design, interior design and tactile performance characteristics (figure 4).
Using a pool of analysts to grade in this fashion improves rating consistency, which in turn improves our ability to statistically measure the subjective characteristics associated with a given design.
The following examples paint a practical picture of how each of these areas influences redesign value in the used market.
NADA’S DESIGN GRADING AREAS
Interior Design- Styling- Ergonomics- Technology and audio / entertainment ease of use- Quality of materials
Tactile Performance- Handling- Braking- Driving dynamics- Powertrain harmony
Exterior Design- Styling- Fit and finish- Attention to detail
Source: NADA Used Car Guide
Figure 4

866.975.6232 | nada.com/b2b
How Redesigns Affect Used Vehicle Prices
11
REDESIGNS FROM THE PASTSuccessful redesigns show a huge increase in price between generations. As shown in table 2, redesigns of the 2011 Kia Optima, 2007 Cadillac Escalade and the 2010 Buick LaCrosse all increased the model year spread in prices by more than 45%. Mercedes-Benz’s successful 2007 redesign of its flagship S-Class increased the spread over the outgoing 2006 model by a whopping $18,250.
To truly isolate the success of a redesign, we need to address changes in price after accounting for changes in volume (i.e., change in demand). Did the redesign cause consumers to want more of these vehicles at a given price? When accounting for the trade-off between price and volume, some vehicles with an average or even below-average redesign value (based only on the observed price) rise to the surface as being among the most successful.
*Excludes the price premium associated with younger age.
Source: IHS Global Insight (Polk) / NADA Used Car Guide
HIGHLY SUCCESSFUL REDESIGNS
2007 Chevrolet Tahoe 207,869 41,993 $22,774 $14,365 42.5% 95.1% 4.4% 8.4% 1.1% 81.1%
2007 Mercedes-Benz S-Class 30,037 12,430 $45,502 $23,485 77.8% 91.3% 10.1% 7.7% 1.1% 72.4%
2011 Hyundai Sonata 257,983 43,229 $14,343 $9,602 33.4% 84.3% 4.7% 4.9% 0.1% 75.1%
2010 Ford Taurus 37,165 7,631 $17,809 $10,575 52.4% 80.7% 1.1% 5.6% 0.7% 73.2%
2004 Toyota Sienna 198,771 40,032 $14,609 $9,237 42.2% 79.3% 3.0% 6.3% 0.0% 71.0%
2007 Cadillac Escalade 45,793 9,780 $31,282 $19,301 46.1% 78.8% 6.2% 4.9% 1.4% 66.4%
2011 Kia Optima 57,756 11,269 $16,583 $10,253 45.7% 75.6% 6.2% 4.9% 0.1% 64.4%
2011 Jeep Grand Cherokee 116,725 25,428 $24,450 $16,846 29.1% 75.6% 7.3% 6.3% -1.3% 64.0%
2010 Buick LaCrosse 47,608 12,699 $17,877 $10,691 51.2% 71.4% 2.7% 4.9% -0.5% 64.4%
2004 Lexus RX 130,648 30,476 $24,421 $17,639 22.5% 68.0% 2.9% 4.9% 0.3% 59.5%
ModelMake
Model Year (MY) Re
design
MY
Outgo
ing M
Y
Redes
ign M
Y
(a
s a 1-
year-o
ld)
Outgo
ing M
Y
(a
s a 2-
year-o
ld)
Volum
e Unad
justed
Re
design
Price
Sprea
d*
Volum
e Adju
sted
Re
design
Price
Sprea
d*
Powert
rain
(
horsep
ower,
torqu
e, fue
l econ
omy)
Age o
f
Ou
tgoing
Desig
n
Segm
ent
Co
ncentr
ation
Desig
n Qual
ity
New VehicleRegistrations Average Used Price
Redesign Factor In�uence
on Used Value (%)
Table 2

866.975.6232 | nada.com/b2b
How Redesigns Affect Used Vehicle Prices
12
For example, the redesign of the 2008 Chevrolet Malibu increased its price by 45% versus the previous model year (above the normal 15–20% year-over-year gap). While this seems substantial enough, the Malibu’s volume increased dramatically between the 2007 and 2008 model years (relative to overall midsize car segment level changes). If we adjust for its twofold increase in supply, prices for the new Malibu would have increased by 55–60% (figure 5).
NEW REDESIGN EXPECTATIONS2015 Ford MustangCelebrating its 50th anniversary, the 2015 Mustang is a more modern interpretation of the classic muscle car. The body has a leaner, more expressive appearance marked by a lower ride height, more aggressive wheel offsets and a seamless B pillar. While design changes aren’t as radical as those of the 2005 redesign, the look of the 2015 Mustang is highly appealing and is a clear improvement over the outgoing model.
Influ
ence
on
Valu
e
70.0%
60.0%
50.0%
40.0%
30.0%
20.0%
10.0%
0.0%
Redesign Factor
Aesthetic and Feel
Age of Outgoing Design
Segment Concentration
Engine Total Redesign Lift
2008 MY CHEVROLET MALIBU REDESIGN VALUE The difference in price between the outgoing 2007 model year and redesigned 2008 model year Chevy Malibu (after adjusting for volume).
Negative Factors Positive Factors
1.5% 1.0%
55.3%
3.5%
56.3%
Figure 5
866.975.6232 | nada.com/b2b
How Redesigns Affect Used Vehicle Prices
13
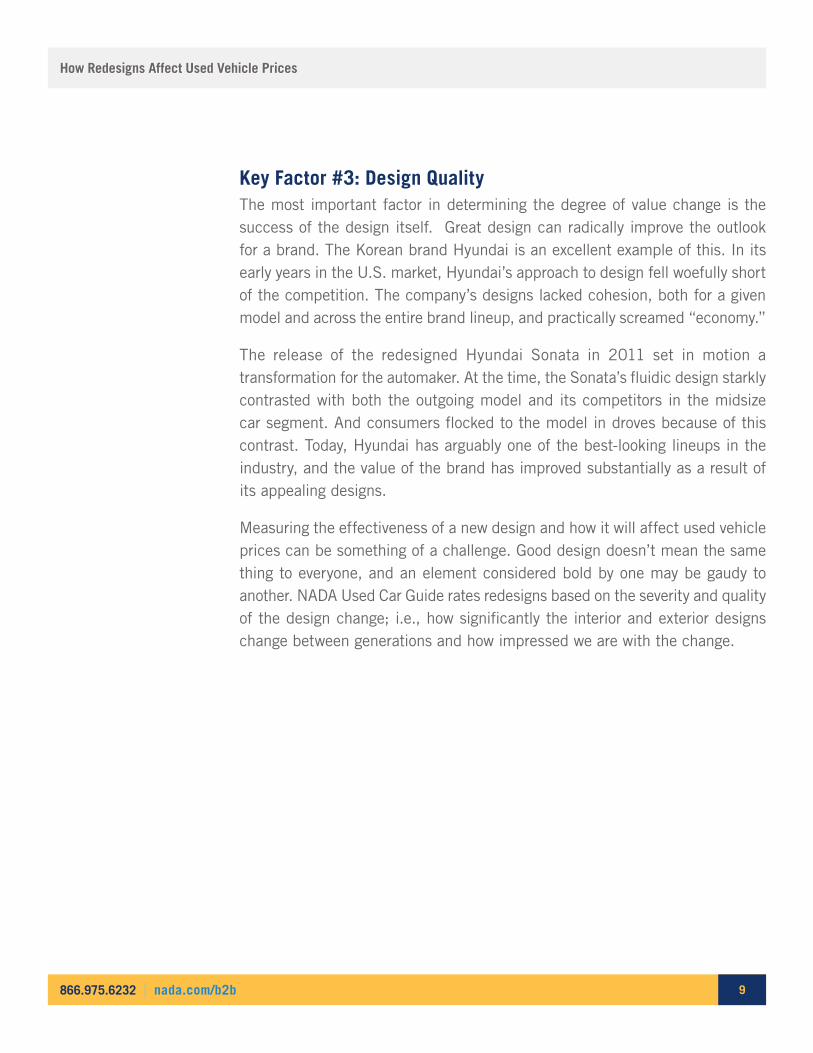
Modified versions of the existing 3.7L V6 and 5.0L V8 remain under hood, and for the first time since 1993 the Mustang can be outfitted with a turbocharged four-cylinder engine. One of the biggest changes to the Mustang will be felt more than seen, as the rear suspension moves to a multilink independent setup and away from the solid rear axle that has underpinned the car from its inception. The revised suspension dramatically improves the new Mustang’s drivability and everyday usability.
2014 MY Ford Mustang
2015 MY Ford Mustang
Image courtesy of Ford.com

866.975.6232 | nada.com/b2b
How Redesigns Affect Used Vehicle Prices
14
The last time the Mustang underwent a complete overhaul was back in 2005, though the car has received three refreshes over its extended life cycle. Given this, we consider the 2015 model as effectively replacing a seven-year-old design rather than a nine-year-old one. Regardless, the Mustang’s outgoing design remains old, relative to the sports car segment mean, even after accounting for refreshes.
The Mustang competes in a segment roughly in the middle of the range in terms of competitive concentration. Considering this factor, we expect the Mustang’s redesign value to hold a premium of 1–2 percentage points over the value of redesigns from less-concentrated segments such as intermediate compact and midsize cars. As for the design itself, changes made to the Mustang’s design and tactile performance characteristics were well received by NADA Used Car Guide’s analysts and the media alike. Overall, the Mustang’s score fell in the 75th percentile of our rating scale, exemplifying a strong redesign.
New Mustang prices show increases of 3–8% for the normally aspirated engines, with prices for turbocharged four-cylinder trims slotting reasonably within the lineup. The Mustang’s price increases will reduce some of the volume surge we would otherwise expect from a strong redesign, which will in turn allow for strong pricing in the used vehicle market (provided Ford doesn’t promote the vehicle with aggressive incentives).
The Mustang’s 2005 redesign lifted prices by 36%, or nearly 20% above the normal premium over the previous model year. NADA Used Car Guide expects this latest redesign to have a slightly smaller value of 30%, owing in part to the fact that the 2005 redesign was such a dramatic change relative to the 2004 model.

866.975.6232 | nada.com/b2b
How Redesigns Affect Used Vehicle Prices
15
2015 Hyundai SonataSignaling the ultracompetitiveness of the midsize car segment, Hyundai’s Sonata sedan is redesigned for 2015 after a relatively short four-year run of its impressive 2011 redesign. Outside, a more refined, upscale look replaces the series of playful, fluid lines that punctuated the design of the previous generation. The old design’s steeply raked rear end has been dialed back a bit, thereby creating additional head and leg room for rear passengers — important, given the family-oriented demographic the Sonata targets. In fact, the new Sonata is slightly longer and wider and has more interior room in virtually every area.
2014 MY Hyundai Sonata
2015 MY Hyundai Sonata
Image courtesy of Hyundaiusa.com

866.975.6232 | nada.com/b2b
How Redesigns Affect Used Vehicle Prices
16
Similarly, the interior of the 2015 model has been given a more streamlined design with material upgrades in certain areas. The 2.4L naturally aspirated and 2.0L turbocharged four-cylinder engines have carried over, although horsepower and torque on the 2.0L have dropped by 11% and 3%, respectively. Fuel economy has improved slightly, however.
In our view, the 2015 Hyundai Sonata is a well-executed redesign whose comfort-oriented improvements should be well received by consumers. However, the new Sonata’s look is visually less distinctive, and therefore less likely to attract attention, than the outgoing model. Overall, the Sonata’s redesign score fell slightly above the midpoint of our rating scale, exemplifying a modest redesign. In addition, the low concentration of the midsize car segment — due to the large number of competitors sharing overall demand relatively evenly — will also dampen the Sonata’s redesign lift.
As for new vehicle pricing, the 2015 Sonata is priced below the previous generation by approximately 3%. This will likely lead to increased new vehicle sales and used supply, and as such, dampen the redesign lift to used prices. Given these factors, NADA expects the 2015 redesign to improve the premium over a 2014 model by a range of 20–30% instead of the 30–40% range observed for redesigns on average.
866.975.6232 | nada.com/b2b
How Redesigns Affect Used Vehicle Prices
17
CONCLUSIONConsidering the growing parity in durability, efficiency and safety, the importance of a well-executed redesign has likely never been greater. As every manufacturer can attest, however, placing a finger squarely on the design pulse of consumers can be extremely difficult.
The sheer number of models on the market today increases the design challenge for automakers. Instead of overhauling a smaller number of models every six years or so, manufacturers must revise broader lineups over a similar time frame. This complicates pre-launch efforts by increasing the scope of work necessary to determine production logistics, marketing strategies and residual value setting.
Inarguably, redesigns that strike a strong emotional chord with consumers stand the best chance of improving new sales growth and used price premiums. However, market results for both great and mediocre redesigns alike can be enhanced by more precisely estimating the effect that core traits will have on consumer demand. Armed with this information, automakers can better calibrate their approach to new vehicle pricing, production volume and incentives in order to achieve maximum redesign results.

866.975.6232 | nada.com/b2b 18
NADA Used Car GuideSince 1933, NADA Used Car Guide has earned its reputation as the leading provider of vehicle
valuation products, services and information to businesses throughout the United States and
worldwide. NADA’s editorial team collects and analyzes over one million combined automotive
and truck wholesale and retail transactions per month. Its guidebooks, auction data, analysis
and data solutions offer automotive / truck, finance, insurance and government professionals
the timely information and reliable solutions they need to make better business decisions.
Visit nada.com/b2b to learn more.
NADA Consulting ServicesNADA’s market intelligence team leverages a database of nearly 200 million automotive transactions
and more than 100 economic and automotive market-related series to describe the factors driving
current trends to help industry stakeholders make more informed decisions. Analyzing data at
both wholesale and retail levels, the team continuously provides content that is both useful and
usable to the automotive industry, financial institutions, businesses and consumers.
Complemented by NADA’s analytics team, which maintains and advances NADA’s internal
forecasting models and develops customized forecasting solutions for automotive clients, the
market intelligence team is responsible for publishing original content in the form of blogs, white
papers and market reports. Throughout every piece of content, the team goes beyond what is
happening in the automotive industry to confidently answer why it is happening and how it will
impact the market in the future.
About NADA
Jonathan Banks Senior Director Vehicle Analysis & Analytics
[email protected] 703.749.4709
Larry Dixon Senior Manager Market Intelligence
[email protected] 703.749.4713
John Beckman Director Marketing & Communication
[email protected] 703.821.7095
For more information on this white paper or about NADA Consulting Services, contact:

866.975.6232 | nada.com/b2b 19
Follow us on Twitter@NADAUsedCarGde
Read our blogsnada.com/UsedCarnada.com/CommercialTruck
Find us on Facebookfacebook.com/NADAUsedCarGuide
Watch us on YouTubeyoutube.com/NADAUsedCarGuide
Additional Resources
Used Car & Truck BlogWritten and managed by the market intelligence team, the Used Car & Truck Blog
analyzes market data, lends insight into industry trends and highlights relevant
events. Join the conversation at nada.com/UsedCar
Commercial Truck BlogUpdated twice per week by Senior Analyst Chris Visser, the Commercial Truck
Blog provides real-time analysis of incoming sales data from the industry’s leading
used truck sales database. Join the conversation at nada.com/CommercialTruck
GuidelinesUpdated monthly with a robust data set from various industry sources and
NADA Used Car Guide’s own propriety analytical tool, Guidelines provides the
insight needed to make decisions in today’s market. Sign up to receive Guidelines
monthly at nada.com/b2b/ContactUs
White PapersNADA Used Car Guide’s white papers and special reports aim to inform industry
stakeholders on current and expected used vehicle price movement to better
maximize today’s opportunities and manage tomorrow’s risk. Sign up to receive
white papers quarterly at nada.com/b2b/ContactUs866.975.6232 | nada.com/b2b
NADA Used Car Guide
Q1 2014
NADA Used Car Guide Special Report:
2014 Used Vehicle Price Forecast
AT A GLANCE
Economic forecasts
New vehicle incentives expectations
Credit environment outlook
Used vehicle supply estimates
Used vehicle price forecasts