Embed Size (px)
Citation preview
1/31/2013
1
1 / 75 Software & Services Group, Energy Engineering Team
HPC Introduction
Philippe ThierryIntel Corp.
2 / 75 Software & Services Group, Energy Engineering Team
Agenda
• Introduction to HPC
• Silicium first:
• CPU
• Coprocessor
• Application point of view:
• Perf measurement
• How to make it faster
• Are the results valid ?
1/31/2013
2
3 / 75 Software & Services Group, Energy Engineering Team
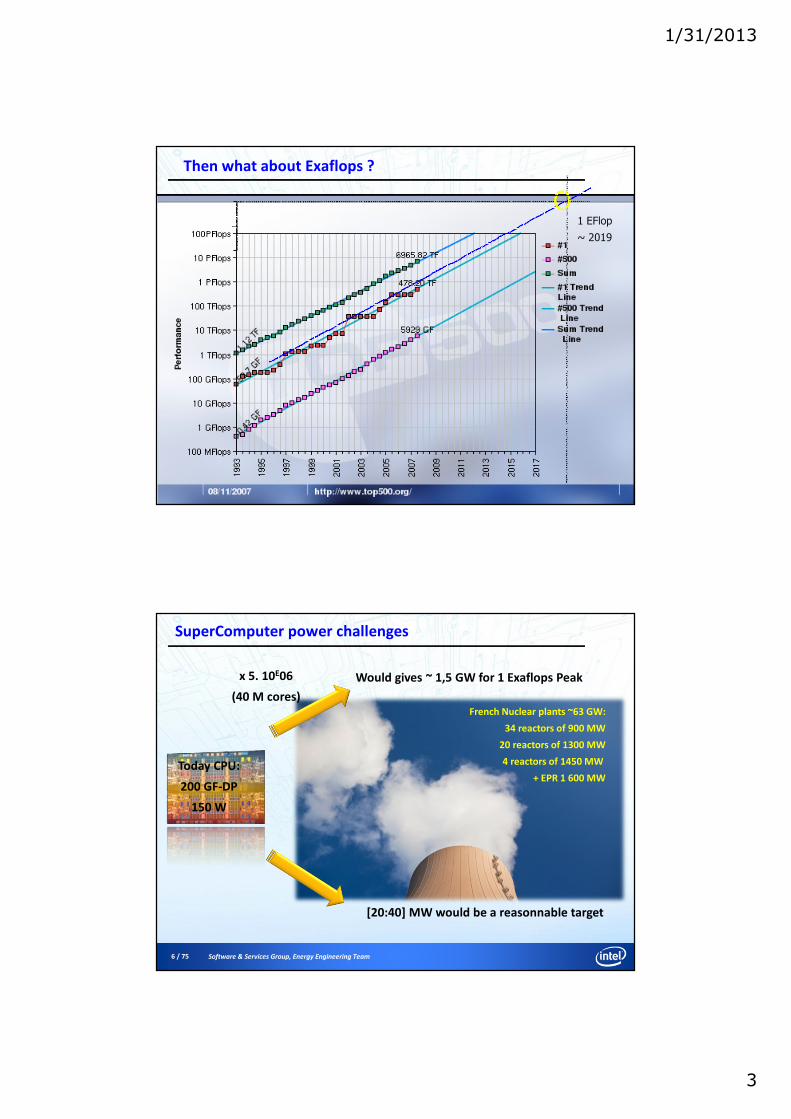
Glossary, “High performance computing”
� Peak Flops = nb of floating points operations per cycle * frequency
Efficiency = % of the peak performance
For Flops => Peak flops / Achieved flops
For BW => Peak GB/s versus Achieved GB/s
Both depend on Hardware and Software
sec/sec)/(*)/( FlopscyclecycleFlopsPeak ==
First question : what is the peak perf of your laptop ?
4 / 75 Software & Services Group, Energy Engineering Team
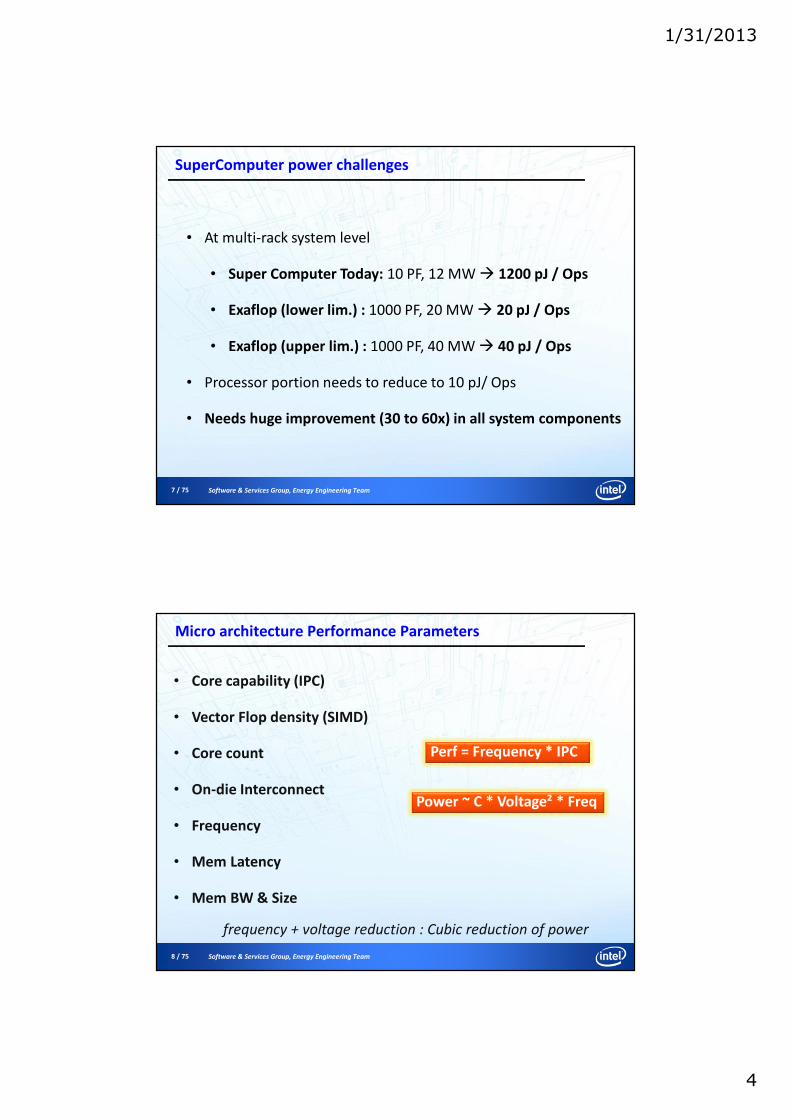
A very brief history
60’s 70’s 80’s 90’s 00’s
The Intel Paragon was a series of
massively parallel
supercomputers produced by
Intel The Paragon series was
based around the Intel i860 RISC
microprocessor. Up to 2048
(later, up to 4000) i860s were
connected in a 2D grid
The CM-5 is MIMD (Multiple
Instructions Multiple Data) using
commodity SPARC processors using a
"fat tree" interconnect
The CM-2 is SIMD
(16 k processors)
Intel ASCI RED:
MIMD massively-
parallel
processing
machine initially
consisting of
4,510 compute
nodes)
1 Tflops (1996)
RISC
Multithreading
Superscalar
Vector machine
MPP machine
1/31/2013
3
5 / 75 Software & Services Group, Energy Engineering Team
Then what about Exaflops ?
5
1 EFlop
~ 2019
6 / 75 Software & Services Group, Energy Engineering Team
SuperComputer power challenges
French Nuclear plants ~63 GW:
34 reactors of 900 MW
20 reactors of 1300 MW
4 reactors of 1450 MW
+ EPR 1 600 MWToday CPU:
200 GF-DP
150 W
Would gives ~ 1,5 GW for 1 Exaflops Peak
[20:40] MW would be a reasonnable target
x 5. 10E06
(40 M cores)
1/31/2013
4
7 / 75 Software & Services Group, Energy Engineering Team
SuperComputer power challenges
• At multi-rack system level
• Super Computer Today: 10 PF, 12 MW � 1200 pJ / Ops
• Exaflop (lower lim.) : 1000 PF, 20 MW � 20 pJ / Ops
• Exaflop (upper lim.) : 1000 PF, 40 MW � 40 pJ / Ops
• Processor portion needs to reduce to 10 pJ/ Ops
• Needs huge improvement (30 to 60x) in all system components
8 / 75 Software & Services Group, Energy Engineering Team
Micro architecture Performance Parameters
frequency + voltage reduction : Cubic reduction of power
• Core capability (IPC)
• Vector Flop density (SIMD)
• Core count
• On-die Interconnect
• Frequency
• Mem Latency
• Mem BW & Size
Perf = Frequency * IPC
Power ~ C * Voltage² * Freq
1/31/2013
5
9 / 75 Software & Services Group, Energy Engineering Team
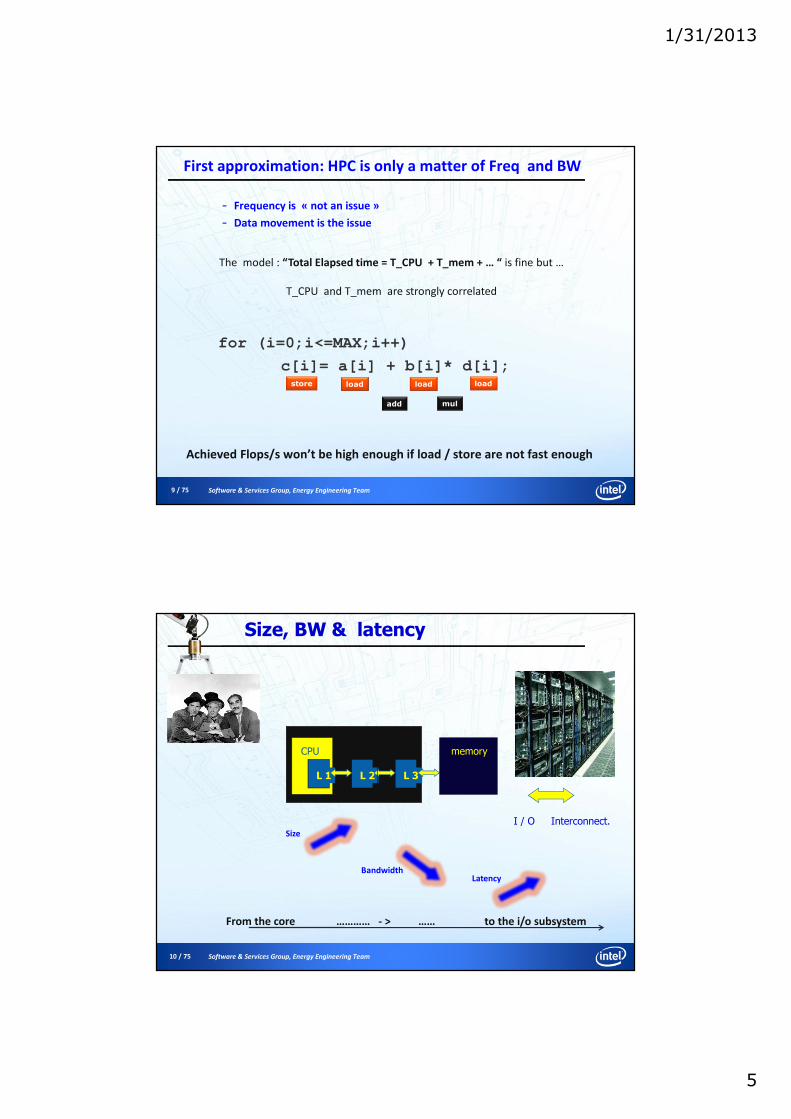
First approximation: HPC is only a matter of Freq and BW
- Frequency is « not an issue »
- Data movement is the issue
The model : “Total Elapsed time = T_CPU + T_mem + … “ is fine but …
T_CPU and T_mem are strongly correlated
for (i=0;i<=MAX;i++)
c[i]= a[i] + b[i]* d[i];store load load load
add mul
Achieved Flops/s won’t be high enough if load / store are not fast enough
10 / 75 Software & Services Group, Energy Engineering Team
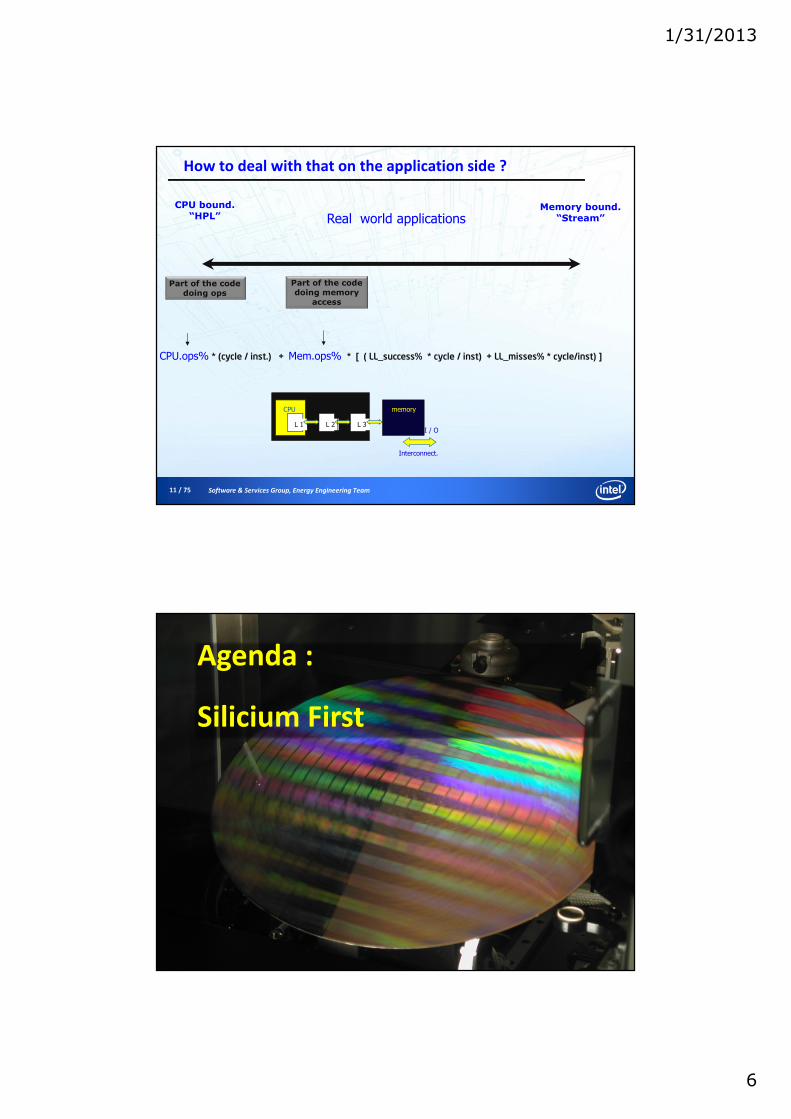
Size, BW & latency
CPU
L 1 L 2 L 3
memory
I / O Interconnect.
From the core ………… - > …… to the i/o subsystem
BandwidthLatency
Size
1/31/2013
6
11 / 75 Software & Services Group, Energy Engineering Team
CPU.ops% * (cycle / inst.) + Mem.ops% * [ ( LL_success% * cycle / inst) + LL_misses% * cycle/inst) ]
Memory bound.“Stream”
CPU bound.“HPL” Real world applications
Part of the code doing ops
Part of the code doing memory
access
How to deal with that on the application side ?
CPU
L 1 L 2 L 3
memory
I / O
Interconnect.
12 / 75 Software & Services Group, Energy Engineering Team
Agenda :
Silicium First
1/31/2013
7
13 / 75 Software & Services Group, Energy Engineering Team
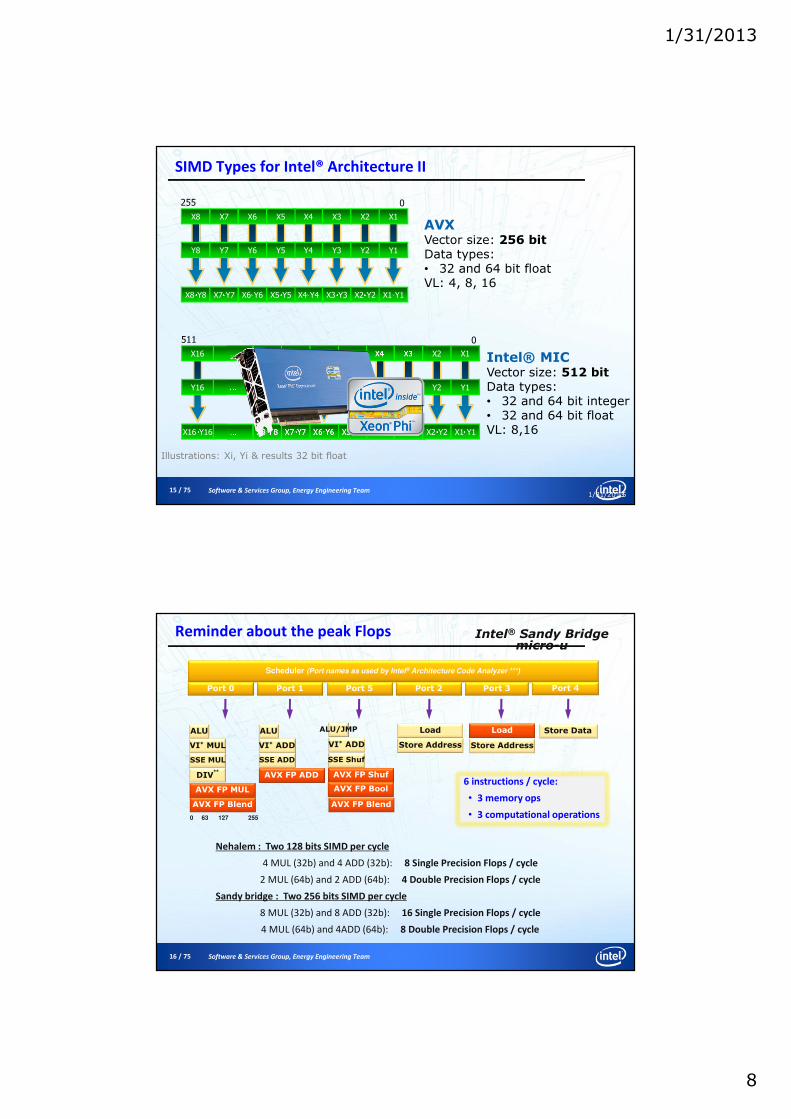
Vectorization
� Single Instruction Multiple Data (SIMD):
- Processing vector with a single operation
- Provides data level parallelism (DLP)
- Because of DLP more efficient than scalar processing
� Vector:
- Consists of more than one element
- Elements are of same scalar data types
(e.g. floats, integers, …)
1/31/201313
Scalar Processing
Vector Processing
AA BB
CC
++
A B
C
+
CiCi
++
AiAi BiBi
CiCi
AiAi BiBi
CiCi
AiAi BiBi
CiCi
AiAi BiBi
VLVL
Ci
+
Ai Bi
Ci
Ai Bi
Ci
Ai Bi
Ci
Ai Bi
VL
14 / 75 Software & Services Group, Energy Engineering Team
SIMD Types for Intel® Architecture I
1/31/201314
X2
Y2
X2◦Y2 X1
Y1
X1◦Y1063
MMX™ Vector size: 64 bitData types:•8, 16 and 32 bit integerVL: 2, 4, 8
SSEVector size: 128 bitData types:•8, 16, 32, 64 bit integer•32 and 64 bit float VL: 2, 4, 8, 16
X2
Y2
X2◦Y2 X1
Y1
X1◦Y1X4
Y4
X4◦Y4 X3
Y3
X3◦Y3127 0
Illustrations: Xi, Yi & results 32 bit integer
1/31/2013
8
15 / 75 Software & Services Group, Energy Engineering Team
SIMD Types for Intel® Architecture II
1/31/201315
AVX Vector size: 256 bitData types:• 32 and 64 bit floatVL: 4, 8, 16
Intel® MICVector size: 512 bitData types:• 32 and 64 bit integer• 32 and 64 bit floatVL: 8,16
X4
Y4
X4◦Y4 X3
Y3
X3◦Y3 X2
Y2
X2◦Y2 X1
Y1
X1◦Y10
X8
Y8
X8◦Y8 X7
Y7
X7◦Y7 X6
Y6
X6◦Y6 X5
Y5
X5◦Y5255
X4
Y4
X4◦Y4 X3
Y3
X3◦Y3 X2
Y2
X2◦Y2 X1
Y1
X1◦Y10
X8
Y8
X8◦Y8 X7
Y7
X7◦Y7 X6
Y6
X6◦Y6 X5
Y5
X5◦Y5X16
Y16
X16◦Y16 …
...
…
511
Illustrations: Xi, Yi & results 32 bit float
16 / 75 Software & Services Group, Energy Engineering Team
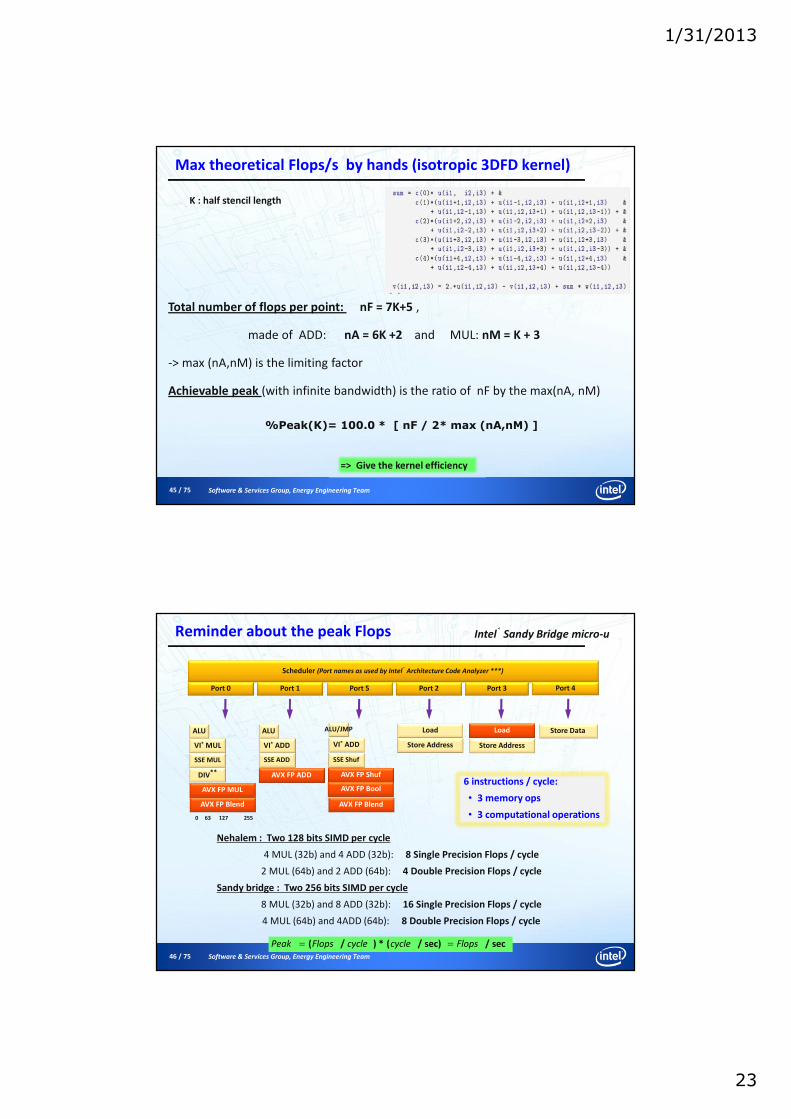
Reminder about the peak Flops
Scheduler (Port names as used by Intel® Architecture Code Analyzer ***)
Load
Port 0 Port 1 Port 5 Port 2 Port 3
Load
Store Address
Store DataALUALU ALU/JMP
AVX FP Shuf
AVX FP Bool
VI* ADDVI* MUL
SSE MUL
DIV**
SSE ADD
AVX FP ADD
AVX FP MUL
0 63 127 255
SSE Shuf
AVX FP Blend
Port 4
AVX FP Blend
VI* ADD Store Address
6 instructions / cycle:
• 3 memory ops
• 3 computational operations
Nehalem : Two 128 bits SIMD per cycle
4 MUL (32b) and 4 ADD (32b): 8 Single Precision Flops / cycle
2 MUL (64b) and 2 ADD (64b): 4 Double Precision Flops / cycle
Sandy bridge : Two 256 bits SIMD per cycle
8 MUL (32b) and 8 ADD (32b): 16 Single Precision Flops / cycle
4 MUL (64b) and 4ADD (64b): 8 Double Precision Flops / cycle
Intel® Sandy Bridge micro-u
1/31/2013
9
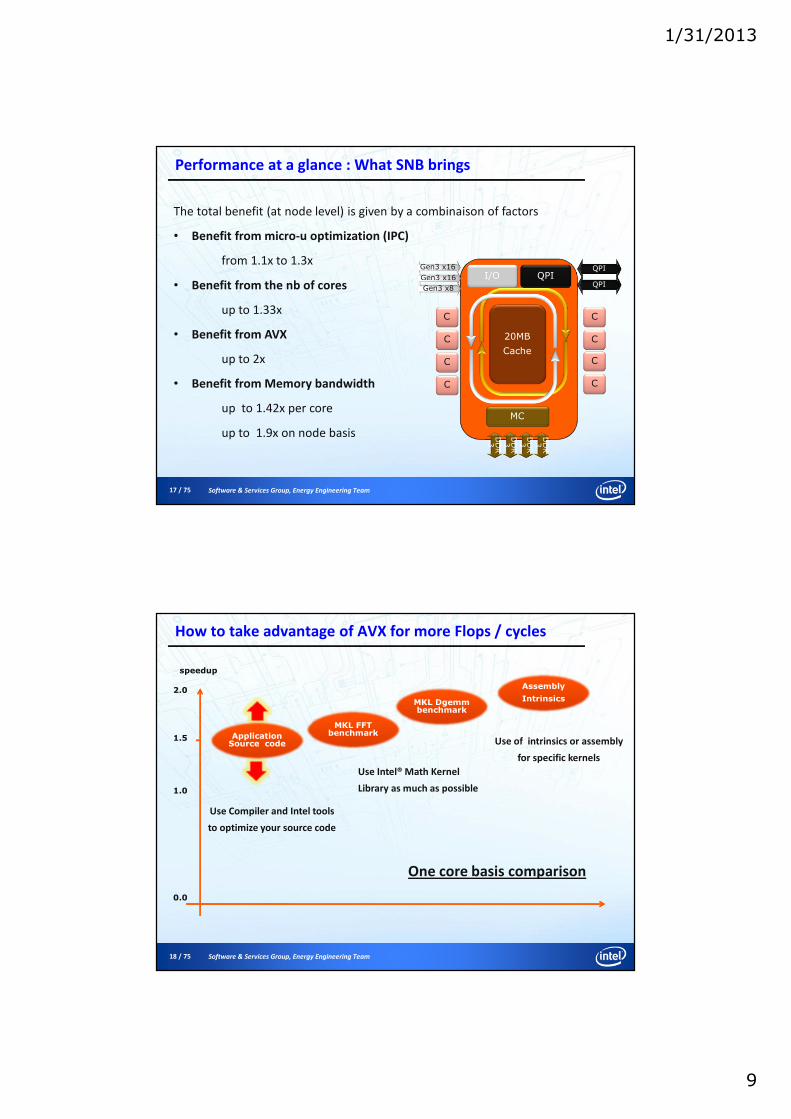
17 / 75 Software & Services Group, Energy Engineering Team
Performance at a glance : What SNB brings
The total benefit (at node level) is given by a combinaison of factors
• Benefit from micro-u optimization (IPC)
from 1.1x to 1.3x
• Benefit from the nb of cores
up to 1.33x
• Benefit from AVX
up to 2x
• Benefit from Memory bandwidth
up to 1.42x per core
up to 1.9x on node basis DD
R3
DD
R3
DD
R3
DD
R3
20MB
Cache
C
C
C
C
MC
QPII/O
C
C
C
C
QPI
QPI
Gen3 x16
Gen3 x16
Gen3 x8
18 / 75 Software & Services Group, Energy Engineering Team
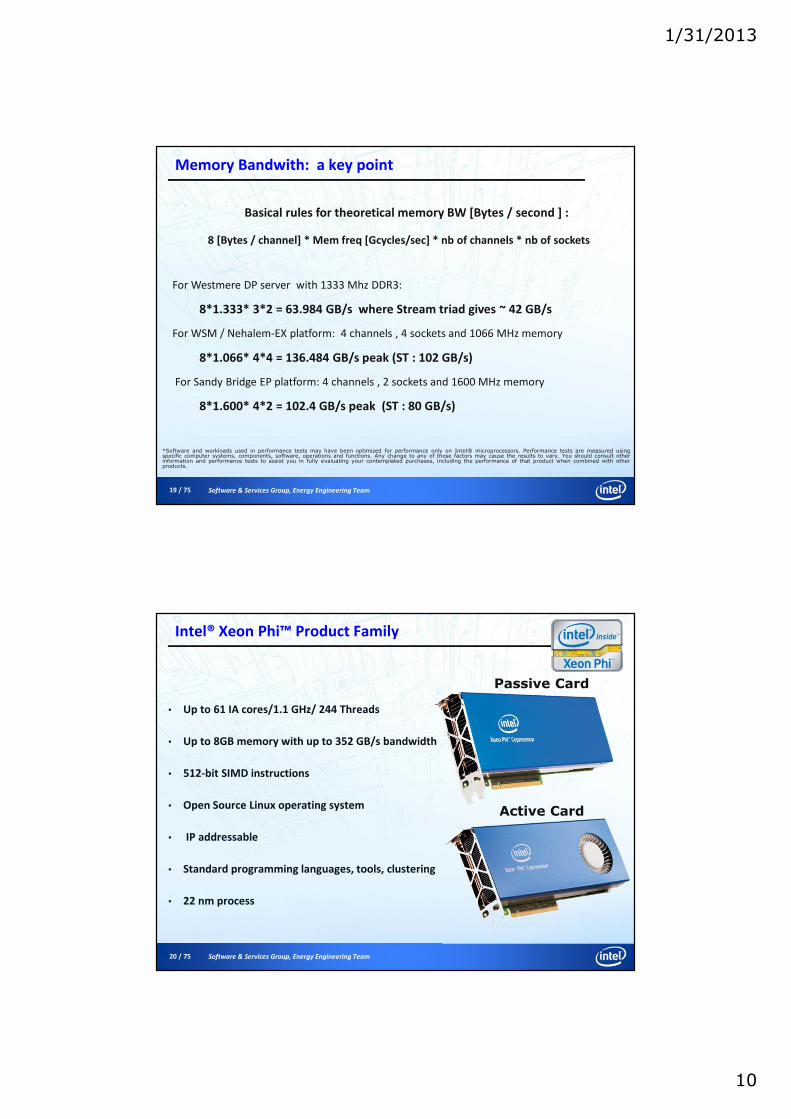
How to take advantage of AVX for more Flops / cycles
1.0
2.0
0.0
Assembly
Intrinsics
Assembly
IntrinsicsMKL DgemmbenchmarkMKL Dgemmbenchmark
MKL FFT benchmarkMKL FFT
benchmark1.5
Use Intel® Math Kernel
Library as much as possible
Use of intrinsics or assembly
for specific kernels
Use Compiler and Intel tools
to optimize your source code
speedup
Application Source codeApplication Source code
One core basis comparison
1/31/2013
10
19 / 75 Software & Services Group, Energy Engineering Team
Memory Bandwith: a key point
For Westmere DP server with 1333 Mhz DDR3:
8*1.333* 3*2 = 63.984 GB/s where Stream triad gives ~ 42 GB/s
For WSM / Nehalem-EX platform: 4 channels , 4 sockets and 1066 MHz memory
8*1.066* 4*4 = 136.484 GB/s peak (ST : 102 GB/s)
For Sandy Bridge EP platform: 4 channels , 2 sockets and 1600 MHz memory
8*1.600* 4*2 = 102.4 GB/s peak (ST : 80 GB/s)
Basical rules for theoretical memory BW [Bytes / second ] :
8 [Bytes / channel] * Mem freq [Gcycles/sec] * nb of channels * nb of sockets
*Software and workloads used in performance tests may have been optimized for performance only on Intel® microprocessors. Performance tests are measured usingspecific computer systems, components, software, operations and functions. Any change to any of those factors may cause the results to vary. You should consult otherinformation and performance tests to assist you in fully evaluating your contemplated purchases, including the performance of that product when combined with otherproducts.
20 / 75 Software & Services Group, Energy Engineering Team
Intel® Xeon Phi™ Product Family
• Up to 61 IA cores/1.1 GHz/ 244 Threads
• Up to 8GB memory with up to 352 GB/s bandwidth
• 512-bit SIMD instructions
• Open Source Linux operating system
• IP addressable
• Standard programming languages, tools, clustering
• 22 nm process
Passive Card
Active Card
1/31/2013
11
21 / 75 Software & Services Group, Energy Engineering Team
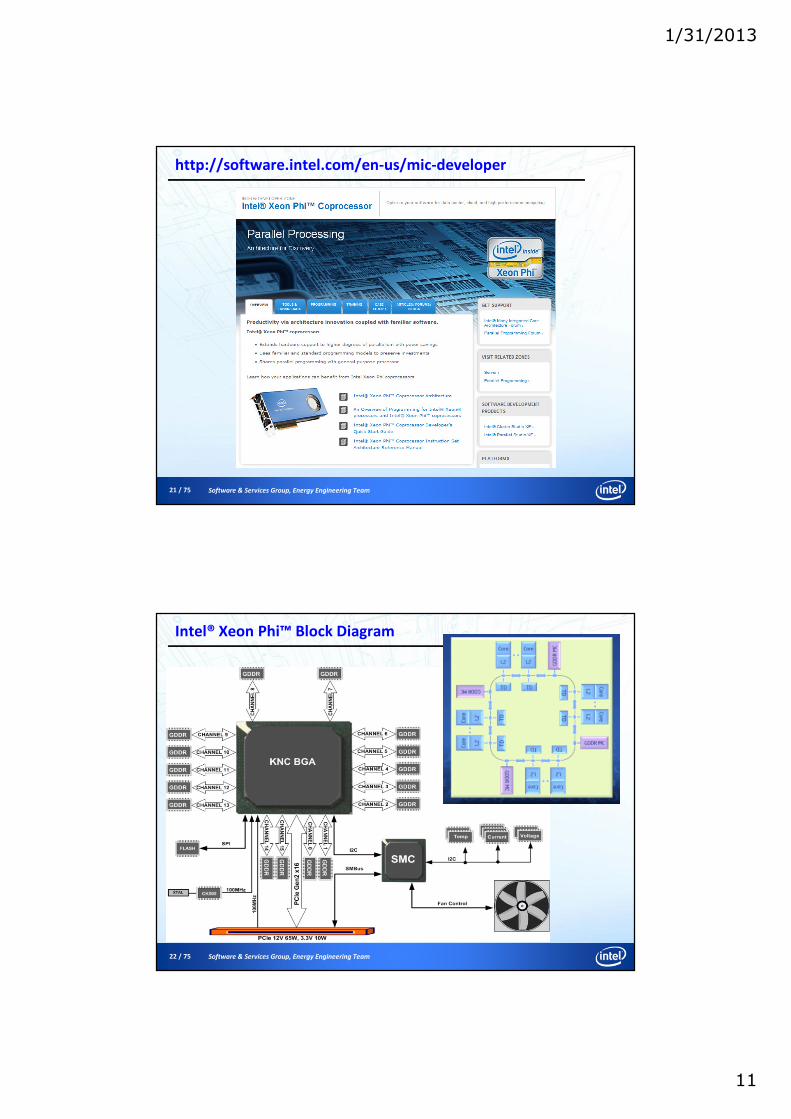
http://software.intel.com/en-us/mic-developer
22 / 75 Software & Services Group, Energy Engineering Team
Intel® Xeon Phi™ Block Diagram
1/31/2013
12
23 / 75 Software & Services Group, Energy Engineering Team
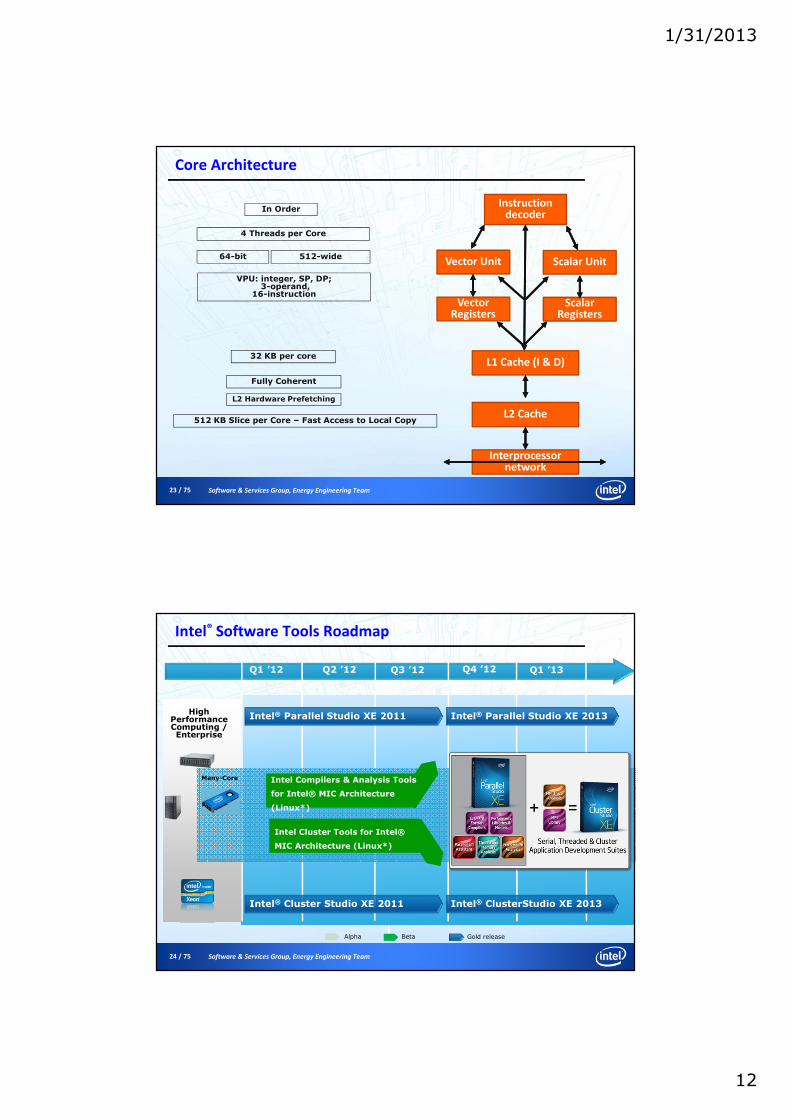
Core Architecture
Instruction decoder
L1 Cache (I & D)
L2 Cache
Interprocessornetwork
Vector Unit Scalar Unit
VectorRegisters
ScalarRegisters
512 KB Slice per Core – Fast Access to Local Copy
32 KB per core
L2 Hardware Prefetching
Fully Coherent
In Order
512-wide64-bit
4 Threads per Core
VPU: integer, SP, DP;3-operand,
16-instruction
24 / 75 Software & Services Group, Energy Engineering Team
Intel® Software Tools Roadmap
High Performance Computing / Enterprise
Intel® Parallel Studio XE 2011
Q1 ’13Q1 ’12 Q2 ’12 Q4 ’12Q3 ’12
Gold releaseBetaAlpha
Many-Core
Intel® Parallel Studio XE 2013
Intel® Cluster Studio XE 2011 Intel® ClusterStudio XE 2013
Intel Compilers & Analysis Tools
for Intel® MIC Architecture
(Linux*)
Intel Cluster Tools for Intel®
MIC Architecture (Linux*)
1/31/2013
13
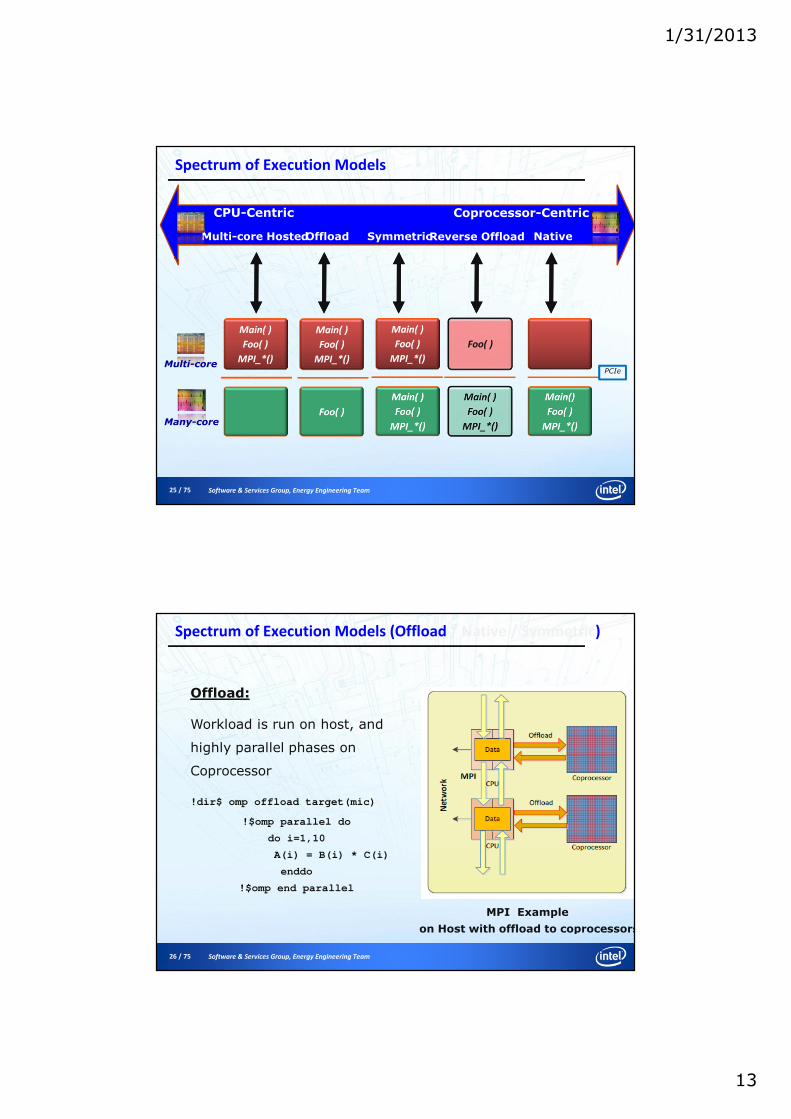
25 / 75 Software & Services Group, Energy Engineering Team
Spectrum of Execution Models
CPU-Centric Coprocessor-Centric
NativeSymmetricOffloadMulti-core Hosted
Main( )
Foo( )
MPI_*()
Main( )
Foo( )
MPI_*()
Main( )
Foo( )
MPI_*()Multi-core
Many-core
Reverse Offload
Foo( )
PCIe
26 / 75 Software & Services Group, Energy Engineering Team
Spectrum of Execution Models (Offload / Native / Symmetric)
Offload:
Workload is run on host, and
highly parallel phases on
Coprocessor
!dir$ omp offload target(mic)
!$omp parallel do
do i=1,10
A(i) = B(i) * C(i)
enddo
!$omp end parallel
MPI Example
on Host with offload to coprocessors
1/31/2013
14
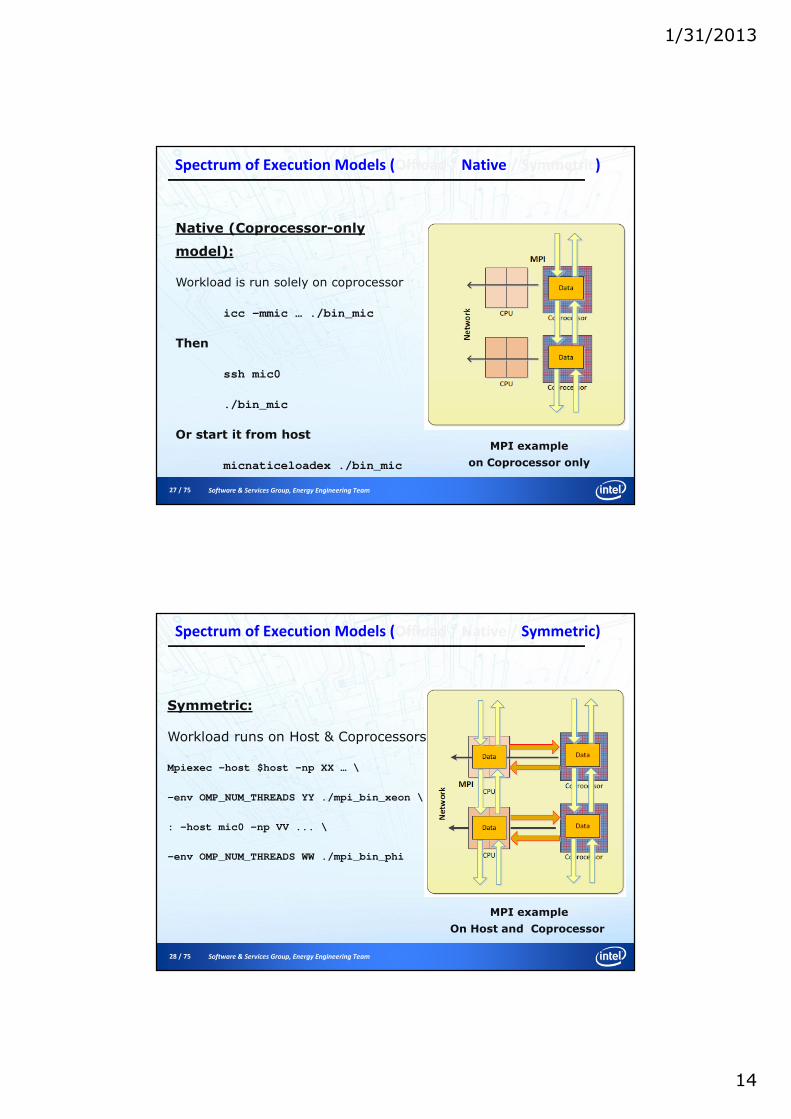
27 / 75 Software & Services Group, Energy Engineering Team
Spectrum of Execution Models (Offload / Native / Symmetric)
MPI example
on Coprocessor only
Native (Coprocessor-only
model):
Workload is run solely on coprocessor
icc –mmic … ./bin_mic
Then
ssh mic0
./bin_mic
Or start it from host
micnaticeloadex ./bin_mic
28 / 75 Software & Services Group, Energy Engineering Team
Spectrum of Execution Models (Offload / Native / Symmetric)
MPI example
On Host and Coprocessor
Symmetric:
Workload runs on Host & Coprocessors
Mpiexec –host $host –np XX … \
-env OMP_NUM_THREADS YY ./mpi_bin_xeon \
: –host mic0 -np VV ... \
-env OMP_NUM_THREADS WW ./mpi_bin_phi
1/31/2013
15
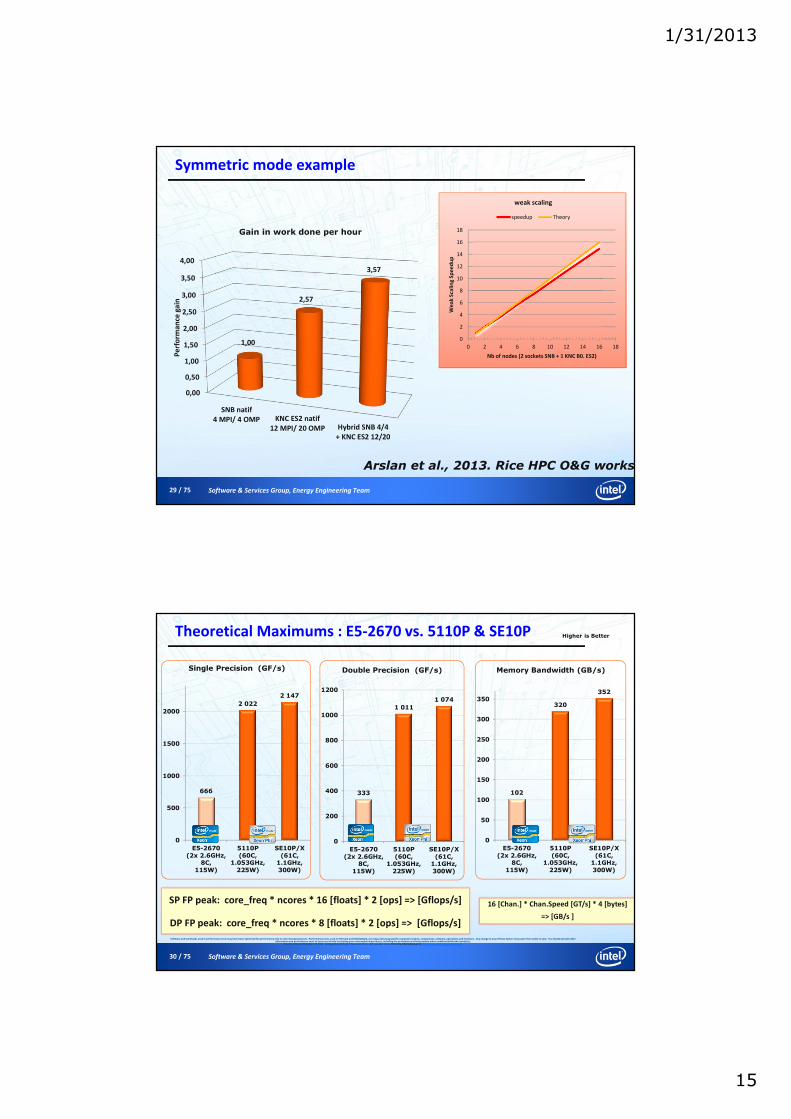
29 / 75 Software & Services Group, Energy Engineering Team
Symmetric mode example
0,00
0,50
1,00
1,50
2,00
2,50
3,00
3,50
4,00
SNB natif
4 MPI/ 4 OMP KNC ES2 natif
12 MPI/ 20 OMP Hybrid SNB 4/4
+ KNC ES2 12/20
1,00
2,57
3,57
Pe
rfo
rma
nce
ga
in
0
2
4
6
8
10
12
14
16
18
0 2 4 6 8 10 12 14 16 18
We
ak
Sca
lin
g S
pe
ed
up
Nb of nodes (2 sockets SNB + 1 KNC B0. ES2)
weak scaling
speedup Theory
Gain in work done per hour
Arslan et al., 2013. Rice HPC O&G workshop
30 / 75 Software & Services Group, Energy Engineering Team
Theoretical Maximums : E5-2670 vs. 5110P & SE10P
Software and workloads used in performance tests may have been optimized for performance only on Intel microprocessors. Performance tests, such as SYSmark and MobileMark, are measured using specific computer systems, components, software, operations and functions. Any change to any of those factors may cause the results to vary. You should consult other information and performance tests to assist you in fully evaluating your contemplated purchases, including the performance of that product when combined with other products.
Source: Intel as of October 17, 2012 Configuration Details: Please reference slide speaker notes. For more information go to http://www.intel.com/performance
666
2 022
2 147
0
500
1000
1500
2000
E5-2670(2x 2.6GHz,
8C,115W)
5110P(60C,
1.053GHz,225W)
SE10P/X(61C,1.1GHz,300W)
Single Precision (GF/s)
333
1 011
1 074
0
200
400
600
800
1000
1200
E5-2670(2x 2.6GHz,
8C,115W)
5110P(60C,
1.053GHz,225W)
SE10P/X(61C,1.1GHz,300W)
Double Precision (GF/s)
102
320
352
0
50
100
150
200
250
300
350
E5-2670(2x 2.6GHz,
8C,115W)
5110P(60C,
1.053GHz,225W)
SE10P/X(61C,1.1GHz,300W)
Memory Bandwidth (GB/s)
SP FP peak: core_freq * ncores * 16 [floats] * 2 [ops] => [Gflops/s]
DP FP peak: core_freq * ncores * 8 [floats] * 2 [ops] => [Gflops/s]
16 [Chan.] * Chan.Speed [GT/s] * 4 [bytes]
=> [GB/s ]
Higher is Better
1/31/2013
16
31 / 75 Software & Services Group, Energy Engineering Team
Synthetic Benchmark Summary: E5-2670 vs. 5110P & SE10P
Software and workloads used in performance tests may have been optimized for performance only on Intel microprocessors. Performance tests, such as SYSmark and MobileMark, are measured using specific computer systems, components, software, operations and functions. Any change to any of those factors may cause the results to vary. You should consult other information and performance tests to assist youin fully evaluating your contemplated purchases, including the performance of that product when combined with other products.Source: Intel Measured results as of October 26, 2012 Configuration Details: Please reference slide speaker notes.For more information go to http://www.intel.com/performance
640
1 729
1 860
0
500
1000
1500
2000
E5-2670Baseline(2x
2.6GHz,8C,
115W)
5110P(60C,
1.053GHz,225W)
SE10P(61C,1.1GHz,300W)
SGEMM (GF/s)
Higher is Better
85% Efficient
86% Efficient
309
833883
0
200
400
600
800
1000
E5-2670Baseline(2x
2.6GHz,8C,
115W)
5110P(60C,
1.053GHz,225W)
SE10P(61C,1.1GHz,300W)
DGEMM (GF/s)
82% Efficient
82% Efficient
303
722
803
0
200
400
600
800
1000
E5-2670Baseline(2x
2.7GHz,8C,
115W)
5110P(60C,
1.053GHz,225W)
SE10P(61C,1.1GHz,300W)
SMP Linpack (GF/s)
71% Efficient
75% Efficient
Coprocessor results: Benchmark run 100% on coprocessor, no help from Intel® Xeon® processor host (aka native)
(Intel® MKL)
32 / 75 Software & Services Group, Energy Engineering Team
Synthetic Benchmark Summary: E5-2670 vs. 5110P & SE10P
Software and workloads used in performance tests may have been optimized for performance only on Intel microprocessors. Performance tests, such as SYSmark and MobileMark, are measured using specific computer systems, components, software, operations and functions. Any change to any of those factors may cause the results to vary. You should consult other information and performance tests to assist you in fully evaluating your contemplated purchases, including the performance of that product when combined with other products. Source: Intel Measured results as of October 26, 2012 Configuration Details: Please reference slide speaker notes.Formore
information go to http://www.intel.com/performance
78
159
171
0
50
100
150
200
2S Intel®Xeon®
processor
1 Intel® Xeon Phi™ coprocessor
1 Intel® Xeon Phi™ coprocessor
5110P STREAM Triad (GB/s)
Notes
1. Intel® Xeon® Processor E5-2670 used for all SGEMM Matrix = 13824 x 13824 , DGEMM Matrix 7936 x 7936, SMP LinpackMatrix 30720 x 30720
2. Intel® Xeon Phi™ coprocessor 5110P (ECC on) with “Gold Release Candidate” SW stack SGEMM Matrix = 11264 x 11264, DGEMM Matrix 7680 x 7680, SMP LinpackMatrix 26872 x 28672
ECC On
ECC Off
Coprocessor results: Benchmark run 100% on coprocessor, no help from Intel® Xeon® processor host (aka native)
78
174181
0
50
100
150
200
2S Intel®Xeon®
processor
1 Intel® Xeon Phi™ coprocessor
1 Intel® Xeon Phi™ coprocessor
SE10P STREAM Triad (GB/s)
ECC On
ECC Off
Higher is Better
1/31/2013
17
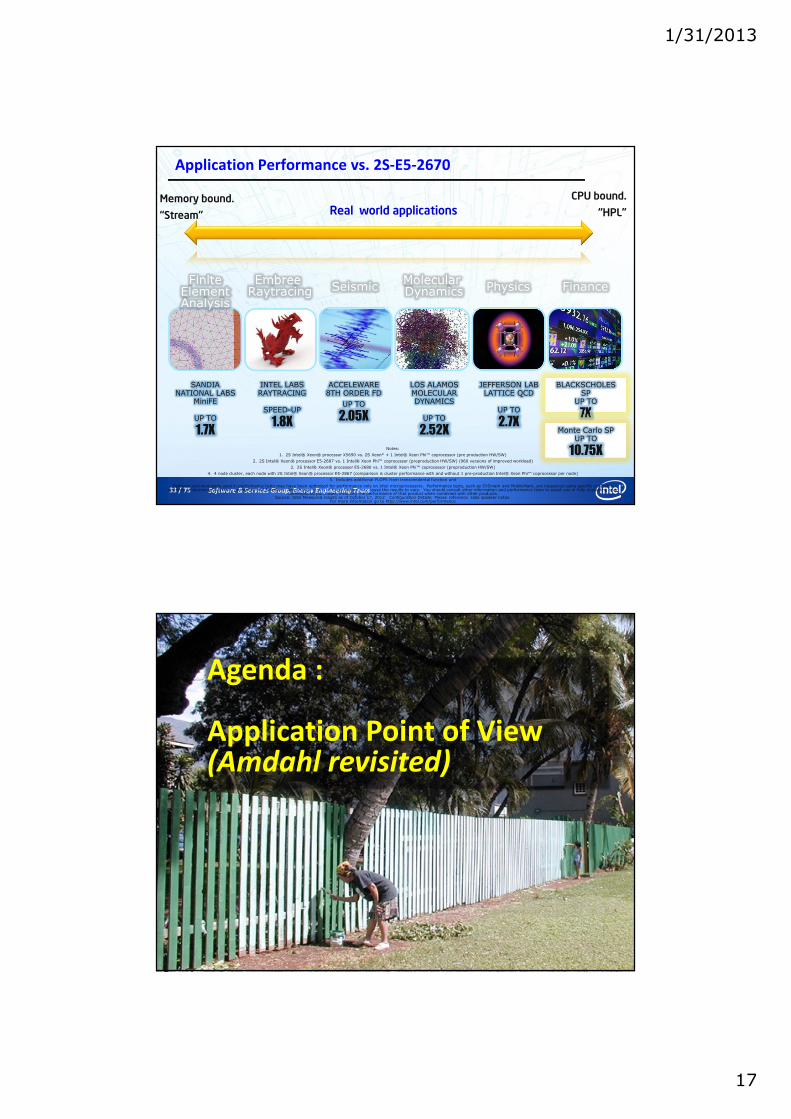
33 / 75 Software & Services Group, Energy Engineering Team
Application Performance vs. 2S-E5-2670
Notes:
1. 2S Intel® Xeon® processor X5690 vs. 2S Xeon* + 1 Intel® Xeon Phi™ coprocessor (pre production HW/SW)
2. 2S Intel® Xeon® processor E5-2687 vs. 1 Intel® Xeon Phi™ coprocessor (preproduction HW/SW) (960 versions of improved workload)
3. 2S Intel® Xeon® processor E5-2680 vs. 1 Intel® Xeon Phi™ coprocessor (preproduction HW/SW)
4. 4 node cluster, each node with 2S Intel® Xeon® processor E5-2867 (comparison is cluster performance with and without 1 pre-production Intel® Xeon Phi™ coprocessor per node)
5. Includes additional FLOPS from transcendental function unit
Software and workloads used in performance tests may have been optimized for performance only on Intel microprocessors. Performance tests, such as SYSmark and MobileMark, are measured using specific computer systems, components, software, operations and functions. Any change to any of those factors may cause the results to vary. You should consult other information and performance tests to assist you in fully evaluating your
contemplated purchases, including the performance of that product when combined with other products. Source: Intel Measured results as of October 17, 2012 Configuration Details: Please reference slide speaker notes.
For more information go to http://www.intel.com/performance
MolecularDynamics
Embree Raytracing FinanceSeismic
Finite Element Analysis
INTEL LABS RAYTRACING
SPEED-UP
1.8X
LOS ALAMOS MOLECULAR DYNAMICS
UP TO
2.52X
BLACKSCHOLES SP
UP TO
7X
JEFFERSON LABLATTICE QCD
UP TO
2.7XMonte Carlo SP
UP TO
10.75X
ACCELEWARE8TH ORDER FD
UP TO
2.05X
SANDIA NATIONAL LABS
MiniFE
UP TO
1.7X
Physics
Real world applications Memory bound.
“Stream”
CPU bound.
“HPL”
34 / 75 Software & Services Group, Energy Engineering Team
Agenda :
Application Point of View(Amdahl revisited)
1/31/2013
18
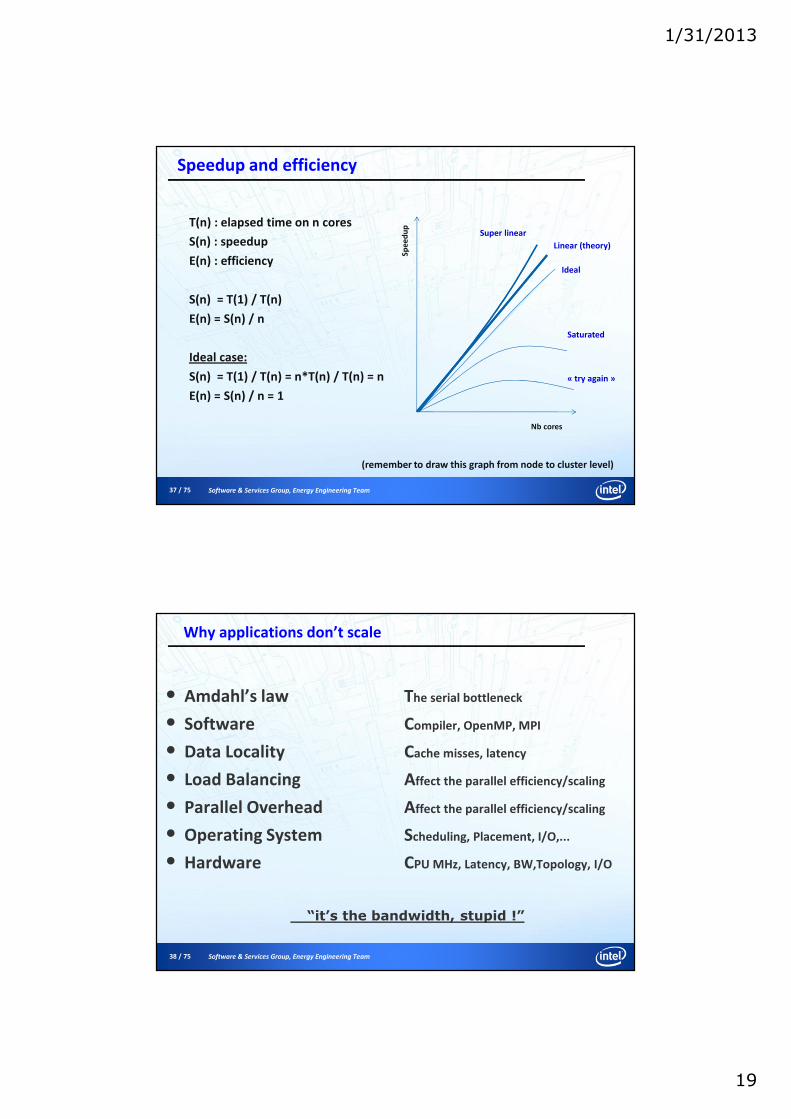
35 / 75 Software & Services Group, Energy Engineering Team
End users point of view : Physics and computing needs increase
Increase physics complexity(at constant elapsed time and size )
Decrease elapsed time. (at constant size and physics)
Increase problem size (at constant time and physics)
35
36 / 75 Software & Services Group, Energy Engineering Team
Parallel computing: amdahl law
36
Ela
psed
tim
e
1 c 2 c
Serial
Parallel
8c
Ela
psed
tim
e
1 c 2 c
Serial
Parallel
8c
Overhead
In theory In practice
1/31/2013
19
37 / 75 Software & Services Group, Energy Engineering Team
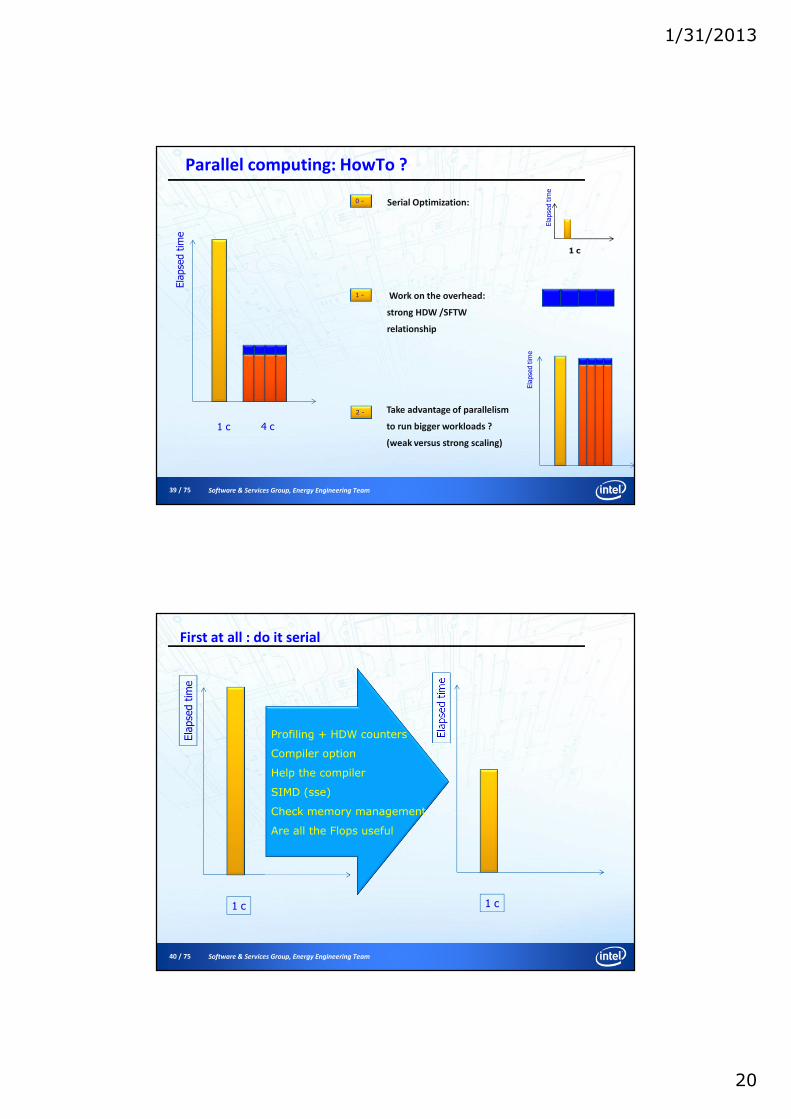
Speedup and efficiency
Sp
ee
du
p
Nb cores
Super linear
Linear (theory)
Ideal
Saturated
« try again »
T(n) : elapsed time on n cores
S(n) : speedup
E(n) : efficiency
S(n) = T(1) / T(n)
E(n) = S(n) / n
Ideal case:
S(n) = T(1) / T(n) = n*T(n) / T(n) = n
E(n) = S(n) / n = 1
(remember to draw this graph from node to cluster level)
38 / 75 Software & Services Group, Energy Engineering Team
• Amdahl’s law The serial bottleneck
• Software Compiler, OpenMP, MPI
• Data Locality Cache misses, latency
• Load Balancing Affect the parallel efficiency/scaling
• Parallel Overhead Affect the parallel efficiency/scaling
• Operating System Scheduling, Placement, I/O,...
• Hardware CPU MHz, Latency, BW,Topology, I/O
“it’s the bandwidth, stupid !”
Why applications don’t scale
1/31/2013
20
39 / 75 Software & Services Group, Energy Engineering Team
Parallel computing: HowTo ?Elapsedtime
1 c 4 c
Elapsedtime
1 c
Serial Optimization:0 -
1 -
2 -
Elapsedtime
Work on the overhead:
strong HDW /SFTW
relationship
Take advantage of parallelism
to run bigger workloads ?
(weak versus strong scaling)
40 / 75 Software & Services Group, Energy Engineering Team
First at all : do it serial
Elapsedtime
1 c
Elapsedtime
1 c
Profiling + HDW counters
Compiler option
Help the compiler
SIMD (sse)
Check memory management
Are all the Flops useful
1/31/2013
21
41 / 75 Software & Services Group, Energy Engineering Team
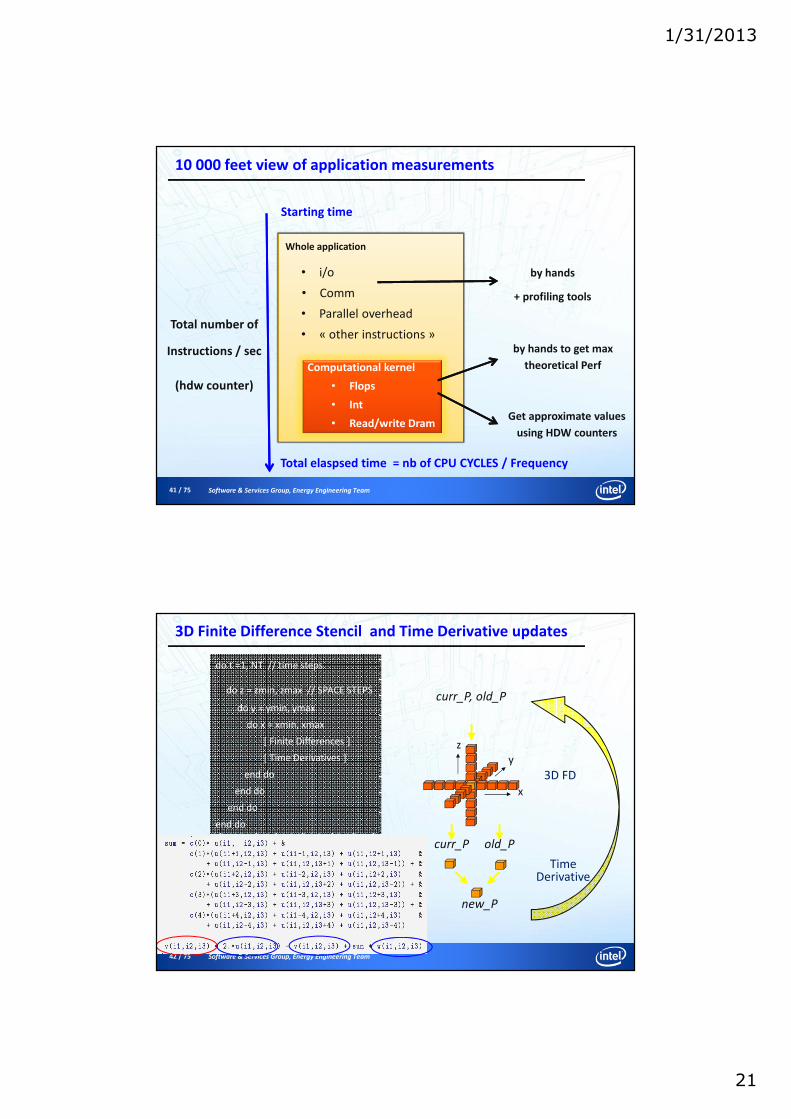
10 000 feet view of application measurements
Total elaspsed time = nb of CPU CYCLES / Frequency
Starting time
Computational kernel
• Flops
• Int
• Read/write Dram
• i/o
• Comm
by hands to get max
theoretical Perf
Get approximate values
using HDW counters
Whole application
• Parallel overhead
• « other instructions »
by hands
+ profiling tools
Total number of
Instructions / sec
(hdw counter)
42 / 75 Software & Services Group, Energy Engineering Team
3D Finite Difference Stencil and Time Derivative updates
x
y
z
Time Derivative
curr_P, old_P
3D FD
curr_P old_P
new_P
do t =1, NT // time steps
do z = zmin, zmax // SPACE STEPS
do y = ymin, ymax
do x = xmin, xmax
[ Finite Differences ]
[ Time Derivatives ]
end do
end do
end do
end do
1/31/2013
22
43 / 75 Software & Services Group, Energy Engineering Team
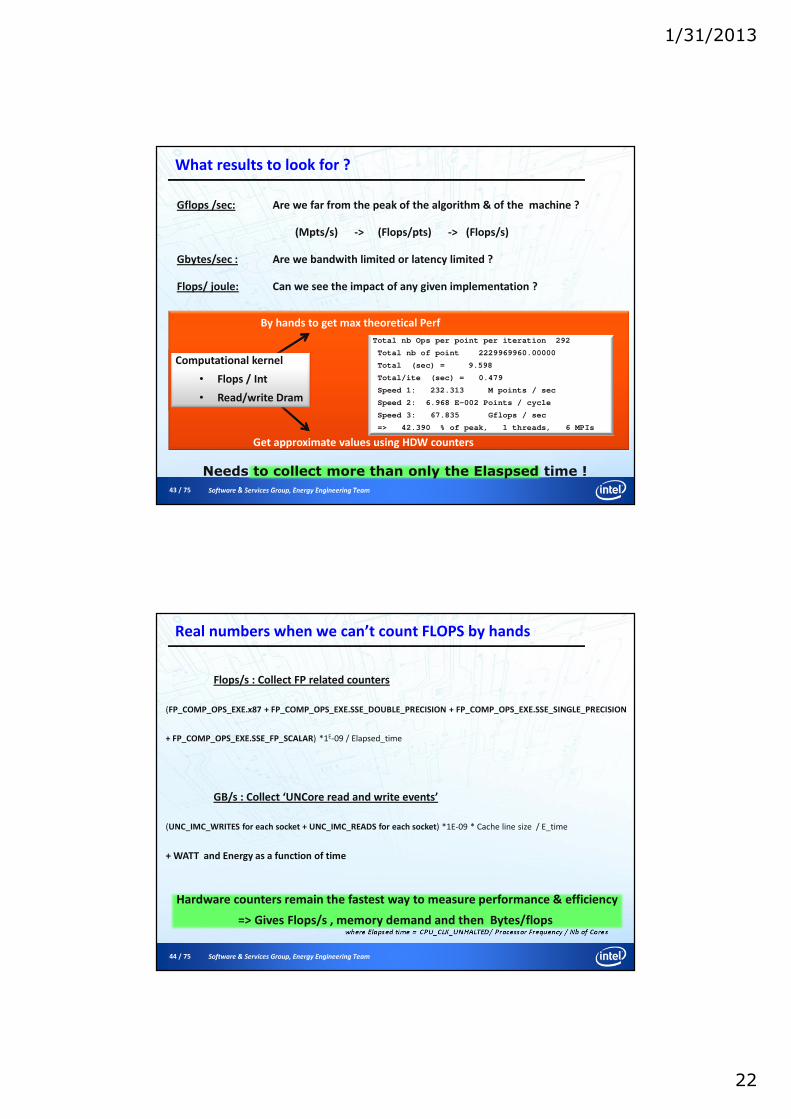
What results to look for ?
Gflops /sec: Are we far from the peak of the algorithm & of the machine ?
(Mpts/s) -> (Flops/pts) -> (Flops/s)
Gbytes/sec : Are we bandwith limited or latency limited ?
Flops/ joule: Can we see the impact of any given implementation ?
Total nb Ops per point per iteration 292
Total nb of point 2229969960.00000
Total (sec) = 9.598
Total/ite (sec) = 0.479
Speed 1: 232.313 M points / sec
Speed 2: 6.968 E-002 Points / cycle
Speed 3: 67.835 Gflops / sec
=> 42.390 % of peak, 1 threads, 6 MPIs
By hands to get max theoretical Perf
Get approximate values using HDW counters
Computational kernel
• Flops / Int
• Read/write Dram
Needs to collect more than only the Elaspsed time !
44 / 75 Software & Services Group, Energy Engineering Team
Real numbers when we can’t count FLOPS by hands
Flops/s : Collect FP related counters
(FP_COMP_OPS_EXE.x87 + FP_COMP_OPS_EXE.SSE_DOUBLE_PRECISION + FP_COMP_OPS_EXE.SSE_SINGLE_PRECISION
+ FP_COMP_OPS_EXE.SSE_FP_SCALAR) *1E-09 / Elapsed_time
GB/s : Collect ‘UNCore read and write events’
(UNC_IMC_WRITES for each socket + UNC_IMC_READS for each socket) *1E-09 * Cache line size / E_time
+ WATT and Energy as a function of time
where Elapsed time = CPU_CLK_UNHALTED/ Processor Frequency / Nb of Cores
Hardware counters remain the fastest way to measure performance & efficiency
=> Gives Flops/s , memory demand and then Bytes/flops
1/31/2013
23
45 / 75 Software & Services Group, Energy Engineering Team
Max theoretical Flops/s by hands (isotropic 3DFD kernel)
Total number of flops per point: nF = 7K+5 ,
made of ADD: nA = 6K +2 and MUL: nM = K + 3
-> max (nA,nM) is the limiting factor
Achievable peak (with infinite bandwidth) is the ratio of nF by the max(nA, nM)
%Peak(K)= 100.0 * [ nF / 2* max (nA,nM) ]
K : half stencil length
=> Give the kernel efficiency
46 / 75 Software & Services Group, Energy Engineering Team
Reminder about the peak Flops
Scheduler (Port names as used by Intel® Architecture Code Analyzer ***)
Load
Port 0 Port 1 Port 5 Port 2 Port 3
Load
Store Address
Store DataALUALU ALU/JMP
AVX FP Shuf
AVX FP Bool
VI* ADDVI* MUL
SSE MUL
DIV**
SSE ADD
AVX FP ADD
AVX FP MUL
0 63 127 255
SSE Shuf
AVX FP Blend
Port 4
AVX FP Blend
VI* ADD Store Address
6 instructions / cycle:
• 3 memory ops
• 3 computational operations
Nehalem : Two 128 bits SIMD per cycle
4 MUL (32b) and 4 ADD (32b): 8 Single Precision Flops / cycle
2 MUL (64b) and 2 ADD (64b): 4 Double Precision Flops / cycle
Sandy bridge : Two 256 bits SIMD per cycle
8 MUL (32b) and 8 ADD (32b): 16 Single Precision Flops / cycle
4 MUL (64b) and 4ADD (64b): 8 Double Precision Flops / cycle
sec/sec)/(*)/( FlopscyclecycleFlopsPeak ==
Intel® Sandy Bridge micro-u
1/31/2013
24
47 / 75 Software & Services Group, Energy Engineering Team
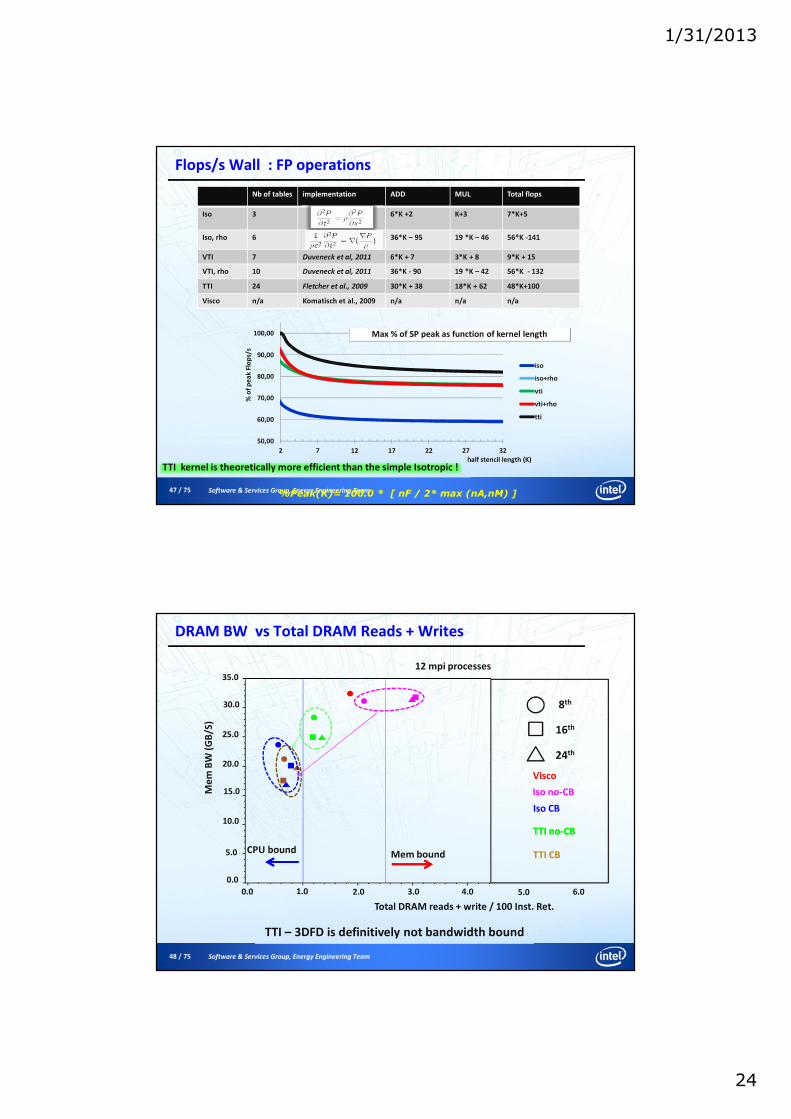
Flops/s Wall : FP operations
Nb of tables implementation ADD MUL Total flops
Iso 3 6*K +2 K+3 7*K+5
Iso, rho 6 36*K – 95 19 *K – 46 56*K -141
VTI 7 Duveneck et al, 2011 6*K + 7 3*K + 8 9*K + 15
VTI, rho 10 Duveneck et al, 2011 36*K - 90 19 *K – 42 56*K - 132
TTI 24 Fletcher et al., 2009 30*K + 38 18*K + 62 48*K+100
Visco n/a Komatisch et al., 2009 n/a n/a n/a
50,00
60,00
70,00
80,00
90,00
100,00
2 7 12 17 22 27 32
% o
f p
ea
k F
lop
s/s
half stencil length (K)
iso
iso+rho
vti
vti+rho
tti
Max % of SP peak as function of kernel length
TTI kernel is theoretically more efficient than the simple Isotropic !
%Peak(K)= 100.0 * [ nF / 2* max (nA,nM) ]
48 / 75 Software & Services Group, Energy Engineering Team
DRAM BW vs Total DRAM Reads + Writes
TTI – 3DFD is definitively not bandwidth bound
Total DRAM reads + write / 100 Inst. Ret.
Me
mB
W (
GB
/S)
12 mpi processes
Mem boundCPU bound
35.0
30.0
25.0
20.0
15.0
10.0
5.0
0.0
0.0 1.0 2.0 3.0 4.0 5.0 6.0
8th
16th
24th
Iso no-CB
Iso CB
TTI CB
TTI no-CBTTI no-CB
Visco
1/31/2013
25
49 / 75 Software & Services Group, Energy Engineering Team
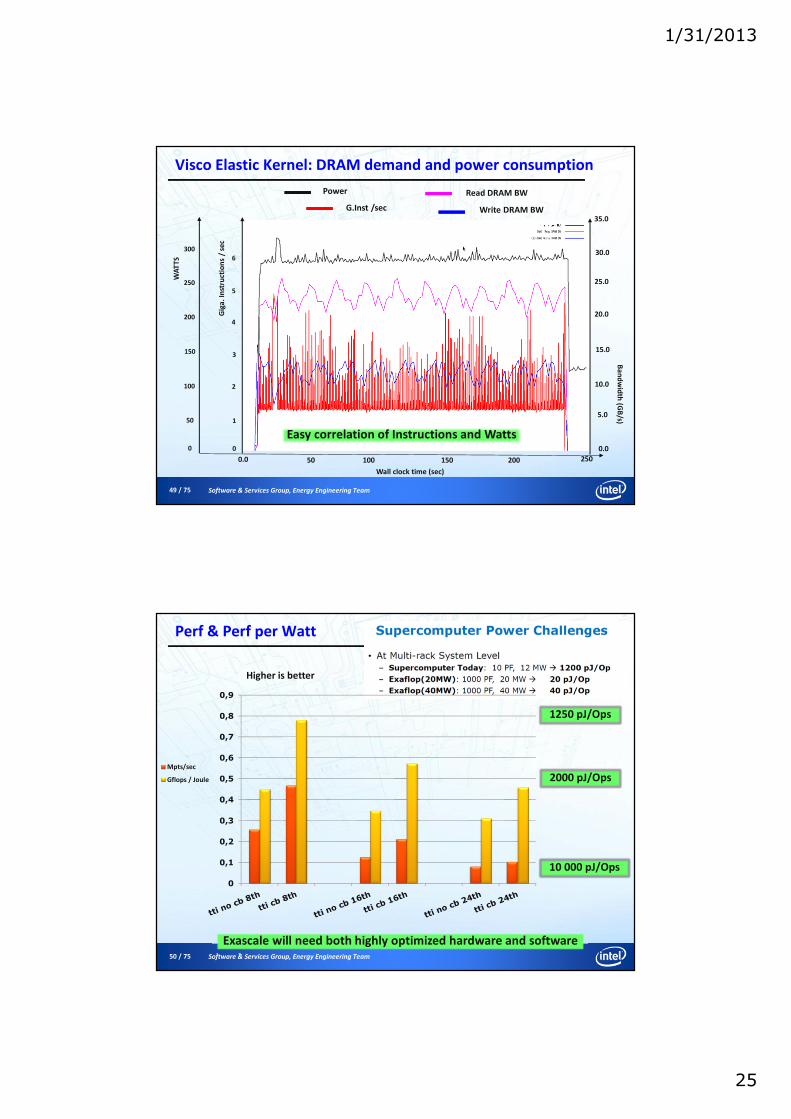
Visco Elastic Kernel: DRAM demand and power consumption
0
WA
TT
S
300
250
200
150
100
50
Gig
a.
Inst
ruct
ion
s /
sec
Ba
nd
wid
th(G
B/s)
Wall clock time (sec)
0.0 50 100 150 200 250
35.0
30.0
25.0
20.0
15.0
10.0
5.0
0.00
6
5
4
3
2
1
Read DRAM BW
Write DRAM BW
Power
G.Inst /sec
Easy correlation of Instructions and Watts
50 / 75 Software & Services Group, Energy Engineering Team
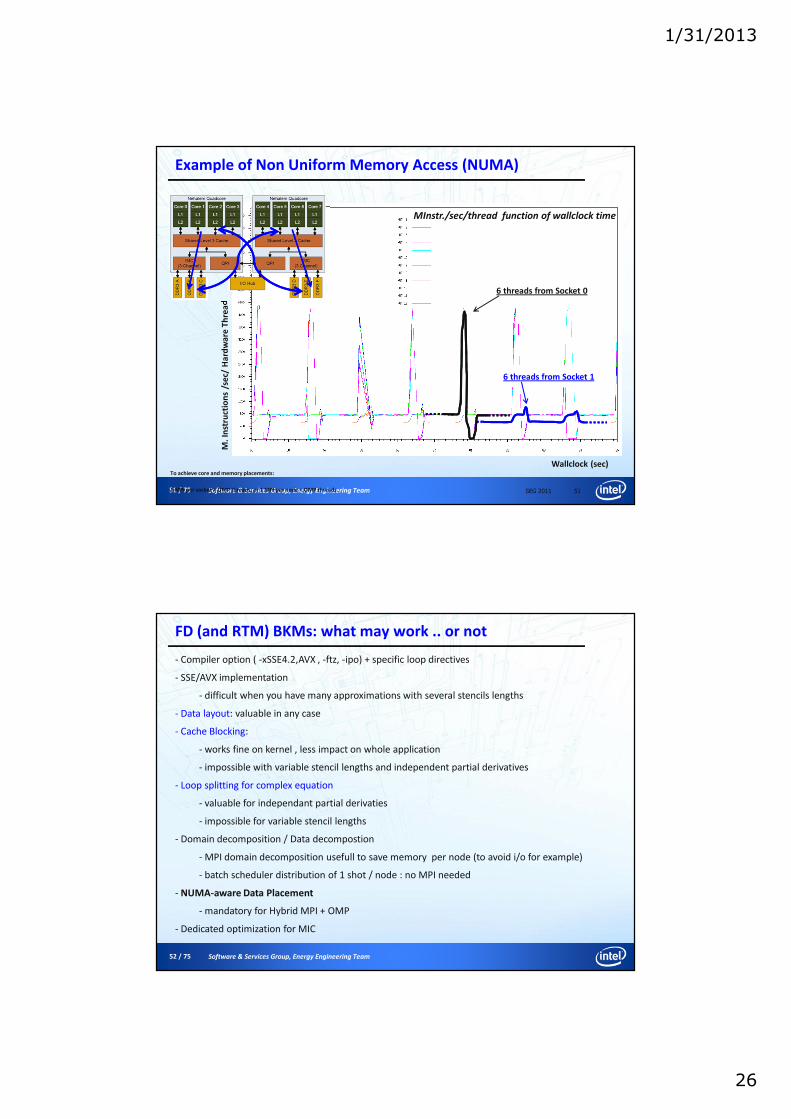
Perf & Perf per Watt
Higher is better
0
0,1
0,2
0,3
0,4
0,5
0,6
0,7
0,8
0,9
Mpts/sec
Gflops / Joule
1250 pJ/Ops
2000 pJ/Ops
10 000 pJ/Ops
Exascale will need both highly optimized hardware and software
1/31/2013
26
51 / 75 Software & Services Group, Energy Engineering Team
M.
Inst
ruct
ion
s /s
ec/
Ha
rdw
are
Th
rea
d
Wallclock (sec)
6 threads from Socket 0
6 threads from Socket 1
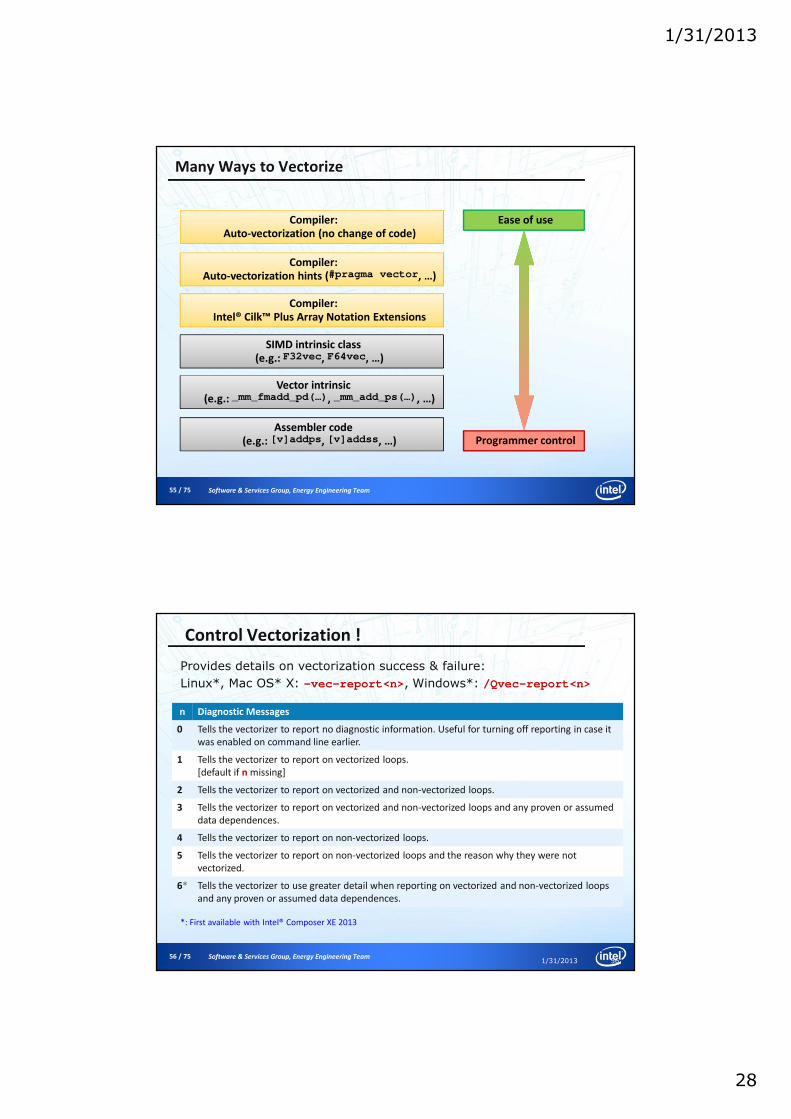
Example of Non Uniform Memory Access (NUMA)
To achieve core and memory placements:
1 MPI per socket + OMP threads, or 1 MPI per node + OMP threads
MInstr./sec/thread function of wallclock time
SEG 2011 51
52 / 75 Software & Services Group, Energy Engineering Team
FD (and RTM) BKMs: what may work .. or not
- Compiler option ( -xSSE4.2,AVX , -ftz, -ipo) + specific loop directives
- SSE/AVX implementation
- difficult when you have many approximations with several stencils lengths
- Data layout: valuable in any case
- Cache Blocking:
- works fine on kernel , less impact on whole application
- impossible with variable stencil lengths and independent partial derivatives
- Loop splitting for complex equation
- valuable for independant partial derivaties
- impossible for variable stencil lengths
- Domain decomposition / Data decompostion
- MPI domain decomposition usefull to save memory per node (to avoid i/o for example)
- batch scheduler distribution of 1 shot / node : no MPI needed
- NUMA-aware Data Placement
- mandatory for Hybrid MPI + OMP
- Dedicated optimization for MIC

1/31/2013
27
53 / 75 Software & Services Group, Energy Engineering Team
Agenda :
Application Point of View
Just Make it
54 / 75 Software & Services Group, Energy Engineering Team
Vectorization of Code
• Transform sequential code to exploit vector processing capabilities (SIMD)
– Manually by explicit syntax
– Automatically by tools like a compiler
for(i = 0; i <= MAX;i++)
c[i] = a[i] + b[i];
a
b
c
+
a
b
c
++
a[i]
b[i]
c[i]
+
a[i]
b[i]
c[i]
+
a[i+7] a[i+6] a[i+5] a[i+4] a[i+3] a[i+2] a[i+1] a[i]
b[i+7] b[i+6] b[i+5] b[i+4] b[i+3] b[i+2] b[i+1] b[i]
c[i+7] c[i+6] c[i+5] c[i+4] c[i+3] c[i+2] c[i+1] c[i]
+
a[i+7] a[i+6] a[i+5] a[i+4] a[i+3] a[i+2] a[i+1] a[i]
b[i+7] b[i+6] b[i+5] b[i+4] b[i+3] b[i+2] b[i+1] b[i]
c[i+7] c[i+6] c[i+5] c[i+4] c[i+3] c[i+2] c[i+1] c[i]
1/31/2013
28
55 / 75 Software & Services Group, Energy Engineering Team
Many Ways to Vectorize
Ease of useCompiler: Auto-vectorization (no change of code)
Programmer control
Compiler: Auto-vectorization hints (#pragma vector, …)
SIMD intrinsic class(e.g.: F32vec, F64vec, …)
Vector intrinsic(e.g.: _mm_fmadd_pd(…), _mm_add_ps(…), …)
Assembler code(e.g.: [v]addps, [v]addss, …)
Compiler: Intel® Cilk™ Plus Array Notation Extensions
56 / 75 Software & Services Group, Energy Engineering Team
Control Vectorization !
Provides details on vectorization success & failure:
Linux*, Mac OS* X: -vec-report<n>, Windows*: /Qvec-report<n>
*: First available with Intel® Composer XE 2013
n Diagnostic Messages
0 Tells the vectorizer to report no diagnostic information. Useful for turning off reporting in case it
was enabled on command line earlier.
1 Tells the vectorizer to report on vectorized loops.
[default if n missing]
2 Tells the vectorizer to report on vectorized and non-vectorized loops.
3 Tells the vectorizer to report on vectorized and non-vectorized loops and any proven or assumed
data dependences.
4 Tells the vectorizer to report on non-vectorized loops.
5 Tells the vectorizer to report on non-vectorized loops and the reason why they were not
vectorized.
6* Tells the vectorizer to use greater detail when reporting on vectorized and non-vectorized loops
and any proven or assumed data dependences.
1/31/2013 56
1/31/2013
29
57 / 75 Software & Services Group, Energy Engineering Team
Vectorization Report II
Note:
In case inter-procedural optimization (-ipo or /Qipo) is activated and
compilation and linking are separate compiler invocations, the switch
to enable reporting needs to be added to the link step!
35: subroutine fd( y )
36: integer :: i
37: real, dimension(10), intent(inout) :: y
38: do i=2,10
39: y(i) = y(i-1) + 1
40: end do
41: end subroutine fd
novec.f90(38): (col. 3) remark: loop was not vectorized: existence of vector dependence.
novec.f90(39): (col. 5) remark: vector dependence: proven FLOW dependence between y line 39, and y line 39.
novec.f90(38:3-38:3):VEC:MAIN_: loop was not vectorized: existence of vector dependence
1/31/2013 57
58 / 75 Software & Services Group, Energy Engineering Team
Reasons for Vectorization Fails & How to Succeed
● Most frequent reason is Dependence:
Minimize dependencies among iterations by design!
● Alignment: Align your arrays/data structures
● Function calls in loop body: Use aggressive in-lining (IPO)
● Complex control flow/conditional branches:
Avoid them in loops by creating multiple versions of loops
● Unsupported loop structure: Use loop invariant expressions
● Not inner loop: Manual loop interchange possible?
● Mixed data types: Avoid type conversions
● Non-unit stride between elements: Possible to change algorithm to allow
linear/consecutive access?
● Loop body too complex reports: Try splitting up the loops!
● Vectorization seems inefficient reports: Enforce vectorization, benchmark !
1/31/2013
30
59 / 75 Software & Services Group, Energy Engineering Team
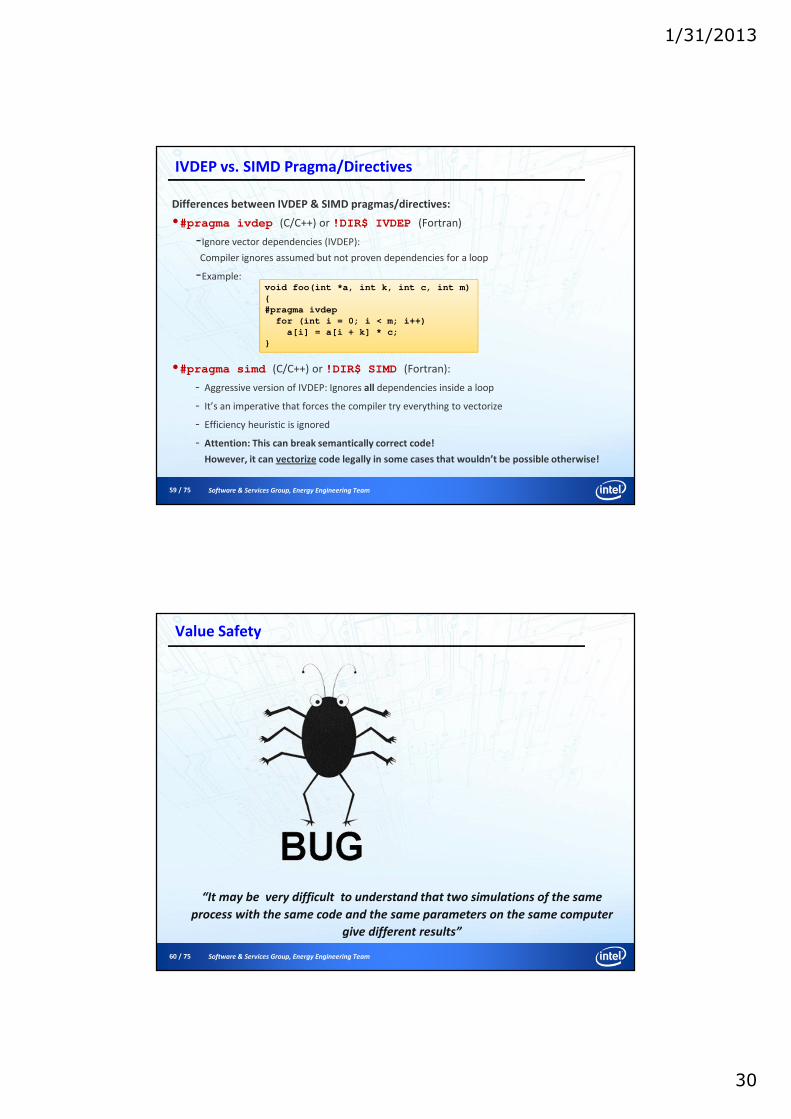
IVDEP vs. SIMD Pragma/Directives
Differences between IVDEP & SIMD pragmas/directives:
�#pragma ivdep (C/C++) or !DIR$ IVDEP (Fortran)
-Ignore vector dependencies (IVDEP):
Compiler ignores assumed but not proven dependencies for a loop
-Example:
�#pragma simd (C/C++) or !DIR$ SIMD (Fortran):
- Aggressive version of IVDEP: Ignores all dependencies inside a loop
- It’s an imperative that forces the compiler try everything to vectorize
- Efficiency heuristic is ignored
- Attention: This can break semantically correct code!
However, it can vectorize code legally in some cases that wouldn’t be possible otherwise!
void foo(int *a, int k, int c, int m)
{
#pragma ivdep
for (int i = 0; i < m; i++)
a[i] = a[i + k] * c;
}
60 / 75 Software & Services Group, Energy Engineering Team
Value Safety
“It may be very difficult to understand that two simulations of the same
process with the same code and the same parameters on the same computer
give different results”
1/31/2013
31
61 / 75 Software & Services Group, Energy Engineering Team
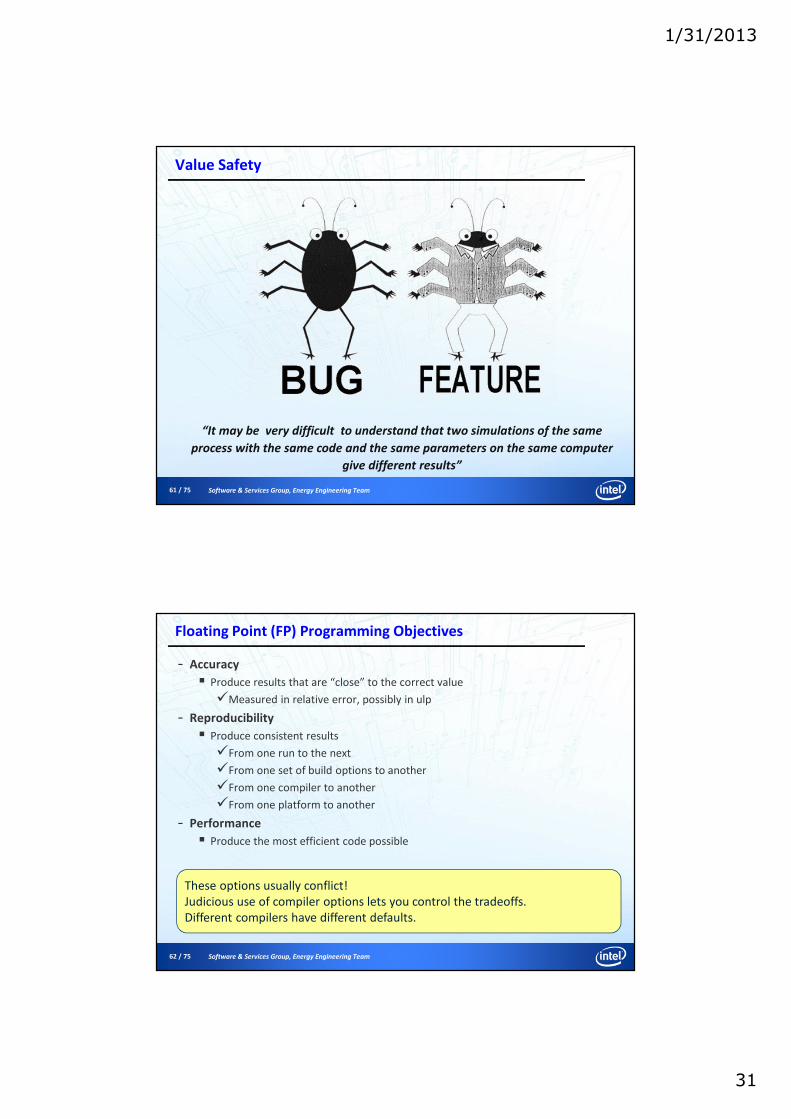
Value Safety
“It may be very difficult to understand that two simulations of the same
process with the same code and the same parameters on the same computer
give different results”
62 / 75 Software & Services Group, Energy Engineering Team
Floating Point (FP) Programming Objectives
- Accuracy
� Produce results that are “close” to the correct value
�Measured in relative error, possibly in ulp
- Reproducibility
� Produce consistent results
�From one run to the next
�From one set of build options to another
�From one compiler to another
�From one platform to another
- Performance
� Produce the most efficient code possible
These options usually conflict!
Judicious use of compiler options lets you control the tradeoffs.
Different compilers have different defaults.
1/31/2013
32
63 / 75 Software & Services Group, Energy Engineering Team
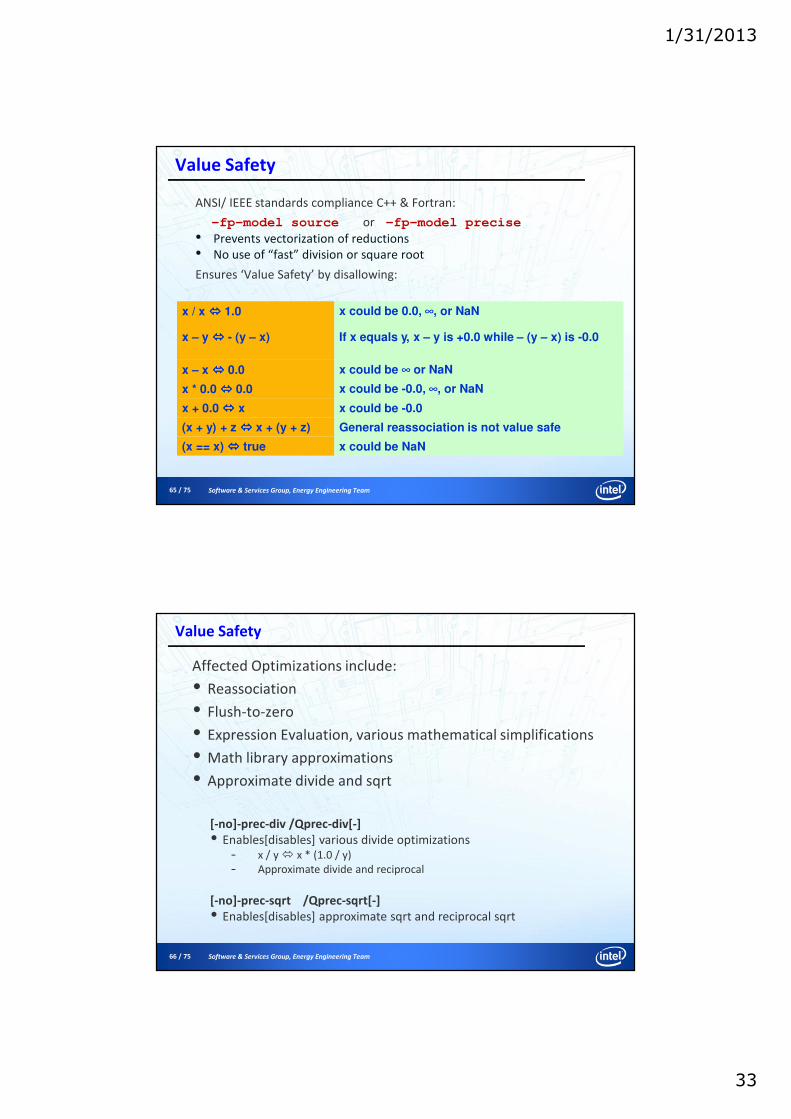
Users are Interested in Consistent Numerical Results
� Root cause for variations in results
- floating-point numbers � order of computation matters!
- Single precision arithmetic example (a+b)+c != a+(b+c)
226 – 226 + 1 = 1 (infinitely precise result)
(226 – 226) + 1 = 1 (correct IEEE single precision result)
226 – (226 – 1) = 0 (correct IEEE single precision result)
- Conditions that affect the order of computations
- Different code branches ( e.g. SSE2 versus AVX )
- Memory alignment ( scalar or vector code )
- Dynamic parallel task / thread / rank scheduling
� Bitwise repeatable/reproducible results
repeatable = results the same as last run (same conditions)
reproducible = results the same as results in other environments
Environments = OS / architecture / # threads / CPU /
63
4.012345678901111
4.012345678902222
4.012345678902222
4.012345678901111
4.012345678902222
4.012345678901111
4.012345678901111
4.012345678901111
4.012345678902222
4.012345678902222
4.012345678901111
4.012345678902222
4.012345678901111
4.012345678902222
4.012345678902222
4.012345678901111
…
64 / 75 Software & Services Group, Energy Engineering Team
The –fp-model switch
� -fp-model- fast [=1] allows value-unsafe optimizations (default)
- fast=2 allows additional approximations (very unsafe)
- precise value-safe optimizations only
(also source, double, extended)
- except enable floating point exception semantics
- strict precise + except + disable fma + don’t assume default floating-point environment
� Replaces old switches –mp, -fp-port, etc (don’t use!)
� -fp-model precise -fp-model source � recommended for ANSI/ IEEE standards compliance, C++ & Fortran
� “source” is default with “precise” on Intel 64 Linux
1/31/2013
33
65 / 75 Software & Services Group, Energy Engineering Team
Value Safety
ANSI/ IEEE standards compliance C++ & Fortran:
-fp-model source or -fp-model precise
• Prevents vectorization of reductions
• No use of “fast” division or square root
Ensures ‘Value Safety’ by disallowing:
x / x ���� 1.0 x could be 0.0, ∞, or NaN
x – y ���� - (y – x) If x equals y, x – y is +0.0 while – (y – x) is -0.0
x – x ���� 0.0 x could be ∞ or NaN
x * 0.0 ���� 0.0 x could be -0.0, ∞, or NaN
x + 0.0 ���� x x could be -0.0
(x + y) + z ���� x + (y + z) General reassociation is not value safe
(x == x) ���� true x could be NaN
66 / 75 Software & Services Group, Energy Engineering Team
Value Safety
Affected Optimizations include:
� Reassociation
� Flush-to-zero
� Expression Evaluation, various mathematical simplifications
� Math library approximations
� Approximate divide and sqrt
[-no]-prec-div /Qprec-div[-]
� Enables[disables] various divide optimizations- x / y � x * (1.0 / y)
- Approximate divide and reciprocal
[-no]-prec-sqrt /Qprec-sqrt[-]
� Enables[disables] approximate sqrt and reciprocal sqrt
1/31/2013
34
67 / 75 Software & Services Group, Energy Engineering Team
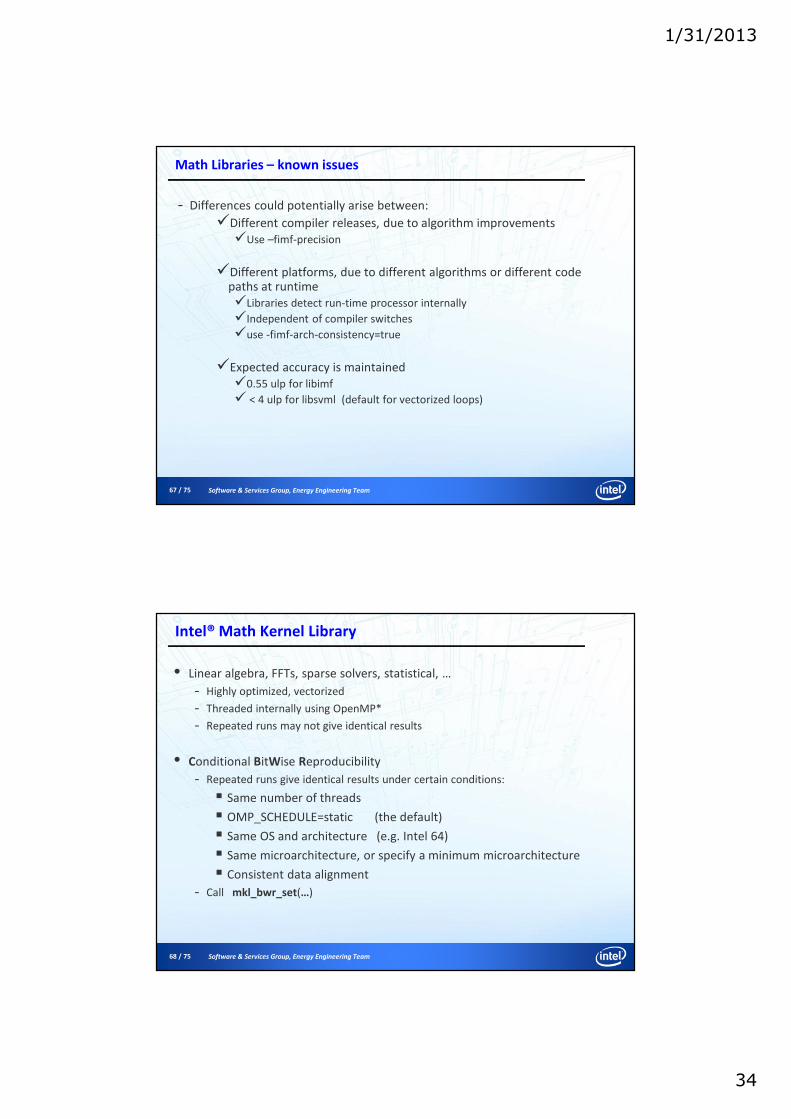
Math Libraries – known issues
- Differences could potentially arise between:
�Different compiler releases, due to algorithm improvements
�Use –fimf-precision
�Different platforms, due to different algorithms or different code paths at runtime
�Libraries detect run-time processor internally
�Independent of compiler switches
�use -fimf-arch-consistency=true
�Expected accuracy is maintained
�0.55 ulp for libimf
� < 4 ulp for libsvml (default for vectorized loops)
68 / 75 Software & Services Group, Energy Engineering Team
Intel® Math Kernel Library
� Linear algebra, FFTs, sparse solvers, statistical, …
- Highly optimized, vectorized
- Threaded internally using OpenMP*
- Repeated runs may not give identical results
� Conditional BitWise Reproducibility
- Repeated runs give identical results under certain conditions:
� Same number of threads
� OMP_SCHEDULE=static (the default)
� Same OS and architecture (e.g. Intel 64)
� Same microarchitecture, or specify a minimum microarchitecture
� Consistent data alignment
- Call mkl_bwr_set(…)
1/31/2013
35
69 / 75 Software & Services Group, Energy Engineering Team
Reproducibility of Reductions in OpenMP*
� Each thread has its own partial sum
- Breakdown, & hence results, depend on number of threads
- Partial sums are summed at end of loop
- Order of partial sums is undefined (OpenMP standard)
� First come, first served
� Result may vary from run to run (even for same # of threads)
� For both gcc and icc
� Can be more accurate than serial sum
- For icc, option to define the order of partial sums (tree)
� Makes results reproducible from run to run
� export KMP_FORCE_REDUCTION=tree (may change!)� May also help accuracy
� Possible slight performance impact, depends on context
� Requires static scheduling, fixed number of threads
� currently undocumented (“black belt”, at your own risk)
� See example
70 / 75 Software & Services Group, Energy Engineering Team
Conclusions
1/31/2013
36
71 / 75 Software & Services Group, Energy Engineering Team
Conclusions 1
• Amdahl is back (or never died) in 2D
Application must be 100% // and 100% SIMD
• Only your application can tell
• How far are you from the peak flops and peak BW ?
• What is the current impact of vectorization ?
• How parallel it is
• What execution model (offload, native, symmetric) ?
• Keep advantage of all CPU cores + Coprocessor
• Power efficiency
• Portable workload
72 / 75 Software & Services Group, Energy Engineering Team
Conclusion 2 : Perf measurement
• Use of the right metrics for performance measurements
• Know the max theoretical performance of your implementation
• Don’t forget system configuration and its impact on measurements
• Simple projections are usefull
• Final goal of perf modelling must be clearly defined
- Short term optimization with current kernel and hdw
- Short / mid term extrapolation for future hardware
- Long term extrapolation with future kernels and future hardwares
1/31/2013
37
73 / 75 Software & Services Group, Energy Engineering Team
Conclusion 3
• Keep portability in mind
• There is no free lunch with magic hardware , be sure you take the most
from the actual one
• Validate your results
• As usual on the physical side with analytical solution when possible
• Keep in mind « aggressive optim » and validate with secured options
74 / 75 Software & Services Group, Energy Engineering Team
References
74
● [1] Aart Bik: “The Software Vectorization Handbook”http://www.intel.com/intelpress/sum_vmmx.htm
● [2] Randy Allen, Ken Kennedy: “Optimizing Compilers forModern Architectures: A Dependence-based Approach”
● [3] Steven S. Muchnik, “Advanced Compiler Design and Implementation”
● [4] Intel Software Forums, Knowledge Base, White Papers,Tools Support (see http://software.intel.com)Sample Articles:
- http://software.intel.com/en-us/articles/a-guide-to-auto-vectorization-with-intel-c-compilers/
- http://software.intel.com/en-us/articles/requirements-for-vectorizable-loops/
- http://software.intel.com/en-us/articles/performance-tools-for-software-developers-intel-compiler-options-for-sse-generation-and-processor-specific-optimizations/
• The Intel® C++ and Fortran Compiler Documentation, “Floating Point Operations”
• “Consistency of Floating-Point Results using the Intel® Compiler” http://software.intel.com/en-us/articles/consistency-of-floating-point-results-using-the-intel-compiler/
• Goldberg, David: "What Every Computer Scientist Should Know About Floating-Point Arithmetic“ Computing Surveys, March 1991, pg. 203
• the new Intel® BWR features – see this article for more details
• We need your feedback on missing, failing or suboptimal compiler functionality
• Please file a Premier case or post your findings/wishes to the compiler user forum
1/31/2013
38
75 / 75 Software & Services Group, Energy Engineering Team
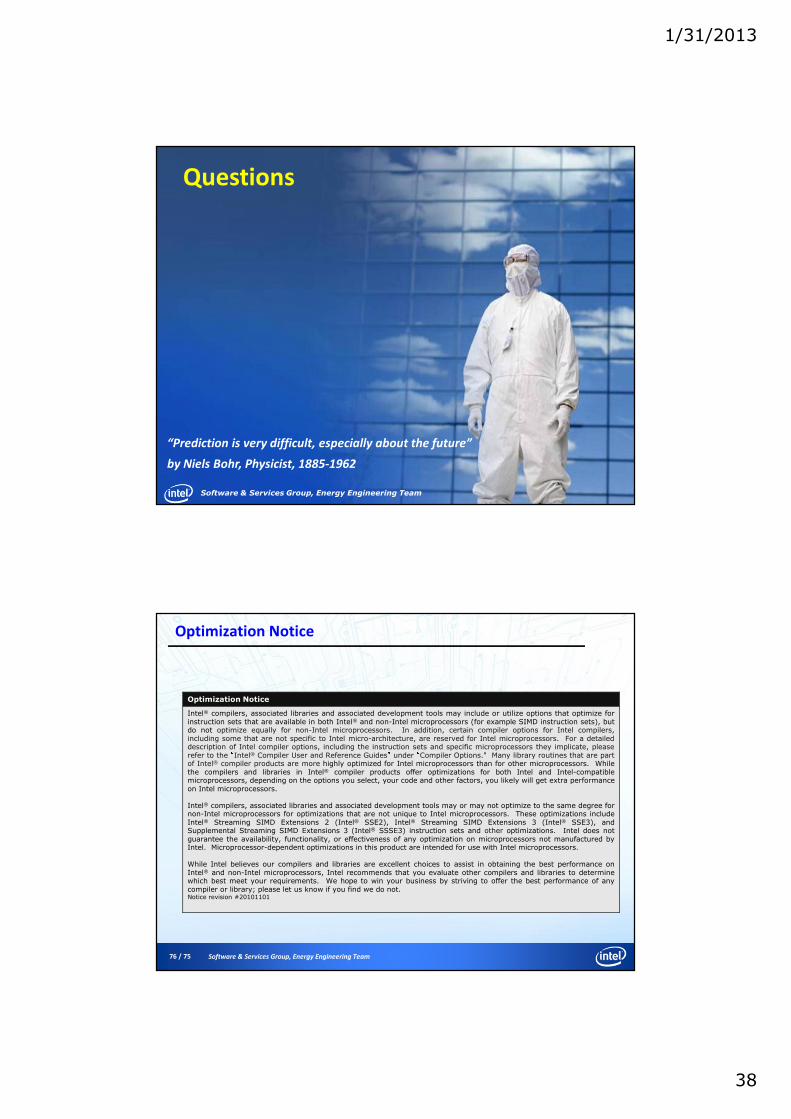
Questions
Software & Services Group, Energy Engineering Team
“Prediction is very difficult, especially about the future”
by Niels Bohr, Physicist, 1885-1962
76 / 75 Software & Services Group, Energy Engineering Team
Optimization Notice
Optimization Notice
Intel® compilers, associated libraries and associated development tools may include or utilize options that optimize forinstruction sets that are available in both Intel® and non-Intel microprocessors (for example SIMD instruction sets), butdo not optimize equally for non-Intel microprocessors. In addition, certain compiler options for Intel compilers,including some that are not specific to Intel micro-architecture, are reserved for Intel microprocessors. For a detaileddescription of Intel compiler options, including the instruction sets and specific microprocessors they implicate, pleaserefer to the “Intel® Compiler User and Reference Guides” under “Compiler Options." Many library routines that are partof Intel® compiler products are more highly optimized for Intel microprocessors than for other microprocessors. Whilethe compilers and libraries in Intel® compiler products offer optimizations for both Intel and Intel-compatiblemicroprocessors, depending on the options you select, your code and other factors, you likely will get extra performanceon Intel microprocessors.
Intel® compilers, associated libraries and associated development tools may or may not optimize to the same degree fornon-Intel microprocessors for optimizations that are not unique to Intel microprocessors. These optimizations includeIntel® Streaming SIMD Extensions 2 (Intel® SSE2), Intel® Streaming SIMD Extensions 3 (Intel® SSE3), andSupplemental Streaming SIMD Extensions 3 (Intel® SSSE3) instruction sets and other optimizations. Intel does notguarantee the availability, functionality, or effectiveness of any optimization on microprocessors not manufactured byIntel. Microprocessor-dependent optimizations in this product are intended for use with Intel microprocessors.
While Intel believes our compilers and libraries are excellent choices to assist in obtaining the best performance onIntel® and non-Intel microprocessors, Intel recommends that you evaluate other compilers and libraries to determinewhich best meet your requirements. We hope to win your business by striving to offer the best performance of anycompiler or library; please let us know if you find we do not.Notice revision #20101101
1/31/2013
39
77 / 75 Software & Services Group, Energy Engineering Team
Legal Disclaimer
Legal Disclamer
INFORMATION IN THIS DOCUMENT IS PROVIDED “AS IS”. NO LICENSE, EXPRESS OR IMPLIED, BY ESTOPPEL OROTHERWISE, TO ANY INTELLECTUAL PROPERTY RIGHTS IS GRANTED BY THIS DOCUMENT. INTEL ASSUMES NOLIABILITY WHATSOEVER AND INTEL DISCLAIMS ANY EXPRESS OR IMPLIED WARRANTY, RELATING TO THISINFORMATION INCLUDING LIABILITY OR WARRANTIES RELATING TO FITNESS FOR A PARTICULAR PURPOSE,MERCHANTABILITY, OR INFRINGEMENT OF ANY PATENT, COPYRIGHT OR OTHER INTELLECTUAL PROPERTY RIGHT.
Performance tests and ratings are measured using specific computer systems and/or components and reflect theapproximate performance of Intel products as measured by those tests. Any difference in system hardware or softwaredesign or configuration may affect actual performance. Buyers should consult other sources of information to evaluatethe performance of systems or components they are considering purchasing. For more information on performance testsand on the performance of Intel products, reference www.intel.com/software/products.
Intel and the Intel logo are trademarks of Intel Corporation in the U.S. and other countries.
*Other names and brands may be claimed as the property of others.
Copyright © 2010. Intel Corporation.