Embed Size (px)
Citation preview
Report To The Chairman, Committee On Labor And Human Resources United States Senate
aepartment Of Education Uncertain About Effectiveness Of Its Special Services Program
About $60 million a year is spent to fund about 600 projects under the Special Serv- iqes for Disadvantaged Students program. The Department of Education has not ade- qiuately monitored the projects to deter- r$ne whether their goal of increasing the p
i
stsecondary retention and graduation r tes of disadvantaged students has been
hieved.
120095
GAO/HRD-83-13 NOVEiMBER 12,1982
Request for copies of GAO reports should be sent to:
U.S. General Accounting Office Document Handling and Information
Services Facility P.O. 60x 6015 Gaithersburg, Md. 20760
I Telephone (202) 2756241
The first five copies of individual reports are free of charge. Additional copies of bound audit reports are $3.25 each. Additional copies of unbound report (i.e., letter reports) and most other publications are $1.00 each. There will be a 25% discount on all orders for 100 or more copies mailed to a single address. Sales orders must be prepaid on a cash, check, or money order basis. Check should be made out to the “Superintendent of Documents”.
UNITED STATES GENERAL ACCOUNTINQ OFFICE WASHINQTON, D.C. 20648
HUMAN RESOURCES
DIVISION
B-209515
The Honorable Orrin 0. Hatch Chairman, Committee on Labor and
Human Rerourcer United State0 Senate
f/Jear Mr. Chairmanr ___oI ,-.- ., : In your letter of February 20, 1981, you requerted that 1
we review the Department of Education'8 Special Programs for i Studonto from Diradvantaged Backgrounds--commonly known aa the TRIO programr. We have reviewed the administration of two l TRIO program0 --Special Servicea for Diradvantaged Student6 and Upward Bound. Thir report concern6 the Special Servicer program; ; a reparate report on the Upward Bound program will be issued to you at a later date. . /**. *..m.a.C----"~
I
I
This report contains recommendations to the Secretary of ducation which should assist him in determining if the program's oal and the objectives of individual projects funded by this rogram are being met.
A8 arranged with your office, we will not release the report or 30 days unlese you approve its release or make its contents ublic. At that time, we will send copies to the Secretary of ducation, the Director of the Office of Management and Budget, he Special Services grantees included in the study, and other
interested parties; we will also make copies available to others upon request.
Sincerely yours,
Phili$A. Bernstein Director
,‘.,
”

.
GENERAL ACCOUNTING OFFICE REPORT TO THE CHAIRMAN, COMMITTEE ON LABOR AND HUMAN RESOURCES UNITED STATES SENATE
DEPARTMENT OF EDUCATION UNCERTAIN ABOUT EFFECTIVENESS OF ITS SPECIAL SERVICES PROGRAM
DIGEST ----a- ..--
The Department of Education (ED) does not have assurance that the Special Services for Dis- advantaged Students program is achieving its goal of increasing the retention and graduation rates of disadvantaged postsecondary students. Under the program, grants are awarded to post- secondary institutions supporting projects to assist disadvantaged students to successfully pursue their programs of study by providing them with services, such as tutoring, counseling, and special classes.
Projects' objectives are not always consistent with the program's goal, and ED has not adequately monitored projects to determine whether the goal or the objectives have been met. Four of the 11 projects GAO visited did not have objectives concerning student retention rates or academic achievements. (See ppD 5 and 6.)
To assess the performance of a project, ED relies primarily on site visits and project-prepared per- formance reports. GAO found, however, that the visits and reports did not provide adequate data to assess performance. In fiscal year 1980, ED made site visits to only 24 of the 557 grantees, during which, ED did not determine whether proj- ects were meeting their objectives and did little followup to assure that any noted deficiencies were corrected. GAO did note instances where pro- posed objectives were not achieved, and there was no mention of this in ED's reports on visits to these sites. (See pp. 7 and 8.)
Although ED requires projects to report annually on the status of their operations, the reports did not compare actual performance with proposed ob- , jectives. At the projects visited, GAO noted several instances where objectives were not ac- complished or measured and these were not re- ported in performance reports. (See p. 8.)
Tow Shoot GAO/HRD-83-13 NOVEMBER 12,1982
The performance reports also do not provide informa- tion on the academic status of the Special Services students. Such information would be useful in assess- ing how well the program's retention and graduation goal is being met and in identifing projects whose methods have been successful in accomplishing the goal. For example, the participants at one project, which requires students to attend project-sponsored classes full time during their freshman year, had a retention rate of 98 percent as compared to the in- stitution's overall retention rate of 76 percent. (See pp. 9 and 10.)
RECOMMENDATIONS TO THE SECRETARY OF EDUCATION
To better determine whether the program goal and proj- ect objectives are being met, the Secretary should require proposals to contain objectives consistent with the program goal of increasing retention and graduation rates, (1) site visits to consider whether projects are accomplishing proposed objectives and (2) projects to report the status of all objectives in their performance reports. (See p. 10.)
DEPARTMENT OF EDUCATION COMMENTS AND GAO'S EVALUATION
ED concurred with GAO's recommendations stating that a need exists to improve the means by which the project objectives and overall program goal of several aspects of the Special Services for Dis- advantaged Students Programs are being met.
However, ED did not agree that it does not know whether the Special Services for Disadvantaged Stu- dents Program is achieving its goal. ED contends there is substantial evidence that indicates the program is achieving the program goal. To support its contention ED cited data from three sources. However, GAO does not believe that these sources pro- vide ED with sufficient proof. (See pp. 10 to 13.)
SCOPE AND METHODOLOGY
GAO undertook this review to (1) assess how well ED managed the Special Services program, (2) determine if projects were meeting project and program goals, and (3) determine the progress of students in the program. GAO reviewed a 3-year period of the program (1977-80) at 11 judgmentally selected grantees. Therefore, GAO cannot project its findings to all 557 projects operating during fiscal year 1980. (See PP. 3 and 4.)
ii
. . ; , -
‘1,
, ’

Content@
DIGEST
CHAPTER
1
2
APPENDIX
INTRODUCTION Program administration Project operation Ob jective8, acope, and methodology
ED NEEDS BETTER ASSURANCE THAT THE PROGRAM GOAL AND PROJECT OBJECTIVES ARE BEING MET
Project objective not alwayr conrirtent with the program goal
Alroarmontr not made to determine whether project objective8 are met
Conclurionr Racommendationr Agency commentr and our evaluation
I Inrtitutione visited during review and award amount8 for the 3year period 1977-80
II Special Service8 students receiving tutoring
III Special Service8 etudente receiving counseling
IV Agency comments
Page
i
5
6
10 10 10 10
14
15
16
17

CHAPTER 1
INTRODUCTION
The Department of Education‘s (ED's) Special Services for Disadvantaged Students program assists disadvantaged postsecond- ary students to pursue their programs of study by providing them with supportive services, such as tutoring, counseling, and special academic classes. During the program years we examined (1977-78 through 1979-80), eligible participants were postsecondary stu- dents who needed remedial services because they were educationally, culturally, or economically deprived, had limited English speaking ability, or were physically handicapped. The 1980 amendments to the Higher Education Act of 1965 changed the eligibility require- ments. Now a participant must be a low-income, physically handi- capped, or first-generation college student (a person neither of whose parents has completed a baccalaureate degree).
Although the authorizing legislation does not specifically identify the goal of the Special Services program, the program regulations in effect at the time of our review stated that the program's goal was to increase the postsecondary retention and graduation rates of participants. The recently issued Special Services regulations, implementing the 1980 amendments to the Higher Education Act, do not include a statement of the program's goal. However, the program was proposed to the Congress as one which would assist disadvantaged students in completing their undergraduate education, and the legislative history of the 1980 amendments does not indicate that the Congress intended to change the program's goal. Therefore, we believe postsecondary retention and graduation of participants is still the appropriate program goal.
The Special Services program was authorized by the Education Amendments of 1968 (Pub. L. No. 90-575) to Title IV-A Subpart 4 of the Higher Education Act of 1965, as amended (20 U.S.C. 1070). The program is one of four programs under Title IV-A aimed at re- moving nonfinancial barriers to entering and completing post- secondary education for students from disadvantaged backgrounds. Those programs (sometimes collectively referred to as TRIO pro- grams) are intended to complement other programs in title IV, which offer student financial assistance.
The Special Services program received its initial appropria- tion in 1970. Through fiscal year 1982, the program had been ap- propriated about $447 million. In fiscal year 1982, the program received $61 million which supported projects at 640 postsecondary inetitutions. A typical Special Services project at a postsecond- ary institution is supported by a $95,000 grant and is funded to serve an average of about 235 students.
1
PROGRAM ADMINISTRATION
ED's Office of Postsecondary Education, Office of Institu- tional Support Programs, Division of Student Services, manages the Special Services program from ED's headquarters in Washington, D.C. This office develops policies for program operation, reviews and approves project proposals, monitors and provides technical assist- ance to grantees, and evaluates projects' effectiveness.
The Special Services program is a discretionary grant program for which institutions of higher education must compete for avail- able funds. To obtain funds, prospective grantees submit proposals that outline their plans for providing services to assist eligible students to initiate, continue, and complete postsecondary educa- tion. ED employs field readers A/ to evaluate and score proposals based on factors, such as the need for services, the soundness of the project's design to provide the services, the adequacy of the applicant's resources and organization and the project's estimated cost. In addition, recently issued regulations, implementing a provision of the 1980 amendments to the Higher Education Act, re- quire that an applicant's prior experience in the program be con- sidered when awarding new'grants.
After field readers evaluate the proposals, ED officials re- view the readers' recommendations and determine how many projects will be funded and the funding level of each. ED usually funds projects for a 3-year period, with the second and third years being funded as long as funds are available and the need still exists. When the multiyear funding cycle ends, projects must develop new proposals and again participate in the competitive funding process.
PROJECT OPERATION
Special Services projects operate under broad ED regulations and consequently vary in their methods of providing services. For instance, in selecting participants, some projects actively seek to identify eligible students before their enrollment in school and encourage them to use program services. Other projects re- quire students to participate if they do not meet regular admis- sion standards. Still others may publicize their services but leave it to the students to seek the services or rely on instruc- tors and/or counselors to request that students obtain the serv- ices.
The projects also vary in the mix and extent of services offered. Most projects offer tutoring and counseling services, and some also offer project-sponsored remedial classes. Most
L/Non-Federal reviewers who have expertise in educating dis- advantaged persons.

projects we virited derign their servicee to meet the needs of freshmen. However, some projects provided limited services to upperclassmen. The range and extent of services provided students run the full gamut-- from one counseling or tutoring seseion to a full year'o course pluo tutoring and counseling.
OBJECTIVES, SCOPE, AND MSTHODOLOGY
Our review was made in accordance with generally accepted government audit standards. It focused on ED'8 management of the Special Services program. The purpose of the review wae to (1) aseess how well ED managed the Special Services program, (2) de- termine if the projects were meeting project and program goals, and (3) determine the progrese of students in the program. After we started the review, the Chairman of the Senate Committee on Labor and Human Resources expressed an interest in the assignment and aeked that the report be issued to his Committee.
Cur review covered program operation8 in fiscal years 1978, 1979, and 1980 (academic years 1977-78, 1978-79, and 197940). We made the review at ED headquarters in Waehington, D.C., and at selected Special Services projects. At ED headquarters, we in- terviewed officials in the Division of Student Services who ad- minister the Special Services program. The interviews focused on the guidance ED provides to grantees and the methods ED uses to assure that projects carry out activities in accordance with regulations and grant procedures. We reviewed the Special Serv- ices legislation, regulations and directives, and congressional hearinga and reports. In addition, we reviewed a report I./ on the national evaluation of the program performed under an ED
;contract. This evaluation covered the 1979-80 academic year and reVieWed the program's impact on freshmen students who received services during that period.
We assessed implementation of the program through visits to 11 Special Services projects operated by postsecondary institu- tione in Alabama, Georgia, Massachusetts, Rhode Island, South Carolina, and Texas. In academic year 1979-80 (the last one we examined), there were a total of 557 grantees in the Special Services program, and their characteristics, such as type of school (2-year or 4=year), source of support (public or private), size, location, and major ethnic/racial population served, were quite diverse. Our judgmentally selected sample included schools with a wide variety of these characteristics. In addition, since ED usually awarded grants on a 3-year cycle, we selected only institutions that were awarded grants covering the 3-year period
--_I-
L/"Bvaluation of the Special Services for Disadvantaged Students (SSDS) Program: 1979430 Academic Year" System Development Corporation, August 1981 (TM-6198/003/00).
3
beginning with academic year 1977-78. The institutions selected received grant funds totaling about $3.0 million during the 3-year period. Program officials responsible for monitoring Special Serv- ices grantees told us they believed we had chosen a representative sample.
At each institution, we conducted structured interviews with project officials and reviewed the approved project proposals, per- formance reports, financial records, student transcripts, and other data that provided insight on project operations. We compared each project's accomplishments with the objectives outlined in its pro- posal. We selected a simple random sample of students from project rosters by year for each year of the 3-year funding cycle and at- tempted to determine
--if they met the program's eligibility criteria:
--the extent and frequency of services received:
--their progress in terms of credit hours attempted and passed;
--their grade point dveraget and
--if they were still enrolled, withdrew, or graduated.
Our sample included 707 students or about 10 percent of those who were supposed to have participated at the projects selected.
Because the projects we visited were judgmentally selected and the number was limited due to time and staff constraints, we could not project, with any statistical validity, our findings regarding program performance. However, our findings at these 11 projects indicate a need for increased attention by ED manage- ment concerning the program's administration.
4
.( .’ .:,
..a
CHAPTER 2
ED NEED8 BETTER ASSURANCE THAT THE PROGRAM GOAL
AND PROJECT OBJECTIVES ARE BEING MET
ED doer not have adequate assurance that the Special Services program ia achieving its goal of increasing the retention and graduation rates of disadvantaged students in postsecondary educa- tion. Projects' objectives are not always consietent with the pro- gram’ 6 goal. ED has not adequately monitored projects to determine whether the program goal or the stated objectives of the projects have been met.
To assess the projects' performance, ED relies primarily on information collected by its program monitors during project site visits and information contained in performance reports submitted by the grantees. Neither the visits nor the reports have provided an adequate basis to assess performance. ED has made few visits to the projects covered by our review, and the visits that were made did not measure the projects' performance against their ap- proved objectives. Some grantee performance reports have not con- tained complete information concerning project activities.
PROJECT OBJECTIVES NOT ALWYS CONSISTENT WITH THE PROGRAM GOAL
Even though increased retention and graduation of disadvan- taged students in postsecondary education is the primary goal of Special Services, ED has not required projects to set measurable objectives for participants' postsecondary retention or academic achievements. Only 3 of the 11 projects we visited had an objec- tive specifically stated in terms of retention and graduation of students.
--A public 2-year college proposed that 180 of the approxi- mately 800 participants served during the 3year grant period 1977-80 would complete their program and graduate with an Associate Degree or Certificate: 154 of the pro ject'a participanta received their degrees during this period.
--A public university proposed to increase its participating students' retention rate to 80 percent: the participants' retention rate over the proposal period (1977-80) averaged 98 percent.
--A private 4-year college proposed that 60 percent of the participants' would graduate: the project, however, did not document its performance against this objective.
5
I,. *I , :’ 2 _.. :
Six of the 11 projects, including 2 of the above, had measurable objectives for student achievements stated in terms of courses passed, grade point averages, or scores on standardized tests. Generally, however, the projects did not achieve the objectives or did not determine if these objectives were achieved.
Usually projects had objectives relating to the number of students to be served and the services to be provided. Most other objectives, however, were stated in broad, vague terms that were not measurable. For example:
--One project proposed to "create a high level of knowledge about the program on-campus." Another objective stated that "each individual will be knowledgeable and effective in utilizing college procedures and policies pertaining to academic and career development."
--Another project proposed "to provide daily incentives (motivators), appropriate cultural enrichment and remedial classes/activities, as approved by the program director, by program staff to improve a total commitment to academic and personal-social excellency for each eligible student."
--A major objective of one project was "to provide culturally deprived students with opportunities to remedy deficiencies in their ability to understand, appreciate, and relate to the dominant cultural patterns and expressions in their environment."
Although these may be valid objectives, their relationship to the lprogram goal concerning student retention and graduation rates was :not indicated in the grant proposals.
On June 8, 1982, ED issued program regulations which require that an applicant's prior experience in the Special Services pro- gram be considered when awarding new grants. These regulations consider the extent to which project participants persisted (in- cludes both retention and graduation) toward completing their academic programs. However, they do not require projects to set objectives related to increasing participants' persistence or performance.
ASSESSMENTS NOT MADE TO DETERMINE WHETHER PROJECT OBJECTIVES AREMET
ED has relied primarily on site visits and grantee-prepared performance reports to assess the projects' performance. Under its new regulations, ED plans to rely on these visits and reports as well as audit reports and information in the proposals, to assess a project's prior experience. A program official told us that audit reports are of limited assistance in assessing a proj- ect's performance because they are often not timely and do not
6
conrider many important arpecte of the program. None of the grantees we virited had audit6 that determined if the project achieved the program goal and project objectives. Site visits have been infrequent anc¶ limited in scope, and performance reports have not alwayrr been complete or accurate; therefore, neither asretrsment approach har provided an adequate basis for assessing a project 'e performance.
Site virltr are infrequent and limited in rcope
During fiscal year 1980 (academic year 1979080), ED made only 24 site visits to the 557 Special Services projects. Of the 11 projects we reviewed, 3 were visited once during the 3-year grant period (1977-80); 3 were not visited in about the last 5 years; and according to project officials, 5 had never been vieited since receiving their initial Special Services grant. Beginning in fiscal year 1981, ED program officials developed guidelines requiring one-fourth of the projects to be visited each year. However, ED officials stated that, due to limited staff and severe travel cutbacks, they have not been able to meet this guideline.
The primary objectives of.ED site visits are to determine whether projects are complying with program regulations and ac- complishing approved proposed objectives. During a site visit, ED monitors use a pro forma questionnaire to obtain information about the project and compliance with documentation requirements. The questionnaire, however, does not address matters specifically related to implementation of proposed objectives. Consequently, during its site visits, ED personnel generally did not determine whether the projects' proposed objectives were being met.
All three projects we visited that had a site visit during the 3-year grant period (1977-80) failed to meet one or more of their objectives. One project did not accomplish 5 of its 10 ob- jectiveat another project did not accomplish 1 of 3 objectives. The third project proposed six objectives: however, two were in broad, general terms that could not be measured, and three of the four measurable objectives were not achieved. The site visit re- port for these projects gave no indication that proposed objec- tives were not being met.
Site visits were not as effective as they could have been because, even when deficiencies were identified, ED did not always follow up to determine if the projects corrected the deficiencies noted during the visits. For example, a site visit report on a project noted a number of deficiencies, including
--no documentation of counseling services,
--a lack of documentation of student eligibility, and
7

--inadequate tracking of students leaving the program.
Our review of this project, about 3 years after the site visit, showed a continued lack of documentation of eligibility for a significant number of participants, no documentation of counsel- ing services, and no attempts to track participants leaving the program. The project director stated that ED had not contacted the project to determine if the deficiencies were corrected.
After completion of our review, new procedures for monitor- ing visits to projects were developed. The pro forma question- naire used with these new procedures does not specifically require a comparison of project objectives and accomplishments.
Project reports need to be ~ complete and accurate
At the time of our review, ED required Special Services proj- ects to submit reports of their performance semiannually. Now such reports are required annually. The reports, which are intended to assist ED in its monitoring of project operations, include such information a’s:
--The number of participants served.
--The basis for each participant's eligibility for services.
--he participants' distribution by sex and ethno-racial background.
--The number of students receiving project services such as counseling, tutoring, orientation, and classroom instruction.
--The reasons participants left the project.
In addition, projects may write a brief narrative comparing accom- plishments with their proposed objectives. ED requires this in- formation, however, only if the objectives were not attained.
At the projects visited, we compared performance against proposed objectives and noted instances where objectives were not accomplished or measured, but this was not noted in performance reports. For example, five of the projects failed to report that they fell short of serving the number of students proposed. One project proposed to raise the reading level of at least 75 percent of its participants to the 50th percentile by the end of 1 academic year: however, it did not measure participant achievement levels. Another project proposed to provide services that would enable at least 75 percent of its participants to complete required courses; however, the project did not track students to determine if they successfully completed courses.
8
The reports also did not show that, at some projects, stu- dents were not ueing tutoring and counseling services to the degree proposed. Although seven of the projects we visited proposed to provide counseling to each participant, only 265 (58 percent) of the eample participants at these projects received this service. (See app. III.) Six projects proposed to provide tutoring services to each participant. One of these projects did not document the provieion of tutoring services, and only 153 (42 percent) of the sampled students at the other five projects received any tutoring. (See app. II.) At a project which proposed to provide individual- ized tutoring to those students needing the service, the 25 sampled participants failed to attend 77 percent of their scheduled tutor- ing sessions. The reports of these projects did not state that tutoring and counseling services were not being used as proposed.
The project reports are not required to provide information on the academic status of Special Services studenta. Such in- formation would be useful in assessing how well the program's goal of increased student retention and graduation is being met. It would alao help to identify projects that might be considered ex- emplary and whoee methods, if adopted, may be helpful to other projects. In this regard, the progress of freshmen students in one project was impressive in terms of retention and academic per- formance. The only difference between this project and others we visited was that, in addition to tutoring, counseling, and other special services, students attended project-sponsored credit courses on a full-time basis during their freshmen year. The proj- ect's records showed that about 98 percent of the participating students who entered school during academic years 1977-78, 1978-79, and 1979-80 enrolled the following year. This compares to the institution's average retention rate for freshmen who entered dur- ing these same academic years of 76 percent. In addition, from a random sample of 38 students who participated in the project during 1977-80, 30 (79 percent) had overall grade point averages of 2.0 or better, and only 6 (16 percent) eventually withdrew from school. Of the 32 students who did not withdraw, only 6 (19 percent) were 2 or more terms behind what the institution considered the normal rate of progression toward graduation (i.e., 2 years in 2-year school, 4 years in 4-year school).
We compared the characteristics (i.e., reasons eligible, sex, ethno-racial background, etc.) of the students participating in this project with those of other projects visited and found no appreciable differences. In addition, there was nothing especially unique about the institution hosting the project. However, by com- parison at the other projects we visited, only 59 percent (277 of 471 students) of the sampled students had overall grade point aver- ages of 2.0 or better, and about 50 percent (276 of 552 students)
9
had withdrawn from school. L/ Of those students who had not with- drawn, about 33 percent were 2 or more terms behind the normal rate of progression toward graduation.
CONCLUSIONS
Based on our review of ED's policies and procedures for moni- toring the Special Services projects and our test of these proce- dures at a small sample of projects, we believe ED has little basis to determine if the Special Services program is meeting its goal of increasing the postsecondary retention and graduation rates of disadvantaged students. Requiring projects to set measurable ob- jectives consistent with the program goal and requiring projects to report on the academic performance of participants and the status of other project objectives would help to assess the pro-
~ gram's achievements. Also, expanding monitoring visits so that I they include a review of whether the program goal and project ob- ~ jectives are being achieved would also help ED assess the program.
RECOMM8NDATIONS
To better determine whether the program goal and project ob- jectives are being met, the Secretary of Education should require (1) project proposals to contain measurable objectives consistent with the program goal of increasing retention and graduation rates, (2) project monitoring visits to determine whether projects are meeting proposed objectives, and (3) project annual performance
~ reports to include information on the academic performance of par- ~ ticipating students and the status of all proposed objectives I whether accomplished or not.
I AGENCY COMMENTS AND OUR EVALUATION ~
In commenting on a draft of our report (see app. IV), ED con- ~ curred with our recommendations. ED stated that a need exists to
improve the means by which the project objectives and overall pro- gram goal of several aspects of the Special Services for Dis- advantaged Students Program are being met.
However, ED did not agree with the main message of our report that it does not know whether the Special Services for Disadvan- taged Students Program is achieving its goal. ED contends there is substantial evidence from several sources that indicates the
( program is achieving its goal. To support its contention ED
L/Grade point averages could not be computed for 81 of the sampled students.
10
cited data from three sources. We do not believe these data suf- ficiently support ED's contention, and continue to believe that there is considerable uncertainty as to whether the program goal is being achieved.
The first source of data cited by ED is a compilation of annual performance reports submitted by Special Services grantees for program years 1978-79 through 1980-81. (Our review covered program years 1977-78 through 1979-80.) These data show that an average of 67 percent of the students served each year remained enrolled in the project and in school throughout the year. Ac- cording to the data, about 20 percent of the students were no longer enrolled in the project because they graduated from college (5.2 percent), transferred to another school (2.4 percent), or no longer needed the services of the project (12.5 percent). The remainder of about 13 percent dropped out of the program for var- ious reasons, including personal, health, and academic dismissals.
While the performance reports indicate that 67 percent of the $tudents remained in the project, they do not indicate whether these students were satisfactorily progressing toward graduation-- the ultimate goal of the program. At the 11 projects we visited, many of the students on whom we obtained data were not meeting the standards of academic progress and performance established by their schools. Forty percent of the 'students sampled had grade point averages below 2.0 (the minimum required to meet graduation re- quirements), 48 percent had dropped out of school, and 61 percent of those remaining in school were not progressing toward graduation +t what their schools considered a normal rate. &/ The retention of some students may be partially attributed to program regulations $n effect during the period covered by the data that required schools to retain Special Services students for a minimum time per- iod 2/ regardless of their academic performance.
A second source ED used to support its contention was data obtained from a recent initiative undertaken by ED's Office of Postsecondary Education. This initiative was designed to identify ,and disseminate information on programs and practices of exemplary quality which were cost effective. According to officials in ED's Office of Postsecondary Education, under this initiative all 613
l/Our sample was composed of a total of 707 students at the 11 projects. However, due to factors such as unavailable tran- scripts, students withdrawing from all courses, and programs which did not record grades of less than a "C," our sample for grade point averages and rates of progression was 509 and our sample for drop out rates was 584.
&/The minimum retention periods were 1 year in a 2-year school and 2 years in a Q-year school. This provision was eliminated from revised regulations issued in March 1982.
11
Special Service8 projects were invited to submit data on their operations if they thought the project was exemplary or used ex- emplary practices. Approximately 35 projects submitted such data. ' An independent panel of ED personnel determined that 19 projects had submitted data which described program6 or practices which were cost effective and of exemplary quality. The 19 projects represent lees than 4 percent of the 613 projects and would not, in our opin- ion, provide a sufficient basis for determining whether the program as a whole is accomplishing its goal.
The third source of data which ED cited was a contracted study of the Special Services program conducted during the 1979-80 aca- demic year by System Development Corporation. Among other things the study examined (1) the effect of the support services provided by the Special Servicee projects and by other sources on the re- tention rates of a student sample composed of Special Services par- ticipants and nonparticipants with characteristics similar to the participants and (2) the amount and type of support services pro- vided by the sampled Special Services projects to their partici- pants.
The study divided the student sample into 11 groups depending on which services they received and whether the Special Services project or some other source provided each of the services. These groups ranged from one which received no support services to one that received the full range of services (tutoring, counseling, and group instruction) from the Special Services projects to some that received support services only from sources other than the Special Services projects. Five of the 10 groups which received services had no greater odds of persisting through their freshman year than students who received no support services. The other five groups had greater odds of persisting. Only one of these five received all of its support services from the Special Serv- ices project. This group received the full range of services and had the greatest increased odds (2.26) of persistence. While the report did not state the number or percent of Special Services students in the sample who received this full range of services from the Special Services projects, ED officials, after contacting the study's project officer, advised us that only about 12 percent of the sampled Special Services students were in this group.
The study report also noted that students' persistence in academic studies and the number of credits attempted and earned are related to the amount of services received. However, when examining the services provided by the sampled Special Services projects to all of their participants, the study found that about half of the Special Services students received no tutoring, about two-thirds received no group instruction, and about one-third re- ceived no counseling. Our review also showed that Special Serv- ices participants made limited use of the services offered by the projects. Forty-nine percent of the students in our sample re- ceived no tutoring and 42 percent received no counseling. We did
12
not obtain data on the number of students participating in group instruction.
Accordingly, although the study shows a positive relation- ship between student persistence and progress and the amount of services received, its data on the use of services by Special Services participants indicate that a substantial portion of Special Services participants received limited services and might not be realizing the increased potential for retention indicated by the study.
ED's specific comments on each of our recommendations is presented below.
Require project proposals to contain measurable objectives consistent with the program qoal
ED said that it will instruct potential grantees, field readers, and ED program officers of the need for Special Services proposals to contain measurable objectives related to the program goal. The grantees' attainment of such objectives will be assessed during monitoring activities and when evaluating a grantee's prior experience in connection with the award of a new grant.
Broject monitoring visits should determine whether projects are meetinq proposed objectives
ED said that program officers will be specifically instructed to assess the goal and objectives that impact most directly upon
: articipant retention and graduation. If these objectives are not eing met, or if it is impossible to validate performance data,
the program officer will be required to make recommendations to correct the problems. The site visit report will document the program officer's findings and any required followup.
equire project performance reports to nclude information on the academic
performance of partlcipatinq students and the status of all proposed objectives
ED said that it is developing a new Special Services project performance report. This new report will require specific data ,on the academic performance and progress of project participants. ED officials said they would use the report both as a project monitoring device and as a means for aggregating overall student performance, retention, and graduation data for the purpose of assessing the program goal.
13
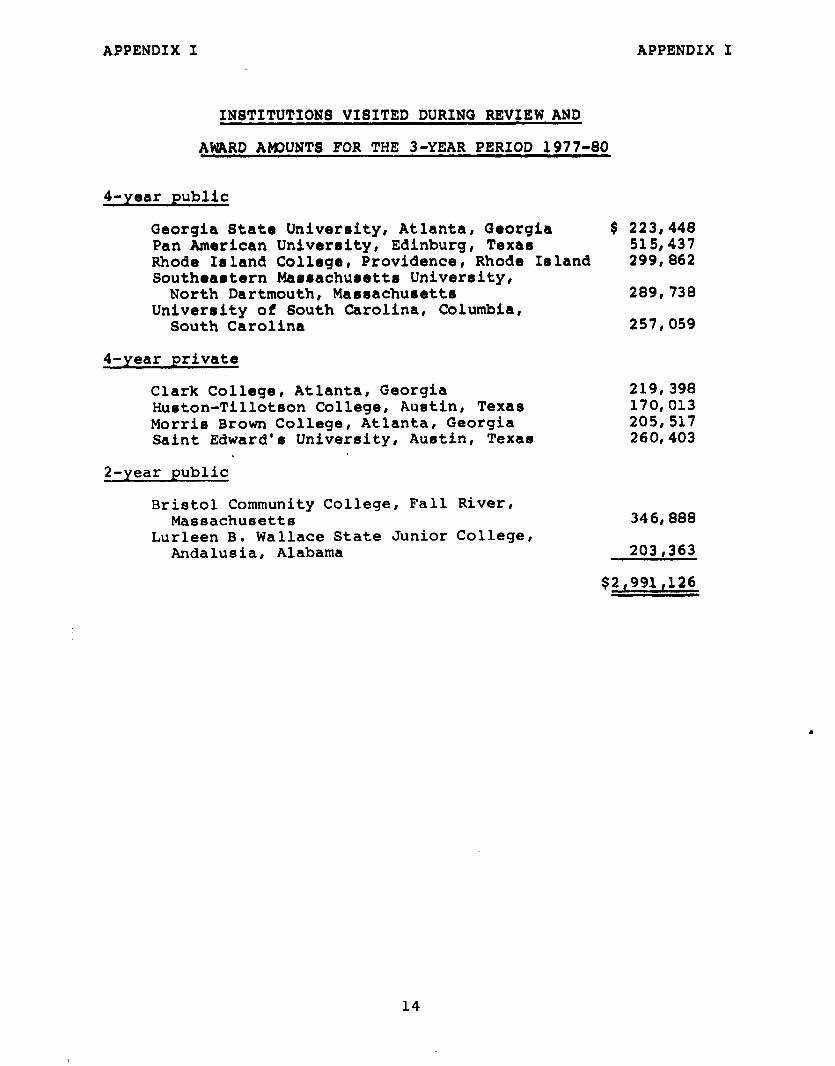
APPENDIX I APPENDIX I
INSTITUTIONS VISITED DURING REVIEW AND
AJRD AM3UNTS FOR THE 3-YEAR PERIOD 1977-80
Q-year public
Georgia Stat8 University, Atlanta, Georgia $ 223,448 Pan American University, Edinburg, Texas 515,437 Rhode Ieland College, Providence, Rhode Ieland 299,862 Southeaetern Mar8achueetts University,
North Dartmouth, Marsachueette 289,738 University of South Carolina, Columbia,
South Carolina 257,059
4-year private
Clark College, Atlanta, Georgia 219,398 Huston-Tilloteon College, Austin, Texas 170,013 Morris Brown College, Atlanta, Georgia 205,517 Saint Edward's University, Austin, Texas 260,403
2-year public
Bristol Community College, Fall River, Massachusetts
Lurleen B. Wallace Stat8 Junior College, Andalusia, Alabama
346,888
203,363
$2,991,126
14
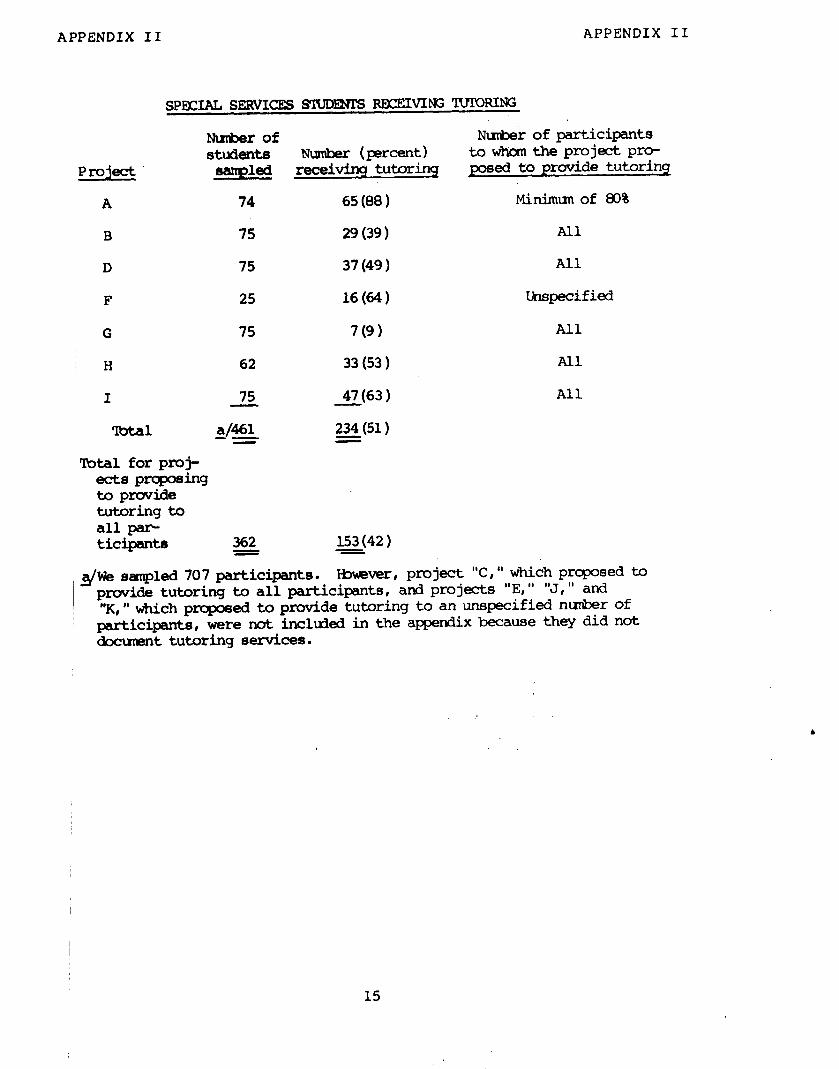
APPENDIX II APPENDIX II
Project
A
B
D
F
G
H
I
mtal
sPECIALsEEmCEssmm3TsREcEm~~~~
Nunber of Nu&er of participants students Number (percent) to whom the project pro-
receivinq tutorinq eanpled led to provide tutorinq
74 65(88) Minimunof 80%
75 29 (39 ) All
75 37(49) All
25 1664) Unspecified
75 7 (9 1 All
62 33(53) All
75 47(63) All
a/461 234(51) -- Z Tbtal for proj-
ectspW?sing topmvide tutoringto all part ticipants 362 - 153(42)
We sampled 707 participants. E&mer, project "C," which prcposed to provide tutoring to all participants, and projects "E," "J," and
I "K," which prqxmed to provide tutoring to an unspecified nun&r of participants, were not included in the appendix because they did not documnt tutoring services.
15
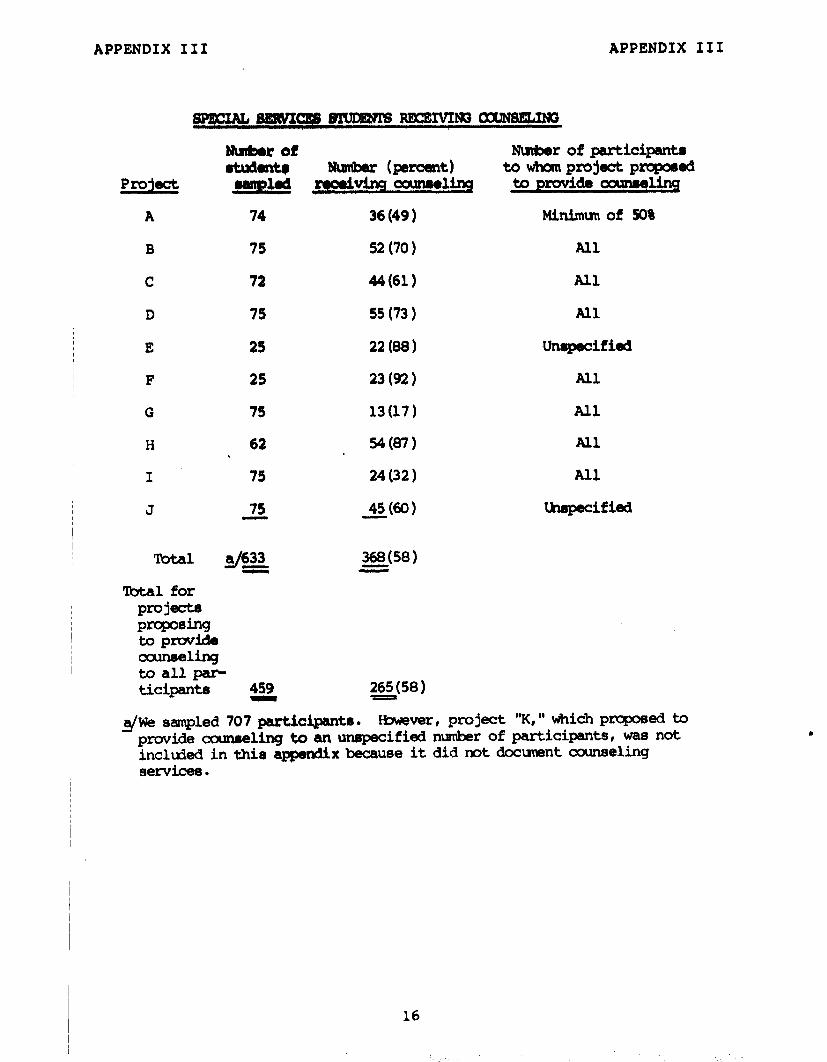
APPENDIX III APPENDIX III
PrOjOCt
A
B
C
D
E
F
G
H
I
J
Rrtal for Pmje prw-mg tipmvide CCWWling to all Par-
72
7s
25
25
7s
62
75 24 (32 )
75
36 (49 )
52 (70)
4461)
55 (73 )
22 (88 )
23@2)
13(17)
54(87)
368(58) E
Nw&w of participant8
Minimunof 50%
All
All
All
Unqmcified
All
All
All
All
mapecified
tACipGf4 459 265-W 1
4/We sampled 707 participants. Waver, project "K," which prqosed to PWti munmeling to an unspecified number of participants, was not inclubd in this appendix because it did not documnt counseling services.
16

APPENDIX IV APPENDIX IV
UNITED STATES DEPARTMENT OF EDUCATION OFFICE OF THE ASSISTANT SECRETARY FOR POSTSECONDARY EDUCATION
Hurran - r!dd.sim mited states General -ting office
bTadb@m, D.C. 20548
marMr.Atartr
Attzchedisourresprnse tothedraft CaOrep0rta-i the %pecial
semi.ces far lBba&mn~Students Progrm". If them are any
questian8ccMmingthismat~,pleasecontactm.RichardL.
E%Lirley,~,mtituti~support~m. Histelephone
nunber is (202) 755-1254.
lhclnasP.Melady 1 Assistant Secretary
i
4Ol1 MARYLAND AVE.. SW WASHINGTON. DC. 20202
17

APPENDIX IV APPENDIX IV
Response to GAD Study Entitled
"The Departn#nt of Education Does Not Know Whether the Special Services for Disadvantaged Students Program is Achieving Its Goals"
As indicated by our comnants to the GAD recommendations outlined below,
the Department of Education concurs that a need exists to improve the
means by which the project objectives and overall program goals
of several &pacts of the Special Services for Disadvantaged Students Program
are being met. We respectfully take exception to the title of the
GAD report, however, which, without qualification, states that the
Department of Education does not know whether the Special Services for
Disadvantaged Students Program is achieving its goals. In fact, there
is substantlal evidence from several sources that indicate that the
program & achieving program goals. Further, we do not concur with
the report's suggestion that the sample used by GAD is representative,
nor wlth the Inference that the study Is an accurate characterization
of all of the SSDS projects nationwide.
Although the GAD does indicate, In their outllne of the scope and
methodology of thls report, that only "11 judgementally selected
grantees" were studled and that 'I . ..GAD cannot project its flndlngs
to all 557 projects." (sic) (p. ill GAD Draft), they fail to remind
the reader of this crucial llmltation when expressing their conclusions.
As a result it is easy for the reader to conclude that this study
accurately describes all SSDS projects and that there Is virtually no
real indlcatlon that the program is accomplishing Its mission. The
evidence reveals otherwfse.
Table 1, summarizes existing performance data for the years of the GAO
study. This data represents a compilation of information submitted by
SSDS projects at the end of each project year in their Annual Performance
Reports (ED Form 1231)
August 23, 1982
18

APPENDIX IV APPENDIX IV
Total No. of Studencr jhrolled in SSDS
SSDS No Loo#er rkquirc
Iranmforrd
Craduacd
Um~ckl Aid
cratered nilitery
?*rwnel
Bulth
Duth
Audric Dlrlmd
Admin. Dirirul
continu* in Proj*ct Uowotitable
IWL In ?reject
SSDS ?cxroxJ4ANcc xc?OXT SulmAn
1978 - 1981
Py 1978 - 1979 PI 1979 - 19ar
147,648 (100%) 172,986 (1002:
16,719 (11.3%) 21,435 (12.4%;
3,615 ( 2.4%) 4,157 ( 2.6%)
7,704 ( 5.2%) 0,967 ( 5.2%)
1.395 ( .9X) 1,478 ( .9X)
29s ( .2X; 368 ( .2X)
9,084 ( 6.2%) 11,039 ( 6.5%)
991 ( .7X) 1.249 ( ..T%)
00 ( .OSX) 0.8 ( .05X)
3,533 ( 2.4X) 4,204 ( 2.4%)
321 ( .2X) 494 ( .3X)
1,950 ( 1.3%: 2,763 ( 1.6%)
&g.,Sl ( SW ( ssu
FI 1980 - 1981 livcrrge 1978-81
172,071 (100% 166,235 (100%)
23,632 (13.6%) 20,528 (12.5%)
6.270 ( 2.5%) 6,0;4 ( 2.4%)
9,080 ( 5.3%) 0,504 ( 5.2%)
1,815 ( 1.1%) 1,563 ( 1.0%)
339 ( .2X) 334 ( .2X)
11,166 ( 6.5%) 10,429 ( 6.4%)
1,358 ( .E%) 1,199 ( .7X)
113 ( .06X) 94 ( .05X)
6,790 ( 2.7%) 6,176 ( 2.fX)
666 ( .4%) 486 ( .3%)
3.382 ( 1.9Z) 2,692 ( 1.62)
( ~110.136 ( 67x1
SOURCE: U.S. Department of Education Special Services Final Performance Report Program Year 1978-1979; 1979-1980; and 1980-1981.
As indicated in the fourth column of Table 1.. the average number of
students served each year during the three year period was 164,235.
Of this number an average of 67 percent (110,136), continued to be
enrolled in college and in the project each year. Of those who left
the progranr during the year, an average of 5.2 percent graduated from
college and 2.4 percent transferred to other postsecondary institutions.
An addltlonal 12.5 percent left because they no longer needed the
services of the SSOS project although they continued to be enrolled
In college. Therefore, over 87 percent, on the average, were
achieving the program goal of "retention in, and/or graduation from
postsecondary education.w
19

APPENDIX IV APPENDIX IV
The Department concludes that If 87 percent of the low income, dlsad-
vantaged students served durlng the three year period are still perslstlng
or have graduated from postsecondary education that this constitutes
success. We believe that these data provlde the Department of Education
wlth substantlal assurance that program goals are being attained.
While about 13 percent of the students enrolled In SSDS did leave the
projects for other reasons, durlng thls period, only 4.4 percent departed
for reasons that mlght be Interpreted as having an impact upon Special
Services Program goals (e.g. Academic Dlsmlssal, 2.5 percent, Administrative
DIsmIssal .3X and Project DIsmIssal 1.6%). In as much as all other reasons
for departlng (e.g. health, personal, death, mllltary, flnanclal) appear
to be outslde of the control of project staff, it would seem that such
numbers have a neutral effect on project or program success.
Another example of why we feel that In large part the program is meeting the
leglslated goal comes from a recent initiative undertaken by the Dfflce of Post-
secondary Education. This effort was deslgned to identify and disseminate
information on programs and practices of exemplary quality and which are cost-
effective. More than 35 SSDS projects responded to a rigorous questionalre in
which they were required to provide detailed evidence of their effectiveness.
The evidence documented in the responses to this initiative strongly suggests
that program goals and objectives are being met for these Institutions.
Aside from the internal sources which tend to conflrm that SSDS project
objectives and program goals are substantially being met, the Department
20
,
APPENDIX IV APPENDIX IV
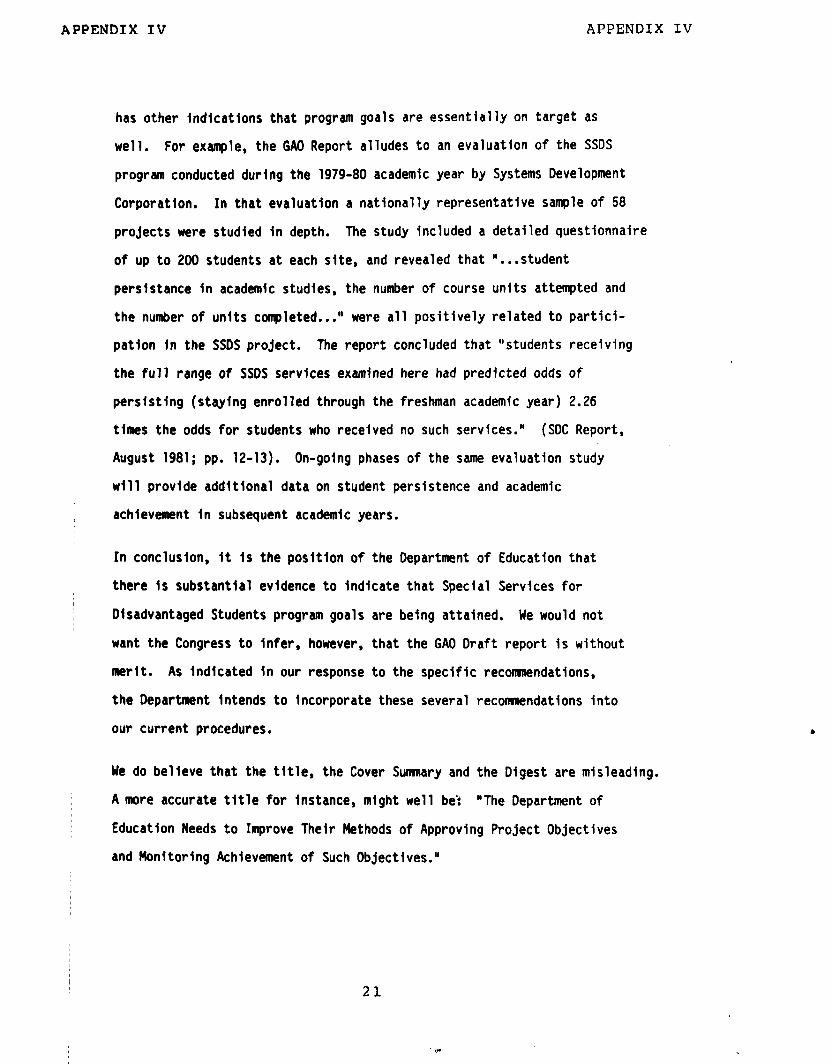
has other indications that program goals are essentially on target as
well. For example, the GAO Report alludes to an evaluation of the SSDS
program conducted during the 1979-80 academic year by Systems Development
Corporatlon. In that evaluation a nationally representative sample of 58
projects were studied in depth. The study included a detailed questionnaire
of up to 200 students at each site, and revealed that "...student
persfstance in academic studies, the number of course units attempted and
the number of unlts completed..." were all positively related to partici-
pation in the SSDS project. The report concluded that "students receiving
the full range of SSDS services examlned here had predicted odds of
persisting (staying enrolled through the freshman academic year) 2.26
times the odds for students who received no such services." (SDC Report,
August 1981; pp. 12-13). On-going phases of the same evaluation study
will provlde additional data on student persistence and academic
achievement in subsequent academic years.
In conclusion, It is the position of the Department of Education that
there is substantial evidence to Indicate that Special Services for
Disadvantaged Students program goals are being attalned. We would not
want the Congress to infer, however, that the GAO Draft report is without
merit. As Indicated In our response to the specific recomnendatfons,
the Department Intends to Incorporate these several recommendations into
our current procedures.
We do believe that the title, the Cover Sumnary and the Digest are misleading.
A more accurate title for instance, mlght well bei "The Department of
Education Needs to Improve Their Methods of Approving Project Objectives
and Monftorlng Achievement of Such Objectives."
21
APPENDIX IV APPENDIX IV
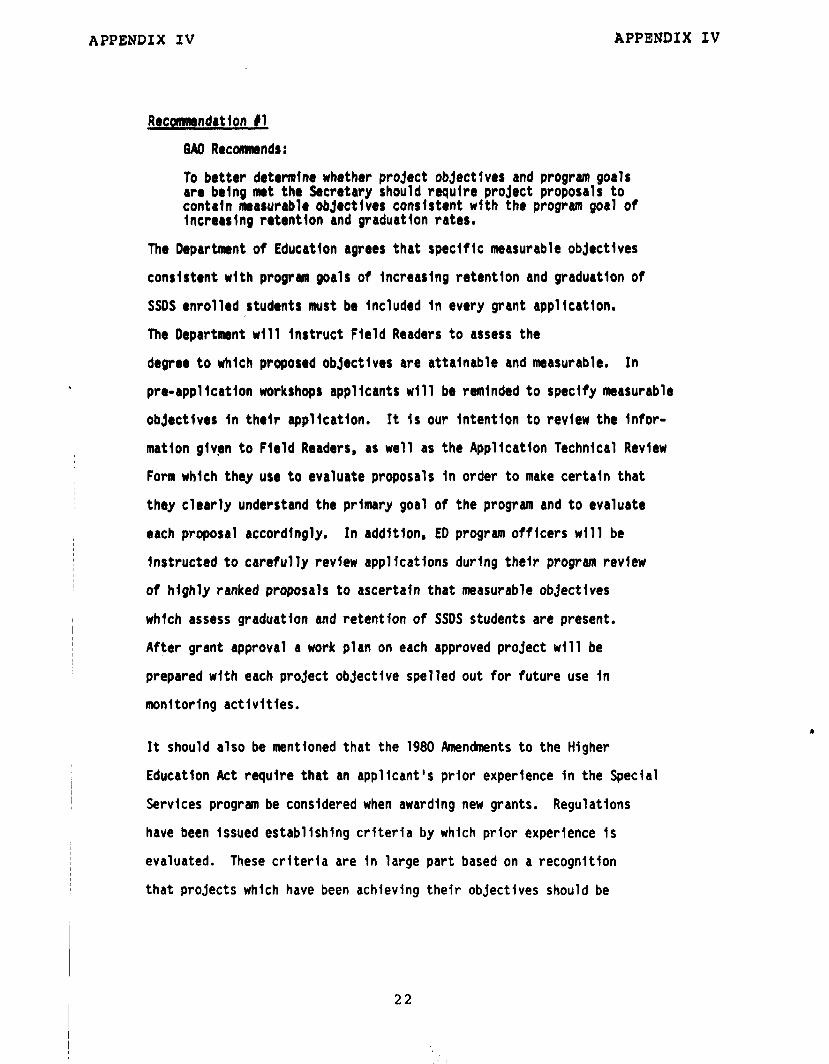
Recomendatlon #I
.
8AO Recommends:
To better determine whether project objectives and program goals are being met the Secretary should require project proposals to contain measurable objectives consistent with the program goal of Increaslng retentlon and graduation rates.
The Departmnt of Education agrees that specific measurable objectives
consistent wlth program goals of increaslng retentlon and graduatlon of
SSDS enrolled students must be Included In every grant application.
The Department wlll Instruct Field Readers to assess the
degree to which proposed objectlves are attainable and measurable. In
pre-appllcatlon workshops applicants will be remlnded to specify masurable
objectlves In thelr appllcatlon. It Is our Intention to review the Infor-
mation glvpn to Field Readers, as well as the Appllcatlon Technlcal Revlew
Form which they use to evaluate proposals in order to make certain that
they clearly understand the prlmary goal of the program and to evaluate
each proposal accordingly. In addltlon, ED program officers ~111 be
Instructed to carefully review applications during their program revlew
of hlghly ranked proposals to ascertaln that measurable objectlves
which assess graduation and retention of SSOS students are present.
After grant approval a work plan on each approved project ~111 be
prepared wlth each project objective spelled out for future use In
monitoring actlvlties.
It should also be mentioned that the 1980 Amendments to the Higher
Education Act requlre that an applicant's prior experience in the Special
Services program be consldered when awarding new grants. Regulations
have been issued establishing criteria by which prior experience Is
evaluated. These criteria are in large part based on a recognition
that projects which have been achieving their objectives should be
22
,
APPENDIX IV APPENDIX IV
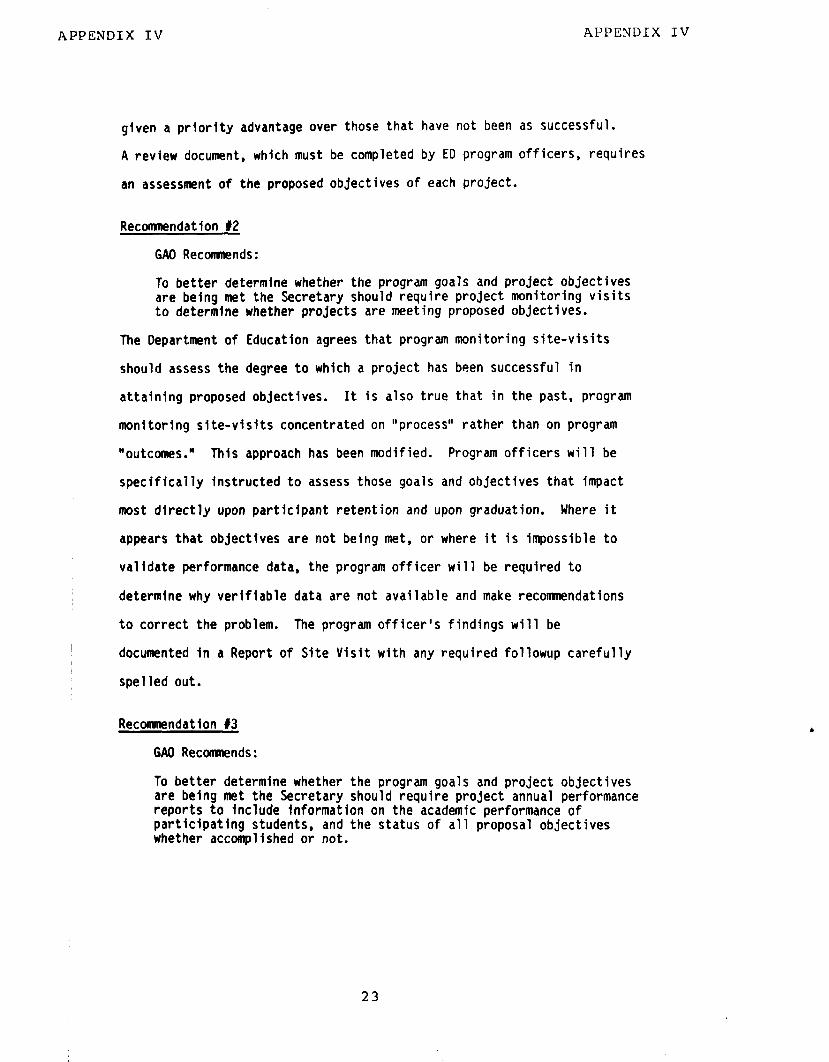
given a priority advantage over those that have not been as successful.
A review document, which must be completed by ED program officers, requires
an assessment of the proposed objectives of each project.
Recommendation 12
GAO Recommends:
To better determine whether the program goals and project objectives are being met the Secretary should require project monitoring visits to determine whether projects are meeting proposed objectives.
The Department of Education agrees that program monitoring site-visits
should assess the degree to which a project has been successful in
attaining proposed objectives. It is also true that in the past, program
monitoring site-visits concentrated on "process" rather than on program
"OUtcomS." This approach has been modified. Program officers will be
specifically instructed to assess those goals and objectives that impact
most directly upon participant retention and upon graduation. Where it
appears that objectives are not being met, or where it is impossible to
validate performance data, the program officer will be required to
determine why verifiable data are not available and make recomnendations
to correct the problem. The program officer's findings will be
documented in a Report of Site Visit with any required followup carefully
spelled out.
Recommendation 13
GAO Reconsnends:
To better determine whether the program goals and project objectives are being met the Secretary should require project annual performance reports to include information on the academic performance of participating students, and the status of all proposal objectives whether accomplished or not.
23

APPENDIX IV APPENDIX IV
A new SSDS Project Perf'ormance Report is now being developed for reporting at
the end of the 1982-83 program year. The new report will require specific
data on the academic performance and progress of project participants.
Thls new reporting instrunrent ~111 serve as both a project monitoring
device and a means for aggregatlng overall student performance, retentfon,
and graduation data for the purpose of assessing program goals.
I (104513)
24


w tQorL oPPouYutuYY WLOYIR