Embed Size (px)
Citation preview
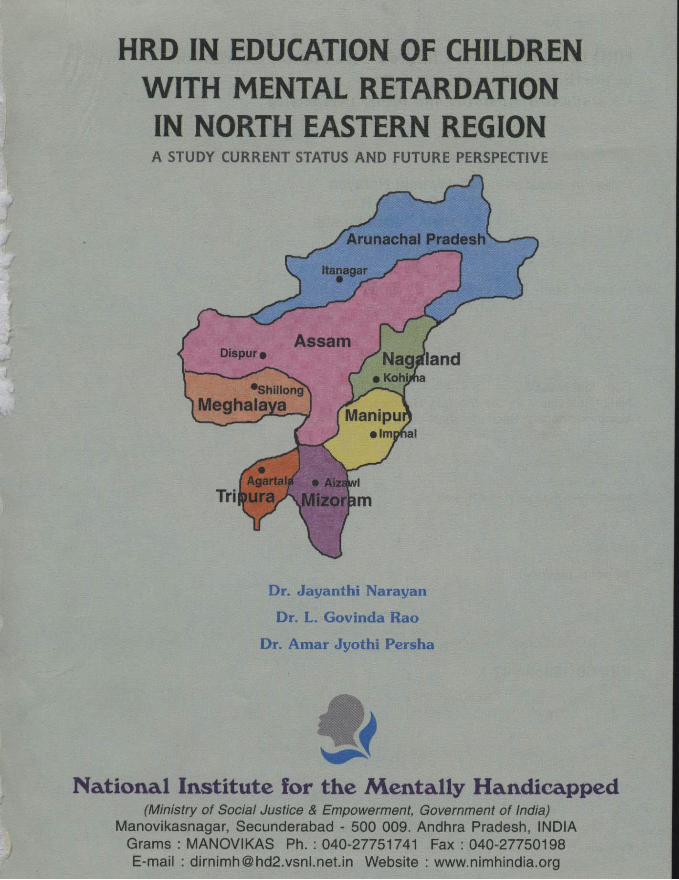
HRD IN EDUCATION OF CHILDRENWITH MENTAL RETARDATIONIN NORTH EASTERN REGIONA STUDY CURRENT STATUS AND FUTURE PERSPECTIVE
Dr. Amar Jyothi Persha
National Institute for the Mentally Handicapped(Ministry of Social Justice & Empowerment, Government of India)
Manovikasnagar, Secunderabad - 500 009. Andhra Pradesh, INDIAGrams : MANOVIKAS Ph. 040-27751741 Fax 040-27750198E-mail : [email protected] Website www.nimhindia.org
Manipu'
Dr. Jayanthi NarayanDr. L. Govinda Rao

HRD in Education of Children with mental retardationin north eastern region- A study cu.4eiit status and future perspective
Project Investigators Dr. Jayanthi NarayanDr. L. Govinda RaoDr. Amar Jyothi Persha
Research Staff: Mrs. G. Kavitha Reddy
Copyright 2003National Institute for the Mentally Handicapped,Manovikasnagar, Secunderabad - 500 009.
Maps given In this book are not for scale.
All tights reserved.
ISBN 81 -86594-37-X
-
Printed at: Sree Rarnana P;ocess Pvt. Ltd., Secunderabad -3. Ph :040-27811750
4

HRD IN EDUCATION OF CHILDRENWITH MENTAL RETARDATIONIN NORTH EASTERN REGION.A STUDY CURRENT STATUS AND FUTURE PERSPECTIVE
Introduction:Historically, persons with mental retardation stayed at home and were looked after for
their food and clothing needs. After independence a mention of 'Education, for all children'
(article 45) and 'Right to education for persons with disabilities (article 41) wasmade in
the Constitution of India. Efforts towards education for children with mentalretardation
was made by parents, resulting in establishment of specialschools. The teachers in such
schools had no special qualification except their enthusiasm and good will andthe teaching
was mostly by 'trial and error method'. In mid 1951 the first special teacher training
programme was initiated in the country and by 1971 the second one was started. A few
more courses started gradually, thetraining period rangingfrom one month to one year.
The curriculum too was varied, as each training organization followed its owncurriculum
and training methods.
In 1985, the National Institute for the Mentally Handicapped (NIMH) introduced a one
year diploma in mental retardation (DMR). As there were a number of special schoolswith untrained teachers, the objective of the course was to clear the backlogand have
trained teachers in all the schools and the course gradually was offered in NIMH Regional
Centers and in a number of centers run by NGOs.
Rehabilitation Council of India (RCI) was constituted as a statutory body by Government
of India in 1992 with the major objective to standardize and regulate training programmesin the area of disability rehabilitation. The RCI also recognizes trained professionals by
registering them as rehabilitation personnel and professionals.The special teacher training
facilities saw a remarkable growth with syllabus standardized by RCI and central
coordination carried out at NIMH for the special educational training programme, earlier
ál
known as Diploma in Mental Retardation (DMR) and currently Diploma in SpecialEducation - Mental Retardation (DSE(MR)). Currently there are over 50 centers conducting
DSE(MR) in the country. In addition a few universities offer B.Ed (Special education -Mental Retardation).
Status in North Eastern Region:
In our country, North Eastern States of Arunachal Pradesh, Assam, Manipur, Meghalaya,Mizoram, Nagaland and Tripura however do not have adequate facilities for disabilityrehabilitation. Special teacher education programme is conducted in one center in Assamsince 1989 The regional center of NIMH at Kolkata had trained some teachers since1986 until the center in Assam was established in 1989. So far, over 200 persons havebeen trained from the North Eastern Region over the past 15 years. Yet the educationalprovisions for persons with mental retardation is far from adequate.
There are less than a dozen special schools to cater to the educational needs of childrenwith mental retardation in the complete northeastern region. Many children with mentalretardation are admitted in schools for children with cerebral palsy. Many of the trainedteachers for students with mental retardation are unemployed. Considering the fact thata large number of teachers are trained which has not resulted in the growth of specialeducational services, it is important to give reasons and take measures to increase andimprove services in this region. Therefore the current study was conductedwith the view
to find out the status of the trained special educators and to find out ways of enhancingeducation of persons with mental retardation in the north eastern states.
The specific objectives include:1. To compile data using a questionnaire, to find out the current status of the trained
special educators in the North Eastern Region.
2. To analyze the data in terms of the status of their employment, attrition and difficultiesobserved by the trained teachers.
3. To make recommendations to enhance human resource development in specialeducation for children with mental retardation for north eastern region as a whole.

This report contains a brief description of northeastern states, state profile, details ofnumber of persons trained in DMR/DSE(MR), their current status, their impressions onthe courseand based on the analysis of the above, recommendations for improving andincreasing educational services for mentally retarded persons in the northeast.
Northeastern Region - A brief description
The northeastern region of India includes Arunachal Pradesh, Assarn, Manipur, Meghalaya,
Mizoram, Nagaland and Tripura. With Myanmar, China, Nepal, Bhutan and Bangladeshforming International borders with these states, our country faces a geographical distancebetween these states and the rest of India. As Himalayan mountain ranges and the greatBrahmaputra form part of this region, the enchanting beauty of the northeastern regionhas created heaven in earth. These physical features however, also are responsible forcertain place - specific problems in the development of the region
Bangladesh Myanmar(Burma)

Area
CapitalDistricts
Languages
PopulationMalesFemales 517,166Growth rate 26.21% [1991-2001jDensity 13 [people/sq. kmjUrban population 20.41%Sex ratio 901/1000 [females/males]Literacy rate : 54.74%
Male 64.07%Female 44.27%
* Hindi and English are the languages taught in the schools* CBSE syllabus is followed throughout the state
ARUNACHAL PRADESH
CHINA(TI BET)
.M VA N MA KIBURMA)
NAGALANI
83,743 sq. kmltanagar15
Monpa, Aka, Miji, Sherdukpen, Nishi, Apatani, Hill Miri, Tagin,Mi, Idu, Diagaru, Khampti, Singpho, Tangsa, Nocte, Wancho1,091,117573,951
a
History and Geography:
Arunachal Pradesh, the erstwhile North-East Frontier Agency (NEFA) shares internationalboundaries with Bhutan, Tibet, China and Myanmar to the west, north-east, north andeast respectively and the state boundaries with Assarn and Nagaland. The terrain consistsof submontane and mountainous ranges, sloping down to the plains of Assam, dividedinto valleys by the rivers Kameng, Subansiri, Siang, Lohit and Tirap.
Modern history of Arunachal Pradesh begins with the inception of British rule in Assamafter the treaty of Yandaboo concluded on 24thFebruary 1826, before 1962 the area waspopularly known as the north east frontier agency (NEFA), and was constitutionally apart of Assam. Because of its strategic importance, it was administered by the ministry ofExternal Affairs until 1965 and subsequently by the ministry of Home Affairs, throughthe governor of Assam. In 1972 it was constituted as a Union Territory and renamedArunachal Pràdesh. On 20th February 1987, it became the 24th state of the Indian union.
Agriculture, Irrigation and Industry:Nearly 80% of the population of Arunachal Pradesh is engaged in agriculture. Thetraditional method of agriculture is jhum, a kind of shifting cultivation. The forests arecleared and crops are raised for one to three years, depending on the fertility of the soil.Thereafter the cultivators move on elsewhere. A determined effort is being made to weanthe people from jhum cultivation. The main crops are rice, maize millet, wheat and mustard.Encouragement is being given to the cultivation of cash crops like potatoes and horticulture
crops like apples, oranges and pineapples.
For conservation and exploration of vast minerals the Arunachal Pradesh MineralDevelopment and Trading Corporation Limited (APMDTCL) was set up in 1991. Namchik- Namphuk coal fields are taken up by APMDTCL.
Training to craftsmen in different trades is given at two industrial training institutes situatedat Roing and Daporijo. A total area of 87,578 hectares is irrigated. As many as 2597villages have been electrified out of 3469 villages in the state. Arunachal Pradesh has330 km of national highway.
Festivals:
Some of the important festivals are: Mopin and Solung of the Adis, Lossar of the Monpasand the Sherdukpens, Boon-Boot of the Hill Miris, Dree of the Apatanis, Si-Bonyi of theTagins, Reh of the Idu-Mishmis, Nyokum of the Nishirigs, Chaloloku of the Noctes, etc..Animal sacrifice is a common ritual in most festivals.
University:
Arunachal Pradesh University, ltanagar.
BANfILADE8H
BHUTAN
ASSAM
MANIPUR
MYANMAR(BURMA)
Area
CapitalPopulationGrowth rate
LanguageDistricts
DensityUrban populationSex ratio
LiteracyMaleFemale
Number of universities
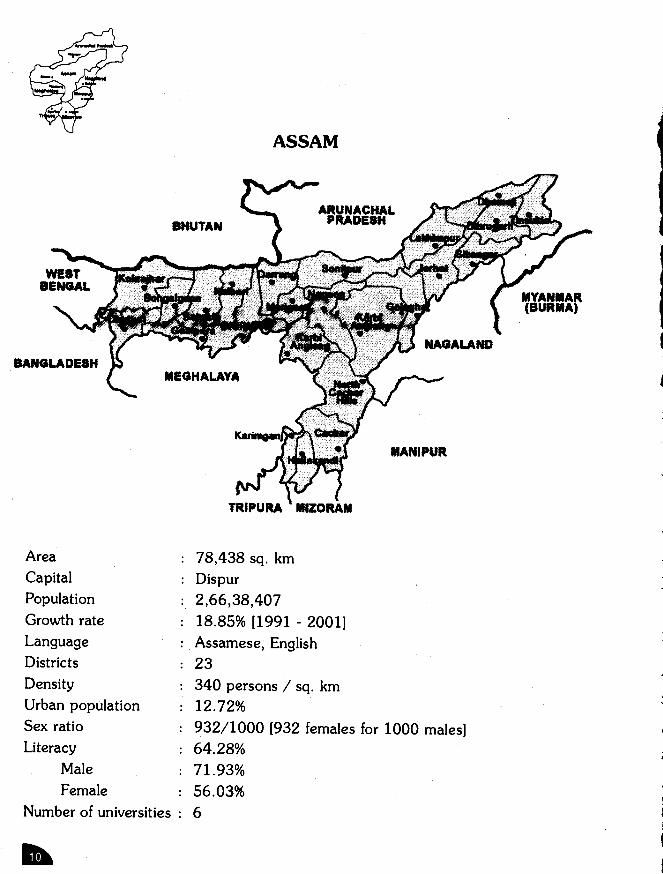
78,438 sq. kmDispur2,66,38,40718.85% [1991 - 2001]Assamese, English23340 persons / sq. km12.72%932/1000 1932 females for 1000 males]64.28%71.93%56.03%6
Training to craftsmen in different trades is given at two industrial training institutes situated
at Roing and Daporijo. A total area of 87,578 hectares is irrigated. As many as 2597
villages have been electrified out of 3469 villages in the state. Arunachal Pradesh has
330 km of national highway.
Festivals:
Some of the important festivals are: Mopin and Solung of the Adis, Lossar of the Monpas
and the Sherdukpens, Boon-Boot of the Hill Miris, Dree of the Apatanis, Si-Bonyi of the
Tagins, Reh of the Idu-Mishmis, Nyokum of the Nishings, Chaloloku of the Noctes, etc..
Animal sacrifice is a common ritual in most festivals.
University:
Arunachal Pradesh University, Itanagar.

History and Geography:The word 'Assam' as interpreted by some scholars is derived from the Sanskrit wordasoma meaning peerless or unparalleled. The races like Austric, Mongolian, Dravidian
and Aryan that came to this land long-long ago have contributed to its composite culture.Thus Assam has a rich legacy of culture and civilization.
Assam is the sentinel of northeast India and gateway to the northeastern states. Thestate is close to India's international borders with Bangladesh and Bhutan. Bhutan andArunachal Pradesh surround Assam on the north, Manipur, Nagaland and ArunachalPradesh on the east and Meghalaya, Tripura and Mizoram on the south.
Agriculture, Irrigation and Industry:
Assam is an agricultural state. Agriculture occupies an important place in the economy ofthe state. The principal food crop is rice. The cash crops are jute, tea, cotton, oilseeds,sugarcane, potato, etc. Noteworthy horticulture items are orange, banana, pineapple,
arecanut, coconut, guava, mango, jackfruit and citrus fruits.The state has an estimated 39.44 lakh hectares gross cropped area of which net areasown is about 27.01 lakh hectares. Assam is known for her rich forestwealth. The total
area under forests was 20.24 lakh hectares at the end of March 1999.
The state has 5 national parks and 11 wildlife sanctuaries. The Kaziranga National Parkand the Manas Tiger Project (National Park) are internationally famous. Common animalsinclude elephant, tiger, leopard, rhinoceros and bear.
Of agriculture based industries, tea occupies an important place. Assam produced 414million kg finished tea in 1999. The exploitation of minerals in the state comprisesmainly of petroleum (crude), natural gas(utilized), coal and limestone. Cottage industriesinclude handloom, sericulture, cane and bamboo articles, carpentry, brass and bell-metalcrafts. Assam produces varieties of silk, endi, muga, tassar, etc. Muga silk is producedonly in Assam in the world.
1
The total length of roads in the state is 33,064 km which includes 2,038km of national
highways.
The length of railway tract in Assam is 2,391.76km comprising 1,061.29km under broad-guage and 1,330.47km under meter-guage lines. The extension of broad-guage line fromGuwahati to Dibrugarh has been completed and the Naranarayana atJogighopapancharatna was open in 1998.
The regular civil air services are operating from Lokopriya Gopinath Bordoloi Airport(Guwahati), Salonibari (Tezpur), Mohanbari (Dibrugarh), Kumbhirgram (Silchar), Rawriah(Jorhat) and Silonibari (North Lakhimpur).
Festivals:
Assam has an exclusive range of colourful festivals. Bihu is the chief festival celebratedon 3 occasions. Rongali Bihu or Bohag Bihu marks the advent of the cropping seasonand it also ushers in the Assamese New Year. Bhogali Bihu or Magh Bihu is the harvestfestival and Kati Bihu or Kongali Bihu coming in autumn is a simple affair.
Transport:
Area
CapitalLanguageDistricts
PopulationMalesFemales
Growth rate
DensityUrban populationSex ratioLiteracy rate
MalesFemales
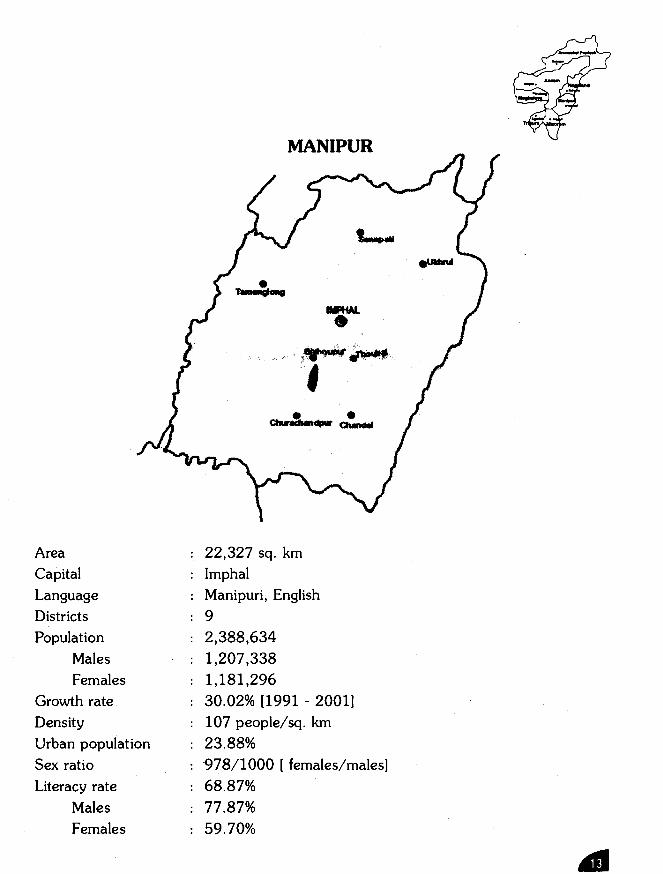
22,327 sq. kmImphalManipuri, English
:92,388,6341,207,3381,181,29630.02% [1991 - 2001]107 people/sq. km23.88%
978/1000 [females/males]68.87%77.87%59.70%
1
MANIPUR
History and Geography:Manipur came under the British rule in 1891 and later it was merged in the Indian union
on 15th October 1959. In 1963 a legislative assembly of 30 elected and 2 nominatedmembers was established under the union territories act of 1962. The status of theadministrator was raised from chief commissioner to the status of the Lt Governor witheffect from 19tF, December 1969. Manipur attained full-fledged statehood on 21st January1972. A legislative assembly consisting of 60 elected members was established. Manipuriwas recognized as a national language in 1992.
Geographically the state is divided into two, the hills comprising 5 districts and the plainswith 4 districts, It is bounded by Myanmar on the east, Nagaland on the north, Assamand Mizoram on the west and Myanmar and Mizoram on the south.
Agriculture, Irrigation and Industry:Agriculture is the single largest source of livelihood of the majority of the rural massesand is also the main stay of the state's economy. The main crop of the state is paddy.Maize is cultivated in the foothills. The area available for cultivation is about 2.1 lakhhectares and the area under paddy is 1.86 lakh hectares.
The total area covered under forests is 17,384 sq. km of which 1,467sq. km fall underreserved forests while 4,171 sq. km is protected forests and 11,746 sq. km are unclassifiedforests. The state is the only home of the Brow-Antlered deer, locally known as Sangaisurviving in its natural habitat, the Keibul Lamjao, the only floating national park in theworld.
The installed capacity of electricity was 11,845 KW and 2,001 villages had been electrifiedby March 2001. Power supply position in the state showed a marked improvement withthe availability of share of power from the central sector generating stations.
Manipur is making rapid strides towards industrialization with 8,991 registered industrialunits by March 2001, providing employment to 47,186 people. Special thrust has been
directed towards revitalization of various industrial sectors and development ofinfrastructure.
Transport :
The state has 7,667 km of roads. The length of roads consists of national highways 957km, state highways 839 km, district roads 1,946 km and village roads 3,925 km. Thestate is included in the railway map of India with the opening of a railhead at Jiribam inMay 1990. Imphal is the only airport in Manipur which is linked with other stations inthe region by air. It connects Imphal to Silchar, Aizwal, Guwahati, Jorhat, Kolkata andDelhi.
Festivals:
Important festivals of the state are Lai Haraoba, Rasa Leela, Chieraoba, Ningol Chakkouba,
Rath-Jatra, Idul-Fitre, Gaon Ngai, Diwali, Kut, Chistmas, etc.
Universities:
Central Agricultural University, ImphalManipur University, Imphal
1

Area
CapitalLanguageDistricts
PopulationMalesFemales
Growth rate
LiteracyMalesFemales
DensityUrban populationSex Ratio
22,429 sq. kmShillongEnglish, Khasi, Garo7
2,306,0691,167,8401,138,22929.94% [91-01]63.31 %66.14 %60.41103 people /sq. km19.63 %
975/1000 [females/males]
MEGHALAYA
History and Geography:Meghalaya was created as an autonomous state within the state of Assam on 2dApril1970. The full-fledged state of Meghalaya came into existence on 2' January 1972. It isbound on the north and east by Assam and on the south and west by Bangladesh.Meghalaya literally meaning the abode of clouds is essentially a hilly state. The Khasis,the Jaintias and the Garos tribal communities predominantly inhabit it.
Agriculture, Irrigation and Industry:Meghalaya is basically an agricultural state in which 80% of its population depends primarilyon agriculture for their livelihood. Besides the major food crops of rice and maize,Meghalaya is renowned for its oranges (Khasi Mandarian), pineapple, banana, jackfruits,temperate fruits like plum, pears and peaches, etc. Special emphasis is presently laid onnon-traditional crops like oilseeds (groundnut, soyabean & sunflower), cashewnut, tea &coffee, mushroom, medicinal plants, orchids and commercial flowers.
The state is not so far industrially developed. However, new industrial units are fastcoming up. There is a public sector cement factory at Cheerapunji. Meghalaya'shydroelectric and thermal power potential has been estimated at about 2500 and 1000
megawatts respectively.
Festivals:A five-day long religious festival of the Khasis Ka Pomblang Nongkrem popularly knownas Nongkrem dance is held annually at village Smit, 11 km from Shillong. Shad Sukmynsiemanother important festival of the Khasis is held at Shillong during the second week ofApril. Behdiengkhlam, the most important and colorful festival of the Jaintias is celebratedannually at Jowai in Jaintia Hills in July. Wangala festival is observed for a week tohonour Saljong (sungod) of the Garos during October-November.
Transport:6 national highways pass through Meghalaya. The state has 7,117km of both surfacedand unsurfaced roads under P.W.D. The only airport in the state at Umroi, 35 km fromShillong is yet to function.

MIZORAM
CapitalAreaDistricts
LanguagesPopulation
MaleFemales
Growth
Urban PopulationLiteracy
MaleFemale
Density
Aizawl
21,O8lSq. km.:8Mizo, English
8,91,058459,783431,27529.18%49.50%88.49%90.6986.1342 people/sq. km
AIZAWL
LLJNGW
History and Geography:
Mizoram is a mountainous region, which became the 23 state of the Indian Union inFebruary 1987. It was one of the districts of Assam till 1972 when it became a UnionTerritory.
After being annexed by the British in 1891, for the first few years, Lushai Hills in thenorth remained under Assam while the southern half remained under Bengal. Both theseparts were amalgamated in 1898 into one district called Lushai Hills district under thechief commissioner of Assam. With the implementation of the North-Eastern RegistrationAct in1972, Mizoram became a Union Territory and as a sequel to the signing of thehistoric memorandum of settlement between the GOl and the Mizo National Front in1986, it was granted statehood on 2Øth February 1987.
Mizoram is bounded by the district of Cachar [Assam] and the state of Manipur on thenorth, Myanmar in the east and south and Bangladesh and Tripura in the West. It occupiesan area of great strategic importance in the north- eastern corner in India. Mizoram hasgreat natural beauty and an endless variety of landscape. It is rich in fauna and flora.
The Mizos came under the influence of the British Missionaries in the 19thcentury. Nowmost of the Mizos are Christians. Mizo language has no script of its own. The missionariesintroduced the Roman Script for Mizo language and formal education.
The mizos are divided into various tribes - The Sushais, Pawis, Paithes, Raltes, Tang,Hmars, Kukis, Maras, Lakhers, etc.. The majority of the tribes are Christians and speakMizo and English, but some tribes on the border like the Chakmas are Buddhist andspeak Chakma language. Mizoram attained 95% literacy in 1999.
Agriculture, Irrigation and Industry:
About 60% of the people of Mizoram are engaged in agricultural pursuits. The mainpattern of agriculture followed is jhum or shifting cultivation. The main horticulture crops
are oranges, lemon, kagzi lime, passion fruits, hatkora, janir, pineapple and papaya.
1

Other crops are sugarcane, tapioca and cotton. Currently there is extensive cultivation of
ginger and fruit crops.
The entire ,Mizoram is a notified backward area and is categorized under "No IndustryDistrict". For the development of industries in the state, government formed IndustrialPolicy in 1989. In the policy resolution priority industries identified were: agro and forestbased industries followed by handloom and handicrafts, electronics and consumerindustries. Development of tea industry/gardens and raising of Tooklai approved varietieshas been taken up by the government around Biate areas. Tailoring, knitting and embroiderycenters have been setup. Sericulture is developed in 4 kinds of silk - mulberry, era, tasar,muga. Other small scale and cottage industries like bakery, printing press, saw mills,brick making, soap making etc., is practiced widely.
The most important and useful rivers are the T)awng (or the Dhaleswari), the Sonai andthe Tuiwal. Other rivers are the Kolodine and the Karnaphuli.
Transport:Total road length in the state is 4,001.53 km. Rail link in the state has been establisheda,t Bairabi. Aizwal is connected by air.
Festivals:Mizos are basically agriculturists. All their activities center around Jhum, cultivation andtheir festivals are linked with such agricultural operations. Kut is the Mizo word for festivals.Mizos have three major festivals called Chupchar kut, Mim kut and Pawl kut.
Universities:
Nehru - Northeastern Hill UniversityMizoram University

Area
CapitalLanguagesDistricts
PopulationMalesFemales
Growth rate
DensityUrban populationSex ratioLiteracy rate
MalesFemales
16,579 sq. kmKohima
English, Ao, Konyak, Angami, Seema, Lotha:8
1,988,6361,041,686946,95064.41 % [1991-20011
120 people [per sq. kmj17.74 %909 females/ 1000 males67.11 %71.77%61.92%
History and Geography:In January 1961, the Government of India conferred the statehood on Nagaland and itwas officially inaugurated on Pt December 1963. By 1980, the Village Development
NAGALAND
Board [VDB], were given administrative and local mandate. These VDBs are the nagaversion of panchayat raj system.The state has a unicameral legislature - the legislativeassembly.
The state of Nagaland is a nar;ow strip of mountainous territory between the BhramaputraValley of Assam and Myanmar. On the east it shares international boundary with Burma.On all other sides it is bounded by other states in North East Region. The population ofNagaland is entirely tribal. There are many tribes and sub-tribes among the nagas withtheir own languages and cultural features.
Agriculture, Irrigation and Industry:Agriculture involves 73% of the population. Rice is the most important food crop grown.Now the government is encouraging terraced cultivation, farm forestry and orchardplantation. In Nagaland the mineral wealth is immense.
The eastern belt has coal, lime stone, iron, nickel, cobalt, chromium and marble. Minorirrigation works are mostly meant to divert small hill streamlets to irrigate valleys used forrice cultivation. Number of electrified villages stand at 1196. Nagaland has achieved centpercent electrification of rural areas.
Today the state has about 30 industrial units and over 300 small-scale industries.
Transport:Total length of roads in Nagaland is 9860 kms. Dimapur is the only place where rail andair services are available. There is an Indian airlines service connecting Dimapur withGüwahati and Kolkata.
Festivals:Some of the important festivals are Sekrenji, Maotsu, Tuluni and Tokhu Emong. Alltribes celebrate their district seasonal festivals with a pageantry of colour and a feast ofmusic.
Universities:Nagaland University at Kohima, Nehru -Northeastern Hill University campus in Kohima.
The developmental activities in this region is a priority of Government of India. TheNorth East Council (NEC) was setup in 1971 to ensure faster development in this region.In the past three decades, the NEC has invested Rs.6000 crores in the region to upliftsocioeconomic conditions and has achieved substantial results (India Today, December16th 2002). Transport and communication systems, power projects, health care andeducational systems are being focused. Hospital and educational institutions are on theincrease. Industry and tourism have gained importance through encouraging enhancementof indigenous practices and production (such as processing of fruits, bamboo shoot,medicinal plants and herbs).
However, the efforts towards disability rehabilitation has not progressed adequately yet.The number of special educational facilities covering all disabilities in the northeast isabout 60 only.
Every state has a state commissioner for disability, as additional charge except in Nagalandwhere there is a separate commissioner for disabilities.
The varied languages and dialects, culture, religion, socio political conditions and thevarious practices and lifestyle hamper the developmental activities in general. Nevertheless,efforts continue relentlessly to ensure equal opportunities, protection of rights and fullparticipation to all including the persons with disabilities in this region.
Mentioned below, are brief descriptions of each of the northeastern states of Arunachal
Pradesh, Assam, Manipur, Meghalaya, Mizoram, Nagaland and Tripura which, asbackground information, will help in understanding the present study in the rightperspective.
History and Geography:
Tripura was a state of great history having been ruled by the Maharajas for 1300 yearsbefore its accession to the Indian union on 15th October 1949. With the reorganization ofstates on Pt September 1956, Tripura became a Union Territory on Pt November 1957and elevated to the status of a full-fledged state on 2Pt January 1972.
Tripura is strategically situa,ted between the river valleys of Myanmar and Bangladesh.Encircled almost on three sides by Bangladesh, it is linked with Assam and Mizoram in
northeast.
Agriculture, Irrigation and Industry:Of the total geographical area of 10,49,169 hectares, net area sown is only 28,100 andforest area is 6,06,168 hectares. Area irrigated is 64,665 hectares. Handloom weavingis the single largest industry. It is essentially a tribal household industry. The sericulture isdeveloping fast. Tripura is abundant in natural gas and a number of gas based industrieshave sprung up. Foundation has been laid for the Rs. 126 crore Methonol project in thestate owned by Tripura Petro-Chemicals Limited. There are 809 small scale industrialunits in Tripura.
Transport:Total length of road in Tripura is 12,547 kms of which major district roads are 454 kmsand other district roads are 1,463 kms. Total length of railway lines within state is 44kms. Extension of railway line to Agartala has been taken up. The main airport at Agartalais connected with Kolkata, Guwahati, and Delhi. There are airports at Kailashahar and
Kamalpur though they are not functioning at present.
Festivals:
Makarsankranthi at Tirthamukh and Unakoti, 1-loli, Ashokashtami at Unakoti,Brahmnakunda at Mohanpur, Rash, Bengali New Year Festival, Garia, Biju, Christmas at
Jumpui hills, Diwali, Buddha Purnima, etc., are celebrated.
Universities:
Tripura University, Agartala
The background information on each of the states reveal that despite th sociocultural
religious linguistic differences, the literacy rate is relatively high and the states are marching
towards progress in the industrial and agricultural aspects. Due tothe geographical and
physical features reaching out the people throughcommunication network is poor which
is one reason for slow progress perhaps all the more so in the area of disability
rehabilitation.
Status of special educators in mental retardation:
As mentioned earlier a study was undertaken to study the statusof trained special teachers
in mental retardation. This was found necessary as the educational services for children
with mental retardation is not on the increase despite the increase in HRD in special
education during the past fifteen years. Described below isthe methodology adopted to
conduct the study and its results.
MethodologyThe study was conducted covering trained DSE(MR)/DMR persons from all the seven
states of North Eastern Region. Survey method was adopted for data collection.
SampleAll the candidates from North Eastern Region who were enrolled for DMR/DSE(MR)
since the starting of the course were included for the study.
Tools:A structured questionnaire was developed to elicit information from the subjects with
regard to the special education training programme [ Appendix 1]. The questionnaire has
two sections - one addressing the subjects working as special educators currently and the
other section for those who are not working as special educators.
The questionnaire was initially given to 25 DSE(MR) trained teachers in Hyderabad /Secunderabad to establish reliability and validity. After receiving the responses the itemswere analyzed, repetitions were deleted, ambiguous queries were modified for better clarityand missing items added. Face validity was also established by giving the questionnaire toprofessionals in the field and receiving their opinion. Reliability was established usingRational Equivalence Method and was found to be highly reliable [r11 = 0.901.
Procedure:
The questionnaire was sent to all the subjects by collecting their names and addressesfrom the central register of NIMH. First reminder was sent after 2 months and secondand third were sent with a gap of one month between each reminder.
The responses thus received were analyzed and the results are projected in the followingpages.
Results and discussion:
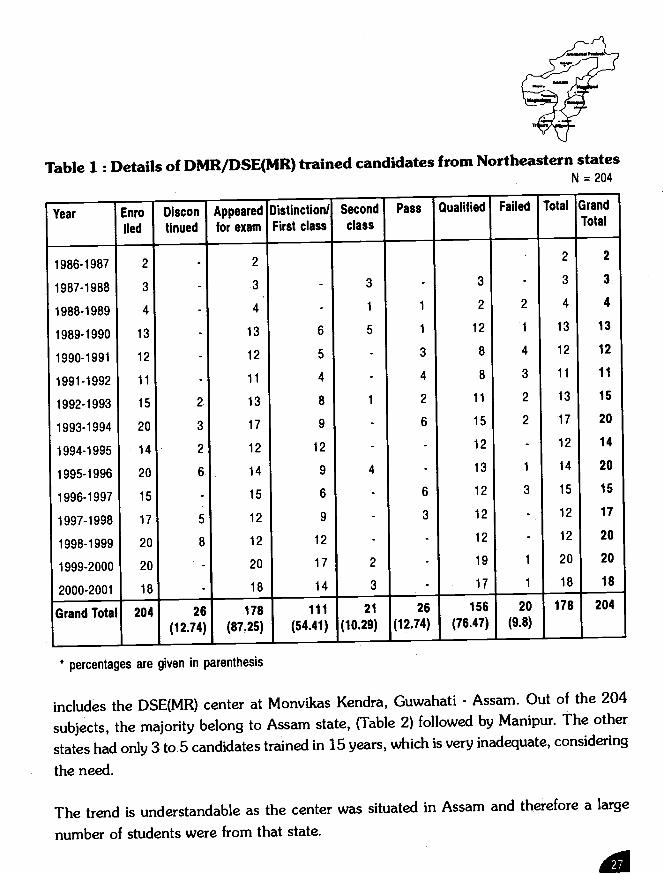
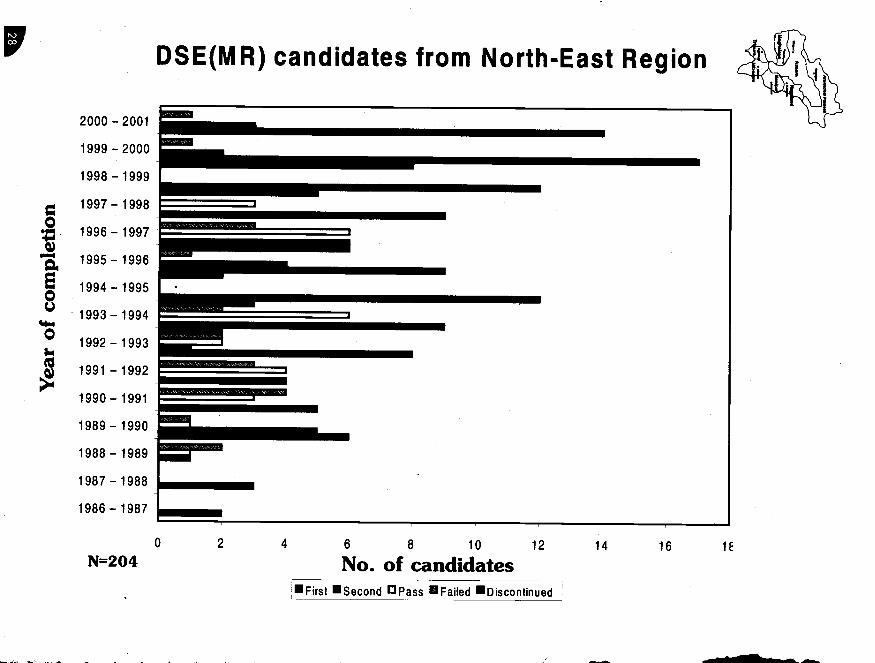
A total of 204 candidates had enrolled in DMR/DSE(MR) since 1985 to 2001 (Table 1).The number of candidates per year ranges from 11 to 20 with an average of 14. A largenumber of students (54.4%) have passed with distinction and first class (Details of yearwise enrollment in each state is given in Appendix)
Out of 204 candidates 178 appeared for the exam (87%) and 156 qualified (76%). Averagenumber of students qualifying each year is about 10.4. The enrollment in first 3 years(1986 - 1989) was in NIMH - Regional Center at Kolkata while the rest of the years theenrollment
* percentages are given in parenthesis
includes the DSE(MR) center at Monvikas Kendra, Guwahati - Assam. Out of the 204
subjects, the majority belong to Assam state, (Table 2)followed by Manipur. The other
states had only 3 to 5 candidates trained in 15 years, which is very inadequate,considering
the need.
The trend is understandable as the center was situated in Assam and therefore a large
number of students were from that state.
il
Year Enrolied
Table 1 : Details of DMR/DSE(MR) trained candidates fromNortheastern statesN = 204
Discon Appeared Distinction! Qualified Grand
tinued for exam First class TotalSecondclass
Pass Failed Total
1986-1987
1987-1988
1988-1989
1989-1990
1990-1991
1991-1992
1992-1993
1993-1994
1994-1995
1995-1996
1996-1997
1997-1998
1998-1999
1999-2000
2000-2001
2
3
4
13
12
11
13
17
12
14
15
12
12
20
18
12
11
15
20
14
20
15
17
20
20
18
1
1
3
4
2
6
6
3
2
3
2
6
5
8
3
1
5
4
2
3
6
5
4
8
9
12
9
6
9
12
17
14
3
2
12
8
8
11
15
12
13
12
12
12
19
17
2
3
4
13
12
11
13
17
12
14
15
12
12
20
18
2
1
4
3
2
2
1
3
1
1
2
3
4
13
12
11
15
20
14
20
15
17
20
20
18
Grand Total 204 26
(12.74)
178
(87.25)
111
(54.41)
21
(10.29)
26(12.74)
156
(76.47)
20
(9.8)
178 204
2000 — 2001
1999—2000
1998—1999
1997—1998
1996 — 1997
1995—1996
1994 — 1995
1993 — 1994
1992 — 1993
1991 — 1992
1990—1991
1989 — 1990
1988—1989
1987—1988
1986—1987
N=204
!First •Second OPass 0FaiIed •Discontinued
DSE(MR) candidates from North-East Region
0.E0U
0Ills
-0 2 4 6 8 10
No. of candidates12 14 16 1E
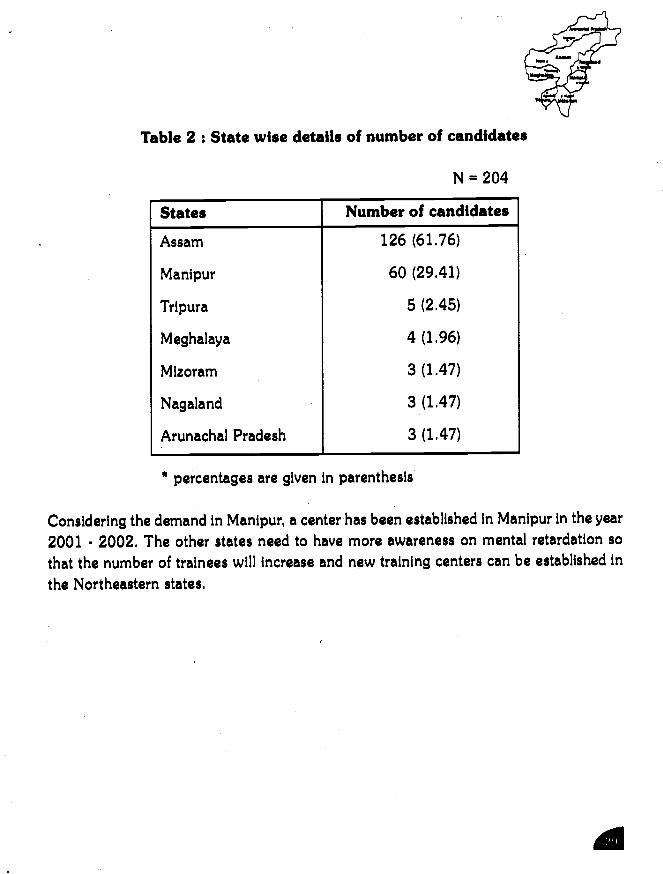
Table 2 : State wise details of number of candidates
* percentages are given in parenthesis
N = 204
Considering the demand in Manipur, a center has been established in Manipur in the year2001 - 2002. The other states need to have more awareness on mental retardation sothat the number of trainees will increase and new training centers can be established inthe Northeastern states,
States Number of candidates
Assam 126 (61.76)
Manipur 60 (29.41)
Tripura 5 (2.45)
Meghalaya 4 (1.96)
Mizoram 3 (1.47)
Nagaland 3 (1.47)
Arunachal Pradesh 3 (1.47)
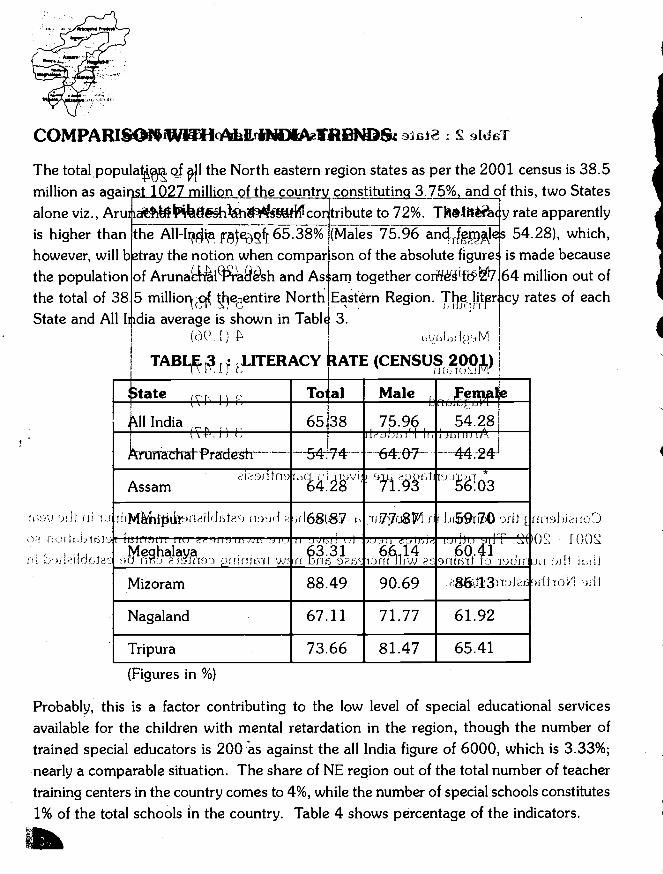
thi1: tdTThe total populaiof l the North eastern region states as per the 2001 census is 38.5million as agail st1ZZinilliQtuf the country const 3.759andof this, two Statesalone viz., Aru ëh1t11coi tribute to 72%._T1t4y rate apparentlyis higher than the AIl-li4i tefr 65.38% (Males 75.96 an41frs 54.28), which,however, will b tray the notion when compar son of the absolute figure is made becausethe population of Arunal9ash and As arr together coth tt 7 64 million out ofthe total of 38 5 milliort,entire North Eastern Region. cy rates of eachState and All I dia average is shown in TabI 3.
(ç)() [ )
TABL LITERACY ATE (CENSUS 2OO)
Itate (f J) EL.. Male
All India (\f�J) 65 38— —5474
75.96 54.28
iurrachPradeh)Lil
64:O7- 4424Assam
1i1) '/4 tJ )J1d3I 168.87 7i7u8'l ii JS9i7O .J
I ) II) I
MeqhalavaJ firi 119) 1fl11RU W.I
63.31ii D11t5 91
F) J)16.6 14i)fU iltw
, fh IT .60.41)1(ttifI ft) 1)(JLi
Mizoram 88.49 90.69 86i3niJNagaland 67.11 71.77 61.92
Tripura 73.66 81.47 65.41
fl I (U
tI)
I
(U19IJcU R:D(\(I r \'- 1 cJ)
)diiL.iIi)IIJIOVI di
(Figures in %)
Probably, this is a factor contributing to the low level of special educational servicesavailable for the children with mental retardation in the region, though the number oftrained special educators is 200 as against the all India figure of 6000, which is 3.33%;nearly a comparable situation. The share of NE region out of the total number of teachertraining centers in the country comes to 4%, while the number of special schools constitutes1% of the total schools in the country. Table 4 shows percentage of the indicators.

TABLE 4 : Details of special education facilities - A comparison
Si. IndicatorsNo.
All India N.E.Region Percentage(%)
1. Population
1027 Om
38.5 m 3.75
27 6 m * 2 70 **
71.80
2. No. of trained Spi. Edrs. 6000 200 3.33
3. No. of Special Schools 1200 12 1.00
4. No. of DSE (MR) Training Centres 50 2 4.00
rn-millions*
Population of Arunachal Pradesh and Assam**
Percentage of All India population
Percentage of N.E.Region
The data shows with regard to employed special educators that in the North Eastern
Region about 28% is employed. After analyzing the information on employmentof trained
teachers in special schools in the country based on the information provided in the
Directory of Institutions for Persons with Mental Retardation (2002) an estimate of 70%
of the trained teachers is found to be employed. The high percentage of attrition in the
northeastern region causes concern and requires to be studied thoroughly so that the
trained human resources are optimally utilized and services reached the target population.
The ratio of availability of special educator in the North Eastern States is 1 per 0.19million population as against 0.17 million at all India level. This also appears to be
having an even footing. However, the ratio of spread of special school in the NE region
is one special school per 3.2 million population (i.e., 12 special schools in NE as against
1200 special schools in the country), despite the fact that there is comparable pool of
special educators and the position with regard to the teacher trainingcenters is fairly
better. The ratios on various factors are shown in Table-5. 1
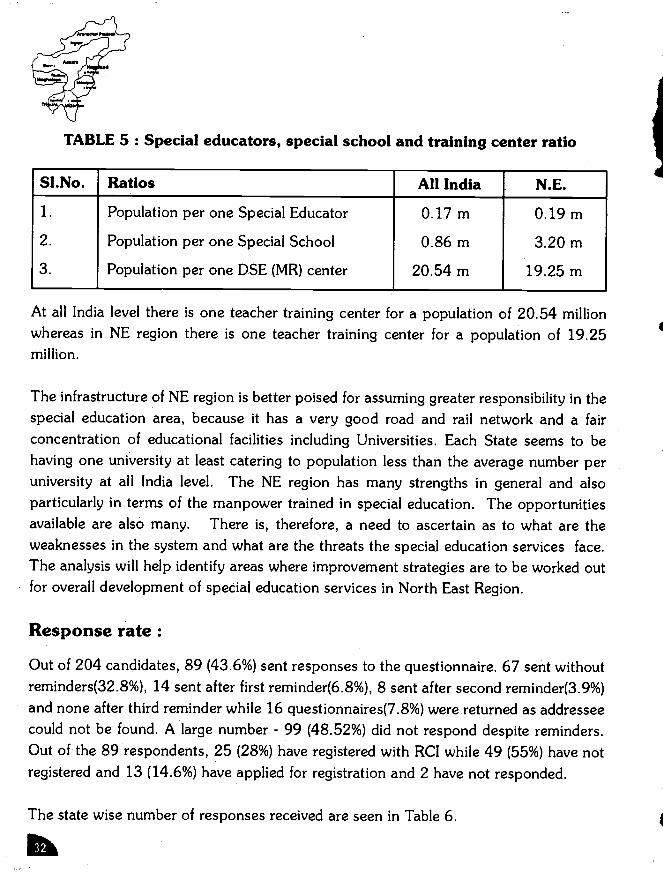
TABLE 5 : Special educators, special school and training center ratio
Sl.No. Ratios All India N.E.
1. Population per one Special Educator 0.17 m 0.19 m
2. Population per one Special School 0.86 m 3.20 m
3. Population per one DSE (MR) center 20.54 m 19.25 m
At all India level there is one teacher training center for a population of 20.54 millionwhereas in NE region there is one teacher training center for a population of 19.25million.
The infrastructure of NE region is better poised for assuming greater responsibility in thespecial education area, because it has a very good road and rail network and a fairconcentration of educational facilities including Universities. Each State seems to behaving one university at least catering to population less than the average number peruniversity at all India level. The NE region has many strengths in general and alsoparticularly in terms of the manpower trained in special education. The opportunitiesavailable are also many. There is, therefore, a need to ascertain as to what are theweaknesses in the system and what are the threats the special education services face.The analysis will help identify areas where improvement strategies are to be worked outfor overall development of special education services in North East Region.
Response rate:
Out of 204 candidates, 89 (43.6%) sent responses to the questionnaire. 67 sent withoutreminders(32.8%), 14 sent after first reminder(6.8%), 8 sent after second reminder(3.9%)and none after third reminder while 16 questionnaires(7.8%) were returned as addresseecould not be found. A large number - 99 (48.52%) did not respond despite reminders.Out of the 89 respondents, 25 (28%) have registered with RCI while 49 (55%) have notregistered and 13 (14.6%) have applied for registration and 2 have not responded.
The state wise number of responses received are seen in Table 6.

Table 6 : State wise number of responses received from Northeastern statesN = 89
* percentages are given in parenthesis out of 89
As seen in the table, the number of responses are proportionate to the candidates enrolledand none have responded from Meghalaya.
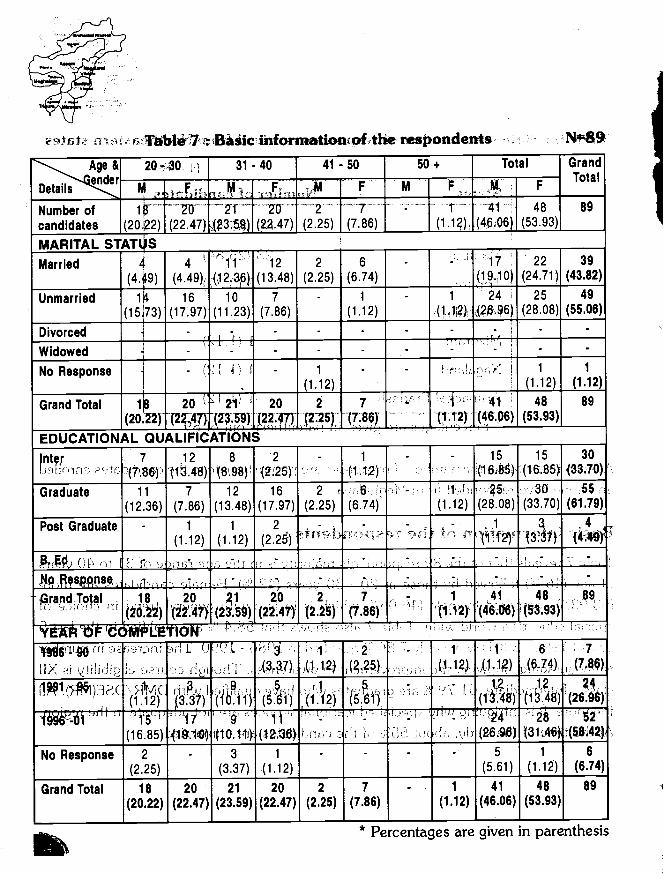
Basic information of the respondents:Table 7 reveals that of the 89 respondents majority is in the age range of 31 to 40 yearsof age (46 %) followed by those in 20 - 30 years (42 %). Female candidates are more(53.93%) compared to male (46.06%) which is in line with general trend in choice of
special education world wide. Table 7 also shows that 58.4 % are qualified in the last 5
years (1996 - 2001) while only 7.86 % qualified in 1986 - 1990. The increase in number
is encouraging, showing the improvement in awareness. Though course eligibility isXII
class / Intermediate, 61.79 % are graduates who have qualified with DMR/DSE(MR).All
the more, it is intriguing why special educational services are not adequate in the region.At the time of the study, about 55% of the candidates are unmarried.
States Number of candidates
Assam 60 (67.42)
Manipur 23 (25.84)
Tripura 3 (3.37)
Meghalaya
Mizoram 1 (1.12)
Nagaland 1 (1.12)
Arunachal Pradesh 1 (1.12)
iit n r blè7:Bàsic iñformationofthe respondents N*89
Age & 20 30 H
Detai'!' MNumber of 1 k t2tFcandidates (2O.22)I(22.47)MARITAL STATI$Married 4 4
31 - 40 41 - 50 50 + Total GrandTotal
89
39
(43.82)
49
(55.06)
•
1
(1.12)89
30
(33.70)
55.(61.79)
4
(4A9)
.•
.89
' 2T"t' Z0"''2g3:59)(2.47) (2.25)
1'1' ' 12 2
F
'''7(7.86)
6
M
-
(1.12).
,
41
(4.O6
17
F
48
(53.93)
22
Unmarried(449)1
(449)16
(:i23610
(13.48)7
(2.25)-
(6.74)
1 - 1
(19.iO)24
(24.71)25
(1573) (17.97) (11.23) (7.86) (1.12) .1.t2), 28.96) (28.08)
Divorced
WidowedI[I
J
-
-r'
- - - - -P.-,,.
- -
NoResponse -
,
- 1
(1.12)
- - n1 1
(1.12)
GrandTotal 1 20 (i2(20 22 (2,4T (2359J
EDUCATIONAL QUALIFICATION
20
(22 47)S
2
(2'25')
7
(786).
"''
'1(112)
.
41(46O)
48
(53 93)
nter 7(6)
121.4'8)
8(898)'
2(2.12S)'
- 1
(1.12)
- -'' 15(i6&5)
15
(16.85
Graduate 11
(12.36)
7
(7.86)
12
(13.48)
16
(17.97)
2
(2.25)
6•(6.74)
1
(1.12) (28.08)
3Q
(33,70)
Post Graduate - 1
(1.12)
1
(1.12)
2
(2.25)
- - - - ' , 1S31)
Of' 't ' fh . . ' ,: 'lgesppse, r1''i. ' :'{(" "
—
, . .: ..—' (YGrandToaI ." 18
ö2)M*E
20
t1ON
21
(23.9)20
(22.4fl2,
(2.25).
7 -
'(7.86)''
1
(1.12),41
(46.6)48
(53.93)
LIX .iiIiJi')U - "'L '"3 .
(7),'1 '
Li?)2
(,25).- .'
... .1 1
L1)6'
(6.)7.
(7.86)
l19i.i): I'f'1-
?bi 'ii ('1.'2)L'"'' (14)' (148) (26i6y
52(16.85) 19.10 i(10.t1) (i2.'3) H'i;) "_ jki (26.96) 31.46 (5842
No Response 2
(2.25)
- 3
(3.37)
1
(1.12)
- - - - 5
(5.61)
1
(1.12)
6
(6.74)
Grand Total 18
(20.22)
20
(22.47)
21
(23.59)
20
(22.47)
2
(2.25)
7
(7.86)
- 1
(1.12)
41
(46.06)
48
(53.93)
89
* Percentages are given in parenthesis

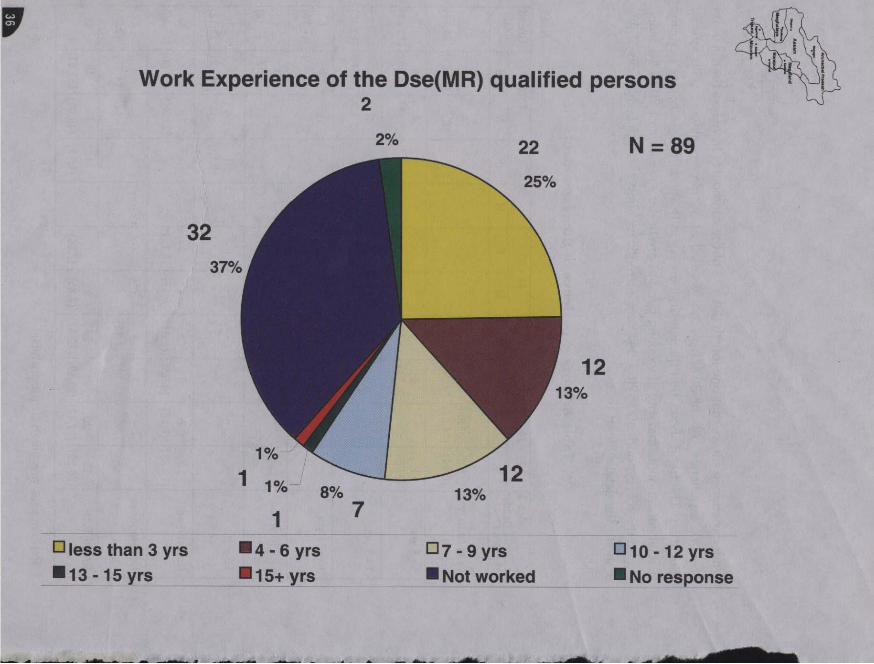
Work experience shows that one fourth (24.7%) of the candidates have less than 3 yearsof work experience. About 36% hve not worked at all after qualifying with specialeducation. The trend shows that there is an increase in the younger candidates perusingspecial education as majority of working persons are in the age range of 20 to 40 years.
Out of the 89 respondents, 57(64.04%) are currently working as special educators.Table
9 shows the details about them.
Table 8: Work experience of the respondents
* Percentages are given in parenthesis
N89
Age & 20- 30 31 - 40 41 - 50 50 + TotalTotal
endeL N F U F U F N F U F
Less than3yrs 6
(6.74)
13
(14.61)
3
(3.37)
- - - - - 9
(10.11)
13
(14.61)
22
(24.71)
4-6yrs 2
(2.25)
- 6
(6.74)
4
(4.49)
- - - - 8
(8.98)
4
(4.49)
12
(13.48)
7-9yrs - • 3
(3.37)
7
(7.86)
• 2
(2.25)
- - 3
(3.37)
9
(10.11)
12
(13.48)
1O-l2yrs - - - 3(3.37)
1
(1.12)
3(3.37)
- - 1
(1.12)
6(6.74)
7
(7.86)
13-l5yrs - - - - - 1
(1.12)
- - - 1
(1.12)
1
(1.12)
15+yrs - - - - • - - 1
(1.12)
- 1
(1.12)
1
(1.12)
Not worked 10(11.23)
7(7.86)
8(8.98)
5(5.61)
1
(1.12)
1
(1.12)
- - 19
(21.34)
13
(14.60)
32
(35.95)
No Response - - 1
(1.12)
1
(1.12)
• - - - 1
(1.12)
1
(1.12)
2
(2.25)
Grand Total 18
(20.22)
20
(22.47)
21
(23.59)
20
(22.47)
2
(2.25)
7
(7.86)
- 1
(1.12)
41
(40.06)
48
(53.93)
1
o less than 3 yrs•13 -15 yrs
•4 - 6 yrs•1 5+yrs
07 - 9 yrs• Not worked
010 - 12 yrs•No response
-—- -a
22
Work Experience of the Dse(MR) qualified persons2
2% N=89
32
2
1

Table 9: Basic information of respondents - Working N 57Age &
Detail nid
20- 30 31 - 40 41 - 50 50 + Total GrandTotal
M F M F M F M F M F
Number ofcandidates
6
(10.53)
13
(22.80)
12
(21.05)
16
(28.07)
2
(3.51)
7
(12.28)
- 1
(1.75)
20
(35.08)
37
(64.91)
57
MARITAL STATUS.
Married 1
(1.75)
1
(1.75)
9
(15.78)
9
(15.78)
2
(3.51)
6
(10.53)
- - 12
(21.05)
16
(28.07)
28
(49.12)
Unmarried 5
(8.77)
12
(21.95)
3
(5.26)
6
(10.53)
- 1
(1.75)
•1
(1.75)
8
(14.03)
20
(35.08)
28
(49.12)
No Response - - - 1
(1.75)
- - - - - 1
(1.75)
1
(1.75)
Grand Total 6
(10.53)
13
(22.80)
12
(21.05)
16
(28.07)
2
(3.51)
7
(12.28)
- 1
(1.75)
20
(35.08)
37
(64.91)
57
EDUCATIONAL QUALIFICATIONS____Inter 1
(1.75)
6
(10.53)
7
(12.28)
1
(1.75)
- 1
(1.75)
- - 8
(14.03)
8
(14.03)
16
(28.07)
Graduate 5
(8.77)
7
(12.28)
5
(8.77)
13
(22.80)
2
(3.51)
6
(10.53)
- 1
(1.75)
12
(28.07)
27
(40.35)
39
(68.42)
Post Graduate - - - 2
(3.51)
- - - - - 2
(3.51)
2
(3.51)
Grand Total 6
(10.53)
13
(22.80)
12
(21.05)
16
(28.07)
2
(3.51)
7
(12.28)
- 1
(1.75)
20
(35.08)
37
(64.91)
57
YEAR OF COMPLETION
1986-1990 - - - 3
(5.26)
1
(1.75)
2
(3.51)
- 1
(1.75)
1
(1.75)
6
(10.53)
7
(12.28)
1991-1995 - 1
(1.75)
3
(5.26)
5
(8.77)
1
(1.75)
5
(8.77)
- - 4
(7.01)
11
(19.29)
15
(26.31)
1996 - 2001 6
(10.53)
12
(21.05)
8
(14.03)
8
(14.03)
- - - - 14
(24.56)
20
(35.08)
34
(59.64)
No Response - - 1
(1.75)
- • - - - 1
(1.75)
- 1
(1.75)
Grand Total 6
(10.53)
13
(22.80)
12
(21.05)
16
(28.07)
2
(3.51)
7
(12.28)
- 1
(1.75)
20
(35.08)
37
(64.91)
57
* Percentages are given in parenthesis
As seen in table 9, among working people, majority (65%) are females and most of themare in the age range of 20 to 40 years. Graduates with diploma in special educationconstitute more than two thirds (68.4%) of the persons working in the field while postgraduates are only 2 (3.5%) and those with Intermediate qualification constitute aboutone fourth (28%).
The table also reveals that those,who qualified in the past 5 years constitute more thanhalf (59.6%) of the persons working in the field. This is a positive sign. The overall trendin terms of year of completion also reveals a gradual increase in recent years when compared
to early years.
A total of 90 have qualified during 1996 - 2001 out of whom 18 (20%) among therespondents are not working and 34(37.7%) are working. (see table 9 and table 10)
Table 10 provides details on respondents who are not continuing to work in the field ofspecial education. As seen in Table 1 reveals that 22 persons have qualified during thisperiod, out of whom 15 have not responded and their status is not known. All otherrespondents who have qualified in the years 1986 - 1990 seen to be currently working.
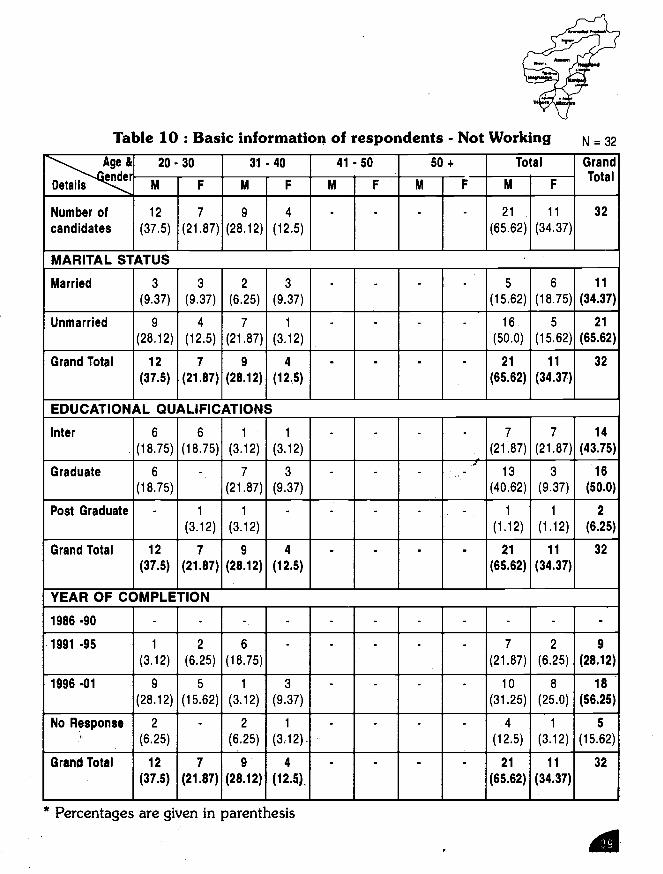
Table 10 Basic information of respondents - Not Working-. Age &
oetaiQ!!j20 - 30 31 40 41 - 50 50 + Total Grand
TotalM F M F M F M M F
Number ofcandidates
12
(37.5)
7
(21.87)
9
(28.12)
4
(12.5)
- - - - 21
(65.62)
11
(34.37)
32
MARITAL STATUS
Married 3
(9.37)
3
(9.37)
2
(6.25)
3
(9.37)
- - - - 5
(15.62)
6
(18.75)
11
(34.37)
Unmarried 9
(28.12)
4
(12.5)
7
(21.87)
1
(3.12)
- - - - 16
(50.0)
5
(15.62)
21
(65.62)
Grand Total 12
(37.5)
7
(21.87)
9
(28.12)
4
(12.5)
• - - - 21
(65.62)
11
(34.37)
32
EDUCATIONAL QUALIFICATIONS____Inter 6
(18.75)
6
(18.75)
1
(3.12)
1
(3.12)
- - - - 7
(21.87)
7
(21.87)
14
(43.75)
Graduate 6
(18.75)
- 7
(21.87)
3
(9.37)
• - - 1- 13
(40.62)
3
(9.37)
16
(50.0)
Post Graduate - 1
(3.12)
1
(3.12)
- - - - - 1
(1.12)
1
(1.12)
2
(6.25)
Grand Total 12
(37.5)
7
(21.87)
9
(28.12)
4
(12.5)
- - - - 21
(65.62)
11
(34.37)
32
YEAR OF COMPLETION
1986 -90 - - - - - - - - - - •
1991-95 1
(3.12)
2
(6.25)
6
(18.75)
- - - - . 7
(21.87)
2
(6.25)
9
(28.12)
1996-01 9
(28.12)
5
(15.62)
1
(3.12)
3
(9.37)
- - - - 10
(31.25)
8
(25.0)
18
(56.25)
No Rfsponse'
2
(6.25)
- 2
(6.25)
1
(3.12).
- - - - 4
(12.5)
1
(3.12)
5
(15.62)
Grand Total 12
(37.5)
7
(21.87)
9
(28.12)
4
(12.5)
- - - - 21
(65.62)
11
(34.37)
32
* Percentages are given in parenthesis
d
N = 32
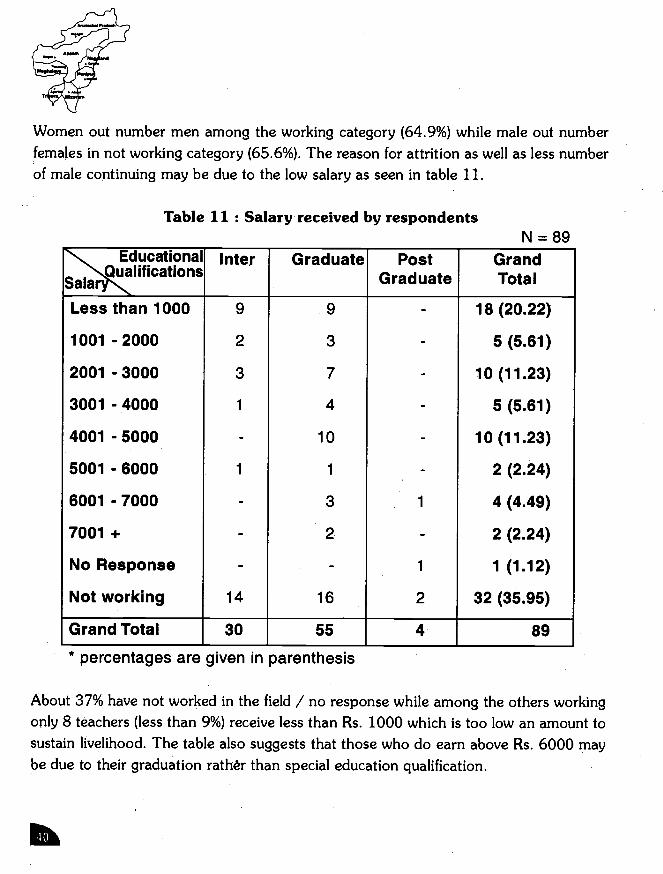
Women out number men among the working category (64.9%) while male out numberfemales in not working category (65.6%). The reason for attrition as well as less numberof male continuing may be due to the low salary as seen in table 11.
Table 11 : Salary received by respondentsN=89
N, Educational
8aiafuatI0h1sInter Graduate Post
GraduateGrandTotal
Less than 1000 9 9 - 18 (20.22)
1001 - 2000 2 3 - 5 (5.61)
2001 -3000 3 7 - 10 (11.23)
3001 - 4000 1 4 - 5 (5.61)
4001 -5000 - 10 - 10 (11.23)
5001 - 6000 1 1 - 2 (2.24)
6001 - 7000 - 3 1 4 (4.49)
7001 + - 2 - 2 (2.24)
No Response - - 1 1(1.12)
Not working 14 16 2 32 (35.95)
Grand Total 30 55 4 89
* percentages are given in parenthesis
About 37% have not worked in the field / no response while among the others workingonly 8 teachers (less than 9%) receive less than Rs. 1000 which is too low an amount tosustain livelihood. The table also suggests that those who do earn above Rs. 6000 maybe due to their graduation rather than special education qualification.
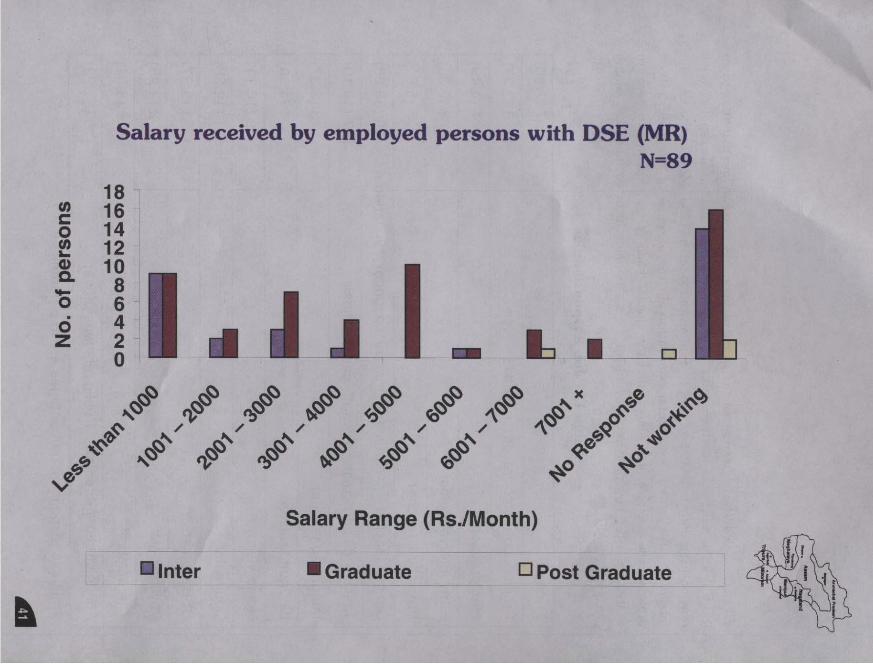
Salary received by employed persons with DSE (MR)N=89
CoC0U,I-C)0.'I-0az
181614121086420 .i I I
0
C''¼.
'V
0
PS
9,
0,I
0-
04),
'S
C)
x0
'S
Co
453
Salary Range (RsiMonth)
U Inter • Graduate 0 Post Graduate

Table 12 : Job Responsibilities
* multiple responses, percentages are in parenthesis
I
When we look at the job responsibilities of the respondents, one can find that 80 of them(89.8%) work as special teachers (table 12). They also hold additional responsibilitiesranging from early intervention (2%) to administrative tasks (11%). Most of the jobs arerelated to intervention for mental retardation. In the absence of adequate trainedprofessionals available, it is natural that the special teachers are expected to performrelated tasks. But how prepared they are for the additional tasks by virtue of the training
given in DSE(MR)?
N=57*
Principal 7 (7.86)
Project coordinator/research staff 3 (3.37)
Master teacher 4 (4.49)
Early interventionist 2 (2.25)
Pre school teacher 5 (5.61)
Special teacher - pre primary, primary, secondary, vocational 80 (89.88)
Teacher co curricular - art/craft, games, music 17 (19.10)
Integrated teacher 3 (3.37)
Itinerant teacher 4 (4.49)
Home visitor 9 (10.11)
Counselor 11(12.36)
CBR worker 3 (3.37)
Psychologist 2 (2.25)
Therapist 5 (5.61)
Administration! Accounts! Public relations officer 10 (11.23)
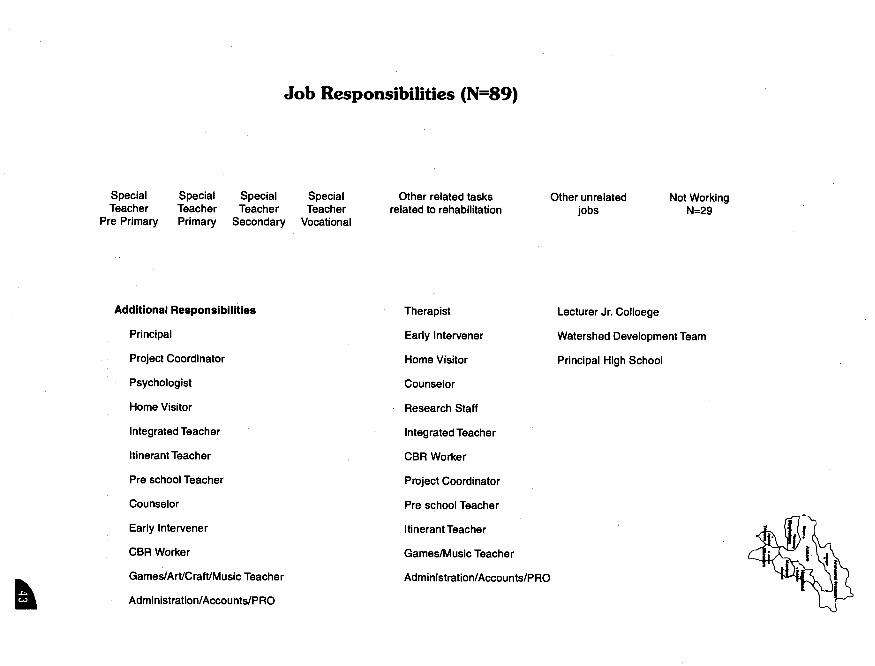
Job Responsibilities (N=89)
Additional Responsibilities
Principal
Project Coordinator
Psychologist
Home Visitor
integrated Teacher
Itinerant Teacher
Pre school Teacher
Counselor
Early Intervener
CBR Worker
Games/Art/Craft/Music Teacher
Administration/Accounts/PRO
Therapist
Early intervener
Home Visitor
Counselor
Research Staff
integrated Teacher
CBR Worker
Project Coordinator
Pro school Teacher
Itinerant Teacher
Games/Music Teacher
Administration/Accounts/PRO
Lecturer Jr. Colloege
Watershed Development Team
Principal High School
Special Special Special Speciai Other related tasks Other unrelated Not WorkingTeacher Teacher Teacher Teacher related to rehabilitation jobs N=29
Pre Primary Primary Secondary Vocational
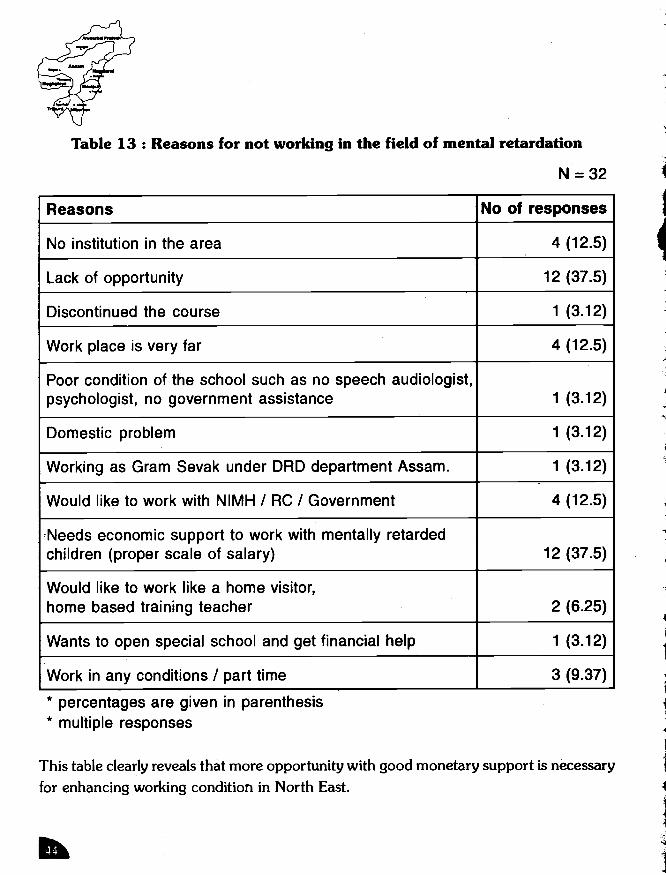
Table 13 : Reasons for not working in the field of mental retardation
N =32
Reasons No of responses
No institution in the area 4 (12.5)
Lack of opportunity 12 (37.5)
Discontinued the course 1 (3.12)
Work place is very far 4 (12.5)
Poor condition of the school such as no speech audiologist,psychologist, no government assistance 1 (3.12)
Domestic problem 1 (3.12)
Working as Gram Sevak under DAD department Assam. 1 (3.12)
Would like to work with NIMH / RC / Government 4 (12.5)
'Needs economic support to work with mentally retardedchildren (proper scale of salary) 12 (37.5)
Would like to work like a home visitor,home based training teacher 2 (6.25)
Wants to open special school and get financial help 1 (3.12)
Work in any conditions / part time 3 (9.37)
* percentages are given in parenthesis* multiple responses
This table clearly reveals that more opportunity with good monetary support is necessaryfor enhancing working condition in North East.
1k

Table 14 shows the utility of the course as perceived by the respondents. All theorypapers were found generally useful with Mental Retardation Nature and Needs andCurriculum and teaching getting the highest ranking while Occupational Therapy receivingthe lowest ranking. In practicals, it is natural that the teachers found BehaviourModification, IEP and Group Teaching of Curricular and Co curricular activities as mostuseful, as they are directly relevant in classroom management. Rural teaching andtherapeutics need to be reconsidered with regard to relevance and utility for specialteachers in North East, making it more ecologically viable.
Table 14 Utility of the course contents (Theory and Practical)by special teacher while working in the field
N=89
Theory Very useful Average Not useful
Mental retardation nature and needs
(43.82)
8
(8.98)
1
(1.12).
Curriculum and teaching 37
(41.57)
9
(10.11)
-
-
Psychology 33
(30.07)
10
(11.23)
--
.
Persons with MR family and community 26
(29.21)
19
(21.34)
1
(1.12)
Speech and language therapy 26
(29.21)
15
(16.85)
1
(1.12)
Occupational therapy 15
(16.85)
25
(28.08)
2
(2.25)
Physiotherapy 21
(23.59)
21 1
(23.59) (1.12)
1
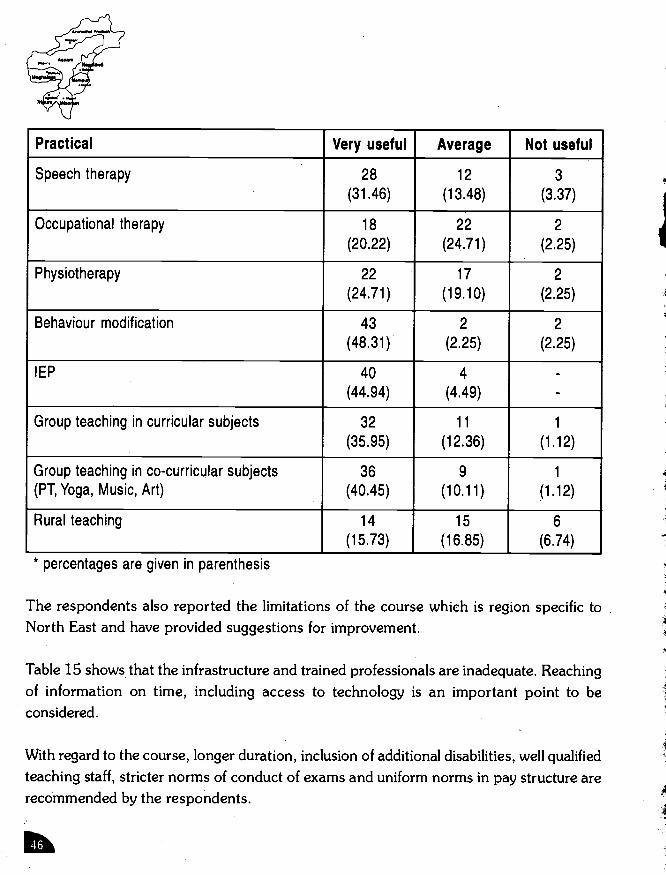
Practical Very useful Average Not useful
Speech therapy 28
(31.46)
12
(13.48)
3
(3.37)
Occupational therapy 18
(20.22)
22
(24.71)
2
(2.25)
Physiotherapy 22
(24.71)
17
(19.10)
2
(2.25)
Behaviour modification 43
(48.31)
2
(2.25)
2
(2.25)
PEP 40
(44.94)
4
(4.49)
-
-
Group teaching in curricular subjects 32
(35.95)
11
(12.36)
1
(1.12)
Group teaching in co-curricular subjects(PT, Yoga, Music, Art)
36
(40.45)
9
(10.11)
1
(1.12)
Rural teaching 14
(15.73)
15
(16.85)
6
(6.74)
* percentages are given in parenthesis
The respondents also reported the limitations of the courseNorth East and have provided suggestions for improvement.
which is region specific to
Table 15 shows that the infrastructure and trained professionals are inadequate. Reachingof information on time, including access to technology is an important point to beconsidered.
With regard to the course, longer duration, inclusion of additional disabilities, well qualifiedteaching staff, stricter norms of conduct of exams and uniform norms in pay structure arerecOmmended by the respondents.
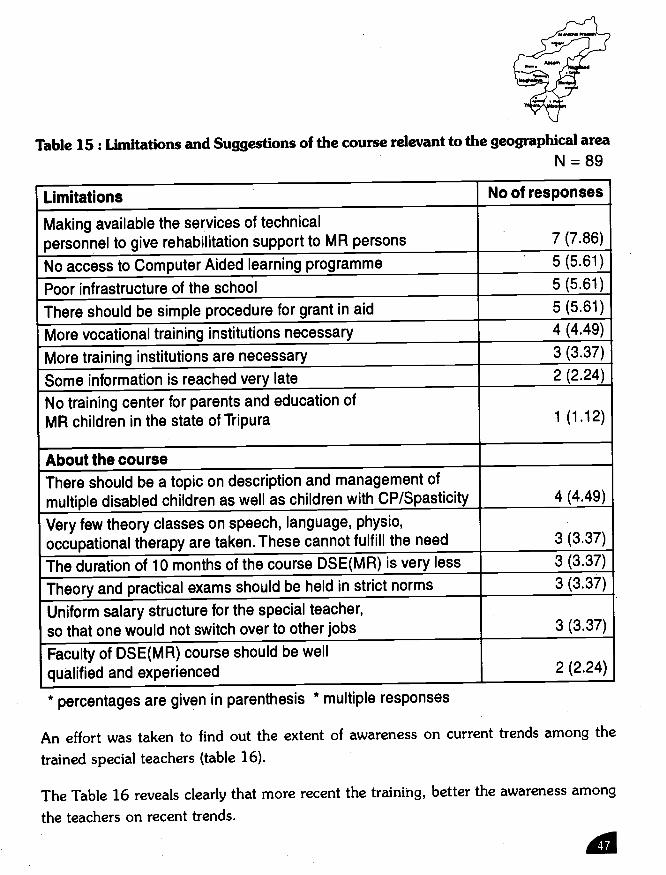
Table 15: LimItations and Suggestions of the course relevant to the geographical areaN = 89
Limitations No of responses
Making available the services of technicalpersonnel to give rehabilitation support to MR persons 7 (7.86)
No access to Computer Aided learning programme 5 (5.61)
Poor infrastructure of the school 5 (5.61)
There should be simple procedure for grant in aid 5 (5.61)
More vocational training institutions necessary 4 (4.49)
More training institutions are necessary 3 (3.37)
Some information is reached very late 2 (2.24)
No training center for parents and education ofMR children in the state of Tripura 1(1.12)
About the courseThere should be a topic on description and management ofmultiple disabled children as well as children with CP/Spasticity 4 (4.49)
Very few theory classes on speech, language, physio,occupational therapy are taken. These cannot fulfill the need 3 (3.37)
The duration of 10 months of the course DSE(MR) is very less 3 (3.37)
Theory and practical exams should be held in strict norms 3 (3.37)
Uniform salary structure for the special teacher,so that one would not switch over to other jobs 3 (3.37)
Faculty of DSE(MR) course should be well
qualified and experienced 2 (2.24)
* percentages are given in parenthesis * multiple responses
An effort was taken to find out the extent of awareness on current trendstrained special teachers (table 16).
among the
The Table 16 reveals clearly that more recent the training, better the awareness amongthe teachers on recent trends.
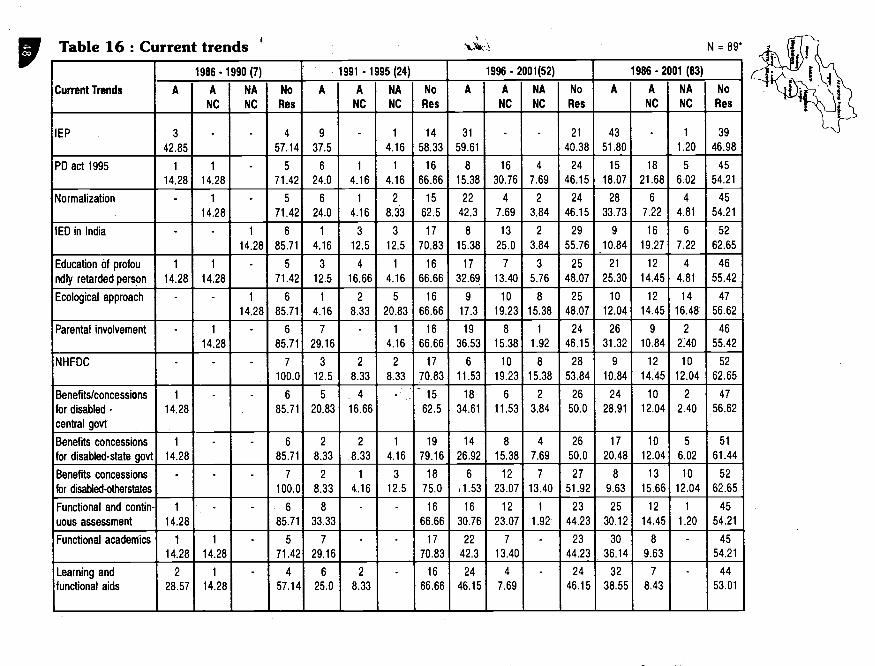
Table 16 : Current trends N = 89*
Current Trends
1986• 1990 (7) 1991 - 1995 (24) 1996 - 2001 (52) 1986 - 2001 (83)
A ANC
NANC
No
Res
A ANC
NA
NC
No
Res
A A
NC
NA
NC
No
Res
A A
NC
NANC
NoRes
IEP 3
42.85
• - 457.14
9
37.5
- 1
4.16
14
58.33
31
59.61
- - 21
40.38
43
51.80
• 1
1.20
39
46.98
PD act 1995 1
14.28
1
14.28
- 571.42
6
24.0
1
4.16
1
4.16
16
66.66
815.38
16
30.76
4
7.69
24
46.15
15
18.07
18
21.68
5
6.02
45
54.21
Normalization • 1
14.28
- 5
71.426
24.01
4.162
8.33
15
62.5
2242.3
4
7.69
2
3.8424
46.1528
33.73
6
7.224
4.81
45
54.21
lED in India - - 1
14.28
6
85.71
1
4.16
3
12.5
3
12.5
17
70.83
8
15.38
13
25.0
2
3.84
29
55.76
9
10.84
16
19.27
6
7.22
52
62.65
Education of protou
ndly retarded person
1
14.28
1
14.28
- 5
71.42
3
12.5
4
16.66
1
4.16
16
66.66
17
32.69
7
13.40
3
5.76
25
48.07
21
25.30
12
14.45
4
4.81
46
55.42
Ecological approach - - 1
14.28
6
85.71
1
4.162
8.335
20.8316
66.66
9
17.3
10
19.238
15.38
25
48.07
10
12.04
12
14.4514
16.4847
56.62
Parental involvement - 1
14.28
- 6
85.71
729.16
• 1
4.1616
66.66
19
36.53
8
15.38
1
1.92
24
46.15
26
31.32
9
10.84
2
24046
55.42
NHFDC - - - 7
100.0
312.5
2
8.33
2
8.33
17
70.83
6
11.53
10
19.23
8
15.38
28
53.84
9
10.84
12
14.45
10
12.04
52
62.65
Benefits/concessions
for disabled -
central govt
1
14.28
- - 6
85.71
5
20.83
4
16.66
. - 15
62.518
34.61
611.53
2
3.84
26
50.024
28.91
10
12.04
22.40
4756.62
Benefits concessions
for disabled-state govt
1
14.28
- - 6
85.71
2
8.33
2
8.331
4.16
19
79.1614
26.928
15.38
4
7.6926
50.017
20.48
10
12.045
6.0251
61.44
Benefits concessions
for disabled-otherstates
- - - 7
100.0
2
8.33
1
4.163
12.5
18
75.06
1.53
12
23.07
7
13.40
27
51.928
9.6313
15.66
10
12.04
52
62.65
Functional and contin-uous assessment
1
14.28
• - 6
85.71
8
33.33
- - 16
66.6616
30.76
12
23.07
1
1.92
2344.23
25
30.12
12
14.45
1
1.20
4554.21
Functional academics 1
14.28
1
14.28
- 5
71.427
29.16
• . 17
70.83
22
42.3
7
13.40
- 2344.23
30
36.14
8
9.63
- 45
54.21
Learning and
functional aids
2
28.57
1
14.28
- 4
57.14
6
25.0
2
8.33
- 16
66.66
24
46.15
4
7.69
- 24
46.1532
38.55
7
8.43
• 44
53.01
Current Trends
1986 - 1990 (7) 1991 - 1995 (24) 1996 - 2001(52) 1986- 2001 (83)
A ANC
NA
NC
No
Res
A A
NC
NA
NC
NoRes
A A
NC
NA
NC
No
Res
A ANC
NANC
No
Res
Inclusive education • 1
14.28
1
14.28
571.42
2
8.33
2
8.334
16.66
16
66.66
13
25.014
26.92
2
3.8423
44.23
15
18.07
17
20.48
78.43
453.01
Technology in
special education
- 1
14.28
- 685.71
1
4.165
20.83
2
8.33
16
66.66
12
23.07
14
26.92
2
3.8424
46.15
13
15.66
20
24.09
44.81
46
55.42
National trust act
(1999)
- 1
14.28
1
14.28
5
71.42
416.66
2
8.33
4
16.66
14
58.33
12
23.07
14
26.92
1
1.92
2548.07
16
19.27
17
20.48
67.22
44
53.01
National open school • 2
28.57
- 5
71.42
2
8.333
12.5
5
20.83
14
58.33
11
21.15
11
21.15
5
9.61
2548.07
13
15.66
16
19.27
10
12.40
44
53.01
National programmefor integrated child
developtient
1
14.28
- - 6
85.71
5
20.83
2
8.33
- 17
70.83
19
36.53
4
7.69
2
3.8427
51.9225
30.126
7.22
22,40
50
60.24
National programme
for pulse polio
1
14.28
- - 6
85.71
4
16.66
1
4.16
- 19
79.16
24
46.15
3
5.76
1
1.92
2546.15
29
34.93
4
4.81
1
1.20
49
59.03
National programmefor immunization
1
14.28
• 1
14.285
71.42
5
20.83
3
12.5
1
4.1615
62.519
36.53
4
7.692
3.8427
51.92
25
30.12
7
8.434
4.81
47
56.62
Scheme for awards . - -1
14.28
6
85.71
1
4.166
25.0
28.33
1562.5
7
13,40
9
17.39
17.3
27
51.92
8
9.6315
18.0712
14.45
4857.83
Scheme for rehabilitati
of people with disabili
n 114.28
2
28.57
• 4
57.14
2
8.33
4
16.66
312.5
15
62.510
19.23
7
13.40
8
15.38
27
51.92
13
15.66
13
15.66
11
13.2546
55.42
Respite care - 1
14.28
- 6
85.71
- 3
12.5
520.83
16
66.66
6
11.5310
19.23
9
17.3
27
51.92
6
7,2214
16.86
1416.86
4959.03
Early intervention 2
28.57
- - 5
71.42
7
29.16
- 1
4,16
16
66.66
20
38.46
4
7.695
9.61
2344.23
2934.93
44.81
6
7.2244
53.01
National policyon education
- 1
14.28
- 685.71
'312.5
3
12.5
4
16.66
14
58.33
14
26.92
7
13.40
8
15.3823
44,23
17
20.48
11
13.25
12
14.45
43
51.80
DOAC - 1
14.28
- 685.71
1
4.162
8.336
25.0
15
62.5
713.40
9
17.3
14
26.9222
42.308
9:63
12
14.45
2024.09
43
51.80
NPRPD - - 1
14.286
85.71
1
4.161
4.166
25.016
66.66
3
5.76
8
15.3815
28.8426
50.04
4.81
9
10.8422
26.5048
57.83
Convergence of deve-
lopment programme
- - 1
14286
8531
1
4,16
- 7
291616
66659 8
153814
253225
45376
7228
53322
253047
5532
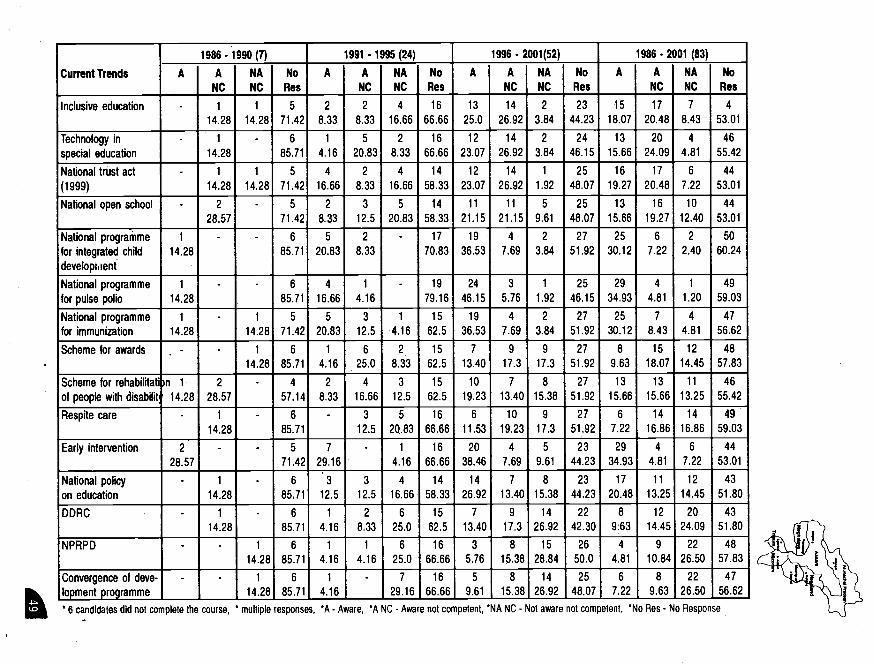
6 candidates did not complete the course, * multiple responses, *A - Aware, *A NC Aware not competent, *NA NC - Not aware not competent, *No Res - No Response
Competencies required in basic skills such as IEP, Functional Assessment, preventionand parental involvement, Functional Academics, TLMs are found to be present in 30 -40 % of the respondents while currents trends such as ecological approach. NationalOpen School, respite care, schemes of award and Legislation on rehabilitation for thedisabled persons are relatively less known to the respondents.
It is also possible that more recent the acquiring of qualification, better the awareness oncertain aspects clearly indicating the need for periodic refresher programmes to updatethe teachers with recent trends and development.
Other remarks from respondents include:1. Most of the children who are mentally retarded belong to poor families and their
parents cannot afford to send them to school. There is a need for the government tofinance such children for their admission to school.
2. Lack of opportunity.3. Waiting for chance to work.4. Lack of teaching aids for vocational education.5. Lack of awareness among the general public.6. Integrated education for the mild mentally retarded to be taken up in regular schools
and state government to monitor the programmes.7. Training centers to be updated and courses modified.8. Need to establish special schools.
Conclusions and Recommendations:
1. Assam had the largest number of persons trained in DMR/DSE(MR) followed byManipur. It is appropriate therefore, that another DSE(MR) center is established inManipur during the year 2001 - 2002.
2. Other five states need intensive programmes to create awareness and establish trainingcenters. As each state has its own state specific physical socio economic, linguisticfeatures, every state should have at least one center to train special educators, ratherthan combined ones covering all the northeastern states.

3. More number of special educational facilities should be initiated so that the trainedteachers find jobs related to special education and attrition rate will be reduced.
4. Recognition, uniform and structured pay scale be introduced for special teachers toprevent them from migrating to other jobs.
5. The course content of DSE(MR) was found inadequate and there is a scope forimprovement. In the light of suggestions made by the respondents course contentcan be modified.
6. Many respondents especially qualified in the first 10 years of the course are unawareof the current trends and development. Structured and periodic refresher courses toundergo this course with due recognition should be introduced. It should be mademandatory to retain teacher certification.
7. The educational models are bound to be varied based on the ecology. For instance,Arunachal Pradesh shows 13 per sq. km as the population spread. Special schoolsin such conditions are not viable. Instead, special class in regular schools or itinerantteaching and home-based training should be focused and the practical training inthis area must be emphasized. The practicals of group teaching planned currentlyshould be modified suitably.
8. The job responsibilities include more than special teacher in this region. The trainingshould equip them to perform the additional duties. It will be helpful in the absence/non availability of other trained professionals.
9. A large number did not respond to questionnaire despite reminders and a considerablenumber of questionnaires were returned with addressee not found. Efforts towardstracking all the candidates and conducting an elaborate study are necessary for
appropriate planning.
References:1. Manorama Yearbook (2002), Malayala Manorama Press, Kotta yam.2. GOl (2002), India 2002, Ministry of Information and Broadcasting, New Delhi.3. India Today (16th December, 2002).4. Reddy SHK (2002) Directory of Institutions for persons with mentally retardation
in India, Secundera bad: NIMH Publication.5. Net search - www.mapsofindia.com www.surveyofindia.com www.indya.com

Appendix - IQuestionnaire to elicit information on current status of
special teachers with DSE(MR)/DMR qualifications in theNorth Eastern Region
Section I1. Name
2. Age : 20-30 31-40 41-50 51+
3. Sex :IMJFI4. Marital status _________________________________________________
Married Un-married Divorced Widowed
5. Designation
6. Addressa) Permanent address
b) Present address
7. Contact number- Res: Off:
8. Email-id:
9. Year of completion of DSE(MR) / DMR:
10. Currently working as:

11. Job responsibilities carried out by you with the organization as given by you at 5.[tick appropriate one(s)]:
PrincipalProject coordinatorResearch staffMaster teacher for (DSE(MR)/B.Ed), short term courses, any otherEarly intervenerPreschool teacher
Special teacher pre primarySpecial teacher pre vocationalSpecial teacher primarySpecial teacher secondaryArt/craft teacherGames teacherMusic teacher
Integrated teacherInclusive teacherItinerant teacherHome visitorCounselorCBR worker
PsychologistTherapist(specify)AdministrationAccountsPublic Relations Officer
Any other (mention):
Are you registered with RCI? If yes state your RCI regn. no:
Registered (Give regn. no) Not registered Applied/awaiting registration

Educational qualifications : (begin listing from +2 onwards):
S.No Qualification Year of
passing
Classobtained
Remarks
Work experience:
S.No Organization Designation Duration Salary Remarks
Section III* If you are working in the field of mental retardation answer questions in section A.* If currently not working in field answer questions in section B.
Section II
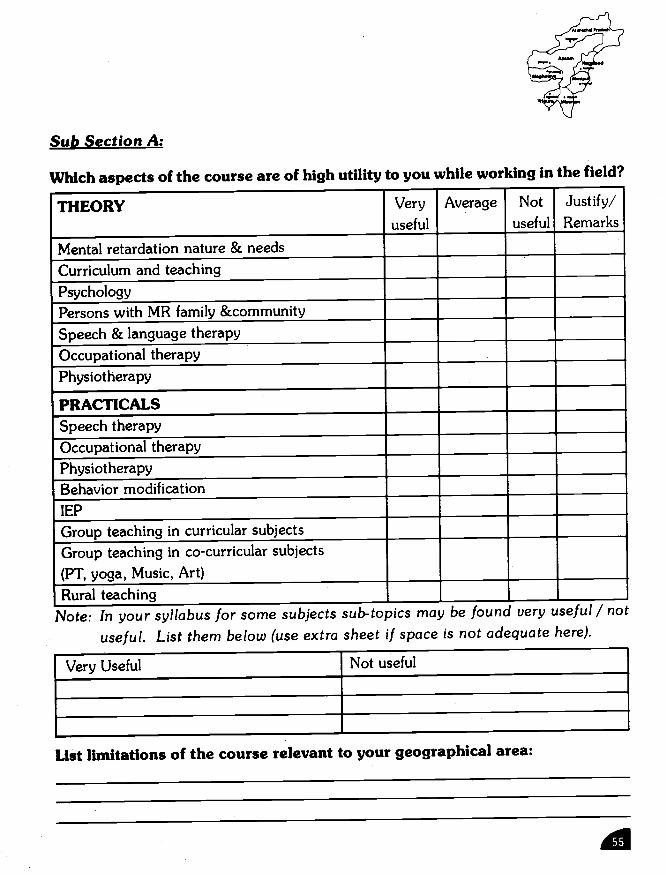
Sub Section A:
THEORY Veryuseful
Average Notuseful
Justify/Remarks
Mental retardation nature & needs .
Curriculum and teaching
PsychologyPersons with MR family &community .
Speech & language therapyOccupational therapyPhysiotherapy
PRACTICALSSpeech therapyOccupational therapyPhysiotherapyBehavior modificationIEP
Group teaching in curricular subjectsGroup teaching in co-curricular subjects(PT, yoga, Music, Art)Rural teaching
Note: In your syllabus for some subjects sub-topics may be found very useful /not
useful. List them below (use extra sheet if space is not adequate here).
Very Useful Not useful
List limitations of the course relevant to your geographical area:
Which aspects of the course are of high utility to you while working in the field?
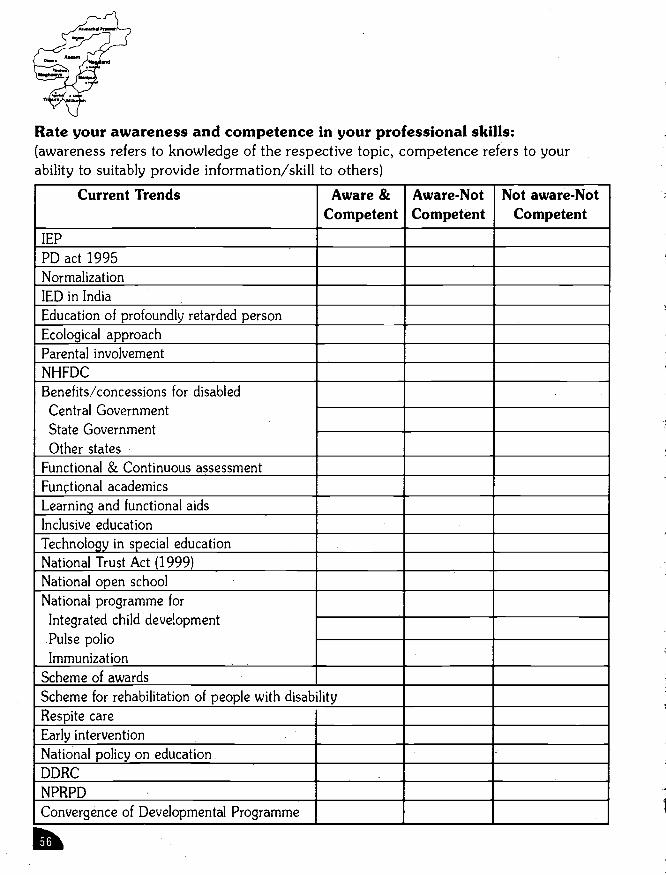
Rate your awareness and competence in your professional skills:(awareness refers to knowledge of the respective topic, competence refers to yourability to suitably provide information/skill to others)
Current Trends Aware &Competent
Aware-NotCompetent
Not aware-NotCompetent
IEPPD act 1995NormalizationlED in IndiaEducation of profoundly retarded person
Ecological approachParental involvementNHFDCBenefits/concessions for disabledCentral GovernmentState Government
Other_states
.
Functional & Continuous assessmentFunctional academicsLearning and functional aidsInclusive education
Technology in special educationNational Trust Act (1999)National open schoolNational programme for
Integrated child developmentPulse polioImmunization
Scheme of awardsScheme for rehabilitation of people with disabilityRespite careEarly interventionNational policy on educationDDRCNPRPD
Convergence of Developmental Programme
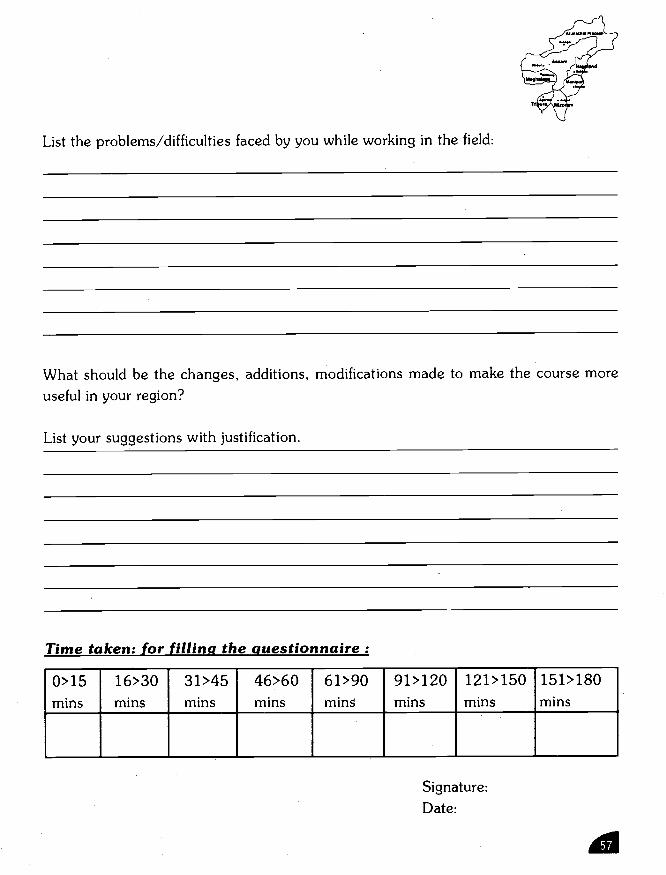
List the problems/difficulties faced by you while working in the field:
What should be the changes, additions, modifications made to make the course moreuseful in your region?
List your suggestions with justification. _______________________________
Time taken: for filling the questionnaire:
0>15 16>30 31>45 46>60 61>90 91>120 121>150 151>180
mins mins mins mins min� mins mins mins
Signature:Date:
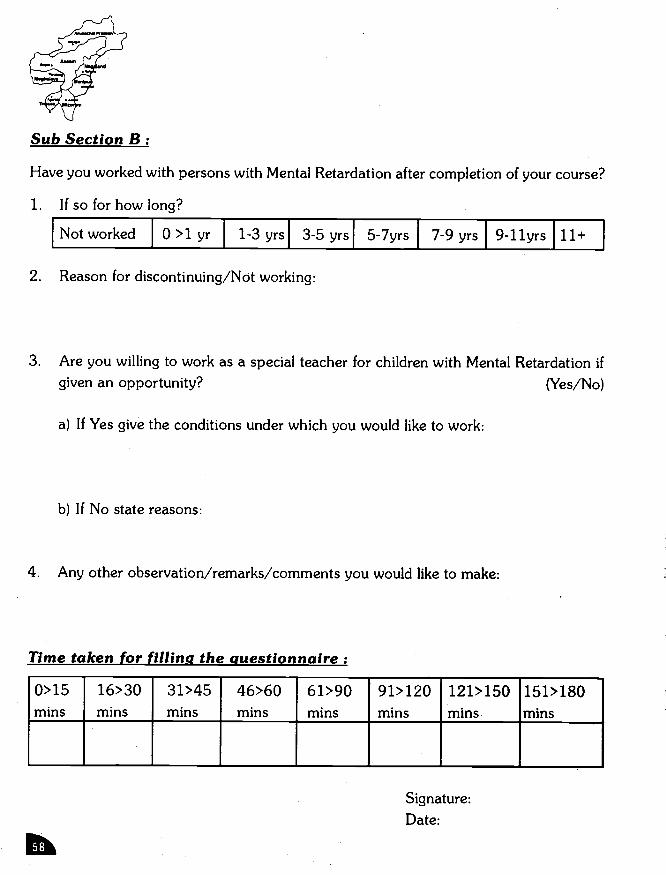
Have you worked with persons with Mental Retardation after completion of your course?
1. If so for how long?
Not worked 0 >1 yr 1-3 yrs 3-5 yrs 5-7yrs 7-9 yrs 9-ilyrs 111+ I
2. Reason for discontinuing/Not working:
3. Are you willing to work as a special teacher for children with Mental Retardation ifgiven an opportunity? (Yes/No)
a) If Yes give the conditions under which you would like to work:
b) If No state reasons:
4. Any other observation/remarks/comments you would like to make:
Time taken for filling the questionnaire:
0>15 16>30 31>45 46>60 61>90 91>120 121>150 151>180mins mins mins mins mins mins mins mins
Signature:Date:
Sub Section B:

Appendix - IIYearwise enrollment of DSE(MR) candidates from the state of Arunachal Pradesh
N=3
Year Enrolled Discontinued Qualified Failed Total
1986-1987 - - - - -
1987 - 1988 - - - - -
1988-1989 - - - - -
1989-1990 - - - - -
1990-1991 - - - - -
1991-1992 - - - - -
1992-1993 - - - - -
1993 - 1994 - - - - -
1994-1995 1 - 1 - 1
1995-1996 1 - 1 - 1
1996-1997 1 - - 1 1
1997-1998 - - - - -
1998 - 1999 - - - - -
1999 - 2000 - - - - -
2000 - 2001 - - - - -
Total 3 - 2 1 3
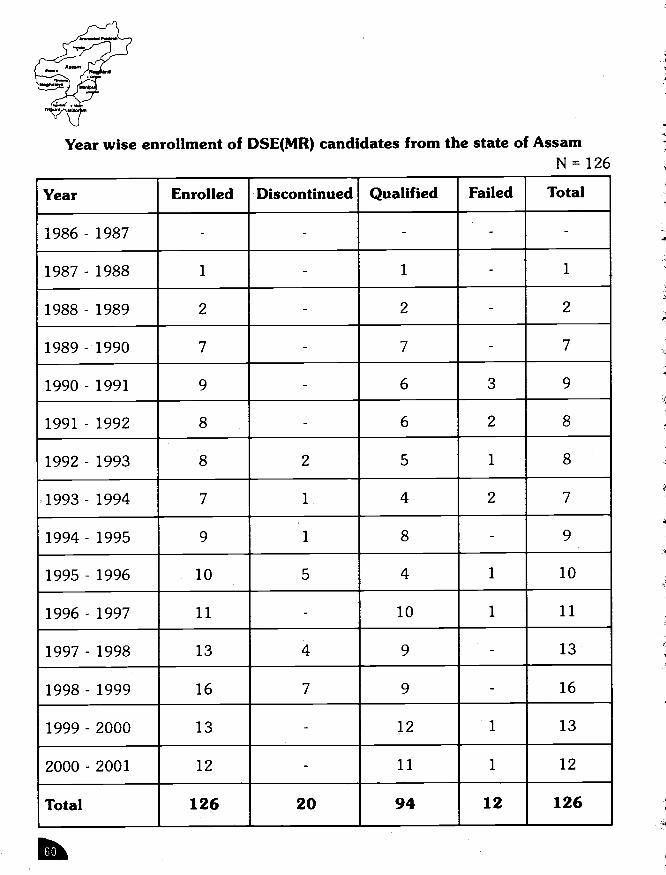
Year wise enrollment of DSE(MR) candidates from the state of AssamN = 126
Year Enrolled Discontinued Qualified Failed Total
1986 - 1987 - - - - -
1987-1988 1 - 1 - 1
1988-1989 2 - 2 - 2
1989-1990 7 - 7 - 7
1990-1991 9 - 6 3 9
1991-1992 8 - 6 2 8
1992-1993 8 2 5 1 8
1993-1994 7 1 4 2 7
1994-1995 9 1 8 - 9
1995 - 1996 10 5 4 1 10
1996-1997 11 - 10 1 11
1997 - 1998 13 4 9 - 13
1998 - 1999 16 7 9 - 16
1999 - 2000 13 - 12 1 13
2000 - 2001 12 - 11 1 12
Total 126 20 94 12 126

Year wise enrollment of DSE(MR) candidates from the state of ManipurN = 60
Year Enrolled Discontinued Qualified Failed Total
1986-1987 2 - 2 - 2
1987-1988 2 - 2 - 2
1988-1989 2 - - 2 2
1989-1990 6 - 5 1 6
1990-1991 1 - - 1 1
1991-1992 1 .- 1 - 1
1992-1993 4 - 3 1 4
1993-1994 9 - 9 - 9
1994-1995 3 1 2 - 3
1995-1996 8 1 7 - 8
1996-1997 2 - 1 1 2
1997-1998 3 1 2 - 3
1998-1999 4 1 3 - 4
1999-2000 7 - 7 - 7
2000-2001 6 - 6 - 6
Total 60 4 50 6 60
1
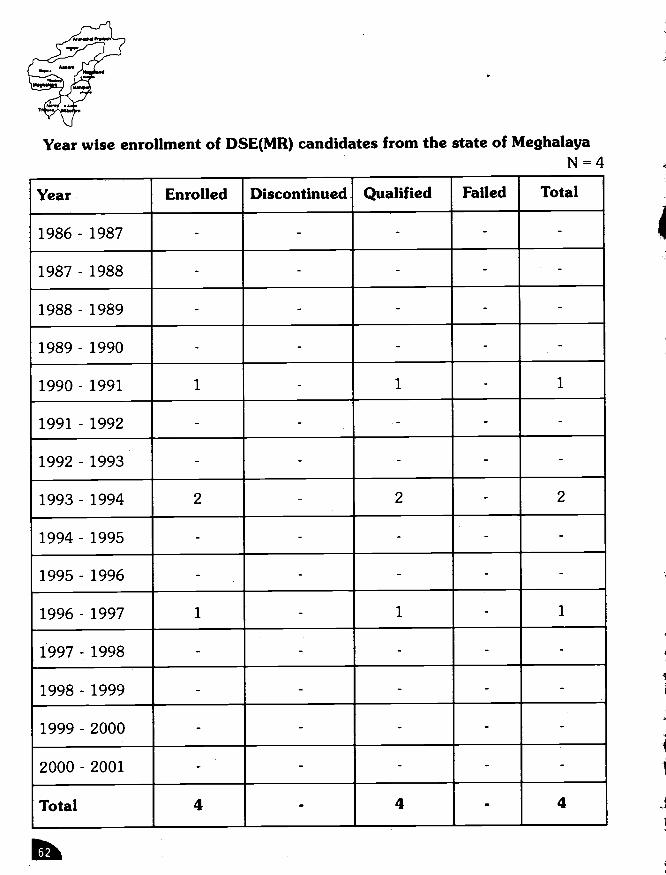
Year wise enrollment of DSE(MR) candidates from the state of MeghalayaN=4
Year Enrolled Discontinued Qualified Failed Total
1986 - 1987 - - - -
1987 - 1988 - - - - -
1988 - 1989 - - - - -
1989 - 1990 - - - - -
1990-1991 1 - 1 - 1
1991 - 1992 - - - - -
1992 - 1993 - - - - -
1993-1994 2 - 2 - 2
1994 - 1995 - - - -
1995 - 1996 - - - - -
1996-1997 1 - 1 - 1
1997 - 1998 - - - - -
1998 - 1999 - - - - -
1999 - 2000 - - - - -
2000 - 2001 - - - - -
Total 4 - 4 - 4
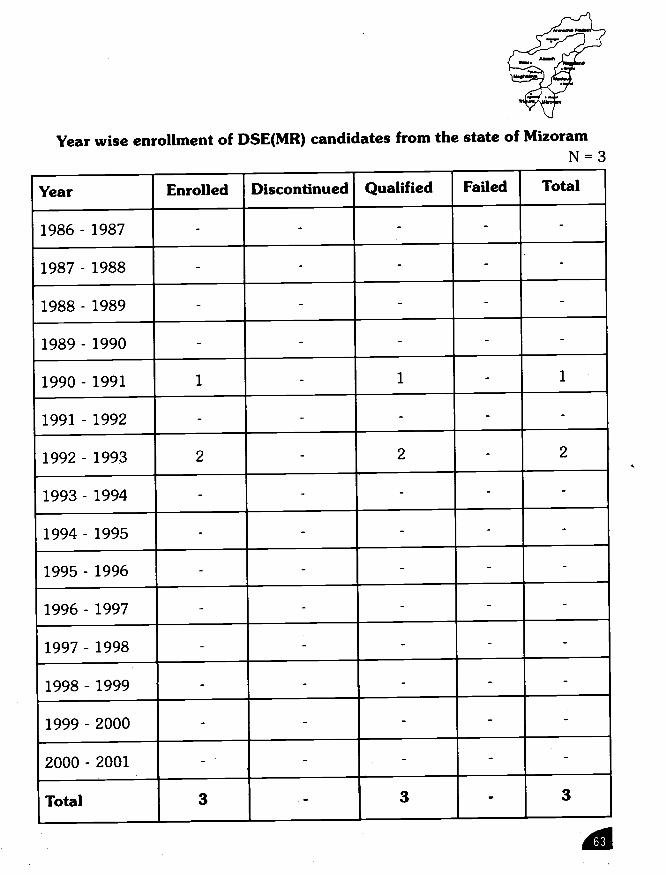
Year wise enrollment of DSE(MR) candidates from the state of MizoramN=3
Year Enrolled Discontinued Qualified Failed Total
1986 - 1987 - - - - -
1987 - 1988 - - - - -
1988 - 1989 - - - - -
1989 - 1990 - - - - -
1990-1991 1 - 1 - 1
1991 - 1992 - - - - -
1992-1993 2 - 2 - 2
1993 - 1994 - - - - -
1994 - 1995 - - - - -
1995 - 1996 - - - - -
1996 - 1997 - - - - -
1997 - 1998 - - - - -
1998 - 1999 - - - - -
1999 - 2000 - - - - -
2000 - 2001 - - - - -
Total 3 - 3 - 3
1

Year wise enrollment of DSE(MR) candidates from the state of NagalandN=3
Year Enrolled Discontinued Qualified Failed Total
1986 - 1987 - - - - -
1987-1988 - - - - -
1988 - 1989 - - - - -
1989 - 1990 - - - - -
1990-1991 - - - - -
1991. - 1992 - - - - -
1992 - 1993 - - - - -
1993-1994 - - - - -
1994-1995 1 - 1 - 1
1995-1996 1 - 1 - 1
1996 - 1997 - - - - -
1997-1998 1 - 1 - 1
1998 - 1999 - - - - -
1999 - 2000 - - - - -
2000 - 2001 - - - - -
Total 3 - 3 - 3

Year wise enrollment of DSE(MR) candidates from the state of TripuraN=5
Year Enrolled Discontinued Qualified Failed Total
1986 - 1987 - - - - -
1987 - 1988 - - - - -
1988 - 1989 - - - -
1989 - 1990 - - - - -
1990 - 1991 - - - - -
1991-1992 2 - 1 1 2
1992-1993 1 - 1 - 1
1993-1994 2 2 - - 2
1994 - 1995 - - - - -
1995 - 1996 - - - - -
1996 - 1997 - - - - -
1997 - 1998 - - - - -
1998 - 1999 - - - -
1999 - 2000 - - - - -
2000 - 2001 - - - - -
Total 5 2 2 1 5
1

Appendix - IIILIST OF ADDRESSES OF SPECIAL EDUCATION
PROVISIONS IN NORTH EAST REGION
TRIPURA
1. ABALAMBANRamnagar Road No.1,2nd Lane, AGARTALA.
2. Association for Social Health in IndiaNo.3, 2nd Lane, Joy NagrAGARTALA.
3. Gandhi Sarak Gram Seva Kendra90A/1B, Suran Sarkarroad, Calcutta,AGARTALA.
4. Kalyan SamitiGangail Road, Melar MathAGARTALA
5. Pratibandhi Punarvas SamitiP0 AbhoyegerAGARTALA 799 005
6. North Tripura Deaf & Dumb SchoolP0 Kailashahan,North Tripura
7. All Tripura SC ST & MinorityUpliftment Council,West Tripura.
MIZORAM
1. Agape Moral Reformation OrganisationR Z Labuaia Building, 2nd Floor,T-74, Venghlui Republic Road,Aizawl
2. Baptish Church of MizorarnBaptist House,Upper Khatta, MG Road,Aizawl
3. Blessing Home,Sakawrtichhun,Aizawl
4. Faith HomeChhingship,AIZAWL
5. New Life Home Society31 D, MahatmaGandhi RoadAizawl
6. Social Guidance AgencyP0 Box No.15a, Aizawl
7. Society for Rehabilitation of Spastic ChildrenCE Chhunga Building, Saron Veng,AIZAWL 796 001 P Box 130 Mizoram
8. Zoram DIvers Ramthim BeardC/o.Frien Atembfle Enterprises,Chandmari, Aizewl
1. Donyi Polo MissionItanagar 791111,Arunachal Pradesh
2. Ramakrishna Mission HospitalPo R.K.Mission, ltanagar,Arunachal Pradesh, MANIPUR
MANIPUR
1. Rural Educational & Socio Economic Dev. OrganisationThanga Village,Dist. Bishanpur, Manipur
2. Rural Voluntary ServicesWangbal Mayai Leikai,Thoubal 795 138, Chandal, Manipur
3. Service and Education for Welfare ActionChurchandpur,Churachandpur, Manipur
4. Social Care Ministry,I B Road, ChurachandpurManipur
5. Tribal Upliftment AssociationImphal Zone II, BukpithanlonChunachandpur Dist. Manipur
6. All Manipur Mentally Handicapped Persons Welfare OrganisationKeishamthong Top Leirak,Imphal 795 001, Manipur
ARUNACHAL PRADESH
7. Institute of Social Development for Weaker SectionWahengbam Leikai, Khongnang Hogaibi,New Cachar Road,Imphal 795 001, Manipur
8. Institute of Social OrganiserKwatkal, ISOR, Kwakethari Bazar (West)Imhpal 795 001. Manipur
9. Integrated Educational Soc. Dev. Orgn.Khongman East Zone-i,Imphal
10. Kangchup Area Tribal Women SocietySherwood, 5th Avenue, DeaulalaneImphal, Manipur - 795 001
11. Centre for Mental HygieneSangaiprou Airport Road.Imphal Zone II 795 001
12. Centre for Social DevelopmentImphal Zone II, Imphal
13. Centre for Upliftment of Rural Women AssnImphal Zone II, Drahmapur ThanyapalMapal P0 , Imphal
14. Ima Leimarel Women Welfare Assn.
Singjamei,Imphal Zone II
15. Institute of Social Development for Weaker SectionWahengbam Leikai,Khongnang,Hogaibi, New Cachar road,Imphal Zone II
1
16. Ireipak Youth Dev. AssnImphal Zone II, Kwakeithel BazarIrnhpal, MANIPUR 795 001
17. Kangchup Area Tribal Women SocietySherwood, 5th Avenue,Deaulalane, Imphal
18. Keiro women WelfareManipur Imphal East,Imphal Zone II
19. Kripa FoundationMt.Carmel Church81/A, Chapel RoadBandra Mumbai, Imphal Zone II
20. Kyamgei Khoiram Leikai Womens Welfare Assn.Kamgei Mayai Leikei, Imphal
21. Manipur Mahila Kalyan SamitiD M Road, Dwlahland - 1,Imphal
22. Manipur Rural InstituteTera Bazar SapamLeirak, Imphal
23. Rural Downtrodden People Upliftment SocietyImphal Mairangkhom KabuikulP0 Imphal 795 001 ,Manipur
24. Rural health OrganisationNaorenthong,Laishram Leirak, Imphal
25. Rural Reconstruction and Economic Dev. Org.Tehtha Wangjing 795 148, Imphal
26. Rural Reconstruction and Economic Dev. Org.P0 Loanginj, Imphal
27. Sneha BhavanC/O.Little Flower School
Imhphal
28. Social Agriculture *& Rural Dev. AgencyChandel KotlenphaiP0 PalIel 795135 Chawel Manipur
29. Social Awareness and Devep. AgencyKawkeithel, HeinoukhongnembiImphal
30. Sumchinvum Women SocietySunny Cottage, New LabulaneImphal
31. The Bashikhong Chanura Shilon Lap,Imphal Zone II
32. The Centre for Mental HygieneAirport Road,Imphal
33. The Challengers ClubCricket Faculty Oniam tiddim Road, Imphal
34. The ImphalDist. Tribal Devpt SocietyRegailong, Imphal
35. The manipur Deaf & Mute Association
Imphal
36. The Manipur Scheduled Caste Welfare Assn.4/IV Babupura, Imphal
37. The Rural Social & Educational Devt. AssnImphal
38. United Voluntary Youth CouncilWest II, Keisampet, ModuImphal
39. Urban Welfare AssociationLalambung Takhellambam, Leikai,RIMS Road, West Imhpal 795 001
40. Integrated Rural Devpt OrgnNear J.N.Hospital, Porompet,Imphal
41. Social Reformation & Devpt OrgnSoibem Leikaji, J N Hospital Road,Imphal 795 001
42. Kha Manipur Yoga and Nature Cure AssnMachin manao Hills,Kakching Bazar, Imhpal
43. Instt of Social Dev for Weaker sections,Leikei Imphal,Wâhegam, Leikei, Imphal
44. Lamka Rehab & Research centreP0 box 6, Manipur
45. United Rural Development ServiceHeirok Heitupokpi P0,Wanging, Manipur
46. Western Rural Socio Economic Dev OrgnHeinoukhongnembi,Konjeng Leikai, Manipur
47. Rural Downtrodden People Upliftment SocietyMoirangkhom Kabul KhuI,P0 Imphal, Tamemgleng
48. Rural Development Socio Economic Devpt orgnTongbram P 5 Moirang 795 133,Manipur
49. Rural Edu. & Socio Ecobnomic OrgThangaTongabram P0 MoirangThanga, Manipur
50. Centre for Rural Upliftment ServicesWangbal Canal MayaP0 Thoubal B P 0Wangbal Distt, Thoubal 795 138
51. Community Devpt Programme CentreThoubal Achouba M I RoadThoubal ,Manipur
52. Educated Unemployed Youth Devpt AssnKhongjom TekchamIndo (Burma) Myanmar RoadKhongion,Tekcham
53. Jania Education SocietySangaiyumphum, ThoubalImphal, Manipur
al

54. Lamka Rehab & Res centreP0 Box no.6, ThoubalImphal, Manipur
55. New Integrated Rural Management AgencyNunphou Bazar,Sanga Yumpham P0,Wangjing 795 148, Thoubal
56. Rural Development SocietyRDS Bhawan Wangjungbazar,P0 Wangjung , Thoubal
57. Rural Industries Dev AssnWangkhem P0Thoubal
58. Social Devpt & Rehab CouncilP0 Dist ThoubalB P 0/Phoudeu, Thoubal
59. Social Reformation and Dev OrgnPorumpat SoibamLeikai J.N.Hospital RoadImphal East P0 Imphal 795 001
60. Eastern Social Welfare OrgnManipurWangjing P0, Thoubal,Imphal, Manipur
61. The Rural People's Dev OrgnHeirok Part II,Thokchour Leikal,B P 0 Heirok - 795 148
62. The United Hill peoples Dev. SocietyThoubal, Imphal, Manipur
63. United Rural Development ServiceHeirok Heitupokpi P0 Wanging,Thoubal
64. Volunteers for Rural health & Action,HO Landing P0Wangjing 795 148
65. Women Income Generation CentreThoubal NigombamThoubal Dist 795 138
66. Youth Progressive OrgnLeishangthan P0,Thoubal BPO,Leishamngtham 795 138, Manipur
67. Thangkhul Mayar Ngala LongUkhrul, Imphal, Manipur
68. Islamic Edi Dev OrgnSangaiyumpam P0Wangjing, Imphal, Manipur
NAGALAND
1. Bethesda Youth Welfare CentreP B No.33Dimapur, Nagaland
2. Development Assn of NagalandShalom Dimapur, nagaland
al

3. Prodigals HomeP B No.148, Circular Road,Dimapur, Nagaland
4. Kripa FoundationMt.Carmel Chruch, 81/A, Chapel Road,Bandra Mumbai, Kohima, Dimapur
5. Operation Dawn1st Floor, Sato Building, P R HillsKohima, Nagaland
6. Save Youth Assn for LhisemaKohima VillageKohima, Nagaland
7. Youth. MissionP B No.127, High School RoadNorth Block, Kohima, Nagaland
8. Eleutherous Christian SocietyTuensang, Nagaland
MEGHALAYA
1. Bethany SocietyMandal, Shillong, meghalaya
2. Dwar Jingkyrmen School for Children in Need of Special EdnStonyland, Shillong 793 003Meghalaya
3. Khasi Jainita Presbyterian SynodChurch House, Mission CompoundShillong, Meghalay

4. Society for the Welfare of the DisabledHoly cross villa, Red Hill RdLactumkharah, Shillong 793 003
5. Montford centre for EducationDanakgre, tura P0, Meghalaya 794 101
6. Bethany SocietyArai Mile, West Garo HillsMeghalaya, ASSAM
ASSAM
1. Amar Pragati Sanskritic Chora & Samaj Vnnayan KendraDakhin rukini Nagar P0 BeltolaGuwahati 28, Assam
2. Association for Social Health in IndiaSunderper R.G, Baruah Road,GUWAHATI
3. Gram Vikas ParishadRangaloo, Jumarmur Nagaon, Guwahati
4. Guwahati Mental Welfare Society Vikash Nagar,Dakshingaon, Kahiliapara,Guwahati 781 019
5. Ramakrishr.a Mission SvashramSilchar 4 Coachar, Guwahati
6. Sishu Sarothi Spastics Society of AssamOff Ramakrishna Mission RoadBirubari, Guwahati 781 016
al
V7. All India Centre for Urban & Rural Devpt,Dist. Unit Golaghat
Hospital Road P0 & PS BokhahatGolaghat, Assam
8. Bharat Vikas ParishadK.N. Bhatta Road P0,Cherikuthi 781 003, Guwahati
9. North East society for the Promotion of Youth and MassesGuwahati Chapter, Ashram Road,Ulubari, Guwahati
10. The State Anti Drug and Prohibition CouncilAjom Prakadhan Parishad complexGuwahati 781 021
11. WodwiceeP0 Lakshirbond, Hailakandi, Assam
12. Dr.Ambedkar MissonHQ Vill. Dhopatari,P0 Changsari, Kamrup
13. Indian Council for Child WelfareGN Bordoloi Rd, Ambari,New Govt Emporium, Guwahati 01
14. Helal Sangha Community CentreVillage Taltala P0, Janakalyan Bazar,Karimgang
15. Jagriti Sanmilita Unnayan KendraP0 Islamgaon, Lakhimpur
16. Khorapathar Sanmilita Yuvak SamajP0 Islamgaon, Lakhimpur
17. National Youth Welfare MissionNorth Lakhimpur P0Moidemiya, Lakhimpur
18. Bahmukhi Krishri Kalyan SamitiDist Nagaon, NAGAON
19. Bahumukhi Krishi Arev Samaj Kalyan SamitiChota Rupali Noor Nagar P0,Hirapati Via Haibur Gaon, Nagaon 782 002
20. Educelimal Foundation TrustR R B Road, P.O.Haibergan, Nagaon
21. Maheri Par Adarsha Samaj Kaltyan SamitiVill. Maheri P 0, Kaliadinga, Via Juria, Nagaon
22. Bahumakhi Krishi Aru Samaj Kalyan SamitiChota Rupali Noor Nagar P0Hirapati Via Haibur Gaon
23. Gram Vikas ParishadRangaloo, Jumarmur Nagaon, Assam
24. Pathari Vocational InstituteTop Floor, Bar LibraryNowgong , Assam
25. Sreemanta Sankar MissionNagaon, Nowgong, Assam
ai