Embed Size (px)
DESCRIPTION
HS3: A Multi-Year Investigation of Hurricane Formation and Intensity Change. PI: Scott Braun Deputy PI: Paul Newman PM: Marilyn Vasques PS: Ramesh Kakar. Overall Science Objective. - PowerPoint PPT Presentation
Citation preview

PI: Scott BraunDeputy PI: Paul Newman
PM: Marilyn VasquesPS: Ramesh Kakar

• To provide measurements to address key science questions related to storm formation and intensity change, including whether it is primarily a function of the storm environment or storm internal processes

What aspects of the environment most impact the ability of a tropical storm to form and intensify?
Is the Saharan Air Layer positive or negative influence on storm formation and evolution? Both?
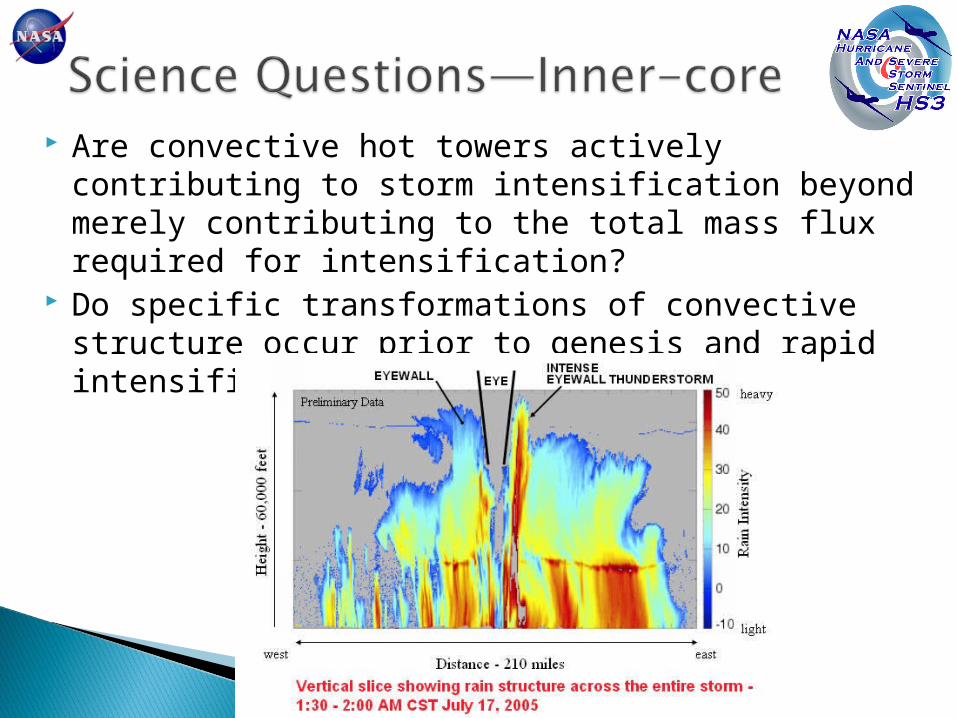
Are convective hot towers actively contributing to storm intensification beyond merely contributing to the total mass flux required for intensification?
Do specific transformations of convective structure occur prior to genesis and rapid intensification?
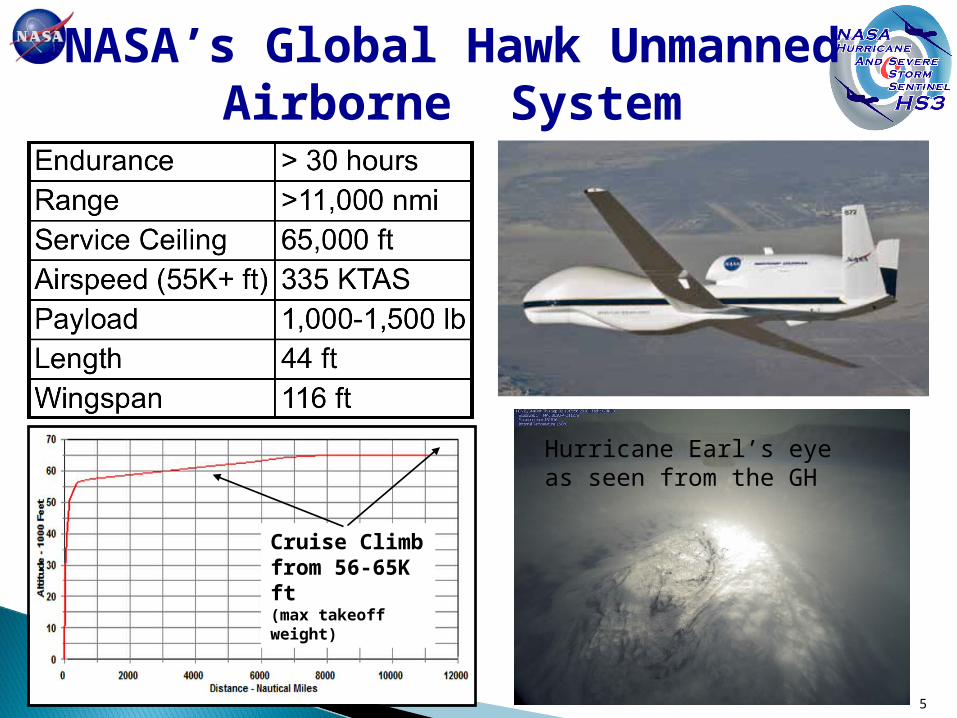
NASA’s Global Hawk Unmanned Airborne System
Cruise Climb from 56-65K ft(max takeoff weight)
5
Hurricane Earl’s eye as seen from the GH
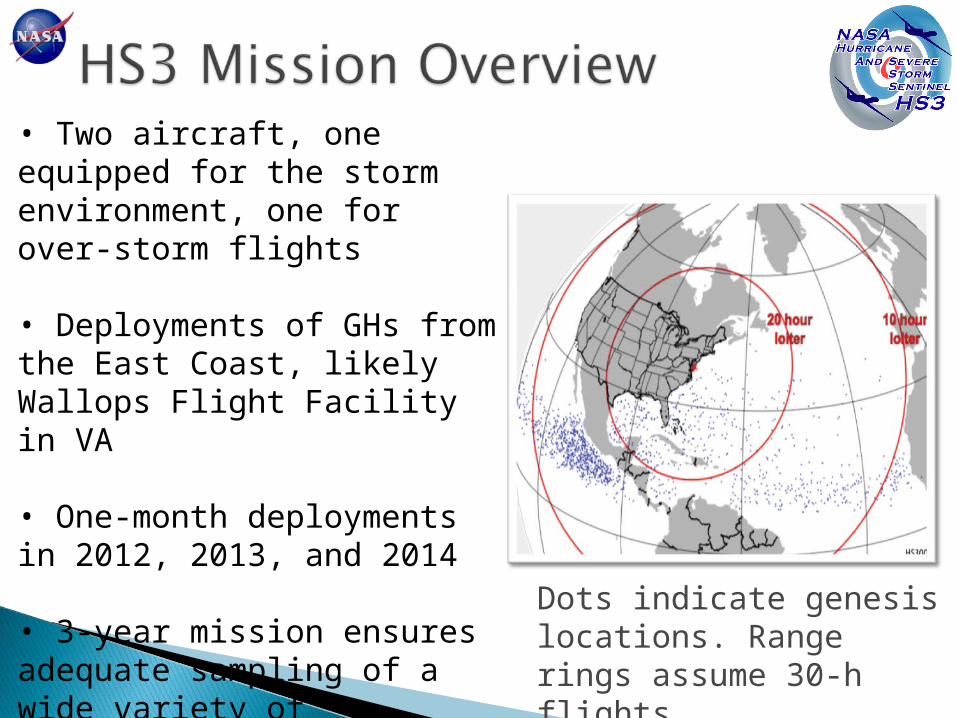
• Two aircraft, one equipped for the storm environment, one for over-storm flights
• Deployments of GHs from the East Coast, likely Wallops Flight Facility in VA
• One-month deployments in 2012, 2013, and 2014
• 3-year mission ensures adequate sampling of a wide variety of conditions
Dots indicate genesis locations. Range rings assume 30-h flights.

2012
2013-2014

Cloud/aerosol lidar (CALIPSO simulator) Instrument PI: Matt McGill, NASA/GSFC Data: Profiles of atten. backscatter, cloud/aerosol
boundaries, optical depth, extinction, depolarization
Horiz., vertical resolution=200 m, 30 m
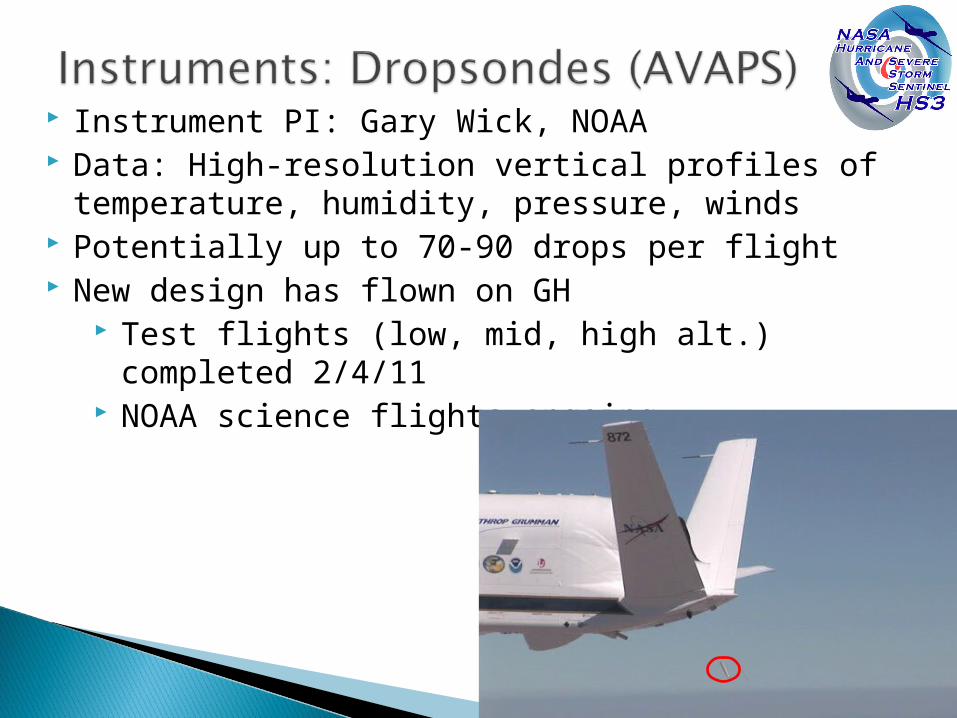
Instrument PI: Gary Wick, NOAA Data: High-resolution vertical profiles of
temperature, humidity, pressure, winds Potentially up to 70-90 drops per flight New design has flown on GH
Test flights (low, mid, high alt.) completed 2/4/11 NOAA science flights ongoing
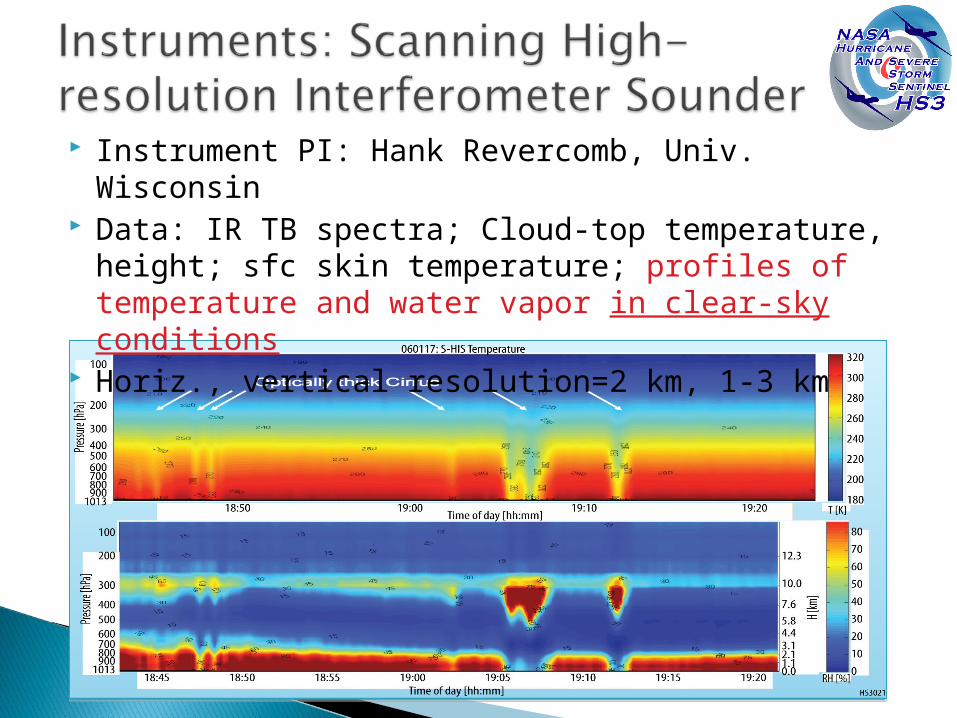
Instrument PI: Hank Revercomb, Univ. Wisconsin Data: IR TB spectra; Cloud-top temperature, height;
sfc skin temperature; profiles of temperature and water vapor in clear-sky conditions
Horiz., vertical resolution=2 km, 1-3 km
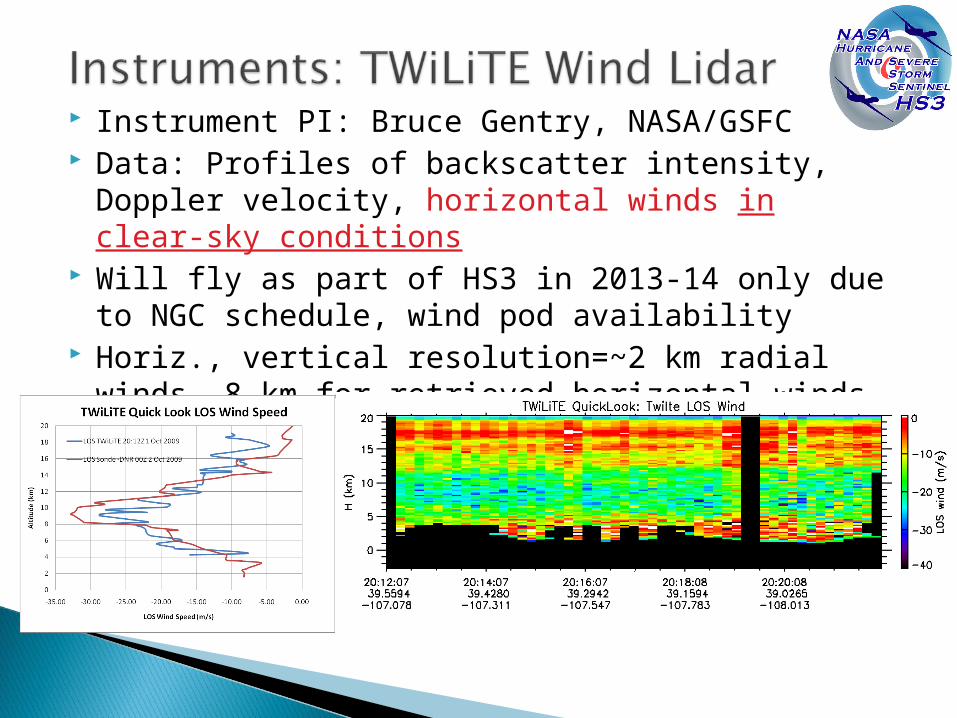
Instrument PI: Bruce Gentry, NASA/GSFC Data: Profiles of backscatter intensity, Doppler
velocity, horizontal winds in clear-sky conditions Will fly as part of HS3 in 2013-14 only due to NGC
schedule, wind pod availability Horiz., vertical resolution=~2 km radial winds, 8 km
for retrieved horizontal winds, 250 m


Instrument PI: Bjorn Lambrigtsen, JPL
Data: Calibrated brightness temperature; vertical profiles of temperature and water vapor and liquid water; precipitation structure
Horiz., vertical resolution=2km, 1-3 km
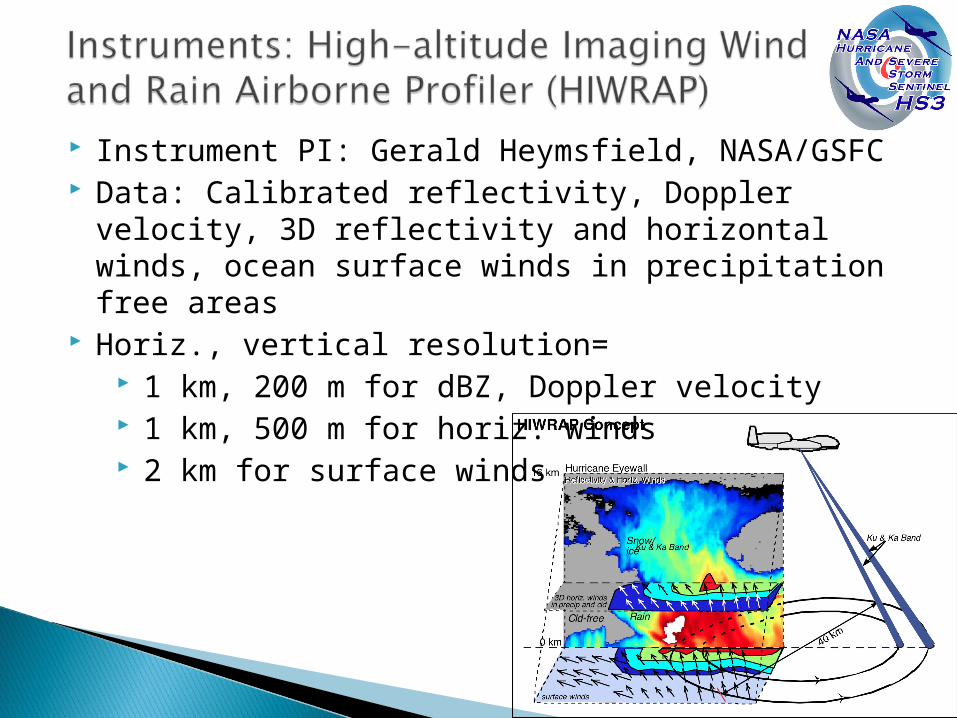
Instrument PI: Gerald Heymsfield, NASA/GSFC Data: Calibrated reflectivity, Doppler velocity, 3D
reflectivity and horizontal winds, ocean surface winds in precipitation free areas
Horiz., vertical resolution= 1 km, 200 m for dBZ, Doppler velocity 1 km, 500 m for horiz. winds 2 km for surface winds
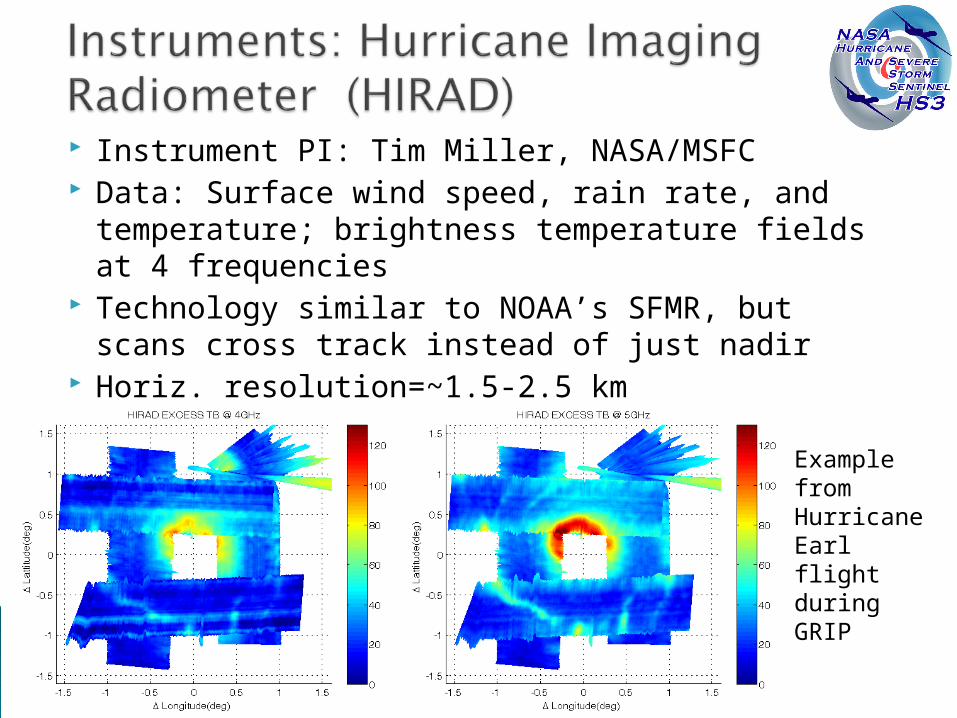
Instrument PI: Tim Miller, NASA/MSFC Data: Surface wind speed, rain rate, and
temperature; brightness temperature fields at 4 frequencies
Technology similar to NOAA’s SFMR, but scans cross track instead of just nadir
Horiz. resolution=~1.5-2.5 km
Example from Hurricane Earl flight during GRIP
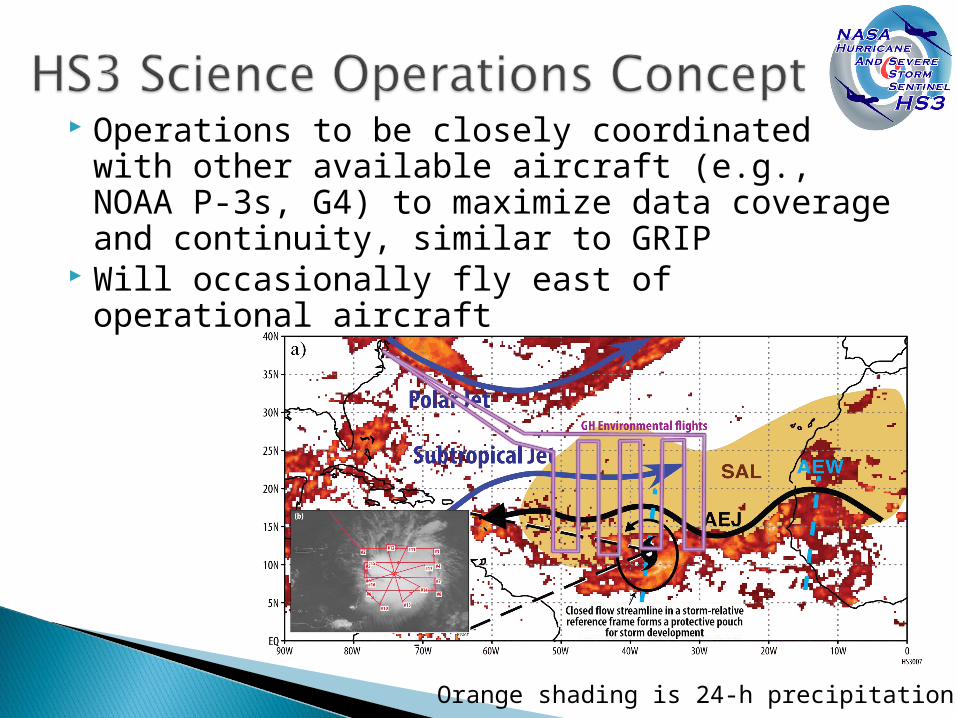
Orange shading is 24-h precipitation
Operations to be closely coordinated with other available aircraft (e.g., NOAA P-3s, G4) to maximize data coverage and continuity, similar to GRIP
Will occasionally fly east of operational aircraft
• Initial concept is to fly GHs serially if desired to alternate environment and over-storm sampling
• Manpower, cost, potential FAA issues make simultaneous flights unlikely
• Can have one GH coming back while the other is going out
• Turn-around time for either GH (landing to next takeoff ~24-48 h
• 300 total science flight hours per deployment Division between the aircraft will depend on science goals and weather

Goal: To make data widely available for◦ Hurricane research◦ Satellite calibration/validation activities (GPM,
NPP, GOES-R)◦ Model improvement research (DA, microphysics)
Collaboration with HFIP Would like to collaborate with NHC to
develop useful real-time products
All data to be publically available◦ Some data products to be made available in real
time◦ Following each deployment, ~6-9 months for data
QC, processing◦ Links to data, as well as all mission information, at
www.espo.nasa.gov/hs3/
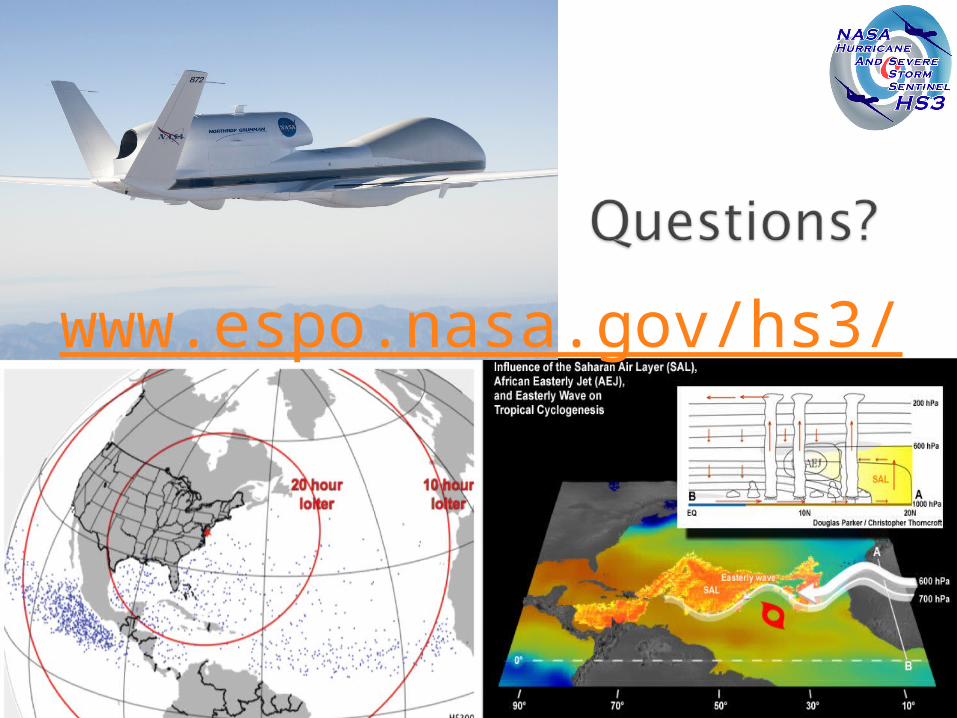
www.espo.nasa.gov/hs3/