Embed Size (px)
Citation preview
Assessing Hurricane Assessing Hurricane Intensity Intensity
TEAM TIGERSTEAM TIGERSHeatherHeatherEleanorEleanorMatt Matt AristaArista
ElizabethElizabeth
This presentation funded by HalliburtonThis presentation funded by Halliburton
Is it all Hype?Is it all Hype?•Mean hurricane intensity Mean hurricane intensity has not increased in a has not increased in a statistically significant way statistically significant way over time over time
•Occurrence of category 5 Occurrence of category 5 hurricanes in the past 15 hurricanes in the past 15 years is due to many years is due to many factorsfactors
•Measurement of Measurement of hurricanes before 1940s hurricanes before 1940s unreliableunreliable
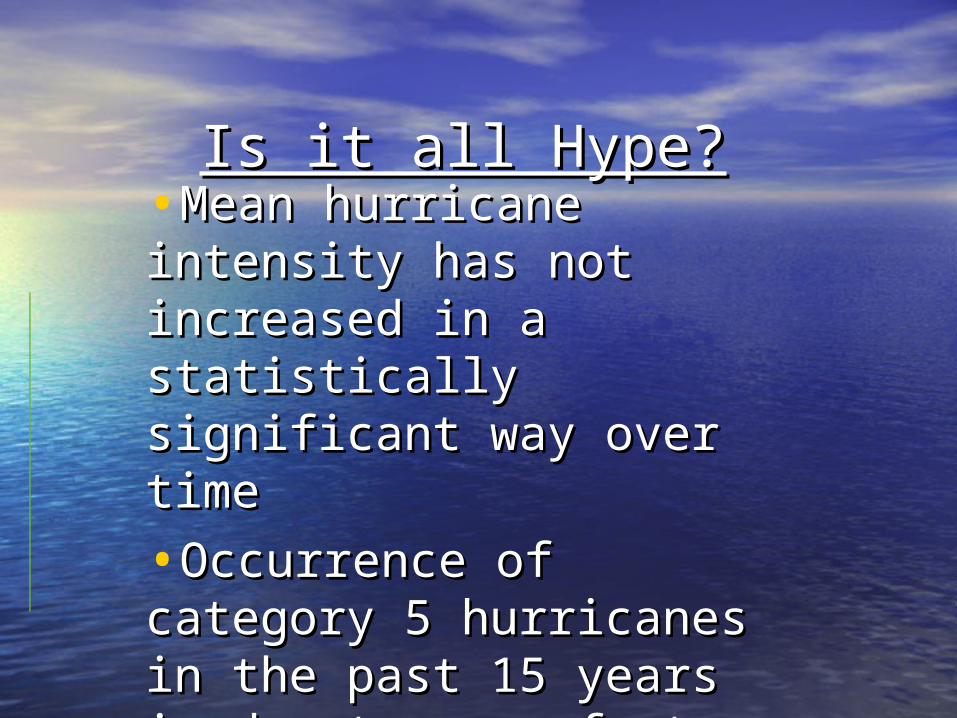
Average Category Rating
y = -0.0056x + 13.435
0.000
0.500
1.000
1.500
2.000
2.500
3.000
1940 1950 1960 1970 1980 1990 2000 2010
Year
Cat
ego
ry (
Saf
fir-
Sim
pso
n)
average category
Linear (average category)
XX22 value= .482627 value= .482627within p=.05 therefore the null hypothesis is not rejectedwithin p=.05 therefore the null hypothesis is not rejected
The linear regression shows a downward trend The linear regression shows a downward trend and chi-squared value also supports the null and chi-squared value also supports the null hypothesis which is that hypothesis which is that hurricane strength is hurricane strength is not increasingnot increasing
Hurricane Isabel storm front
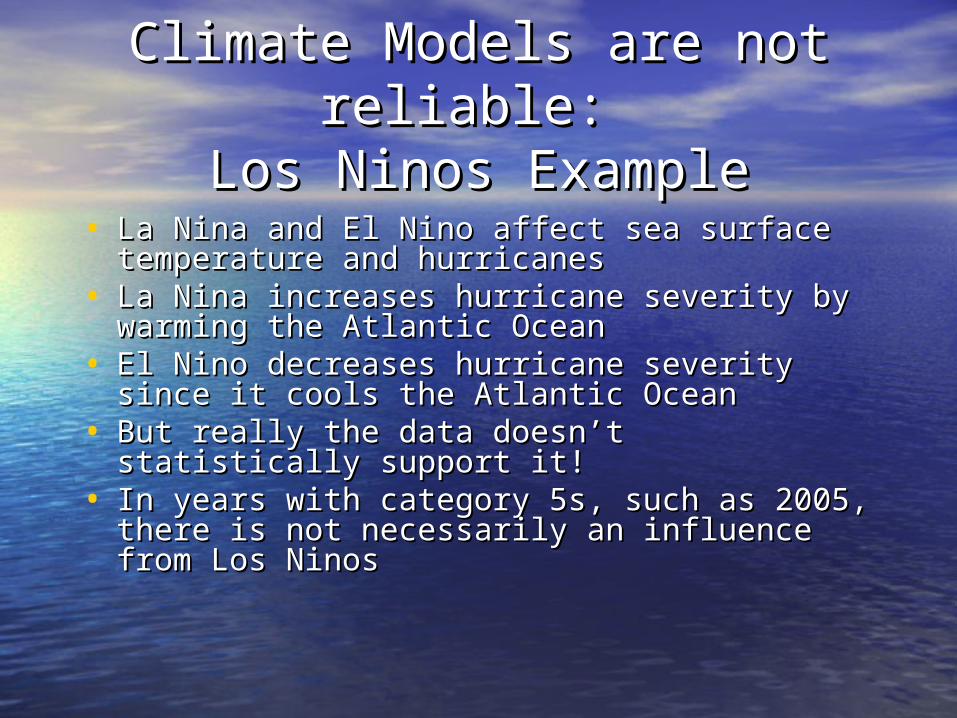
Climate Models are not Climate Models are not reliable: reliable:
Los Ninos ExampleLos Ninos Example• La Nina and El Nino affect sea surface La Nina and El Nino affect sea surface
temperature and hurricanestemperature and hurricanes• La Nina increases hurricane severity by La Nina increases hurricane severity by
warming the Atlantic Oceanwarming the Atlantic Ocean• El Nino decreases hurricane severity since it El Nino decreases hurricane severity since it
cools the Atlantic Oceancools the Atlantic Ocean• But really the data doesn’t statistically support But really the data doesn’t statistically support
it!it!• In years with category 5s, such as 2005, there In years with category 5s, such as 2005, there
is not necessarily an influence from Los Ninosis not necessarily an influence from Los Ninos
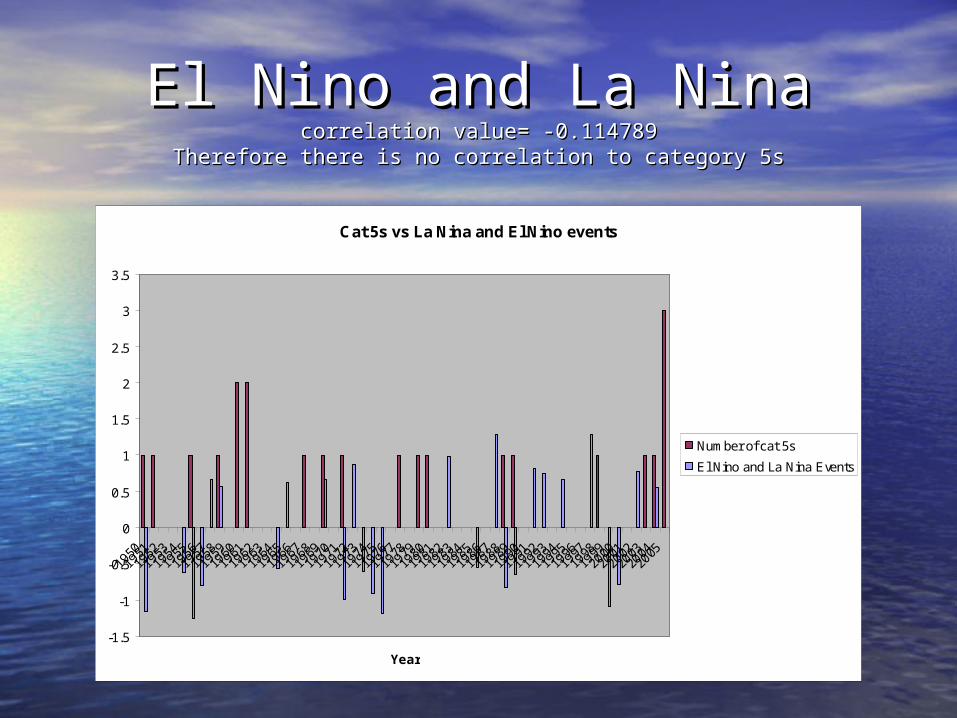
El Nino and La NinaEl Nino and La Ninacorrelation value= -0.114789correlation value= -0.114789
Therefore there is no correlation to category 5sTherefore there is no correlation to category 5s
Cat 5s vs La Nina and El Nino events
-1.5
-1
-0.5
0
0.5
1
1.5
2
2.5
3
3.5
195019
5119
5219
5319
5419
5519
5619
5719
5819
5919
6019
6119
6219
6319
6419
6519
6619
6719
6819
6919
7019
7119
7219
7319
7419
7519
7619
7719
7819
7919
8019
8119
8219
8319
8419
8519
8619
8719
8819
8919
9019
9119
9219
9319
9419
9519
9619
9719
9819
9920
0020
0120
0220
0320
0420
05
Year
Number of cat 5s
El Nino and La Nina Events
Future ResearchFuture Research
• Without a significant increase in Without a significant increase in mean hurricane intensity over time mean hurricane intensity over time it is impossible to show a it is impossible to show a consistent correlation with other consistent correlation with other factors, like SSTfactors, like SST
• Must measure changes in Must measure changes in atmospheric and oceanic conditionsatmospheric and oceanic conditions
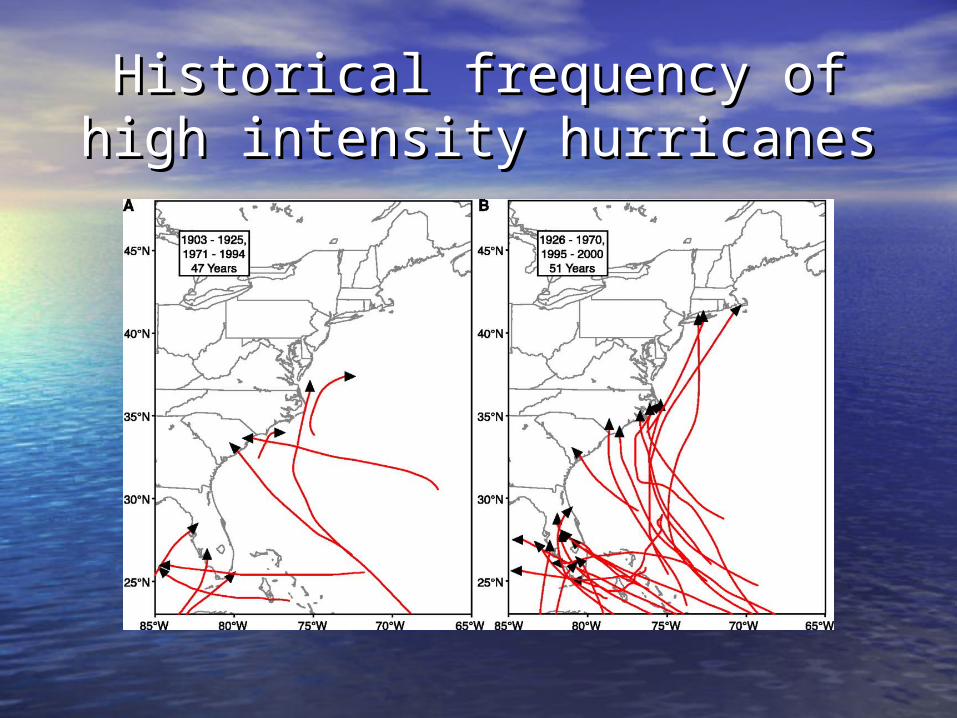
Historical frequency of high Historical frequency of high intensity hurricanesintensity hurricanes
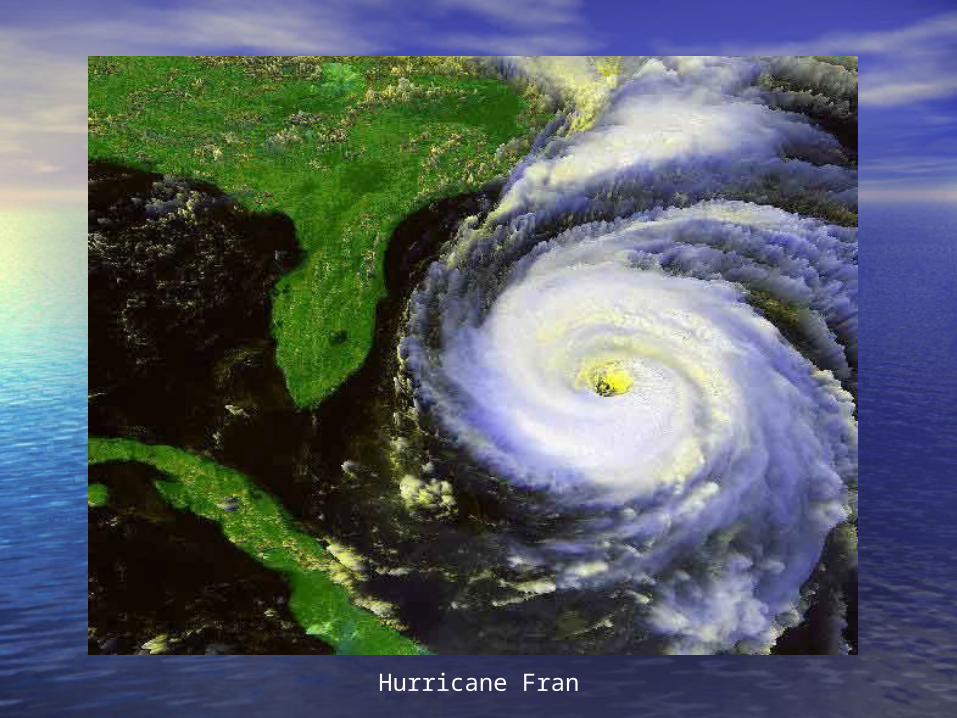
Hurricane Fran
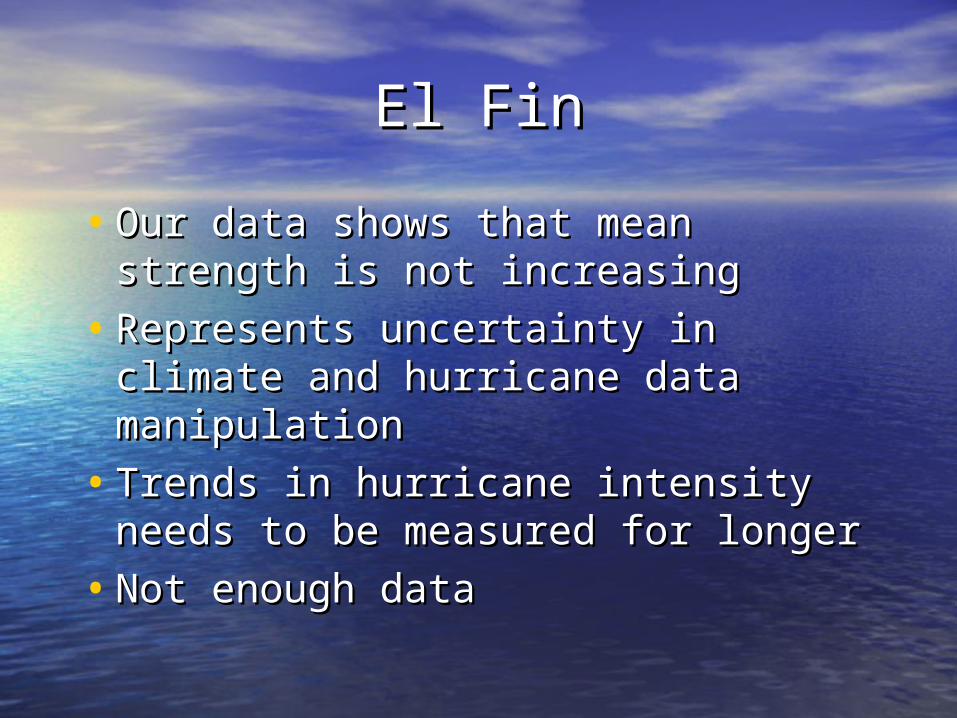
El FinEl Fin
• Our data shows that mean Our data shows that mean strength is not increasingstrength is not increasing
• Represents uncertainty in climate Represents uncertainty in climate and hurricane data manipulationand hurricane data manipulation
• Trends in hurricane intensity needs Trends in hurricane intensity needs to be measured for longer to be measured for longer
• Not enough dataNot enough data

Questions?GRRRREAT!