Embed Size (px)
Citation preview


HSBC Bank Canada first quarter 2020 performance
As at and for the quarter ended 31 March 2020Total operating income Profit before income tax expense Profit attributable to the common
shareholder
$546m ↑ 0.2% $79m ↓ 66% $54m ↓ 66%(2019: $545m) (2019: $229m) (2019: $158m)
Total assets Common equity tier 1 ratio1 Return on average common equity1
$125.5bn ↑ 18% 12.0% ↑ 70 bps 4.1% ↓ 920 bps(At 31 Dec 2019: $106.6bn) (At 31 Dec 2019: 11.3%) (31 Mar 2019:13.3%)
For the quarter ended 31 March 2020 compared with the same period in the prior year.
HSBC Bank Canada reported operating income for the quarter of $546m, an increase of $1m or 0.2%. Building on the momentum from last year, we continued to grow our businesses and deepen our relationships with existing customers, particularly in Commercial Banking and Retail Banking and Wealth Management, where total operating income increased by $11m or 4.5% and $9m or 4.9%, respectively. These results were driven mainly by higher net fee income.
However, beginning in March, declines in oil prices and central bank rate cuts related to COVID-19 had a negative impact on operating income and expected credit losses. Decreases in net interest income were partly offset by higher loans and deposits. Operating income in Global Banking and Markets was also impacted, as unfavourable credit and funding valuation movements were only partly offset by strong Markets trading and sales activities.
The change in expected credit losses for the quarter resulted in a charge of $140m related to an adverse shift in forward-looking economic scenarios due to COVID-19 and impairments from non-performing loans in the energy sector due to declines in oil prices. This is compared to reversals of $12m in the same period in the prior year.
Total operating expenses decreased by $1m or 0.3% for the quarter as we prudently manage costs while strategically making investments to grow our businesses, simplify our processes and provide the digital services our customers are asking for.
Profit before income tax expense was down $150m or 66% for the quarter. The decrease was mainly driven by the variance in expected credit losses and lower operating income from the adverse impact of COVID-19, partly offset by continued momentum in operating income from Commercial Banking and Retail Banking and Wealth Management and strong Markets trading and sales activities.
Commenting on the quarter, Sandra Stuart, President and Chief Executive Officer of HSBC Bank Canada, said:
“While we began the year with strong momentum in all of our business lines, results were impacted by economic factors over the course of the quarter. We saw significant slowdowns in national supply chains attributed to rail transportation disruptions, followed by unprecedented measures taken globally to slow the spread of COVID-19 and a severe decline in oil prices. These events combined with reductions in Bank of Canada rates have resulted in increased impairment charges and thinning margins which impacted profits.
“We have strengthened our capital and liquidity position so that we are well placed to help our customers weather the economic disruptions brought about by our collective fight to keep COVID-19 infections to a manageable level. We’ve introduced credit relief and other support measures for our customers and are actively participating in government programs to support the economy. With banking an essential service, HSBC branches are open and each of our digital channels are operating at much heightened levels to ensure customers have access to our banking services at this critical time. We have also made a $500,000 donation to Food Banks Canada, Breakfast Club of Canada and United Way to support the most vulnerable members of society.
“The resilience and energy our employees are showing in supporting our customers makes me very proud. I am humbled by the efforts of the HSBC team and we are equally humbled by our health workers and those providing essential services. We will continue to play our part in the response and recovery, and together I am confident we will get through this.”
1. Refer to the ‘Use of non-IFRS financial measures’ section of the Management’s Discussion and Analysis (‘MD&A’) for a discussion of non-IFRS financial measures.
Highlights
HSBC Bank Canada First quarter 2020 interim report 1
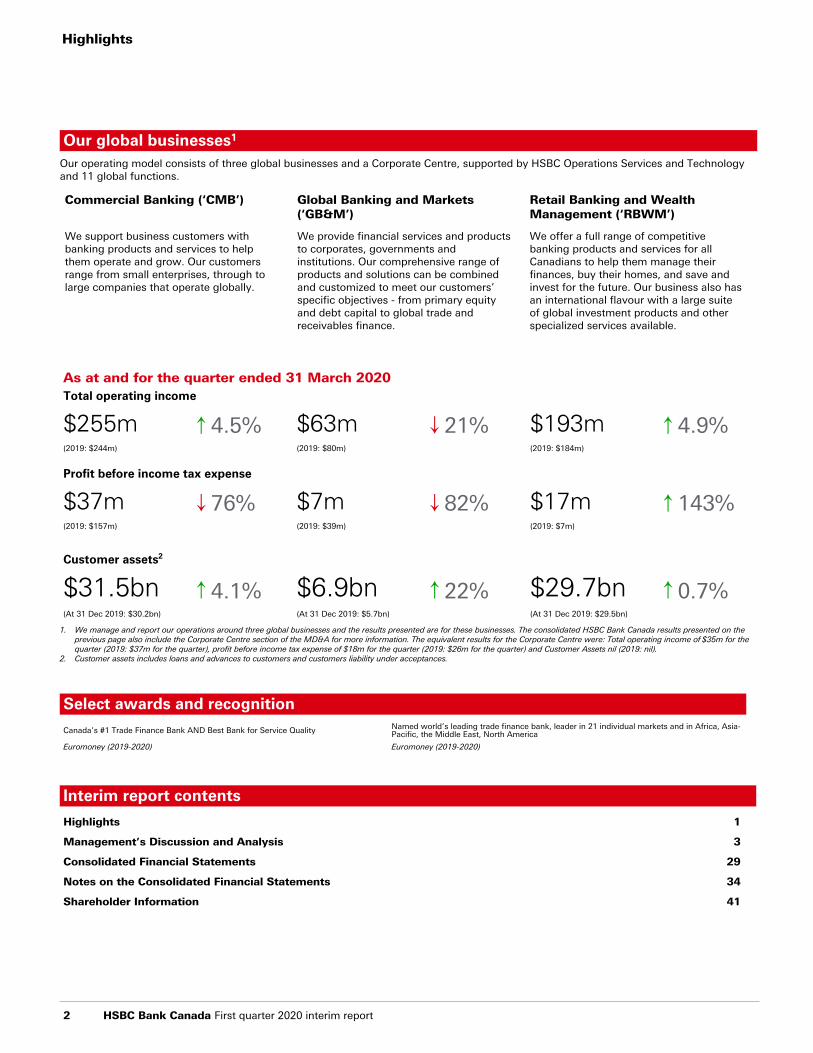
Our global businesses1
Our operating model consists of three global businesses and a Corporate Centre, supported by HSBC Operations Services and Technology and 11 global functions.
Commercial Banking (‘CMB’) Global Banking and Markets (‘GB&M’)
Retail Banking and Wealth Management (‘RBWM’)
We support business customers with banking products and services to help them operate and grow. Our customers range from small enterprises, through to large companies that operate globally.
We provide financial services and products to corporates, governments and institutions. Our comprehensive range of products and solutions can be combined and customized to meet our customers’ specific objectives - from primary equity and debt capital to global trade and receivables finance.
We offer a full range of competitive banking products and services for all Canadians to help them manage their finances, buy their homes, and save and invest for the future. Our business also has an international flavour with a large suite of global investment products and other specialized services available.
As at and for the quarter ended 31 March 2020Total operating income
$255m ↑ 4.5% $63m ↓ 21% $193m ↑ 4.9%(2019: $244m) (2019: $80m) (2019: $184m)
Profit before income tax expense
$37m ↓ 76% $7m ↓ 82% $17m ↑ 143%(2019: $157m) (2019: $39m) (2019: $7m)
Customer assets2
$31.5bn ↑ 4.1% $6.9bn ↑ 22% $29.7bn ↑ 0.7%(At 31 Dec 2019: $30.2bn) (At 31 Dec 2019: $5.7bn) (At 31 Dec 2019: $29.5bn)
1. We manage and report our operations around three global businesses and the results presented are for these businesses. The consolidated HSBC Bank Canada results presented on the previous page also include the Corporate Centre section of the MD&A for more information. The equivalent results for the Corporate Centre were: Total operating income of $35m for the quarter (2019: $37m for the quarter), profit before income tax expense of $18m for the quarter (2019: $26m for the quarter) and Customer Assets nil (2019: nil).
2. Customer assets includes loans and advances to customers and customers liability under acceptances.
Select awards and recognitionCanada’s #1 Trade Finance Bank AND Best Bank for Service Quality Named world’s leading trade finance bank, leader in 21 individual markets and in Africa, Asia-
Pacific, the Middle East, North America
Euromoney (2019-2020) Euromoney (2019-2020)
Interim report contentsHighlights 1
Management’s Discussion and Analysis 3
Consolidated Financial Statements 29
Notes on the Consolidated Financial Statements 34
Shareholder Information 41
Highlights
2 HSBC Bank Canada First quarter 2020 interim report
MD&A contentsPage
Basis of preparation 3
Caution regarding forward-looking statements 3
Who we are 3
Impact of COVID-19 and our response 4
Use of non-IFRS financial measures 4
Financial highlights 5
Financial performance 6
Movement in financial position 8
Global businesses 9
Summary quarterly performance 11
Economic review and outlook 12
Regulatory developments 13
Accounting matters 14
Off-balance sheet arrangements 14
Financial instruments 14
Disclosure controls and procedures and internal control over financial reporting 14
Related party transactions 14
Risk 15
Capital 27
Outstanding shares and dividends 27
Basis of preparationHSBC Bank Canada and its subsidiary undertakings (together ‘the bank’, ‘we’, ‘our’) is an indirectly wholly-owned subsidiary of HSBC Holdings plc (‘HSBC Holdings’). Throughout the Management’s Discussion and Analysis (‘MD&A’), the HSBC Holdings Group is defined as the ‘HSBC Group’ or the ‘Group’.
The MD&A is provided to enable readers to assess our financial condition and results of operations for the quarter ended 31 March 2020, compared to the same period in the preceding year. The MD&A should be read in conjunction with our unaudited condensed interim consolidated financial statements and related notes for the quarter ended 31 March 2020 (‘consolidated financial statements’) and our Annual Report and Accounts 2019. This MD&A is dated 24 April 2020, the date that our consolidated financial statements and MD&A were approved by our Board of Directors (‘the Board’). The references to ‘notes’ throughout this MD&A refer to notes on the consolidated financial statements for the quarter ended 31 March 2020.
The bank has prepared its consolidated financial statements in accordance with International Accounting Standard (‘IAS’) 34 ‘Interim Financial Reporting’ as issued by the International Accounting Standards Board (‘IASB’) and should be read in conjunction with the bank’s 2019 audited annual consolidated financial statements. The bank’s 2019 audited annual consolidated financial statements have been prepared in accordance with International Financial Reporting Standards (‘IFRS’) and in consideration of the accounting guidelines as issued by the Office of the Superintendent of Financial Institutions Canada (‘OSFI’), as required under Section 308(4) of the Bank Act. Certain sections within the MD&A, that are marked with an asterisk (*), form an integral part of the accompanying consolidated financial statements. The abbreviations ‘$m’ and ‘$bn’ represent millions and billions of Canadian dollars, respectively. All tabular amounts are in millions of dollars except where otherwise stated.
Our continuous disclosure materials, including interim and annual filings, are available through a link on the bank’s website at www.hsbc.ca. These documents, together with the bank’s Annual Information Form, are also available on the Canadian Securities Administrators’ website at www.sedar.com. Complete financial, operational and investor information for HSBC Holdings and the
HSBC Group, including HSBC Bank Canada, can be obtained from its website, www.hsbc.com, including copies of HSBC Holdings Annual Report and Accounts 2019. Information contained in or otherwise accessible through the websites mentioned does not form part of this report.
Caution regarding forward-looking statements
This document contains forward-looking information, including statements regarding the business and anticipated actions of the bank. These statements can be identified by the fact that they do not pertain strictly to historical or current facts. Forward-looking statements often include words such as 'anticipates', 'estimates', 'expects', 'projects', 'intends', 'plans', 'believes' and words and terms of similar substance in connection with discussions of future operating or financial performance. By their very nature, these statements require us to make a number of assumptions and are subject to a number of inherent risks and uncertainties that may cause actual results to differ materially from those contemplated by the forward-looking statements. We caution you to not place undue reliance on these statements as a number of risk factors could cause our actual results to differ materially from the expectations expressed in such forward-looking statements. The risk management section in the MD&A of our Annual Report and Accounts 2019 describes the most significant risks to which the bank is exposed and, if not managed appropriately, could have a material impact on our future financial results. These risk factors include: credit risk, liquidity and funding risk, market risk, resilience risk, regulatory compliance risk, financial crime risk, model risk and pension risk. Additional factors that may cause our actual results to differ materially from the expectations expressed in such forward-looking statements include: general economic and market conditions, fiscal and monetary policies, changes in laws, regulations and approach to supervision, level of competition and disruptive technology, changes to our credit rating, climate change risk, IBOR transition, changes in accounting standards, changes in tax rates, tax law and policy, and its interpretation by taxing authorities, and our ability to attract, develop and retain key personnel, risk of fraud by employees or others, unauthorized transactions by employees and human error. Despite contingency plans we have in place for resilience in the event of sustained and significant operational disruption, our ability to conduct business may be adversely affected by disruption in the infrastructure that supports both our operations and the communities in which we do business, including but not limited to disruption caused by public health emergencies, environmental disasters and terrorist acts. Refer to the ‘Factors that may affect future results’ section of our Annual Report and Accounts 2019 for a description of these risk factors. We caution you that the risk factors disclosed above are not exhaustive, and there could be other uncertainties and potential risk factors not considered here which may adversely affect our results and financial condition. Any forward-looking statements in this document speak only as of the date of this document. We do not undertake any obligation to, and expressly disclaim any obligation to, update or alter our forward-looking statements, whether as a result of new information, subsequent events or otherwise, except as required under applicable securities legislation.
Who we areHSBC Bank Canada is the leading international bank in the country. We help companies and individuals across Canada to do business and manage their finances here and internationally through three global businesses: Commercial Banking, Global Banking and Markets, and Retail Banking and Wealth Management. No international bank has our Canadian presence and no domestic bank has our international reach.
Management's Discussion and Analysis
HSBC Bank Canada First quarter 2020 interim report 3
Canada is an important contributor to the HSBC Group growth strategy and a key player in the Group’s work to support customers and drive growth, leveraging its footprint across all key trade corridors, including in North America, alongside the United States and Mexico, and with China.
HSBC Holdings plc, the parent company of the HSBC Group, is headquartered in London. HSBC serves customers worldwide from offices in 64 countries and territories in our geographical regions: Europe, Asia, North America, Latin America, and Middle East and North Africa. With assets of US$2,918bn at 31 March 2020, HSBC is one of the world’s largest banking and financial services organizations.
Throughout our history we have been where the growth is, connecting customers to opportunities, enabling businesses to thrive and economies to prosper, helping people fulfill their hopes and dreams and realize their ambitions.
Shares in HSBC Holdings are listed on the London, Hong Kong, New York, Paris and Bermuda stock exchanges. The HSBC Holdings shares are traded in New York in the form of American Depositary Receipts.
Impact of COVID-19 and our response
The COVID-19 outbreak, classified by the World Health Organization as a pandemic, has had and continues to have a significant impact on people, businesses, societies and economies around the world. As we prioritize the safety of our employees and customers there are a number of factors associated with the outbreak and its impact on global economies that could have a material adverse effect on financial institutions such as HSBC Bank Canada.
In Canada, Federal and Provincial governments have restricted mobility and social interaction beginning in March which has had a significant impact on economic activity. It remains unclear how long these restrictions will stay in place or evolve through 2020, and we continue to closely monitor developments. Many programs have been initiated by the Bank of Canada and Federal and Provincial governments to provide financial support to parts of the economy most impacted by the COVID-19 outbreak. The full extent of these relief programs, how they will operate, and impacts on our customers and the bank continue to evolve. We are committed to playing our part in the country’s economic recovery and are actively participating in these programs and helping our customers to do so wherever it is appropriate. We place great importance on supporting our customers who may be experiencing financial hardship through this unprecedented time and are working across all of our lines of business to offer them flexible solutions.
Banking in Canada is deemed an essential service and on 16 March 2020 we activated our well tested Business Continuity Plan (‘BCP’) to maintain services for customers across all of our lines of business. Our resiliency was aided by learnings from the earlier COVID-19 experience of HSBC operations in other parts of the world. To reduce the risk and play our part in limiting the spread and impact of this public health crisis, and by implementing new technology solutions, 93% of non-branch staff are now working from home, including many functions that were not previously equipped to do so. To address the additional stress on our people created by the isolation in this extreme environment and unusual way of operating, we have significantly increased wellness supports including for mental health and awareness raising to ensure employees take advantage. Where employees must be on site to perform critical roles, we are doing our best to maintain social distancing and have implemented precautionary measures including enhanced cleaning across all sites, protective acrylic shields and reduced hours in branch locations, and control and screening of customer entry. While provisioning for our physical sites to meet evolving
requirements, we are also accommodating the significant increase in customer usage of all of our digital channels and call centres. We are frequently reaching out to retail, commercial and corporate customers to update them on our service plans and help them manage. Finally, our COVID-19 response has included a $500,000 donation to Food Banks Canada, Breakfast Club of Canada and United Way, targeting areas of need that emerged almost immediately including food insecurity and support for the most vulnerable members of society.
The impact on financial crime risk and regulatory compliance has also been considered, and the bank remains vigilant regarding the effectiveness of our risk controls during this challenging period when malicious activities - such as cyber-attacks and fraud - tend to increase.
An immediate financial impact to the bank in the first quarter of 2020 are higher expected credit losses, primarily driven by an adverse shift in forward-looking economic scenarios used to calculate such losses. This is described in more detail in the Credit risk section of the MD&A on page 15. Should the COVID-19 outbreak continue to disrupt economic activities globally through 2020, there could be further adverse impacts to HSBC Bank Canada, including further expected credit losses. The impact of continued lower interest rates may reduce net interest income. Other potential risks include customer credit rating migration which could negatively impact our risk-weighted assets and capital position, and increased liquidity demands from customers.
We are well positioned to manage these risks. In response, the bank has increased its capital and liquidity levels. As a result, our common equity tier 1 ratio increased to 12% at 31 March 2020, compared to 11.3% at 31 December 2019 and our liquidity coverage ratio for the quarter ended 31 March 2020 increased to 156%, compared to 140% for the quarter ended 31 December 2019. These ratios are well in excess of the bank’s minimum regulatory requirements and we will continue to prudently monitor these levels during the COVID-19 pandemic.
HSBC Bank Canada is part of one of the world’s largest banking groups. Canada is a key global market for HSBC, with total assets in Canada of $125bn and US$2,918bn globally as of 31 March 2020. HSBC has a strong capital, funding and liquidity position and we are looking to continue to support the Canadian economy, our customers and wider society.
Use of non-IFRS financial measures
In measuring our performance, the financial measures that we use include those which have been derived from our reported results. However, these are not presented within the consolidated financial statements and are not defined under IFRS. These are considered non-IFRS financial measures and are unlikely to be comparable to similar measures presented by other companies. The following non-IFRS financial measures include average balances and annualized income statement figures, as noted, are used throughout this document.
Return on average common shareholder’s equity is calculated as the annualized profit attributable to the common shareholder for the period divided by average1 common equity.
Return on average risk-weighted assets is calculated as annualized profit before income tax expense divided by the average1 risk-weighted assets.
Operating leverage/jaws is calculated as the difference between the rates of change for operating income and operating expenses.
Net interest margin is net interest income expressed as an annualized percentage of average1 interest earning assets.
Management's Discussion and Analysis
4 HSBC Bank Canada First quarter 2020 interim report

Change in expected credit losses to average gross loans and advances and acceptances is calculated as the annualized change in expected credit losses2 as a percentage of average1 gross loans and advances to customers and customers’ liabilities under acceptances.
Change in expected credit losses on stage 3 loans and advances and acceptances to average gross loans and advances and acceptances is calculated as the annualized change in expected credit losses2 on stage 3 assets as a percentage of average1 gross loans and advances to customers and customers’ liabilities under acceptances.
Total stage 3 allowance for expected credit losses to gross stage 3 loans and advances and acceptances is calculated as the total allowance for expected credit losses2 relating to stage 3 loans and advances to customers and customer liabilities under acceptances as a percentage of stage 3 loans and advances to customers and customers’ liabilities under acceptances.
Net write-offs as a percentage of average customer advances and acceptances is calculated as annualized net write-offs as a percentage of average1 net customer advances and customers’ liabilities under acceptances.
The following supplementary financial measure calculated from IFRS figures as noted is used throughout this document.
Cost efficiency ratio is calculated as total operating expenses as a percentage of total operating income.
1. The net interest margin is calculated using daily average balances. All other financial measures use average balances that are calculated using quarter-end balances.
2. Change in expected credit losses relates primarily to loans, acceptances and commitments.
Financial highlights
Quarter ended
($millions, except where otherwise stated) Footnotes 31 Mar 2020 31 Mar 2019
Financial performance for the period
Total operating income 546 545
Profit before income tax expense 79 229
Profit attributable to the common shareholder 54 158
Change in expected credit losses and other credit impairment charges - (charge)/release (140) 12
Operating expenses (327) (328)
Basic and diluted earnings per common share ($) 0.11 0.32
Financial measures (%) 1
Return on average common shareholder’s equity 4.1 13.3
Return on average risk-weighted assets 2 0.7 2.3
Cost efficiency ratio 59.9 60.2
Operating leverage/jaws 0.5 (2.4)
Net interest margin 1.33 1.46
Change in expected credit losses to average gross loans and advances and acceptances 3 0.84 n/a
Change in expected credit losses on stage 3 loans and advances and acceptances to average gross loans and advances and acceptances 3 0.21 —
Total stage 3 allowance for expected credit losses to gross stage 3 loans and advances and acceptances 39.5 32.6
Net write-offs as a percentage of average loans and advances and acceptances 0.11 0.11
At
Footnotes 31 Mar 2020 31 Dec 2019
Financial position at period end
Total assets 125,474 106,571
Loans and advances to customers 63,644 61,922
Customer accounts 65,451 62,889
Ratio of customer advances to customer accounts (%) 1 97.2 98.5
Common shareholder’s equity 5,512 5,009
Capital, leverage and liquidity non-IFRS financial measures 2
Common equity tier 1 capital ratio (%) 12.0 11.3
Tier 1 ratio (%) 14.5 13.9
Total capital ratio (%) 16.9 16.4
Leverage ratio (%) 5.0 4.9
Risk-weighted assets ($m) 43,128 42,080
Liquidity coverage ratio (%) 156 140
1. Refer to the ‘Use of non-IFRS financial measures’ section of this document for a discussion of non-IFRS financial measures. 2. The bank assesses capital adequacy against standards established in guidelines issued by OSFI in accordance with the Basel III capital adequacy framework.3. n/a is shown where the bank is in a net release position resulting in a negative ratio.
HSBC Bank Canada First quarter 2020 interim report 5
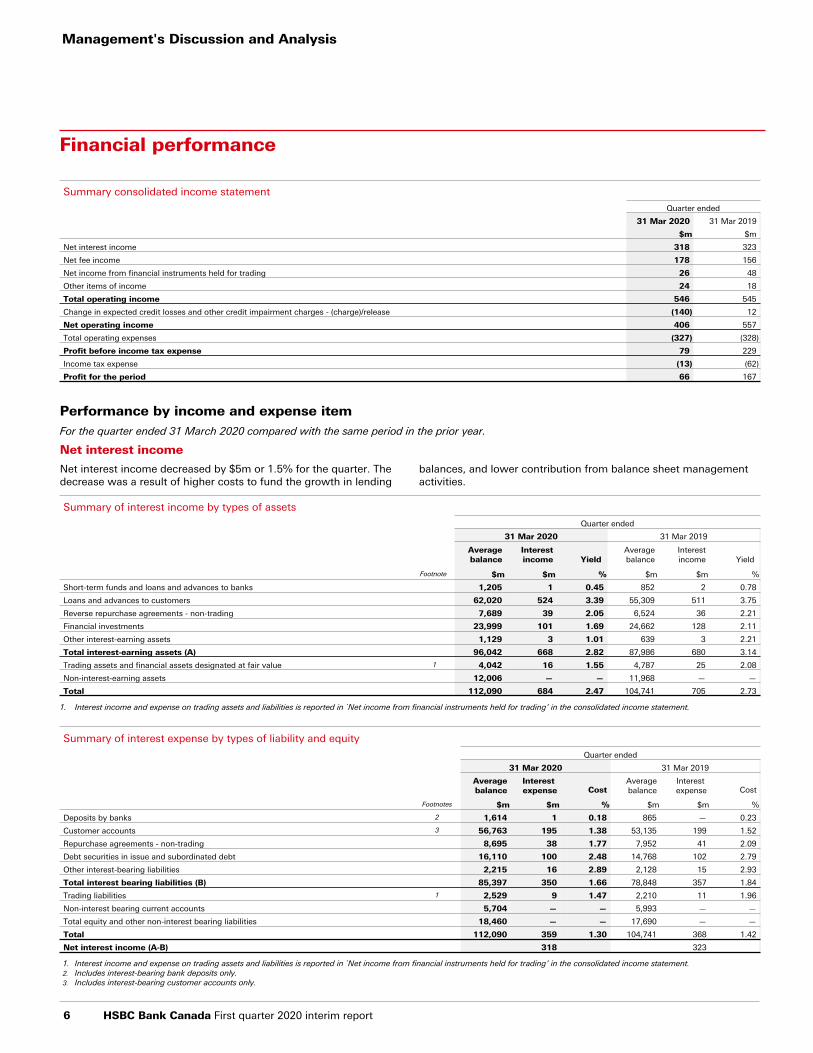
Financial performance
Summary consolidated income statement
Quarter ended
31 Mar 2020 31 Mar 2019
$m $m
Net interest income 318 323
Net fee income 178 156
Net income from financial instruments held for trading 26 48
Other items of income 24 18
Total operating income 546 545
Change in expected credit losses and other credit impairment charges - (charge)/release (140) 12
Net operating income 406 557
Total operating expenses (327) (328)
Profit before income tax expense 79 229
Income tax expense (13) (62)
Profit for the period 66 167
Performance by income and expense itemFor the quarter ended 31 March 2020 compared with the same period in the prior year.
Net interest income
Net interest income decreased by $5m or 1.5% for the quarter. The decrease was a result of higher costs to fund the growth in lending
balances, and lower contribution from balance sheet management activities.
Summary of interest income by types of assets
Quarter ended
31 Mar 2020 31 Mar 2019
Averagebalance
Interestincome Yield
Averagebalance
Interestincome Yield
Footnote $m $m % $m $m %
Short-term funds and loans and advances to banks 1,205 1 0.45 852 2 0.78
Loans and advances to customers 62,020 524 3.39 55,309 511 3.75
Reverse repurchase agreements - non-trading 7,689 39 2.05 6,524 36 2.21
Financial investments 23,999 101 1.69 24,662 128 2.11
Other interest-earning assets 1,129 3 1.01 639 3 2.21
Total interest-earning assets (A) 96,042 668 2.82 87,986 680 3.14
Trading assets and financial assets designated at fair value 1 4,042 16 1.55 4,787 25 2.08
Non-interest-earning assets 12,006 — — 11,968 — —
Total 112,090 684 2.47 104,741 705 2.73
1. Interest income and expense on trading assets and liabilities is reported in `Net income from financial instruments held for trading’ in the consolidated income statement.
Summary of interest expense by types of liability and equity
Quarter ended
31 Mar 2020 31 Mar 2019
Averagebalance
Interest expense Cost
Averagebalance
Interest expense Cost
Footnotes $m $m % $m $m %
Deposits by banks 2 1,614 1 0.18 865 — 0.23
Customer accounts 3 56,763 195 1.38 53,135 199 1.52
Repurchase agreements - non-trading 8,695 38 1.77 7,952 41 2.09
Debt securities in issue and subordinated debt 16,110 100 2.48 14,768 102 2.79
Other interest-bearing liabilities 2,215 16 2.89 2,128 15 2.93
Total interest bearing liabilities (B) 85,397 350 1.66 78,848 357 1.84
Trading liabilities 1 2,529 9 1.47 2,210 11 1.96
Non-interest bearing current accounts 5,704 — — 5,993 — —
Total equity and other non-interest bearing liabilities 18,460 — — 17,690 — —
Total 112,090 359 1.30 104,741 368 1.42
Net interest income (A-B) 318 323
1. Interest income and expense on trading assets and liabilities is reported in `Net income from financial instruments held for trading’ in the consolidated income statement.2. Includes interest-bearing bank deposits only.3. Includes interest-bearing customer accounts only.
Management's Discussion and Analysis
6 HSBC Bank Canada First quarter 2020 interim report

Net fee income
Quarter ended
31 Mar 2020 31 Mar 2019
$m $m
Account services 16 15
Broking income 4 2
Cards 18 15
Credit facilities 78 71
Funds under management 48 45
Imports/exports 2 3
Insurance agency commission 1 1
Other 14 12
Remittances 9 8
Underwriting 11 7
Fee income 201 179
Less: fee expense (23) (23)
Net fee income 178 156
Net fee income increased by $22m or 14% for the quarter. This increase was mainly driven by an increase in credit facility fees as a result of higher volumes of bankers' acceptances in Commercial
Banking, higher underwriting fees from Global Banking and Markets and an increase in average funds under management and credit card fees in Retail Banking and Wealth Management.
Net income from financial instruments held for trading
Quarter ended
31 Mar 2020 31 Mar 2019
$m $m
Trading activities 37 28
Credit valuation, debit valuation and funding fair value adjustments
(22) 4
Net interest from trading activities 7 14
Hedge ineffectiveness 4 2
Net income from financial instruments held for trading 26 48
Net income from financial instruments held for trading decreased by $22m or 46% for the quarter. This was due to unfavourable movement in credit and funding fair value adjustments mainly driven by increases in credit spreads and market volatility related to
COVID-19. Lower net interest from trading activities due to product mix also contributed to the decrease. This was partly offset by an increase in foreign exchange sales volumes and balance sheet management activities.
Other items of income
Quarter ended
31 Mar 2020 31 Mar 2019
$m $m
Gains less losses from financial investments 16 8
Other operating income 8 10
Other items of income 24 18
Other items of income increased by $6m or 33% for the quarter, driven by higher gains on the disposal of financial investments from
the re-balancing of the bank’s liquid asset portfolio.
Change in expected credit losses
Quarter ended
31 Mar 2020 31 Mar 2019
$m $m
Change in expected credit loss - performing loans (stage 1 and 2) - charge/(release) 99 (12)
Change in expected credit loss - non-performing loans (stage 3) - charge/(release) 41 —
Change in expected credit loss - charge/(release) 140 (12)
The change in expected credit losses for the quarter resulted in a charge of $140m compared to a reversal of $12m in the same period in the prior year. The charge for the quarter was primarily driven by an adverse shift in forward-looking economic scenarios related to COVID-19 impacting the performing loan portfolio.
Impairment charges from non-performing loans in the energy sector also contributed to the increase driven by a significant decline in oil prices. In 2019, there was a release of provisions against certain energy service sector customers.
HSBC Bank Canada First quarter 2020 interim report 7

Total operating expenses
Quarter ended
31 Mar 2020 31 Mar 2019
$m $m
Employee compensation and benefits 169 174
General and administrative expenses 130 131
Depreciation 20 18
Amortization and impairment of intangible assets 8 5
Total operating expenses 327 328
Total operating expenses decreased by $1m or 0.3% for the quarter as we prudently manage costs while strategically making
investments in our people and technology to grow our businesses and make it more convenient for our customers to bank with us.
Income tax expense
The effective tax rate in the first quarter of 2020 was 17.0% which is lower than the statutory tax rate of 26.7%. The decrease is a result of remeasurement of required tax liabilities. The effective tax rate for the first quarter of 2019 was 27.1%.
Movement in financial position
Summary consolidated balance sheet
At
31 Mar 2020 31 Dec 2019
$m $m
Assets
Cash and balances at central bank 4,159 54
Trading assets 5,212 4,322
Derivatives 9,009 3,267
Loans and advances 64,731 63,091
Reverse repurchase agreements – non-trading 6,523 6,269
Financial investments 23,262 23,645
Customers’ liability under acceptances 4,461 3,500
Other assets 8,117 2,423
Total assets 125,474 106,571
Liabilities and equity
Liabilities
Deposits by banks 3,978 1,036
Customer accounts 65,451 62,889
Repurchase agreements – non-trading 8,151 7,098
Trading liabilities 2,907 2,296
Derivatives 9,334 3,431
Debt securities in issue 16,615 14,594
Acceptances 4,474 3,505
Other liabilities 7,952 5,613
Total liabilities 118,862 100,462
Total shareholder’s equity 6,612 6,109
Total liabilities and equity 125,474 106,571
AssetsTotal assets at 31 March 2020 were $125.5bn, an increase of $18.9bn or 18% from 31 December 2019. Derivatives increased by $5.7bn as a result of the mark-to-market changes from both foreign exchange and interest rates due to market volatility mainly from the impact of COVID-19. Increases in settlement balances from timing of customer facilitation trades contributed to the increase in other assets of $5.7bn. Due to the impact of COVID-19, the bank strengthened its liquidity position to support our customers. Placement of these funds increased our cash and balances at central banks to $4.1bn. Customers’ liability under acceptances increased by $1.0bn as a result of higher volumes of acceptances sold to the market.
LiabilitiesTotal liabilities at 31 March 2020 were $118.9bn, an increase of $18.4bn or 18% from 31 December 2019. Derivatives increased by $5.9bn which corresponds with the movement within assets. Deposits by banks increased by $2.9bn. Customer accounts
increased by $2.6bn as result of deposit growth in all global businesses. Increases in settlement balances from timing of customer facilitation trades contributed to the increase in other liabilities of $2.3bn. In addition, higher repurchase volumes led to an increase in non-trading repurchase agreements of $1.1bn. Acceptances increased by $1.0bn as a result of higher volumes of acceptances sold to the market.
EquityTotal equity at 31 March 2020 was $6.6bn, an increase of $0.5bn or 8.2% from 31 December 2019. The increase represents profits after tax of $0.1bn generated in the period, gains of $0.1bn recorded on account of financial assets at fair value through other comprehensive income and cash flow hedges and $0.5bn from the issuance of common shares. The increase was offset by dividends of $0.2bn declared in the period.
Management's Discussion and Analysis
8 HSBC Bank Canada First quarter 2020 interim report

Global businessesWe manage and report our operations around the following global businesses: Commercial Banking, Global Banking and Markets, and Retail Banking and Wealth Management.
Commercial BankingCommercial Banking (‘CMB’) offers a full range of commercial financial services and tailored solutions to customers ranging from small enterprises focused primarily on the domestic markets to corporates operating globally.
Review of financial performance1
Summary income statement
Quarter ended
31 Mar 2020 31 Mar 2019
$m $m
Net interest income 151 151
Non-interest income 104 93
Total operating income 255 244
Change in expected credit losses and other credit impairment charges - (charge)/release (117) 14
Net operating income 138 258
Total operating expenses (101) (101)
Profit before income tax expense 37 157
Overview
Total operating income increased by $11m or 4.5% for the quarter, beginning the year with continued momentum as we focused on increasing market share, deepening relationships with existing customers and leveraging our global network and products. However, beginning in March, central bank rate cuts related to COVID-192 had a negative impact on income with lower deposit margins as a result of the lower rates.
COVID-19 and declines in the oil price have impacted impairment charges in the first quarter. We continue to support existing customers with their working capital needs, including offering payment deferrals to help customers through the current crisis.
Profit before income tax was $37m, a decrease of $120m or 76% for the quarter, primarily due to a significant increase in charges in expected credit losses for this quarter.
Financial performance by income and expense item
Net interest income for the quarter remained flat. This reflects lower margins as a result of central bank rate decreases offset by higher loans and advances as CMB continues to support customers through the current crisis.
Non-interest income for the quarter increased by $11m or 12% driven primarily by higher facility fees.
Change in expected credit losses resulted in a charge of $117m for the quarter, primarily driven by an adverse shift in forward-looking economic scenarios related to COVID-19 and certain energy sector accounts. For 2019, the change in expected credit losses was a release of $14m, as a result of reversals relating to non-performing loans, mostly from certain accounts in the energy sector.
Total operating expenses for the quarter remained flat even as we prudently manage costs and we continue to make strategic investments to support business growth.
1. For the quarter ended 31 March 2020 compared with the same period in the prior year. 2. Refer to ‘Impact of COVID-19 and our response’ section of the MD&A for further details.
Global Banking and MarketsGlobal Banking and Markets (‘GB&M’) provides tailored financial services and products to major government, corporate and institutional customers worldwide.
Review of financial performance1
Summary income statement
Quarter ended
31 Mar 2020 31 Mar 2019
$m $m
Net interest income 33 24
Non-interest income 30 56
Total operating income 63 80
Change in expected credit losses and other credit impairment charges - (charge)/release (14) (1)
Net operating income 49 79
Total operating expenses (42) (40)
Profit before income tax expense 7 39
Overview
GB&M’s total operating income decreased by $17m or 21% for the quarter, due to unfavourable credit and funding valuation movements as a result of increases in credit spreads and market volatility driven by COVID-19.
Throughout the COVID-19 related disruptions and volatile market
conditions, the Banking and Markets teams worked closely with our clients to understand their unique challenges and to support them through the crisis. This increased client activity and income across all products, mainly from Markets trading and sales activities, lending activities and underwriting fees.
We continue to leverage the Group's global network to provide
HSBC Bank Canada First quarter 2020 interim report 9

products and solutions to meet our global clients' needs.
Profit before income tax decreased by $32m or 82% for the quarter, due to credit and funding adjustments and higher charges in expected credit losses for the period.
Financial performance by income and expense itemNet interest income for the quarter increased by $9m or 38%. This was mainly due to a decrease in funding costs of Markets trading activities and an increase in lending activities.
Non-interest income for the quarter decreased by $26m or 46%,
primarily due to unfavourable movement in credit and funding valuations. This was partly offset by strong Markets sales and trading activities and higher underwriting fees.
Change in expected credit losses resulted in an increase of $13m in charges for the quarter primarily driven by an adverse shift in forward-looking economic scenarios related to COVID-19.
Total operating expenses for the quarter increased by $2m or 5%, mainly due to streamlining initiatives offset by lower staff costs.
1. For the quarter ended 31 March 2020 compared with the same period in the prior year.
Retail Banking and Wealth ManagementRetail Banking and Wealth Management (‘RBWM’) offers a full range of competitive banking products and services for all Canadians to help them manage their finances, buy their homes, and save and invest for the future. Our business also has an international flavour with a large suite of global investment products and other specialized services available.
Review of financial performance1
Summary income statement
Quarter ended
31 Mar 2020 31 Mar 2019
$m $m
Net interest income 125 126
Non-interest income 68 58
Total operating income 193 184
Change in expected credit losses and other credit impairment charges - (charge)/release (9) (1)
Net operating income 184 183
Total operating expenses (167) (176)
Profit before income tax expense 17 7
Overview
Total operating income increased by $9m or 4.9% for the quarter. Higher fee income and strong volume growth in lending and deposit balances were partly offset by lower spreads due to the central bank rate decreases.
Investments in our branches and digital technologies, along with competitive products, resulted in continued momentum in growing our customer base and total relationship balances2. Despite the challenging outlook under COVID-19, we have continued to serve our customers and support them through various initiatives including payment deferral and fee reductions.
Profit before income tax expense increased by $10m or 143% for the quarter due to higher operating income as noted and lower operating expenses, partly offset by an increase in charge in expected credit losses due to the impact of COVID-19.
Financial performance by income and expense item
Net interest income for the quarter was marginally lower by $1m or 0.8% as higher volume growth in lending and deposits were offset by lower spreads as a result of central bank rate decreases.
Non-interest income for the quarter increased by $10m or 17%, due to higher average funds under management, credit cards fees and higher income from the online broker business.
Change in expected credit losses resulted in an $8m increase in charges for the quarter primarily driven by an adverse shift in forward-looking economic scenarios related to COVID-19.
Total operating expenses for the quarter decreased by $9m or 5.1%. This was primarily due to timing of certain expenses and streamlining initiatives partly offset by strategic investments to grow our business.
1. For the quarter ended 31 March 2020 compared with the same period in the prior year.2. Total relationship balances includes lending, deposits and wealth balances.
Corporate CentreCorporate Centre contains Balance Sheet Management; interests in associates and joint ventures; and other transactions which do not directly relate to our global businesses.
Review of financial performance1
Summary income statement
Quarter ended
31 Mar 2020 31 Mar 2019
$m $m
Net interest income 9 22
Non-interest income 26 15
Net operating income 35 37
Total operating expenses (17) (11)
Profit before income tax expense 18 26
Management's Discussion and Analysis
10 HSBC Bank Canada First quarter 2020 interim report
Overview
Net operating income for the quarter decreased by $2m or 5.4%. The decrease was primarily due to lower net interest income from balance sheet management activities and the negative impact from lower yields. This was partly offset by higher gains on the disposal of financial investments compared to the prior year.
Operating expenses for the quarter increased by $6m or 55%, primarily due to investments in our support functions.
The impact of these movements decreased profit before income tax expense by $8m or 31% for the quarter.
1. For the quarter ended 31 March 2020 compared with the same period in the prior year.
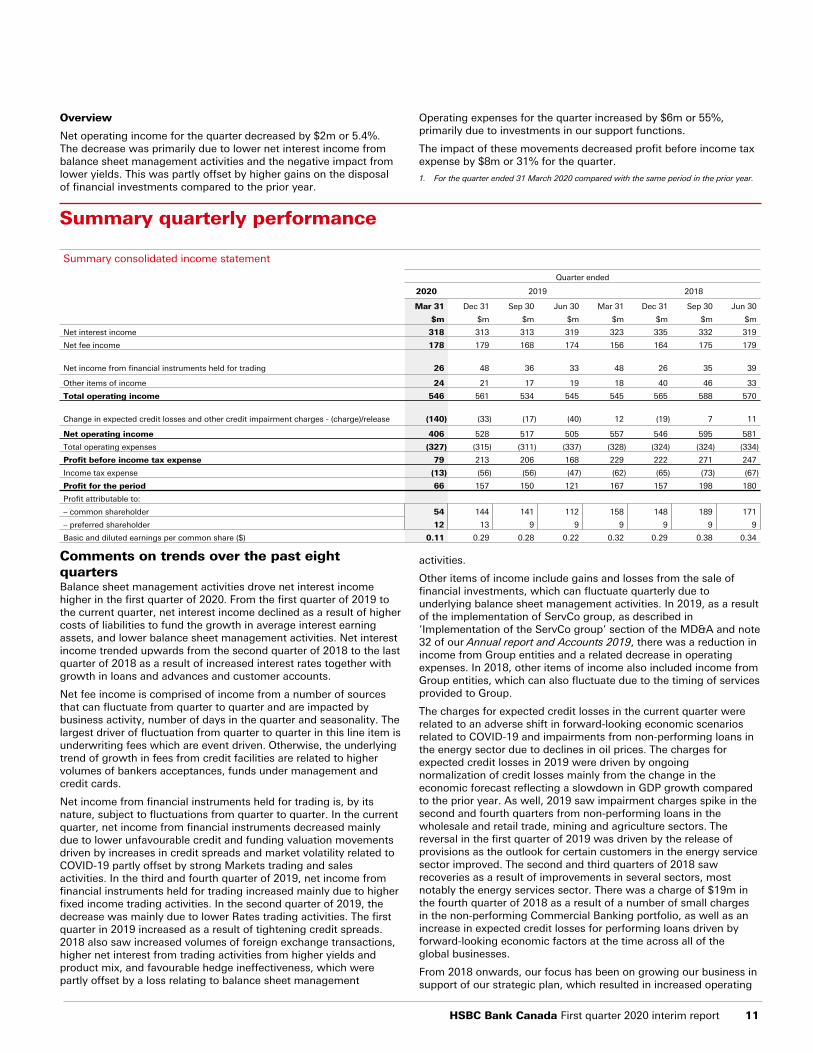
Summary quarterly performance
Summary consolidated income statement
Quarter ended
2020 2019 2018
Mar 31 Dec 31 Sep 30 Jun 30 Mar 31 Dec 31 Sep 30 Jun 30
$m $m $m $m $m $m $m $m
Net interest income 318 313 313 319 323 335 332 319
Net fee income 178 179 168 174 156 164 175 179
Net income from financial instruments held for trading 26 48 36 33 48 26 35 39
Other items of income 24 21 17 19 18 40 46 33
Total operating income 546 561 534 545 545 565 588 570
Change in expected credit losses and other credit impairment charges - (charge)/release (140) (33) (17) (40) 12 (19) 7 11
Net operating income 406 528 517 505 557 546 595 581
Total operating expenses (327) (315) (311) (337) (328) (324) (324) (334)
Profit before income tax expense 79 213 206 168 229 222 271 247
Income tax expense (13) (56) (56) (47) (62) (65) (73) (67)
Profit for the period 66 157 150 121 167 157 198 180
Profit attributable to:
– common shareholder 54 144 141 112 158 148 189 171
– preferred shareholder 12 13 9 9 9 9 9 9
Basic and diluted earnings per common share ($) 0.11 0.29 0.28 0.22 0.32 0.29 0.38 0.34
Comments on trends over the past eight quartersBalance sheet management activities drove net interest income higher in the first quarter of 2020. From the first quarter of 2019 to the current quarter, net interest income declined as a result of higher costs of liabilities to fund the growth in average interest earning assets, and lower balance sheet management activities. Net interest income trended upwards from the second quarter of 2018 to the last quarter of 2018 as a result of increased interest rates together with growth in loans and advances and customer accounts.
Net fee income is comprised of income from a number of sources that can fluctuate from quarter to quarter and are impacted by business activity, number of days in the quarter and seasonality. The largest driver of fluctuation from quarter to quarter in this line item is underwriting fees which are event driven. Otherwise, the underlying trend of growth in fees from credit facilities are related to higher volumes of bankers acceptances, funds under management and credit cards.
Net income from financial instruments held for trading is, by its nature, subject to fluctuations from quarter to quarter. In the current quarter, net income from financial instruments decreased mainly due to lower unfavourable credit and funding valuation movements driven by increases in credit spreads and market volatility related to COVID-19 partly offset by strong Markets trading and sales activities. In the third and fourth quarter of 2019, net income from financial instruments held for trading increased mainly due to higher fixed income trading activities. In the second quarter of 2019, the decrease was mainly due to lower Rates trading activities. The first quarter in 2019 increased as a result of tightening credit spreads. 2018 also saw increased volumes of foreign exchange transactions, higher net interest from trading activities from higher yields and product mix, and favourable hedge ineffectiveness, which were partly offset by a loss relating to balance sheet management
activities.
Other items of income include gains and losses from the sale of financial investments, which can fluctuate quarterly due to underlying balance sheet management activities. In 2019, as a result of the implementation of ServCo group, as described in ‘Implementation of the ServCo group’ section of the MD&A and note 32 of our Annual report and Accounts 2019, there was a reduction in income from Group entities and a related decrease in operating expenses. In 2018, other items of income also included income from Group entities, which can also fluctuate due to the timing of services provided to Group.
The charges for expected credit losses in the current quarter were related to an adverse shift in forward-looking economic scenarios related to COVID-19 and impairments from non-performing loans in the energy sector due to declines in oil prices. The charges for expected credit losses in 2019 were driven by ongoing normalization of credit losses mainly from the change in the economic forecast reflecting a slowdown in GDP growth compared to the prior year. As well, 2019 saw impairment charges spike in the second and fourth quarters from non-performing loans in the wholesale and retail trade, mining and agriculture sectors. The reversal in the first quarter of 2019 was driven by the release of provisions as the outlook for certain customers in the energy service sector improved. The second and third quarters of 2018 saw recoveries as a result of improvements in several sectors, most notably the energy services sector. There was a charge of $19m in the fourth quarter of 2018 as a result of a number of small charges in the non-performing Commercial Banking portfolio, as well as an increase in expected credit losses for performing loans driven by forward-looking economic factors at the time across all of the global businesses.
From 2018 onwards, our focus has been on growing our business in support of our strategic plan, which resulted in increased operating
HSBC Bank Canada First quarter 2020 interim report 11
expenses. These investments continued in the first quarter of 2020. In 2019, these investments were partly offset by a decrease in employee compensation and benefits and general and administrative expenses as a result of the implementation of ServCo group, as described in the ‘Implementation of the ServCo group’ section of the MD&A and note 32 of our Annual report and Accounts 2019. In 2018, investments were partly offset by lower costs associated with a reduction in office space and leveraging the scale of centralizing specific business activities throughout the Group. The
timing of expenses incurred in 2018 led to variances between the quarters.
Economic review and outlookThe predictions and forecasts in this section are based on information and assumptions from sources we consider reliable. If this information or these assumptions are not accurate, actual economic outcomes may differ materially from the outlook presented in this section.
The Canadian economy was already slowing down heading into 2020, with GDP growth of 1.1% in the third quarter and 0.3% in fourth quarter of 2019. The performance of the economy was weak enough to prompt the Bank of Canada (‘BoC’) to adopt a dovish policy stance in January 2020.
The economy was subsequently hit by three shocks. The first shock was the blockade of key rail lines that impeded rail transportation through much of February, affected supply chains, and led to backups in inbound and outbound traffic at ports on the east and west coasts. The second shock was COVID-19, and the efforts to slow infection rates that prompted widespread declines in economic activity. The third shock was the sharp decline in oil prices in early March that represents a significant negative trade shock for the Canadian economy.
There are already signs of the severity of the impact of these shocks on the economy, particularly the disruptions linked to COVID-19 and the drop in oil prices. First, widespread layoffs and shutdowns following government and health authority guidance to slow the spread of COVID-19 resulted in employment falling by over one million in the month of March. The drop in employment was almost 10 times the prior largest monthly drop in January 2009. In addition, total hours worked fell by 15.1% with some industries, such as food services, accommodation, entertainment and education falling by 30% or more in the month.
Meanwhile, the unemployment rate rose to 7.8% in March, up from 5.6%, the largest percentage point increase on record. However, the increase in the jobless rate does not fully reflect the sudden weakness in the labour market, as almost half of those who lost their job in March left the labour force and thus were not counted as unemployed. Overall, more than four million Canadians have applied for some form of unemployment assistance, be it regular employment insurance, or the Canada Emergency Response Benefit, a federal program to support those who have lost income due to COVID-19. Other countries have also experienced sudden job market weakness. For example, in the US, initial jobless claims topped 6.6 million in late March/early April. As well, in Norway, over a two week period in March, the unemployment rate rose from 2.0% to 10.4%.
Second, consistent with the sudden job market weakness, consumer confidence declined sharply. The Conference Board of Canada reported that its measure of consumer confidence fell by 32 points in March, its largest one-month drop on record and subsequently fell to its lowest point on record in April.
Third, business confidence has declined sharply. The Canadian Federation of Independent Businesses measure of small- and medium-sized business sentiment posted its largest drop on record from 60.5 to 30.8 in March. Such a decline in business confidence is unprecedented. A small increase in April does not change the
perception that business confidence is at its lowest level in more than 10 years. Meanwhile, an indicator of small business capital expenditures remains at historic lows, suggesting that business investment slowed sharply late in the first quarter and remained weak into the second quarter.
In particular, firms in the oil patch pulled back on capital expenditure plans for 2020, reflecting that oil prices have declined by over 80% since early January, including an initial 30% drop in early March as the Organization of the Petroleum Exporting Countries (‘OPEC’), and its non-OPEC partners, failed to reach agreement to limit oil production. That said, despite an agreement on the 13th of April by OPEC and its partners to cut production by 9.7 million barrels of oil per day, downward pressure on oil prices remained severe amid heightened global economic uncertainty, and as storage facilities are reaching capacity. Even though Canada was not party to the agreement to lower oil production, record low oil prices, nonetheless, have led several domestic producers to reduce output. Tensions in the oils sector are seen lingering in coming months, even though oil prices are expected to recover as economic activity rebounds as COVID-19 restrictions ease.
These developments represent major shocks to the Canadian economic outlook. As a result, we have lowered our forecasts for GDP in 2020. We now look for GDP to decline by 3.0% in the first quarter, with the greatest impact of recent shocks to be observed in the second quarter, where we look for the economy to decline by an unprecedented 22.2%.
After COVID-19, a debt hangover loomsEven though we anticipate a rebound in economic activity with GDP growth in the second half of the year, we nonetheless, expect the economy to contract by 3.4% in 2020. Prior to these shocks hitting the economy, we had projected GDP growth of 1.5% this year. We look for the economy to grow by 1.9% in 2021.
Our forecast of moderate growth next year reflects a view that consumption would not be able to provide the same degree of lift as it has over the past decade. This is because the sudden rise in joblessness, and the loss of income happens at a time when many households were already facing heightened challenges in managing their finances. Even though the job market had been strong before the shocks and wages were rising, consumer insolvencies were on the rise reflecting heightened financial strains. There has been growing concern that high household debt levels, combined with a household debt service ratio that was a record high of 15% of disposable income, had left many households vulnerable to an income shock. In our view, there is a strong possibility that consumer insolvencies will rise sharply in coming months, and this will constrain consumer spending through 2021.
Policy responsePolicymakers have responded quickly to the shocks that have hit the Canadian economy, including coordinated, and independent actions by the BoC, the Federal Government, provincial governments and the Office of the Superintendent of Financial Institutions (‘OSFI’).
The BoC has cut its policy rate by 150 basis points to 0.25%, and initiated several facilities to support financial and credit market liquidity. For example, the BoC has created a new Bankers’ Acceptance Purchase Facility, a Commercial Paper Purchase Facility, a Provincial Money Market Purchase Program, and indicated that it would activate its Contingent Term Repo Facility - a facility that would deal with severe market-wide liquidity problems.
The BoC has also begun to buy Government of Canada debt in the amount of $5bn per week, across the yield curve, an asset purchase program that is a form of quantitative easing. The BoC has also announced that it would buy $50bn of provincial bonds and $10bn of corporate bonds. Together these programs and facilities have resulted in the BoC’s balance sheet increasing to almost 12% of GDP, up from 5.3% at the end of 2019.
Management's Discussion and Analysis
12 HSBC Bank Canada First quarter 2020 interim report

The Federal Government has introduced a fiscal package of $274bn (11.9% of 2019 GDP), to support households and businesses. The package includes the Canada Emergency Response Benefit, an income support program that will provide $2,000 to workers whose income has been negatively affected by COVID-19, enhanced other benefits to individuals and income tax payments were deferred.
For businesses, the Federal Government has introduced the Canada Emergency Wage Subsidy to provide a 75% wage subsidy to eligible businesses, in the hope that firms would maintain employment levels and limit further payroll reductions.
In addition, the Federal Government has deferred business taxes, as well as GST and customs duty remittances. Meanwhile, in cooperation with Export Development Program and the Business Development Bank of Canada, the Federal Government has set up a program for loans and loan guarantees to support lending to eligible businesses. Also, to support lending, the Office of the Superintendent of Financial Institutions has also lowered the capital requirements for banks, freeing up to $300bn.
Provincial governments responded quickly announcing over $40bn in support for individuals and businesses, in the form of income support and tax deferrals either in addition to, or to enhance federal programs.
We anticipate further federal measures to be announced in the coming months, as Finance Minister Bill Morneau said that the government would do “whatever it takes” to protect the Canadian economy. For example, he has indicated that support for specific industries — including oil and gas, airlines, and hospitality — are under consideration.
Regulatory developmentsLike all Canadian financial institutions, we face an increasing pace of regulatory change. The summary of some key regulatory changes with the potential to impact our results or operations are described in the ‘Regulatory developments’ section of our Annual report and Accounts 2019. The following is a summary of some key regulatory changes announced in the first quarter of 2020 with the potential to impact our results or operations:
Regulatory response to COVID-19In March 2020, the Canadian government and financial institution regulators introduced many new measures to keep the financial system resilient and well capitalized in the face of the COVID-19 pandemic. These measures in turn allow the bank to keep deposits and needed credit available to customers during this unprecedented time.
Office of the Superintendent of Financial Institutions (‘OSFI’)A suite of temporary adjustments to existing capital, leverage and liquidity requirements were introduced on 27 March 2020 and 9 April 2020. We have been closely following these updates and assessing their requirements and impacts to our capital and liquidity measures. Updates include:
• Loans subject to mortgage payment deferrals will not be considered past due and will continue to be treated as performing loans under the Capital Adequacy Requirements (‘CAR’) Guideline;
• New transitional arrangements for capital treatment of expected loss provisioning so that, in line with other jurisdictions, a portion of allowances that would otherwise be included in Tier 2 capital to instead be included in Common Equity Tier 1 (‘CET1’) capital. The adjustment is dynamically measured as the increase in stage 1 and stage 2 allowances relative to the baseline level as at 31 December 2019, after tax effects and subject to a scaling factor of 70% in 2020, 50% in 2021 and 25% in 2022;
• Covered bond limit temporarily increased to enable greater access to Bank of Canada facilities;
• OSFI is encouraging deposit taking institutions to use their Leverage Ratio Buffers that are held above the authorized leverage ratio of the institution;
• For leverage ratio, central bank reserves and sovereign-issued securities that qualify as High Quality Liquid assets (‘HQLA’) under the Liquidity Adequacy Requirements (‘LAR’) Guideline can be temporarily excluded from the leverage ratio exposure measure, until 30 April 2021;
• Allowing the use of banks’ HQLA, thereby falling below 100% level in the Liquidity Adequacy Requirements (‘LAR’) guideline, as maintaining the Liquidity Coverage Ratio (‘LCR’) at 100% under such circumstances could produce undue negative effects on the institution and other market participants;
• Delaying the domestic implementation of the remaining measures of the Basel III international capital standard until 2023 consistent with the decision of the Basel Committee's oversight body, the Group of Central Bank Governors and Heads of Supervision (‘GHOS’) made on 27 March 2020. The revisions to the Standardized Approach and Internal Ratings Based Approach to credit risk, the operational risk framework, and the leverage ratio framework, the introduction of a more risk sensitive capital floor, and the revised Pillar 3 disclosure requirements are all being delayed to the first quarter of 2023. The standard on the minimum capital requirements for market risk with the completion of the fundamental review of the trading book (‘FRTB’) project, and the revised credit valuation adjustment (‘CVA’) risk framework are being delayed to first quarter of 2024.
• Lowering the capital floor factor from 75% to 70%, which is expected to stay in place until the domestic implementation of the capital floor as part of Basel III reforms in first quarter of 2023.
• Delaying the timing for the implementation of the Small and Medium Sized Banks (‘SMSB’) Capital and Liquidity framework to the beginning of the first quarter of 2023. OSFI will also delay the consultation work on Pillar 2 and Pillar 3 capital and liquidity requirements for SMSBs.
• OSFI is suspending all of its consultations and policy development on new or revised guidance until conditions stabilize.
Other regulators
The bank’s other regulators, including the Canada Deposit Insurance Corporation (‘CDIC’), Financial Consumer Agency of Canada (‘FCAC’), Securities regulators and Financial Transactions and Reports Analysis Centre of Canada (‘FINTRAC’) have offered financial institutions relief from and flexibility in meeting certain day-to-day compliance obligations which have arisen as a result of COVID-19. Many have delayed or are considering delaying the implementation of previously planned regulatory changes, such as the new Financial Consumer Framework and the second phase of CDIC’s modernization initiative. These measures will also allow banks, including HSBC Bank Canada to focus resources on responding to the needs of customers during the pandemic.
Notwithstanding the relaxation of certain regulatory obligations, we continue to maintain our core Financial Crime Compliance and Fraud policies and have a process in place to document any temporary exceptions in line with regulatory expectations.
Government of CanadaThe Federal Government has also announced a number of new economic relief initiatives to assist financial institutions in response to COVID-19. We are actively participating in these programs and helping our customers to do so wherever it is appropriate. Programs include the following:
HSBC Bank Canada First quarter 2020 interim report 13
• A revised ‘Insured Mortgage Purchase Program’ through which the government will purchase up to $150bn of insured mortgage pools through the Canada Mortgage and Housing Corporation;
• The ‘Canada Emergency Business Account’ to be implemented by eligible financial institutions, including HSBC Bank Canada, with funding from Export Development Canada to provide interest-free loans of up to $40,000 to qualifying small businesses and not-for-profits to help cover COVID-19 related revenue loss; and
• ‘Small and Medium-sized Enterprise Loan and Guarantee’, through which up to $6.25m of new operating credit and cash flow term loans made by financial institutions to small and medium-sized businesses will be guaranteed by Export Development Canada.
Bank of Canada The Bank of Canada has provided additional liquidity support to financial institutions by establishing a new Standing Term Liquidity Facility (‘STLF’) and Bankers’ Acceptance Purchase Facility as well as expanding the range of eligible collateral under their Term Repo Facility to help banks better manage their liquidity risks and continue to provide their customers with access to credit.
Consumer protectionCanadian securities regulators have published proposed rule changes designed to protect vulnerable clients who may lack mental capacity or are being financially exploited. These include new obligations to place holds on customer transactions and establish a Trusted Contact Person (‘TCP’) for clients who can be contacted when diminished capacity or exploitation is suspected.
Open bankingOn 31 January 2020, the Department of Finance’s Advisory Committee on Open Banking released its report recommending that the government move forward with measures to enable Open Banking in Canada. The Committee called for technical standards to be established by industry but with government oversight to ensure fairness and consumer protection. Open Banking has the potential to drive changes to traditional bank business models.
Prudential regulatory reform
Liquidity risk
Revisions to OSFI Liquidity Adequacy Requirements (‘LAR’) Guideline targeted the treatment of certain retail deposits in the Liquidity Coverage Ratio and Net Cumulative Cash Flow came into effect on 1 January 2020. For further details, refer to the ‘liquidity and funding risk’ section of the MD&A.
Accounting mattersThe bank’s results are sensitive to the accounting policies that underlie the preparation of our consolidated financial statements. A summary of our significant accounting policies are provided in note 2 of our Annual Report and Accounts 2019.
The preparation of financial information requires the use of estimates and judgments about future conditions and are contained in the ‘Critical accounting estimates and judgments’ section of the Management’s Discussion and Analysis of our Annual Report and Accounts 2019.
Off-balance sheet arrangementsAs part of our banking operations, we enter into a number of off-balance sheet financial transactions that have a financial impact, but may not be recognized in our financial statements. These types of arrangements are contingent and may not necessarily, but in certain circumstances could, involve us incurring a liability in excess of
amounts recorded in our consolidated balance sheet. These arrangements include guarantees and letters of credit and are described in the ‘Off-balance sheet arrangements’ section of our Annual report and Accounts 2019.
Financial instrumentsDue to the nature of the bank’s business, financial instruments compose a large proportion of our balance sheet, from which the bank can earn profits in trading, interest, and fee income. Financial instruments include, but are not limited to, cash, customer accounts, securities, loans, acceptances, hedging and trading derivatives, repurchase agreements, securitization liabilities and subordinated debt. We use financial instruments for both non-trading and trading activities. Non-trading activities include lending, investing, hedging and balance sheet management. Trading activities include the buying and selling of securities and dealing in derivatives and foreign exchange as part of facilitating client trades and providing liquidity and, to a lesser extent, market making activity.
Financial instruments are accounted for according to their classification which involves the use of judgment. A detailed description of the classification and measurements of financial instruments is included in note 2 of our Annual Report and Accounts 2019.
The use of financial instruments has the potential of exposing the bank to, or mitigating against, market, credit and/or liquidity risks. A detailed description of how the bank manages these risks can be found in the Risk section of our Annual Report and Accounts 2019.
Disclosure controls and procedures and internal control over financial reporting
The Chief Executive Officer (‘CEO’) and Chief Financial Officer (‘CFO’) have signed certifications relating to the appropriateness of the financial disclosures in interim filings with the Canadian Securities Administrators, including this MD&A and the accompanying consolidated financial statements for the quarter ended 31 March 2020. The CEO and CFO are responsible for the design and maintenance of disclosure controls and procedures and internal controls over financial reporting to provide reasonable assurance regarding the reliability of financial reporting in accordance with IFRS. There have been no changes in internal controls over financial reporting during the quarter ended 31 March 2020 that have materially affected or are reasonably likely to affect internal control over financial reporting.
Related party transactionsWe enter into transactions with other HSBC affiliates, as part of the normal course of business, such as banking, short-term borrowing and operational services. In particular, as a member of one of the world’s largest financial services organizations, we share in the expertise and economies of scale provided by the HSBC Group. We provide and receive services or enter into transactions with a number of HSBC Group companies, including sharing in the cost of development for technology platforms used around the world and benefit from worldwide contracts for advertising, marketing research, training and other operational areas.
These related party transactions are on terms similar to those offered to non-related parties and are subject to formal approval procedures. Further details can be found in note 30 of our Annual Report and Accounts 2019.
Management's Discussion and Analysis
14 HSBC Bank Canada First quarter 2020 interim report

On 30 March 2020, the bank issued an additional 50,000,000 common shares to HSBC Overseas Holdings (UK) Limited. Further details can be found in the ‘Outstanding shares and dividends’ section of the MD&A.
As a wholly-owned subsidiary, all of our common shares are indirectly held by HSBC Holdings.
RiskRefer to the ‘Risk Management’ section of our Annual Report and Accounts 2019 for a description of how the bank manages risk across the organization and across all risk types, outlining the key principles, policies and practices that we employ in managing material risks, both financial and non-financial.
Like many organizations, COVID-19 is impacting our business operations, employees, customers and suppliers. A summary of the impact is covered in ‘Impact of COVID-19 and our response’ section of the MD&A on page 4 and in the relevant sections as appropriate.
Credit riskCredit risk is the risk of financial loss if a customer or counterparty fails to meet an obligation under contract. Credit risk arises principally from direct lending, trade finance and the leasing business, but also from other products such as guarantees and credit derivatives.
Credit risk profilePage
COVID-19 impact on credit risk and measurement uncertainty on ECL estimates 15
Summary of credit risk 16
Reconciliation of allowances for loans and advances to banks and customers including loan commitments and financial guarantees 18
Credit quality of financial instruments 18
Wholesale lending 21
Personal lending 22
Credit-impaired loans 24
A summary of our current policies and practices for the management of credit risk is set out in ‘Credit risk management’ on page 31 of the Annual Report and Accounts 2019. No changes were made to the policies and practices for the management of credit risk in 2020, except for enhancements made to assess the impact of COVID-19 on expected credit losses which is disclosed in the following sections.
COVID-19 impact on credit risk and measurement uncertainty on ECL estimatesThe recognition and measurement of expected credit loss (‘ECL’) involves the use of judgment and estimation. We form multiple economic scenarios based on economic forecasts known as consensus economic scenarios, apply these assumptions to credit risk models to estimate future credit losses, and probability-weight the results to determine an unbiased ECL estimate. Refer to the ‘Measurement uncertainty and sensitivity analysis of ECL estimates’ section of our Annual Report and Accounts 2019 for a detailed methodology and description of consensus economic scenarios.
The COVID-19 pandemic has had, and continues to have, an unprecedented impact on businesses around the world and the economic environments. In light of this, management has noted a significant broadening of the distribution of economic forecasts not captured in the consensus economic scenarios. The estimated impact of COVID-19 was incorporated in the ECL through additional scenario analysis, which considered differing severity and duration assumptions relating to the global pandemic. This included probability-weighted analysis of GDP within individual quarters in 2020, and consequential impacts on unemployment and other economic variables, with differing economic recovery assumptions.
Description of COVID-19 economic scenarios
Three COVID-19 economic scenarios (mild, moderate and severe) have been internally generated based on the anticipated duration of global restrictions, fiscal and policy responses, oil price volatility and unemployment. These scenarios were then assigned different probability weights for use in the ECL calculation as at 31 March 2020: 55% for COVID-19 Mild, 35% for COVID-19 Moderate and 10% for COVID-19 Severe. These COVID-19 economic scenarios are used in conjunction with the consensus economic scenarios.
The key variables used in the scenarios for the purpose of calculating ECL at 31 March 20201:
Average 1Q20–1Q25Consensus Mild Moderate Severe
GDP growth rate (%) 1.7 1.3 0.8 0.3
Unemployment (%) 6.0 6.5 7.1 8.8
House price growth (%) 2.8 0.2 (1.5) (1.9)
Brent oil prices (US$/barrel) 48.7 47.4 44.7 42.5
1. The quarterly update of the consensus economic scenarios did not have a material impact for the comparative period.
Additionally, management considered judgmental overlays where appropriate to capture the extent of ECL at 31 March 2020, including the impact of debt relief requests, government support packages and changes in collateral. As better information emerges on the impact of the pandemic on the credit condition of loan portfolios and groups of borrowers, the assumptions will be revised as appropriate and the ability to evaluate where significant increase in credit risk has occurred will improve.
The overall impact of the COVID-19 additional scenarios and other related judgmental overlays on the ECL is shown below:
Impact of COVID-19 on allowance for ECL
At 31 Mar 2020 At 31 Dec 2019
Consensus probability-
weighted ECL
COVID-19 additional
scenarios and overlays
Allowance for ECL
Allowance for ECL
$m $m $m $m
Wholesale lending 251 113 364 237
Personal lending 61 6 67 63
Total 312 119 431 300
Payment relief options
In response to COVID-19, we continue to work with our wholesale and personal customers who might need additional assistance to manage their working capital cycle, or supply chain and other risks, or who might need flexibility in managing their loans. We are participating in the government’s Business Credit Availability Program, helping existing customers to meet additional credit needs during this difficult period.
We have launched flexible solutions for our impacted customers, including up to six months of payment deferral for mortgages and relief on other credit products as needed. These payment relief options allow customers to temporarily stop making their regular payments. The interest will continue to accrue on the outstanding balance during this time and will be collected after the end of deferral period.
For the contracts that are modified, we have performed a careful assessment to consider reasonable and supportable information at an individual level and/or at a collective level in order to identify customers at higher susceptibility of long term economic impacts which might indicate a significant increase in credit risk. Payment deferrals are not considered to automatically trigger a significant increase in credit risk or result in the loans involved being moved into stage 2 or stage 3 for the purposes of calculating ECL, all things being equal.
HSBC Bank Canada First quarter 2020 interim report 15

The assessment not only considered reliefs, where relevant, but also other available reasonable and supportable information about lifetime risk of default.
Modification of loan contracts
As at 31 March 2020, the outstanding balance of loans which were modified in response to the payment relief requests was $82m in wholesale lending portfolio and $118m in personal lending portfolio.
Summary of credit risk
The following disclosure presents the gross carrying/nominal amount of financial instruments to which the impairment requirements in IFRS 9 are applied and the associated allowance for ECL.
The allowance for ECL at 31 March 2020 comprised of $381m in respect of assets held at amortized cost, $44m in respect of loan commitments and financial guarantees, $1m in respect of debt instruments measured at fair value through other comprehensive income (‘FVOCI’), and $5m in respect of performance guarantee contracts.
Summary of financial instruments to which the impairment requirements in IFRS 9 are applied*
At
31 Mar 2020 31 Dec 2019
Footnotes
Gross carrying/nominal amount
Allowance forECL
Gross carrying/nominal amount
Allowance forECL
$m $m $m $m
Loans and advances to customers at amortized cost 63,984 (340) 62,164 (242)
– personal 29,373 (65) 29,192 (60)
– corporate and commercial 34,611 (275) 32,972 (182)
Loans and advances to banks at amortized cost 1,087 — 1,169 —
Other financial assets measured at amortized cost 22,652 (41) 11,662 (30)
– cash and balances at central banks 4,159 — 54 —
– items in the course of collection from other banks 9 — 15 —
– reverse repurchase agreements non - trading 6,523 — 6,269 —
– customers’ liability under acceptances 4,475 (14) 3,505 (5)
– other assets, prepayments and accrued income 1 7,486 (27) 1,819 (25)
Total gross carrying amount on-balance sheet 87,723 (381) 74,995 (272)
Loans and other credit related commitments 41,458 (42) 42,700 (22)
– personal 7,054 — 7,444 (1)
– corporate and commercial 34,404 (42) 35,256 (21)
Financial guarantees 2 2,136 (2) 2,124 (2)
– personal 7 — 7 —
– corporate and commercial 2,129 (2) 2,117 (2)
Total nominal amount off-balance sheet 3 43,594 (44) 44,824 (24)
Fair valueAllowance for
ECL Fair valueAllowance for
ECL
$m $m $m $m
Debt instruments measured at fair value through other comprehensive income (‘FVOCI’) 4 23,247 (1) 23,625 (1)
1. Includes only those financial instruments which are subject to the impairment requirements of IFRS 9. ‘Other assets’ and ‘Prepayments and accrued income’ as presented within the consolidated balance sheet include both financial and non-financial assets.
2. Excludes performance guarantee contracts. 3. Represents the maximum amount at risk should the contracts be fully drawn upon and clients default.4. Debt instruments measured at FVOCI continue to be measured at fair value with the allowance for ECL as a memorandum item. Change in ECL is recognized in ‘Change in expected credit
losses and other credit impairment charges’ in the income statement.
The following table provides an overview of the bank’s credit risk by stage and segment, and the associated ECL coverage. The financial assets recorded in each stage have the following characteristics:
Stage 1: Unimpaired and without significant increase in credit risk on which a 12-month allowance for ECL is recognized.
Stage 2: A significant increase in credit risk has been experienced since initial recognition on which a lifetime ECL is recognized.
Stage 3: Objective evidence of impairment, and are therefore considered to be in default or otherwise credit-impaired on which a lifetime ECL is recognized.
Management's Discussion and Analysis
16 HSBC Bank Canada First quarter 2020 interim report

Summary of credit risk (excluding debt instruments measured at FVOCI) by stage distribution and ECL coverage*Gross carrying/nominal amount
1Allowance for ECL ECL coverage %
Stage 1 Stage 2 Stage 3 Total Stage 1 Stage 2 Stage 3 Total Stage 1 Stage 2 Stage 3 Total
$m $m $m $m $m $m $m $m % % % %
Loans and advances to customers at amortized cost 55,909 7,710 365 63,984 (49) (147) (144) (340) 0.1 1.9 39.5 0.5
– personal 28,311 972 90 29,373 (10) (38) (17) (65) — 3.9 18.9 0.2
– corporate and commercial 27,598 6,738 275 34,611 (39) (109) (127) (275) 0.1 1.6 46.2 0.8
Loans and advances to banks at amortized cost 1,087 — — 1,087 — — — — — — — —
Other financial assets measured at amortized cost 22,058 567 27 22,652 (4) (10) (27) (41) — 1.8 100.0 0.2
Loan and other credit-related commitments 36,169 5,223 66 41,458 (8) (34) — (42) — 0.7 — 0.1
– personal 6,883 158 13 7,054 — — — — — — — —
– corporate and commercial 29,286 5,065 53 34,404 (8) (34) — (42) — 0.7 — 0.1
Financial guarantees2
1,949 187 — 2,136 (1) (1) — (2) 0.1 0.5 — 0.1
– personal 6 1 — 7 — — — — — — — —
– corporate and commercial 1,943 186 — 2,129 (1) (1) — (2) 0.1 0.5 — 0.1
At 31 Mar 2020 117,172 13,687 458 131,317 (62) (192) (171) (425) 0.1 1.4 37.3 0.3
Summary of credit risk (excluding debt instruments measured at FVOCI) by stage distribution and ECL coverage (continued)*Gross carrying/nominal amount
1Allowance for ECL ECL coverage %
Stage 1 Stage 2 Stage 3 Total Stage 1 Stage 2 Stage 3 Total Stage 1 Stage 2 Stage 3 Total
$m $m $m $m $m $m $m $m % % % %
Loans and advances to customers at amortized cost 57,168 4,662 334 62,164 (40) (85) (117) (242) 0.1 1.8 35.0 0.4
– personal 28,536 569 87 29,192 (14) (31) (15) (60) — 5.4 17.2 0.2
– corporate and commercial 28,632 4,093 247 32,972 (26) (54) (102) (182) 0.1 1.3 41.3 0.6
Loans and advances to banks at amortized cost 1,169 — — 1,169 — — — — — — — —
Other financial assets measured at amortized cost 11,305 331 26 11,662 (2) (3) (25) (30) — 0.9 96.2 0.3
Loan and other credit-related commitments 38,620 4,014 66 42,700 (6) (15) (1) (22) — 0.4 1.5 0.1
– personal 7,268 164 12 7,444 (1) — — (1) — — — —
– corporate and commercial 31,352 3,850 54 35,256 (5) (15) (1) (21) — 0.4 1.9 0.1
Financial guarantees2 1,921 201 2 2,124 (1) (1) — (2) 0.1 0.5 — 0.1
– personal 6 1 — 7 — — — — — — — —
– corporate and commercial 1,915 200 2 2,117 (1) (1) — (2) 0.1 0.5 — 0.1
At 31 Dec 2019 110,183 9,208 428 119,819 (49) (104) (143) (296) — 1.1 33.4 0.2
1. Represents the maximum amount at risk should the contracts be fully drawn upon and clients default.2. Excludes performance guarantee contracts.
HSBC Bank Canada First quarter 2020 interim report 17

Reconciliation of allowances for loans and advances to banks and customers including loan commitments and financial guarantees
Reconciliation of allowances for loans and advances to banks and customers including loan commitments and financial guarantees*1
Quarter ended
31 Mar 2020 31 Mar 2019
Non-credit impairedCredit-
impaired Non-credit impairedCredit-
impaired
Stage 1 Stage 2 Stage 3 Total Stage 1 Stage 2 Stage 3 Total
$m $m $m $m $m $m $m $m
Balance at the beginning of the period......................................... 47 101 118 266 43 99 89 231
Transfers of financial instruments:........................................................... 4 (10) 6 — 7 (8) 1 —
– transfers from stage 1 to stage 2 (6) 6 — — (2) 2 — —
– transfers from stage 2 to stage 1.......................................................... 9 (9) — — 8 (8) — —
– transfers to stage 3............................................................................... — (8) 8 — — (3) 3 —
– transfers from stage 3........................................................................... 1 1 (2) — 1 1 (2) —
Net remeasurement of ECL arising from transfer of stage........................ (6) 8 — 2 (7) 5 — (2)
New financial assets originated or purchased........................................... 3 — — 3 1 — — 1
Changes to risk parameters....................................................................... 11 81 40 132 (10) (5) 7 (8)
Asset derecognized (including final repayments)...................................... (1) (1) (4) (6) — (2) (3) (5)
Assets written off....................................................................................... — — (18) (18) — — (16) (16)
Other.......................................................................................................... — 3 2 5 — — (2) (2)
Balance at the end of the period................................................... 58 182 144 384 34 89 76 199
ECL charge/(release) for the period 7 88 36 131 (16) (2) 4 (14)
Recoveries — — (2) (2) — — (2) (2)
Other — — — — — — — —
Total ECL charge/(release) for the period 7 88 34 129 (16) (2) 2 (16)
1. Excludes performance guarantee contracts.
Quarter ended
31 Mar 2020 31 Mar 2019
Allowance for ECL/Other credit
loss provisionsECL charge/
(release)
Allowance for ECL/Other credit loss
provisionsECL charge/
(release)
$m $m $m $m
As above 384 129 199 (16)
Other financial assets measured at amortized cost 41 9 39 4
Performance guarantee contracts 5 2 2 —
Debt instruments measured at FVOCI 1 — 1 —
Total allowance for ECL / Total income statement ECL charge/(release) for the period 431 140 241 (12)
Credit quality of financial instruments*We assess the credit quality of all financial instruments that are subject to credit risk. The credit quality of financial instruments is a point in time assessment of the probability of default of financial instruments, whereas IFRS 9 stages 1 and 2 are determined based on relative deterioration of credit quality since initial recognition.
Accordingly, for non-credit impaired financial instruments there is no direct relationship between the credit quality assessment and IFRS 9 stages 1 and 2, although typically the lower credit quality bands exhibit a higher proportion in stage 2.
Quality classification definitions- ‘Strong’ exposures demonstrate a strong capacity to meet financial commitments, with negligible or low probability of default and/or low levels of expected loss.- ‘Good’ exposures require closer monitoring and demonstrate a good capacity to meet financial commitments, with low default risk.- ‘Satisfactory’ exposures require closer monitoring and demonstrate an average-to-fair capacity to meet financial commitments, with moderate default risk.- ‘Sub-standard’ exposures require varying degrees of special attention and default risk is of greater concern.- ‘Credit-impaired’ exposures have been assessed as impaired.
The five credit quality classifications, as defined above, each encompasses a range of granular internal credit rating grades assigned to wholesale and personal lending businesses and the external ratings attributed by external agencies to debt securities.
The personal lending credit quality is disclosed based on a 12-month point-in-time (‘PIT’) weighted probability of default (‘PD’). The credit quality classifications for wholesale lending are based on internal credit risk ratings.
Management's Discussion and Analysis
18 HSBC Bank Canada First quarter 2020 interim report
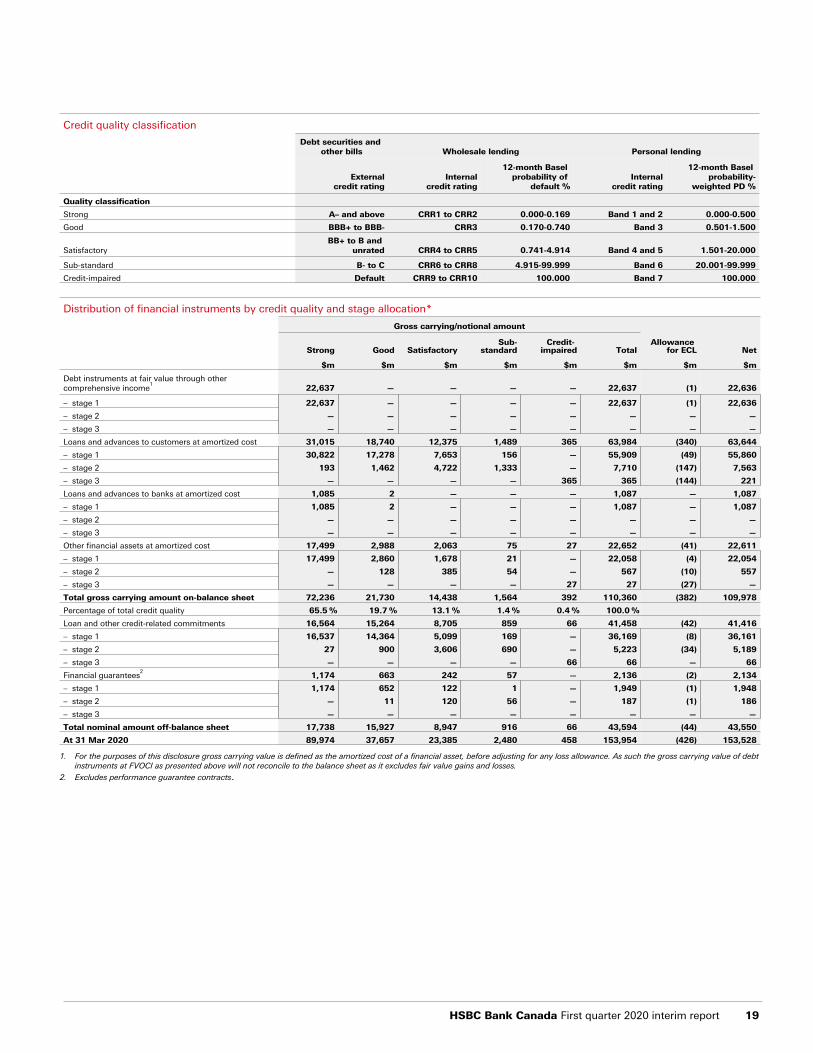
Credit quality classification
Debt securities and other bills Wholesale lending Personal lending
Externalcredit rating
Internalcredit rating
12-month Basel probability of
default %Internal
credit rating
12-month Basel probability-
weighted PD %
Quality classification
Strong A– and above CRR1 to CRR2 0.000-0.169 Band 1 and 2 0.000-0.500
Good BBB+ to BBB- CRR3 0.170-0.740 Band 3 0.501-1.500
SatisfactoryBB+ to B and
unrated CRR4 to CRR5 0.741-4.914 Band 4 and 5 1.501-20.000
Sub-standard B- to C CRR6 to CRR8 4.915-99.999 Band 6 20.001-99.999
Credit-impaired Default CRR9 to CRR10 100.000 Band 7 100.000
Distribution of financial instruments by credit quality and stage allocation*
Gross carrying/notional amount
Allowance for ECLStrong Good Satisfactory
Sub-standard
Credit- impaired Total Net
$m $m $m $m $m $m $m $m
Debt instruments at fair value through other comprehensive income
122,637 — — — — 22,637 (1) 22,636
– stage 1 22,637 — — — — 22,637 (1) 22,636
– stage 2 — — — — — — — —
– stage 3 — — — — — — — —
Loans and advances to customers at amortized cost 31,015 18,740 12,375 1,489 365 63,984 (340) 63,644
– stage 1 30,822 17,278 7,653 156 — 55,909 (49) 55,860
– stage 2 193 1,462 4,722 1,333 — 7,710 (147) 7,563
– stage 3 — — — — 365 365 (144) 221
Loans and advances to banks at amortized cost 1,085 2 — — — 1,087 — 1,087
– stage 1 1,085 2 — — — 1,087 — 1,087
– stage 2 — — — — — — — —
– stage 3 — — — — — — — —
Other financial assets at amortized cost 17,499 2,988 2,063 75 27 22,652 (41) 22,611
– stage 1 17,499 2,860 1,678 21 — 22,058 (4) 22,054
– stage 2 — 128 385 54 — 567 (10) 557
– stage 3 — — — — 27 27 (27) —
Total gross carrying amount on-balance sheet 72,236 21,730 14,438 1,564 392 110,360 (382) 109,978
Percentage of total credit quality 65.5 % 19.7 % 13.1 % 1.4 % 0.4 % 100.0 %
Loan and other credit-related commitments 16,564 15,264 8,705 859 66 41,458 (42) 41,416
– stage 1 16,537 14,364 5,099 169 — 36,169 (8) 36,161
– stage 2 27 900 3,606 690 — 5,223 (34) 5,189
– stage 3 — — — — 66 66 — 66
Financial guarantees2
1,174 663 242 57 — 2,136 (2) 2,134
– stage 1 1,174 652 122 1 — 1,949 (1) 1,948
– stage 2 — 11 120 56 — 187 (1) 186
– stage 3 — — — — — — — —
Total nominal amount off-balance sheet 17,738 15,927 8,947 916 66 43,594 (44) 43,550
At 31 Mar 2020 89,974 37,657 23,385 2,480 458 153,954 (426) 153,528
1. For the purposes of this disclosure gross carrying value is defined as the amortized cost of a financial asset, before adjusting for any loss allowance. As such the gross carrying value of debt instruments at FVOCI as presented above will not reconcile to the balance sheet as it excludes fair value gains and losses.
2. Excludes performance guarantee contracts.
HSBC Bank Canada First quarter 2020 interim report 19

Distribution of financial instruments by credit quality and stage allocation (continued)*
Gross carrying/notional amount
Allowance for ECLStrong Good Satisfactory Sub-standard
Credit- impaired Total Net
$m $m $m $m $m $m $m $m
Debt instruments at fair value through other comprehensive income
123,480 — — — — 23,480 (1) 23,479
– stage 1 23,480 — — — — 23,480 (1) 23,479
– stage 2 — — — — — — — —
– stage 3 — — — — — — — —
Loans and advances to customers at amortized cost 30,152 17,813 12,304 1,561 334 62,164 (242) 61,922
– stage 1 30,082 17,292 9,620 174 — 57,168 (40) 57,128
– stage 2 70 521 2,684 1,387 — 4,662 (85) 4,577
– stage 3 — — — — 334 334 (117) 217
Loans and advances to banks at amortized cost 1,169 — — — — 1,169 — 1,169
– stage 1 1,169 — — — — 1,169 — 1,169
– stage 2 — — — — — — — —
– stage 3 — — — — — — — —
Other financial assets at amortized cost 7,513 2,401 1,647 75 26 11,662 (30) 11,632
– stage 1 7,513 2,373 1,401 18 — 11,305 (2) 11,303
– stage 2 — 28 246 57 — 331 (3) 328
– stage 3 — — — — 26 26 (25) 1
Total gross carrying amount on-balance sheet 62,314 20,214 13,951 1,636 360 98,475 (273) 98,202
Percentage of total credit quality 63.3 % 20.5 % 14.2 % 1.7 % 0.4 % 100.0 %
Loan and other credit-related commitments 16,851 16,796 8,208 779 66 42,700 (22) 42,678
– stage 1 16,831 15,908 5,772 109 — 38,620 (6) 38,614
– stage 2 20 888 2,436 670 — 4,014 (15) 3,999
– stage 3 — — — — 66 66 (1) 65
Financial guarantees2
1,151 610 241 120 2 2,124 (2) 2,122
– stage 1 1,151 610 151 9 — 1,921 (1) 1,920
– stage 2 — — 90 111 — 201 (1) 200
– stage 3 — — — — 2 2 — 2
Total nominal amount off-balance sheet 18,002 17,406 8,449 899 68 44,824 (24) 44,800
At 31 Dec 2019 80,316 37,620 22,400 2,535 428 143,299 (297) 143,002
1. For the purposes of this disclosure gross carrying value is defined as the amortized cost of a financial asset, before adjusting for any loss allowance. As such the gross carrying value of debt instruments at FVOCI as presented above will not reconcile to the balance sheet as it excludes fair value gains and losses.
2. Excludes performance guarantee contracts.
Management's Discussion and Analysis
20 HSBC Bank Canada First quarter 2020 interim report
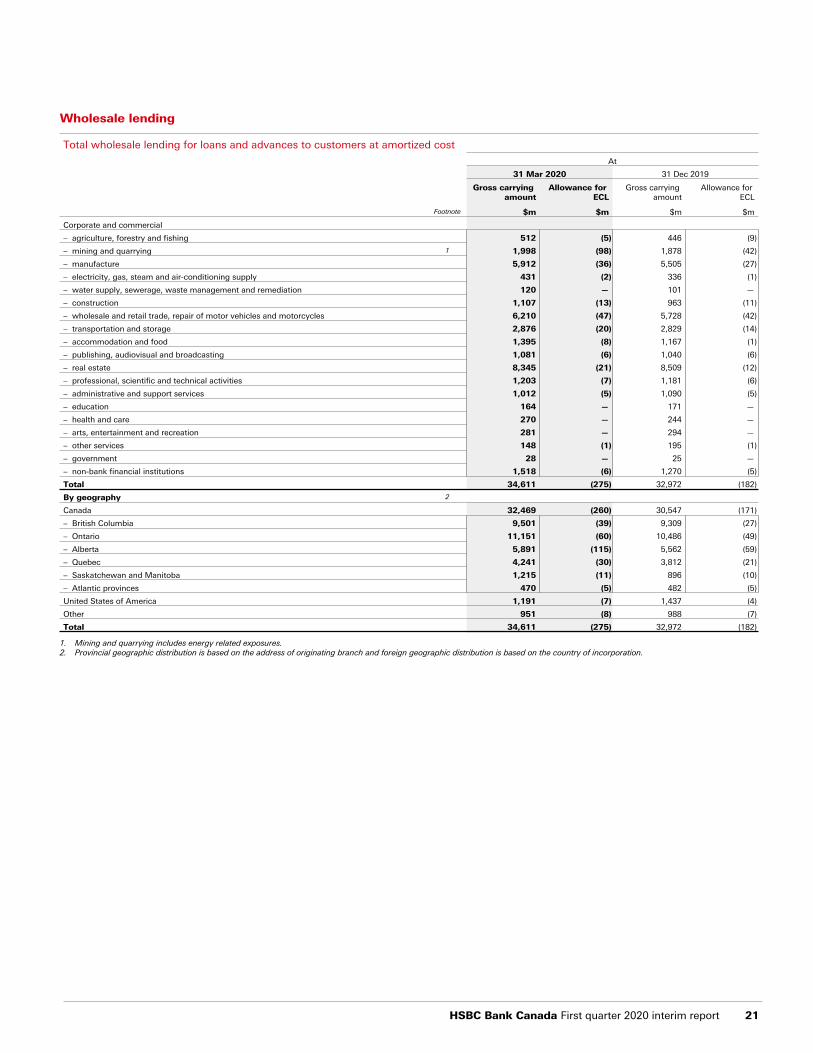
Wholesale lending
Total wholesale lending for loans and advances to customers at amortized cost
At
31 Mar 2020 31 Dec 2019
Gross carrying amount
Allowance for ECL
Gross carrying amount
Allowance for ECL
Footnote $m $m $m $m
Corporate and commercial
– agriculture, forestry and fishing 512 (5) 446 (9)
– mining and quarrying 1 1,998 (98) 1,878 (42)
– manufacture 5,912 (36) 5,505 (27)
– electricity, gas, steam and air-conditioning supply 431 (2) 336 (1)
– water supply, sewerage, waste management and remediation 120 — 101 —
– construction 1,107 (13) 963 (11)
– wholesale and retail trade, repair of motor vehicles and motorcycles 6,210 (47) 5,728 (42)
– transportation and storage 2,876 (20) 2,829 (14)
– accommodation and food 1,395 (8) 1,167 (1)
– publishing, audiovisual and broadcasting 1,081 (6) 1,040 (6)
– real estate 8,345 (21) 8,509 (12)
– professional, scientific and technical activities 1,203 (7) 1,181 (6)
– administrative and support services 1,012 (5) 1,090 (5)
– education 164 — 171 —
– health and care 270 — 244 —
– arts, entertainment and recreation 281 — 294 —
– other services 148 (1) 195 (1)
– government 28 — 25 —
– non-bank financial institutions 1,518 (6) 1,270 (5)
Total 34,611 (275) 32,972 (182)
By geography 2
Canada 32,469 (260) 30,547 (171)
– British Columbia 9,501 (39) 9,309 (27)
– Ontario 11,151 (60) 10,486 (49)
– Alberta 5,891 (115) 5,562 (59)
– Quebec 4,241 (30) 3,812 (21)
– Saskatchewan and Manitoba 1,215 (11) 896 (10)
– Atlantic provinces 470 (5) 482 (5)
United States of America 1,191 (7) 1,437 (4)
Other 951 (8) 988 (7)
Total 34,611 (275) 32,972 (182)
1. Mining and quarrying includes energy related exposures.2. Provincial geographic distribution is based on the address of originating branch and foreign geographic distribution is based on the country of incorporation.
HSBC Bank Canada First quarter 2020 interim report 21

Wholesale lending reconciliation of allowances for loans and advances to banks and customers including loan commitments and financial guarantees*1
Quarter ended
31 Mar 2020 31 Mar 2019
Non-credit impairedCredit-
impaired Non-credit impairedCredit-
impaired
Stage 1 Stage 2 Stage 3 Total Stage 1 Stage 2 Stage 3 Total
$m $m $m $m $m $m $m $m
Balance at the beginning of the period......................................... 32 70 103 205 29 74 73 176
Transfers of financial instruments:........................................................... (1) (4) 5 — — (2) 2 —
– transfers from stage 1 to stage 2 (5) 5 — — (2) 2 — —
– transfers from stage 2 to stage 1.......................................................... 3 (3) — — 2 (2) — —
– transfers to stage 3............................................................................... — (6) 6 — — (2) 2 —
– transfers from stage 3........................................................................... 1 — (1) — — — — —
Net remeasurement of ECL arising from transfer of stage........................ (1) 6 — 5 (2) 4 — 2
New financial assets originated or purchased........................................... 2 — — 2 1 — — 1
Changes to risk parameters....................................................................... 16 69 32 117 (4) (14) (1) (19)
Asset derecognized (including final repayments)...................................... — — (1) (1) — (1) — (1)
Assets written off....................................................................................... — — (14) (14) — — (12) (12)
Other.......................................................................................................... — 3 2 5 — — (1) (1)
Balance at the end of the period................................................... 48 144 127 319 24 61 61 146
ECL charge/(release) for the period 17 75 31 123 (5) (11) (1) (17)
Recoveries — — — — — — — —
Other — — — — — — — —
Total ECL charge/(release) for the period 17 75 31 123 (5) (11) (1) (17)
1. Excludes performance guarantee contracts.
The wholesale allowance for ECL during the first quarter increased by $114m or 56% as compared to 31 December 2019, and the wholesale lending change in ECL for the period resulted in an income statement charge of $123m, primarily driven by an adverse shift in forward-looking economic scenarios related to COVID-19.
The total ECL coverage for loans and advances to customers for corporate and commercial at 31 March 2020 was 0.8%, an increase of 0.2% as compared to 31 December 2019. For the first quarter, the ECL coverage remained stable for stage 1. Stage 2 and stage 3 both increased to 1.6% and 46.2%, respectively.
Personal lending
Total personal lending for loans and advances to customers at amortized cost
At
31 Mar 2020 31 Dec 2019
Gross carrying amount
Allowance for ECL
Gross carrying amount
Allowance for ECL
Footnote $m $m $m $m
Residential mortgages 26,168 (24) 25,855 (23)
Home equity lines of credit 1,643 (4) 1,664 (4)
Personal revolving loan facilities 585 (14) 610 (14)
Other personal loan facilities 647 (6) 665 (4)
Retail card 277 (10) 341 (9)
Run-off consumer loan portfolio 53 (7) 57 (6)
Total 29,373 (65) 29,192 (60)
By geography 1
Canada 29,191 (63) 29,009 (58)
– British Columbia 14,428 (25) 14,327 (22)
– Ontario 11,169 (20) 11,161 (18)
– Alberta 1,698 (7) 1,663 (7)
– Quebec 1,344 (5) 1,327 (6)
– Saskatchewan and Manitoba 312 (2) 304 (2)
– Atlantic provinces 233 (4) 220 (3)
– Territories 7 — 7 —
Other 182 (2) 183 (2)
Total 29,373 (65) 29,192 (60)
1. Geographic distribution is based on the customer address.
Management's Discussion and Analysis
22 HSBC Bank Canada First quarter 2020 interim report

Personal lending reconciliation of allowances for loans and advances to customers including loan commitments and financial guarantees*1
Quarter ended
31 Mar 2020 31 Mar 2019
Non-credit impairedCredit-
impaired Non-credit impairedCredit-
impaired
Stage 1 Stage 2 Stage 3 Total Stage 1 Stage 2 Stage 3 Total
Allowance for ECL
Allowance for ECL
Allowance for ECL
Allowance for ECL
Allowance for ECL
Allowance for ECL
Allowance for ECL
Allowance for ECL
$m $m $m $m $m $m $m $m
Balance at the beginning of the period......................................... 15 31 15 61 14 25 16 55
Transfers of financial instruments:........................................................... 5 (6) 1 — 7 (6) (1) —
– transfers from stage 1 to stage 2 (1) 1 — — — — — —
– transfers from stage 2 to stage 1.......................................................... 6 (6) — — 6 (6) — —
– transfers to stage 3............................................................................... — (2) 2 — — (1) 1 —
– transfers from stage 3........................................................................... — 1 (1) — 1 1 (2) —
Net remeasurement of ECL arising from transfer of stage........................ (5) 2 — (3) (5) 1 — (4)
New financial assets originated or purchased........................................... 1 — — 1 — — — —
Changes to risk parameters....................................................................... (5) 12 8 15 (6) 9 8 11
Asset derecognized (including final repayments)...................................... (1) (1) (3) (5) — (1) (3) (4)
Assets written off....................................................................................... — — (4) (4) — — (4) (4)
Others........................................................................................................ — — — — — — (1) (1)
Balance at the end of the period................................................... 10 38 17 65 10 28 15 53
ECL charge/(release) for the period (10) 13 5 8 (11) 9 5 3
Recoveries — — (2) (2) — — (2) (2)
Others — — — — — — — —
Total ECL charge/(release) for the period (10) 13 3 6 (11) 9 3 1
1. Excludes performance guarantee contracts.
The total personal lending allowance for ECL increased by $4m for the quarter, primarily driven by an adverse shift in forward-looking economic scenarios related to COVID-19.
The bank recorded an ECL charge of $8m for the quarter on the personal lending portfolio, offset by $2m of recoveries.
The write-offs are mainly from retail card, personal revolving loan facilities and residential mortgages.
Mortgages and home equity lines of credit
The bank’s mortgage and home equity lines of credit portfolios are considered to be low-risk since the majority are secured by a first charge against the underlying real estate.
The following tables detail how the bank mitigates risk further by diversifying the geographical markets in which it operates as well as benefiting from borrower default insurance. In addition, the bank maintains strong underwriting and portfolio monitoring standards to ensure the quality of its portfolio is maintained.
Insurance and geographic distribution1
Residential mortgages HELOC2
Insured3
Uninsured3
Total Uninsured
$m % $m % $m $m %
British Columbia....................................................................... 1,116 8 % 12,304 92 % 13,420 808 100 %
Western Canada4...................................................................... 605 38 % 996 62 % 1,601 187 100 %
Ontario...................................................................................... 1,735 17 % 8,731 83 % 10,466 586 100 %
Quebec and Atlantic provinces................................................. 465 35 % 857 65 % 1,322 86 100 %
At 31 Mar 2020.............................................................. 3,921 15 % 22,888 85 % 26,809 1,667 100 %
Insurance and geographic distribution1 (continued)
Residential mortgages5
HELOC2, 5
Insured3
Uninsured3
Total Uninsured
$m % $m % $m $m %British Columbia 960 7 % 12,393 93 % 13,353 822 100 %
Western Canada4
476 30 % 1,103 70 % 1,579 190 100 %
Ontario 1,298 13 % 8,919 87 % 10,217 589 100 %
Quebec and Atlantic provinces 384 29 % 933 71 % 1,317 88 100 %
At 31 Dec 2019 3,118 12 % 23,348 88 % 26,466 1,689 100 %
1. Geographic distribution is based on the property location.2. HELOC is an abbreviation for Home Equity Lines of Credit, which are lines of credit secured by equity in real estate. 3. Insured mortgages are protected from potential losses caused by borrower default through the purchase of insurance coverage, either from the Canadian Housing and Mortgage
Corporation or other accredited private insurers.4. Western Canada excludes British Columbia.5. Certain prior year amounts have been reclassified to conform to the current year presentation.
HSBC Bank Canada First quarter 2020 interim report 23

Amortization period1
Residential mortgages
< 20 years > 20 years < 25 years > 25 years < 30 years
At 31 Mar 2020 20.2 % 49.4 % 30.3 %
At 31 Dec 2019 20.1 % 48.0 % 31.9 %
1. Amortization period is based on the remaining term of residential mortgages.
Average loan-to-value ratios of new originations1, 2
Quarter ended
Uninsured % LTV3
Residential mortgages HELOC
% %
British Columbia 58.2 % 52.3 %
Western Canada4
65.8 % 64.1 %
Ontario 62.7 % 59.2 %
Quebec and Atlantic provinces 64.4 % 56.5 %
Total Canada for the three months ended 31 Mar 2020 61.2 % 56.0 %
Total Canada for the three months ended 31 Dec 2019 61.0 % 57.0 %
1. All new loans and home equity lines of credit were originated by the bank; there were no acquisitions during the period. 2. New originations exclude existing mortgage renewals.3. Loan-to-value ratios are simple averages, based on property values at the date of mortgage origination.4. Western Canada excludes British Columbia.
Potential impact of an economic downturn on residential mortgage loans and home equity lines of credit
The bank performs stress testing on its personal lending portfolio to assess the impact of increased levels of unemployment, rising interest rates, reduction in property values and changes in other relevant macro-economic variables. Potential increase in losses in the mortgage portfolio under downturn economic scenarios are considered manageable given the diversified composition of the portfolio, the low Loan-to-Value in the portfolio and risk mitigation strategies in place.
Credit-impaired loans
The following table provides an analysis of the gross carrying value of loans and advances to banks and customers that are determined to be impaired (stage 3 financial assets).
Credit-impaired loans and advances to banks and customers*
At
31 Mar 2020 31 Dec 2019
Gross carrying amount
Allowance for ECL
Gross carrying amount
Allowance for ECL
Footnotes $m $m $m $m
Corporate and commercial 275 (127) 247 (102)
– agriculture, forestry and fishing 9 (2) 10 (5)
– mining and quarrying 1 129 (59) 62 (24)
– manufacture 44 (17) 39 (13)
– construction 13 (7) 13 (8)
– wholesale and retail trade, repair of motor vehicles and motorcycles 33 (19) 51 (29)
– transportation and storage 8 (7) 7 (5)
– accommodation and food 3 (2) — —
– publishing, audiovisual and broadcasting 15 (4) 15 (4)
– real estate 16 (6) 8 (7)
– professional, scientific and technical activities — — 37 (3)
– administrative and support services 4 (3) 4 (3)
– other services — — — —
– non-bank financial institutions 1 (1) 1 (1)
Households 2 90 (17) 87 (15)
Loans and advances to banks — — — —
Total 365 (144) 334 (117)
1. Mining and quarrying includes energy related exposures.2. Households includes the personal lending portfolio.
Renegotiated loans
The carrying amount of renegotiated loans was $216m at 31 March 2020 (31 December 2019: $135m).
Management's Discussion and Analysis
24 HSBC Bank Canada First quarter 2020 interim report

Liquidity and funding riskLiquidity risk is the risk that the bank does not have sufficient financial resources to meet its obligations as they fall due, or will have to do so at an excessive cost. This risk arises from mismatches in the timing of cash flows.
Funding risk is the risk that funding considered to be sustainable, and therefore used to fund assets, is not sustainable over time. The risk arises when the funding needed for illiquid asset positions cannot be obtained at the expected terms and when required.
Liquidity and funding risk management
Our liquidity and funding management strategy as described in the ‘Liquidity and funding risk’ section of our Annual Report and Accounts 2019 continues to apply. The bank’s internal liquidity and funding risk management framework uses the liquidity coverage ratio (‘LCR’) and net stable funding ratio (‘NSFR’) regulatory framework as a foundation, and adds additional metrics, limits and overlays to address the risks that the bank considers are not adequately reflected by the external regulatory framework.
We continue to monitor liquidity and funding risk against our stated risk tolerance and management framework.
Liquid assets
The table below shows the estimated liquidity value unweighted (before assumed haircuts) of assets categorized as liquid and used for the purpose of calculating the OSFI LCR metric. The level of liquid assets reported reflects the stock of unencumbered liquid assets at the reporting date, using the regulatory definition of liquid assets. Liquid assets consist of cash or assets that can be converted into cash at little or no loss of value.
Our liquid assets increased by $3.3bn from 31 December 2019, primarily due to an increase in short-term funding and increase in deposits offset by an increase in loans.
Liquid assets1
At
31 Mar 2020 31 Dec 2019
$m $m
Level 1 22,763 18,969
Level 2a 4,138 4,603
Level 2b 75 98
Total 26,976 23,670
1. The liquid asset balances stated here are as at the above dates (spot rate) and are unweighted and therefore do not match the liquid asset balances stated in the LCR calculations which are the average for the quarter and are weighted.
Liquidity regulation
In accordance with OSFI’s Liquidity Adequacy Requirements (‘LAR’) guideline, which incorporates Basel liquidity standards, the bank is required to maintain a LCR above 100% as well as monitor the Net Cumulative Cash Flow (‘NCCF’). The LCR estimates the adequacy of liquidity over a 30 day stress period while the NCCF calculates a horizon for net positive cash flows in order to capture the risk posed by funding mismatches between assets and liabilities. As at 31 March 2020, the bank was compliant with both requirements. OSFI made changes to the LCR and other liquidity metrics under the Liquidity Adequacy Requirements (‘LAR’) Guideline and B-6 Guideline, effective 1 January 2020. There was no material impact on the bank’s liquidity and funding approach as a result of these changes.
As a basis to determine the bank’s stable funding requirement, the bank calculates the NSFR according to Basel Committee on Banking Supervision (‘BCBS’) publication number 295, pending its implementation. OSFI implemented the NSFR starting effective 1 January 2020 for domestic systemically important banks (‘D-SIBs’). OSFI is conducting further work to assess requirements for non D-SIBs, which includes the bank. In Europe, implementation of NSFR
is expected in 2021. The NSFR requires banks to maintain a stable funding profile relative to the composition of their assets and off-balance sheet activities and reflects a bank’s long-term funding profile (funding with a term of more than a year). It is designed to complement the LCR.
In March 2020, the financial markets became extremely volatile as the COVID-19 outbreak accelerated, causing severe disruption to business and economic activity. To support our customers, we increased funding levels. As a result, compared to the previous quarter the bank’s average LCR increased to 156% from 140%.
The bank’s OSFI LCR is summarized in the following table. For the quarter ended 31 March 2020, the bank’s average LCR of 156% is calculated as the ratio of High-Quality Liquid Assets (‘HQLA’) to the total net stressed cash outflows over the next 30 calendar days. HQLA is substantially comprised of Level 1 assets such as cash, deposits with central banks and highly rated securities issued or guaranteed by governments, central banks and supranational entities.
OSFI liquidity coverage ratio1
Average for the three months ended
1
31 Mar 2020 31 Dec 2019
Total HQLA2 ($m) 23,965 24,434
Total net cash outflows2 ($m) 15,399 17,450
Liquidity coverage ratio (%) 156 140
1. The data in this table has been calculated using averages of the three month-end figures in the quarter. Consequently, the LCR is an average ratio for the three months of the quarter and might not equal the LCR calculated dividing total weighted HQLA by total weighted net cash outflows.
2. These are weighted values and are calculated after the application of the weights prescribed under the OSFI LAR Guideline for HQLA and cash inflows and outflows.
Market riskMarket risk is the risk that movements in market risk factors, including interest rates, foreign exchange rates, credit spreads, commodity prices and equity prices will adversely affect our income or the value of our assets and liabilities.
Market risk management
Market risk management is independent of the business and is responsible for establishing the policies, procedures and limits that align with the risk appetite of the bank. The objective of market risk management is to identify, measure and control market risk exposures in order to optimize return on risk and remain within the bank’s risk appetite.
Refer to the ‘Risk management’ section of our Annual Report and Accounts 2019 for a discussion of how the bank manages market risk as well as a more in depth explanation of our market risk measures.
Value at risk
Value at Risk (‘VaR’) is a technique that estimates the potential losses that could occur on risk positions as a result of movements in market rates and prices over a specified time horizon and to a given level of confidence. The use of VaR is integrated into market risk management and calculated for all trading and non-trading portfolios to have a complete picture of risk.
VaR disclosed in the following tables and graph is the bank’s total VaR for both trading and non-trading books and remained within the bank’s limits.
Total VaR of $11.1m at the quarter ended 31 March 2020 decreased by $2.1m from the prior year, due to reduced interest rate risk in non-trading books. Over the same period, the average Total VaR of $11.6m decreased by $1.6m. Total VaR is largely driven by non-trading VaR.
HSBC Bank Canada First quarter 2020 interim report 25

The global COVID-19 pandemic and the sudden breakdown of the talks between the Organization of the Petroleum Exporting Countries (‘OPEC’) and Russia resulted in a decline in oil prices and market volatility. In order to manage the bank’s risk during the volatile market, the trading business reduced the risk to minimum levels upon the start of the market volatility, which resulted in a decrease of both the trading VaR at quarter end and the average trading VAR for the quarter. The trading VaR of $1.1m at the quarter and the average trading VaR of $1.5m decreased by $0.8m and $0.1m, respectively.
Total VaR
Quarter ended
31 Mar 2020 31 Mar 2019
$m $m
At period end 11.1 13.2
Average 11.6 13.2
Minimum 7.2 10.8
Maximum 15.7 15.7
Non-trading VaR
Quarter ended
31 Mar 2020 31 Mar 2019
$m $m
At period end 12.0 13.2
Average 11.6 13.2
Minimum 7.0 11.2
Maximum 15.6 15.5
Trading VaR (by risk type)1
Foreign exchange and
commodity Interest rate Equity Credit spreadPortfolio
diversification2
Total4
Footnote $m $m $m $m $m $m
January - March 2020
At period end — 0.9 — 0.5 (0.3) 1.1
Average — 1.2 — 0.8 (0.5) 1.5
Minimum 3 — 0.6 — 0.3 — 0.6
Maximum 3 — 2.0 — 2.5 — 3.2
January - March 2019
At period end — 1.5 — 1.0 (0.6) 1.9
Average — 1.4 — 0.6 (0.4) 1.6
Minimum 3 — 1.1 — 0.3 — 1.3
Maximum 3 — 1.8 — 1.1 — 2.0
1. Trading portfolios comprise positions arising from the market-making of financial instruments and customer-driven derivatives positions.2. Portfolio diversification is the market risk dispersion effect of holding a portfolio containing different risk types. It represents the reduction in unsystematic market risk that occurs when
combining a number of different risk types, for example, interest rate, equity and foreign exchange, together in one portfolio. It is measured as the difference between the combined total VaR and the sum of the VaRs by individual risk type. A negative number represents the benefit of portfolio diversification.
3. As the maximum and minimum occur on different days for different risk types, it is not meaningful to calculate a portfolio diversification benefit for these measures. Some small differences in figures presented are due to rounding.
4. The total VaR is non-additive across risk types due to diversification effects.
Daily total VaR. 1 year history of daily figures
Management's Discussion and Analysis
26 HSBC Bank Canada First quarter 2020 interim report

Structural interest rate risk
Interest rate risk is the risk of an adverse impact to earnings or capital due to changes in market interest rates. Structural interest rate risk is that which originates from the bank’s non-trading assets and liabilities and shareholder’s funds.
Refer to the ‘Structural Interest Rate Risk’ section of our Annual Report and Accounts 2019 for a discussion of how the bank manages structural interest rate risk as well as an explanation of our monitoring measures.
Sensitivity of structural interest rate risk in the non-trading portfolio (before-tax impact resulting from an immediate and sustained shift in interest rates):
31 Mar 2020 31 Mar 2019
Economic value of
equity Earnings
at risk
Economic value of
equityEarnings at
risk
$m $m $m $m
100 basis point increase (238) 167 (103) 132
100 basis point decrease 178 (45) 40 (95)
Factors that may affect future results
The risk management section in the MD&A describes the most significant risks to which the bank is exposed that, if not managed appropriately, could have a material impact on our future financial results.
Refer to the ‘Factors that may affect future results’ section of our Annual Report and Accounts 2019 for a description of additional factors which may affect future financial results.
CapitalOur objective in the management of capital is to maintain appropriate levels of capital to support our business strategy and meet our regulatory requirements.
Refer to the ‘Capital’ section of our Annual Report and Accounts 2019 for a discussion of how the bank manages its capital.
Regulatory capital and capital ratios in the tables below are presented under a Basel III ‘all-in’ basis, under which non-qualifying capital instruments are phased out over 10 years starting 1 January 2013.
The bank remained within its required regulatory capital limits during the quarter ended 31 March 2020.
Regulatory capital ratios
Actual regulatory capital ratios and capital requirements
31 Mar 2020 31 Dec 2019
Footnotes % %
Actual regulatory capital ratios 1
– common equity tier 1 capital ratio 12.0 11.3
– tier 1 capital ratio 14.5 13.9
– total capital ratio 16.9 16.4
– leverage ratio 5.0 4.9
Regulatory capital requirements 2
– minimum common equity tier 1 capital ratio 7.0 7.0
– minimum tier 1 capital ratio 8.5 8.5
– minimum total capital ratio 10.5 10.5
1. Presented under a Basel III basis with non-qualifying capital instruments phased out over 10 years starting 1 January 2013.
2. OSFI target capital ratios including mandated capital conservation buffer.
Regulatory capital
Total regulatory capital and risk-weighted assets
31 Mar 2020 31 Dec 2019
Footnotes $m $m
Gross common equity 1 5,512 5,009
Regulatory adjustments (346) (246)
Common equity tier 1 capital 4 5,166 4,763
Additional tier 1 eligible capital 1,100 1,100
Tier 1 capital 6,266 5,863
Tier 2 capital 2, 4 1,037 1,037
Total capital 7,303 6,900
Risk-weighted assets (‘RWA’) 3 43,128 42,080
1. Includes common share capital, retained earnings and accumulated other comprehensive income.
2. Includes a capital instrument subject to phase out and allowances.3. In April 2020, OSFI announced certain regulatory flexibility measures to support
COVID-19 efforts in light of the current evolving situation. Effective in the first quarter of 2020, OSFI lowered the capital floor factor from 75% to 70%. The revised floor factor is expected to stay in place until the first quarter 2023.
4. As part of the new transitional arrangements, effective 31 March 2020, a portion of allowances that would otherwise be included in tier 2 capital has instead been included in common equity tier 1 (‘CET 1’) capital. The impact is not material as at 31 March 2020.
HSBC Bank Canada First quarter 2020 interim report 27

Outstanding shares and dividends
Quarter ended Year ended
31 Mar 2020 31 Dec 2019
Dividend
Number of issued shares
Carrying value Dividend
Number of issued shares Carrying value
Footnotes $ per share 000’s $m $ per share 000’s $m
Common shares 1, 2 0.32085 548,668 1,725 0.86230 498,668 1,225
Class 1 preferred shares 3
– Series G 0.25000 20,000 500 1.00000 20,000 500
– Series I 0.28750 14,000 350 1.15000 14,000 350
– Series K 4 0.34063 10,000 250 0.35560 10,000 250
1. Dividends recorded in the financial statements are dividends per ordinary share declared in a year and are not dividends in respect of, or for, that year.2. Common shares were issued on 30 March 2020.3. Cash dividends on preferred shares are non-cumulative and are payable quarterly.4. Preferred shares - Class 1, Series K were issued on 27 September 2019; initial dividends were declared during the fourth quarter of 2019 and paid in accordance with their terms in the
usual manner on 31 December 2019 or the first business day thereafter.
Dividends declared in the first quarter 2020During the first quarter of 2020, the bank declared a final dividend of $160m on HSBC Bank Canada common shares in respect of the financial year ended 31 December 2019 and regular quarterly dividends of $12m for the first quarter of 2020 on all series of HSBC Bank Canada Class 1 preferred shares.
Dividends declared in the second quarter 2020On 24 April 2020, the bank declared regular quarterly dividends for the second quarter of 2020 on all series of HSBC Bank Canada Class 1 preferred shares, to be paid in accordance with their terms in the usual manner on 30 June 2020 or the first business day thereafter to shareholder of record on 15 June 2020.
As the dividends on preferred shares for the second quarter of 2020 were declared after 31 March 2020, the amounts have not been included in the balance sheet as a liability.
Management's Discussion and Analysis
28 HSBC Bank Canada First quarter 2020 interim report
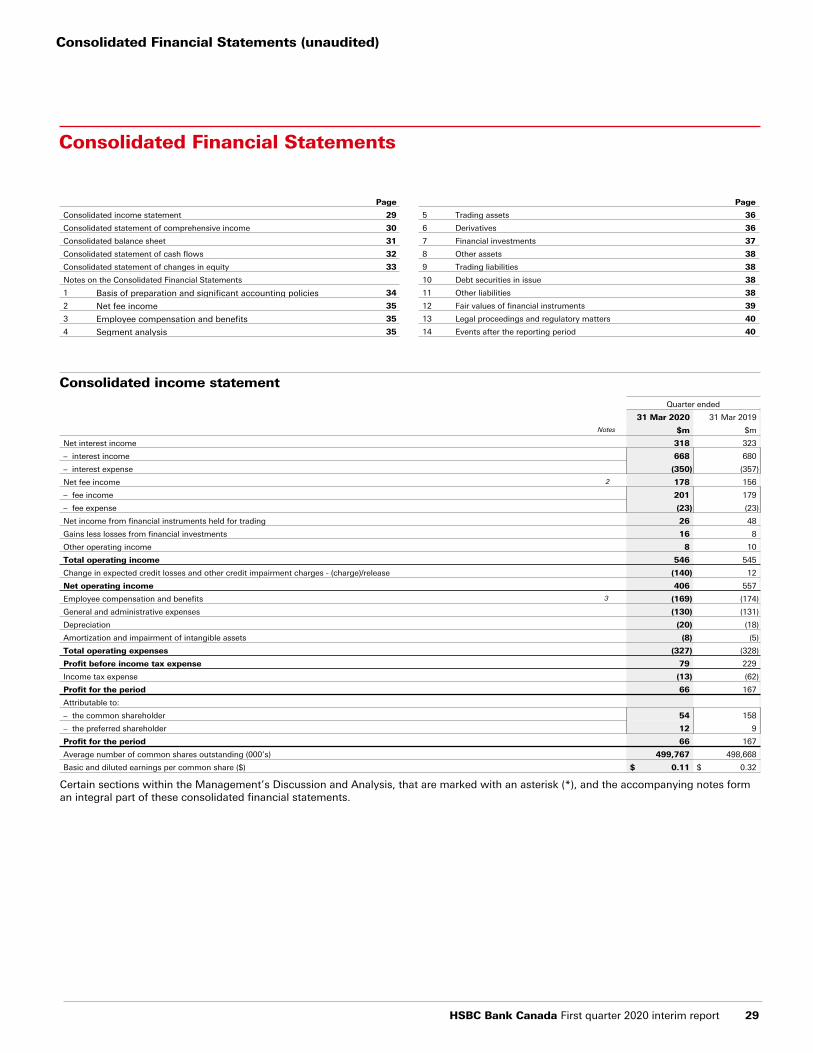
Consolidated Financial Statements
Page Page
Consolidated income statement 29 5 Trading assets 36
Consolidated statement of comprehensive income 30 6 Derivatives 36
Consolidated balance sheet 31 7 Financial investments 37
Consolidated statement of cash flows 32 8 Other assets 38
Consolidated statement of changes in equity 33 9 Trading liabilities 38
Notes on the Consolidated Financial Statements 10 Debt securities in issue 38
1 Basis of preparation and significant accounting policies 34 11 Other liabilities 38
2 Net fee income 35 12 Fair values of financial instruments 39
3 Employee compensation and benefits 35 13 Legal proceedings and regulatory matters 40
4 Segment analysis 35 14 Events after the reporting period 40
Consolidated income statement
Quarter ended
31 Mar 2020 31 Mar 2019
Notes $m $m
Net interest income 318 323
– interest income 668 680
– interest expense (350) (357)
Net fee income 2 178 156
– fee income 201 179
– fee expense (23) (23)
Net income from financial instruments held for trading 26 48
Gains less losses from financial investments 16 8
Other operating income 8 10
Total operating income 546 545
Change in expected credit losses and other credit impairment charges - (charge)/release (140) 12
Net operating income 406 557
Employee compensation and benefits 3 (169) (174)
General and administrative expenses (130) (131)
Depreciation (20) (18)
Amortization and impairment of intangible assets (8) (5)
Total operating expenses (327) (328)
Profit before income tax expense 79 229
Income tax expense (13) (62)
Profit for the period 66 167
Attributable to:
– the common shareholder 54 158
– the preferred shareholder 12 9
Profit for the period 66 167
Average number of common shares outstanding (000’s) 499,767 498,668
Basic and diluted earnings per common share ($) $ 0.11 $ 0.32
Certain sections within the Management’s Discussion and Analysis, that are marked with an asterisk (*), and the accompanying notes form an integral part of these consolidated financial statements.
Consolidated Financial Statements (unaudited)
HSBC Bank Canada First quarter 2020 interim report 29

Consolidated statement of comprehensive income
Quarter ended
31 Mar 2020 31 Mar 2019
$m $m
Profit for the period 66 167
Other comprehensive income
Items that will be reclassified subsequently to profit or loss when specific conditions are met:
Debt instruments at fair value through other comprehensive income (61) 74
– fair value (losses)/gains (68) 109
– fair value gains transferred to the income statement on disposal (16) (8)
– income taxes 23 (27)
Cash flow hedges 160 43
– fair value gains 235 108
– fair value gains reclassified to the income statement (17) (49)
– income taxes (58) (16)
Items that will not be reclassified subsequently to profit or loss:
Remeasurement of defined benefit plans 14 (11)
– before income taxes 19 (15)
– income taxes (5) 4
Equity instruments designated at fair value through other comprehensive income (3) —
– fair value losses (3) —
Other comprehensive income for the period, net of tax 110 106
Total comprehensive income for the period 176 273
Attributable to:
– the common shareholder 164 264
– the preferred shareholder 12 9
Total comprehensive income for the period 176 273
Certain sections within the Management’s Discussion and Analysis, that are marked with an asterisk (*), and the accompanying notes form an integral part of these consolidated financial statements.
Consolidated Financial Statements (unaudited)
30 HSBC Bank Canada First quarter 2020 interim report
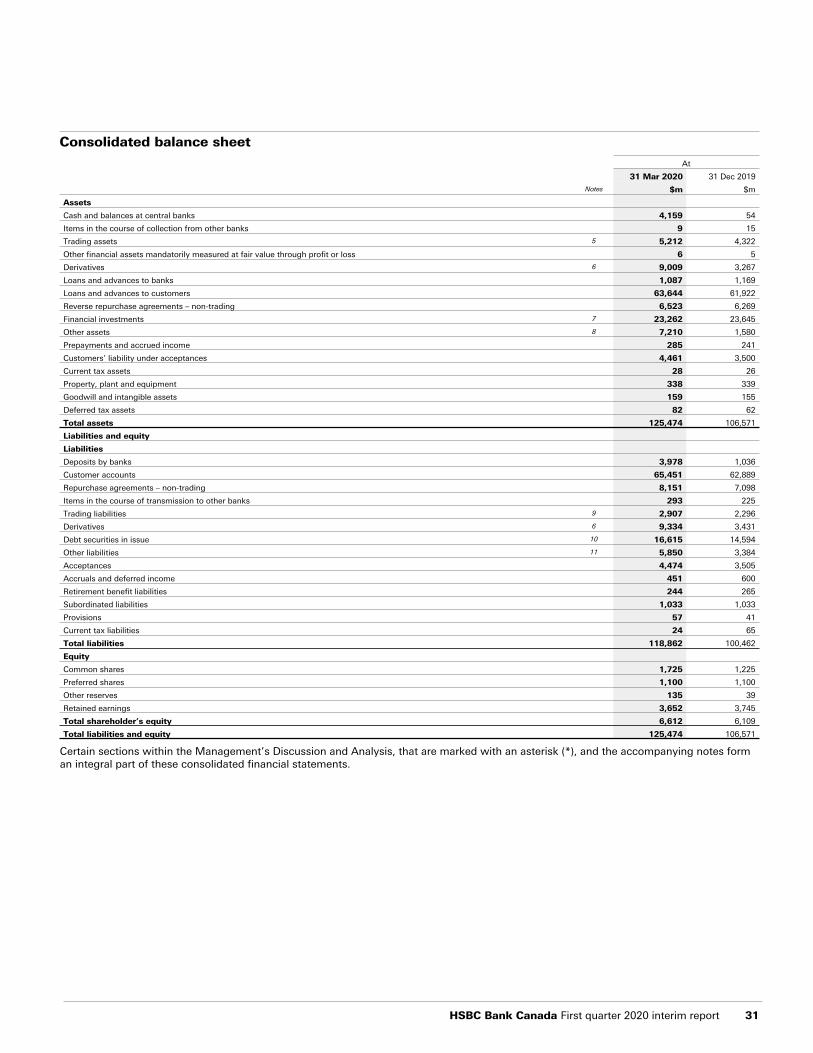
Consolidated balance sheet
At
31 Mar 2020 31 Dec 2019
Notes $m $m
Assets
Cash and balances at central banks 4,159 54
Items in the course of collection from other banks 9 15
Trading assets 5 5,212 4,322
Other financial assets mandatorily measured at fair value through profit or loss 6 5
Derivatives 6 9,009 3,267
Loans and advances to banks 1,087 1,169
Loans and advances to customers 63,644 61,922
Reverse repurchase agreements – non-trading 6,523 6,269
Financial investments 7 23,262 23,645
Other assets 8 7,210 1,580
Prepayments and accrued income 285 241
Customers’ liability under acceptances 4,461 3,500
Current tax assets 28 26
Property, plant and equipment 338 339
Goodwill and intangible assets 159 155
Deferred tax assets 82 62
Total assets 125,474 106,571
Liabilities and equity
Liabilities
Deposits by banks 3,978 1,036
Customer accounts 65,451 62,889
Repurchase agreements – non-trading 8,151 7,098
Items in the course of transmission to other banks 293 225
Trading liabilities 9 2,907 2,296
Derivatives 6 9,334 3,431
Debt securities in issue 10 16,615 14,594
Other liabilities 11 5,850 3,384
Acceptances 4,474 3,505
Accruals and deferred income 451 600
Retirement benefit liabilities 244 265
Subordinated liabilities 1,033 1,033
Provisions 57 41
Current tax liabilities 24 65
Total liabilities 118,862 100,462
Equity
Common shares 1,725 1,225
Preferred shares 1,100 1,100
Other reserves 135 39
Retained earnings 3,652 3,745
Total shareholder’s equity 6,612 6,109
Total liabilities and equity 125,474 106,571
Certain sections within the Management’s Discussion and Analysis, that are marked with an asterisk (*), and the accompanying notes form an integral part of these consolidated financial statements.
HSBC Bank Canada First quarter 2020 interim report 31

Consolidated statement of cash flows
Quarter ended
31 Mar 2020 31 Mar 2019
$m $m
Profit before income tax expense 79 229
Adjustments for non-cash items:
Depreciation and amortization 28 23
Share-based payment expense 3 4
Change in expected credit losses 140 (12)
Charge for defined benefit pension plans 4 4
Changes in operating assets and liabilities
Change in prepayment and accrued income (44) (98)
Change in net trading securities and net derivatives 110 (430)
Change in loans and advances to customers (1,832) 1,354
Change in reverse repurchase agreements – non-trading (216) (240)
Change in other assets (6,623) (3,075)
Change in accruals and deferred income (149) (121)
Change in deposits by banks 2,942 76
Change in customer accounts 2,562 (769)
Change in repurchase agreements – non-trading 1,053 1,621
Change in debt securities in issue 2,021 636
Change in other liabilities 3,419 2,969
Tax paid (90) (35)
Net cash from operating activities 3,407 2,136
Purchase of financial investments (2,999) (3,637)
Proceeds from the sale and maturity of financial investments 3,295 2,437
Purchase of intangibles and property, plant and equipment (19) (18)
Net cash from investing activities 277 (1,218)
Issuance of common shares 500 —
Dividends paid to shareholder (172) (140)
Lease principal payments (14) (11)
Net cash from financing activities 314 (151)
Net increase in cash and cash equivalents 3,998 767
Cash and cash equivalents at the beginning of the period 1,357 1,333
Cash and cash equivalents at the end of the period 5,355 2,100
Cash and cash equivalents comprise:
Cash and balances at central bank 4,159 57
Items in the course of collection from other banks and Items in the course of transmission to other banks (284) (150)
Loans and advances to banks of one month or less 1,087 1,011
Non-trading reverse repurchase agreements with banks of one month or less 360 688
T-Bills and certificates of deposits less than three months 33 494
Cash and cash equivalents at the end of the period 5,355 2,100
Interest:
Interest paid (407) (367)
Interest received 627 582
Certain sections within the Management’s Discussion and Analysis, that are marked with an asterisk (*), and the accompanying notes form an integral part of these consolidated financial statements.
Consolidated Financial Statements (unaudited)
32 HSBC Bank Canada First quarter 2020 interim report

Consolidated statement of changes in equity
Other reserves
Share capital
1Retained earnings
Financial assets at
FVOCI reserve
Cash flow hedging
reserveTotal other
reservesTotal equity
$m $m $m $m $m $m
At 1 Jan 2020 2,325 3,745 36 3 39 6,109
Profit for the period — 66 — — 66
Other comprehensive income/(loss), net of tax — 14 (64) 160 96 110
– debt instruments at fair value through other comprehensive income — — (61) — (61) (61)
– equity instruments designated at fair value through other comprehensive income — — (3) — (3) (3)
– cash flow hedges — — — 160 160 160
– remeasurement of defined benefit plans — 14 — — — 14
Total comprehensive income for the period — 80 (64) 160 96 176
Dividends on common shares — (160) — — — (160)
Dividends on preferred shares — (12) — — — (12)
Issuance of common shares 500 — — — — 500
Shares issued under employee remuneration and share plan — (1) — — — (1)
At 31 Mar 2020 2,825 3,652 (28) 163 135 6,612
Other reserves
Share capital
1Retained earnings
Financial assets at
FVOCI reserve
Cash flow hedging
reserveTotal other
reservesTotal equity
$m $m $m $m $m $m
At 1 Jan 2019 2,075 3,619 (93) (18) (111) 5,583
Profit for the period — 167 — — — 167
Other comprehensive income/(loss), net of tax — (11) 74 43 117 106
– debt instruments at fair value through other comprehensive income — — 74 — 74 74
– equity instruments designated at fair value through other comprehensive income — — — — — —
– cash flow hedges — — — 43 43 43
– remeasurement of defined benefit plans — (11) — — — (11)
Total comprehensive income for the period — 156 74 43 117 273
Deemed contribution — 13 — — — 13
Dividends on common shares — (140) — — — (140)
Dividends on preferred shares — (9) — — — (9)
Shares issued under employee remuneration and share plan — 3 — — — 3
At 31 Mar 2019 2,075 3,642 (19) 25 6 5,723
1. Share capital is comprised of common shares $1,725m and preferred shares $1,100m (31 March 2019: common shares $1,225m and preferred shares $850m).
Certain sections within the Management’s Discussion and Analysis, that are marked with an asterisk (*), and the accompanying notes form an integral part of these consolidated financial statements.
HSBC Bank Canada First quarter 2020 interim report 33

1 Basis of preparation and significant accounting policies
HSBC Bank Canada (‘the Bank’, ‘we’, ‘our’) is an indirectly wholly-owned subsidiary of HSBC Holdings plc. (‘the Parent’, ‘HSBC Holdings’, ‘HSBC Group’). Throughout these interim condensed consolidated financial statements (‘Financial Statements’), the ‘HSBC Group’ means the Parent and its subsidiary companies.
(a) Compliance with International Financial Reporting Standards
The consolidated financial statements have been prepared in accordance with International Accounting Standard (‘IAS’) 34 ‘Interim Financial Reporting’ as issued by the International Accounting Standards Board (‘IASB’) and should be read in conjunction with the bank’s 2019 audited annual consolidated financial statements. The bank’s 2019 audited annual consolidated financial statements have been prepared in accordance with International Financial Reporting Standards (‘IFRS’) and in consideration of the accounting guidelines as issued by the Office of the Superintendent of Financial Institutions Canada (‘OSFI’), as required under Section 308(4) of the Bank Act. Section 308(4) states that except as otherwise specified by OSFI, the financial statements shall be prepared in accordance with IFRS.
(b) Future accounting developments
Future accounting developments have been disclosed in note 1(c) of the 2019 annual consolidated financial statements of the bank’s Annual Report and Accounts 2019.
(c) Presentation of information
The bank’s consolidated financial statements are presented in Canadian dollars which is also its functional currency. The abbreviation ‘$m’ represents millions of dollars. All tabular amounts are in millions of dollars except where otherwise noted.
Certain sections within the accompanying Management’s Discussion and Analysis, that are marked with an asterisk (*), form an integral part of these consolidated financial statements.
(d) Critical accounting estimates and assumptions
The preparation of financial information requires the use of estimates and judgments about future conditions. In view of the inherent uncertainties and the high level of subjectivity involved in the recognition or measurement of items listed below, it is possible that the outcomes in future reporting periods could differ from those on which management’s estimates are based. This could result in materially different estimates and judgments from those reached by management for the purposes of the consolidated financial statements. Management’s selection of the bank’s accounting policies which contain critical estimates and judgments are listed below and are described further in the ‘Critical accounting estimates and judgments’ section of Management’s Discussion and Analysis of the bank’s Annual Report and Accounts 2019. It reflects the materiality of the items to which the policies are applied and the high degree of judgment and estimation uncertainty involved.
• Expected credit loss;
• Valuation of financial instruments;
• Income taxes and deferred tax assets; and
• Defined benefit obligations.
(e) Consolidation
The consolidated financial statements comprise the consolidated financial statements of the bank and its subsidiaries as at 31 March 2020. The method adopted by the bank to consolidate its subsidiaries is described in note 2(a) of the 2019 annual consolidated financial statements of the bank’s Annual Report and Accounts 2019.
(f) Significant accounting policies
There have been no significant changes to the bank’s significant accounting policies which are disclosed in Note 2 (a) to (r) of the 2019 annual consolidated financial statements of the bank’s Annual Report and Accounts 2019.
Notes on the Consolidated Financial Statements (unaudited)
34 HSBC Bank Canada First quarter 2020 interim report

2 Net fee income
Net fee income by global business
Quarter ended
31 Mar 2020 31 Mar 2019
CommercialBanking
GlobalBanking and
Markets
Retail Banking and
Wealth Management Total
CommercialBanking
GlobalBanking and
Markets
Retail Banking and Wealth
Management Total
$m $m $m $m $m $m $m $m
Account services 10 2 4 16 10 2 3 15
Broking income — — 4 4 — — 2 2
Cards 5 — 13 18 5 — 10 15
Credit facilities 64 14 — 78 57 14 — 71
Funds under management — — 48 48 — — 45 45
Imports/exports 2 — — 2 3 — — 3
Insurance agency commission — — 1 1 — — 1 1
Other 9 4 1 14 6 4 2 12
Remittances 6 2 1 9 5 2 1 8
Underwriting 1 10 — 11 — 7 — 7
Fee income 97 32 72 201 86 29 64 179
Less: fee expense (4) (2) (17) (23) (3) (3) (17) (23)
Net fee income 93 30 55 178 83 26 47 156
3 Employee compensation and benefits
Included within ‘Employee compensation and benefits’ are components of net periodic benefit cost related to the bank’s pension plans and other post-employment benefits, as follows:
Quarter ended
31 Mar 2020 31 Mar 2019
$m $m
Defined benefit plans 6 6
– pension plans 4 4
– non-pension plans 2 2
Defined contribution pension plans 10 10
Total 16 16
A re-measurement of the net defined benefit liability has occurred in accordance with the bank’s accounting policy as described on page 72 of the Annual Report and Accounts 2019.
4 Segment analysis
We manage and report our operations according to four operating segments: three global businesses and a corporate centre. The three global businesses are Commercial Banking, Global Banking and Markets, and Retail Banking and Wealth Management. Various estimate and allocation methodologies are used in the preparation of the segment financial information. We allocate expenses directly related to earning revenue to the segment that earned the related revenue. Expenses not directly related to earning revenue, such as overhead expenses, are allocated using appropriate formulas. Segments’ net interest income reflects internal funding charges and credits on the global businesses’ assets, liabilities and capital, at market rates, taking into account relevant terms. The offset of the net impact of these charges and credits is reflected in Corporate Centre.
HSBC Bank Canada First quarter 2020 interim report 35

Profit for the period
Quarter ended
31 Mar 2020 31 Mar 2019
Commercial Banking
Global Banking
and Markets
Retail Banking and
Wealth Management
Corporate Centre Total
Commercial Banking
Global Banking
and Markets
Retail Banking and
Wealth Management
Corporate Centre Total
$m $m $m $m $m $m $m $m $m $m
Net interest income 151 33 125 9 318 151 24 126 22 323
Net fee income 93 30 55 — 178 83 26 47 — 156
Net income from financial instruments held for trading 10 — 10 6 26 9 30 8 1 48
Other income 1 — 3 20 24 1 — 3 14 18
Total operating income 255 63 193 35 546 244 80 184 37 545
Change in expected credit losses and other credit impairment charges - (charge)/release (117) (14) (9) — (140) 14 (1) (1) — 12
Net operating income 138 49 184 35 406 258 79 183 37 557
– external 158 44 169 43 414 274 78 168 37 557
– inter-segment (20) 5 15 (8) (8) (16) 1 15 — —
Total operating expenses (101) (42) (167) (17) (327) (101) (40) (176) (11) (328)
Profit before income tax expense 37 7 17 18 79 157 39 7 26 229
Balance sheet information
Commercial Banking
Global Banking and
Markets
Retail Banking and
Wealth Management
Corporate Centre Total
$m $m $m $m $m
At 31 Mar 2020
Loans and advances to customers 28,889 5,040 29,715 — 63,644
Customers’ liability under acceptances 2,566 1,883 12 — 4,461
Total external assets 32,691 29,725 30,423 32,635 125,474
Customer accounts 21,980 5,882 35,559 2,030 65,451
Acceptances 2,576 1,886 12 — 4,474
Total external liabilities 25,821 26,549 37,701 28,791 118,862
At 31 Dec 2019
Loans and advances to customers 28,240 4,178 29,504 — 61,922
Customers’ liability under acceptances 1,978 1,510 12 — 3,500
Total external assets 31,371 18,531 30,078 26,591 106,571
Customer accounts 21,019 5,437 34,123 2,310 62,889
Acceptances 1,982 1,511 12 — 3,505
Total external liabilities 24,284 17,181 36,212 22,785 100,462
5 Trading assets
At
31 Mar 2020 31 Dec 2019
Footnote $m $m
Debt securities
– Canadian and Provincial Government bonds 1 4,084 3,496
– treasury and other eligible bills 849 464
– other debt securities 279 362
At the end of the period 5,212 4,322
Trading assets
– not subject to repledge or resale by counterparties 2,665 2,170
– which may be repledged or resold by counterparties 2,547 2,152
At the end of the period 5,212 4,322
1. Including government guaranteed bonds.
Notes on the Consolidated Financial Statements (unaudited)
36 HSBC Bank Canada First quarter 2020 interim report

6 Derivatives
For a detailed description of the type, use of derivatives and accounting policies, refer to note 2 and note 12 of the bank’s Annual Report and Accounts 2019.
Notional contract amounts and fair values of derivatives by product contract type held
Notional contract amount1
Fair value – Assets Fair value – Liabilities
Held for trading
Hedge accounting
Held for trading
Hedge accounting Total
Held for trading
Hedge accounting Total
$m $m $m $m $m $m $m $m
Foreign exchange 178,738 372 4,386 — 4,386 4,338 43 4,381
Interest rate 404,174 24,443 4,360 263 4,623 4,303 650 4,953
Commodity 4 — — — — — — —
At 31 Mar 2020 582,916 24,815 8,746 263 9,009 8,641 693 9,334
Foreign exchange 148,681 958 1,562 — 1,562 1,529 58 1,587
Interest rate 393,562 26,860 1,588 117 1,705 1,620 224 1,844
Commodity 10 — — — — — — —
At 31 Dec 2019 542,253 27,818 3,150 117 3,267 3,149 282 3,431
1. The notional contract amounts of derivatives held for trading purposes and derivatives designated in hedge accounting relationships indicate the nominal value of transactions outstanding at the balance sheet date; they do not represent amounts at risk.
Derivatives in hedge accounting relationships
Fair value hedging instrument by hedged risk
At
31 Mar 2020 31 Dec 2019
Carrying amount Carrying amount
Notional amount Assets Liabilities
Notional amount Assets Liabilities
$m $m $m $m $m $m
Interest rate 14,248 45 648 14,452 72 180
Total 14,248 45 648 14,452 72 180
Cash flow hedging instrument by hedged risk
At
31 Mar 2020 31 Dec 2019
Carrying amount Carrying amount
Notional amount Assets Liabilities
Notional amount Assets Liabilities
$m $m $m $m $m $m
Foreign currency 372 — 43 958 — 58
Interest rate 10,195 218 2 12,408 44 44
Total 10,567 218 45 13,366 44 102
7 Financial investments
Carrying amount of financial investments
At
31 Mar 2020 31 Dec 2019
Footnote $m $m
Debt securities 23,247 23,625
– Canadian and Provincial Government bonds 1 14,596 14,577
– international Government bonds 1 2,954 3,326
– other debt securities issued by banks and other financial institutions 4,483 4,105
– treasury and other eligible bills 1,214 1,617
Equity securities 15 20
At the end of the period 23,262 23,645
Financial investments 23,262 23,645
– not subject to repledge or resale by counterparties 20,006 20,083
– which may be repledged or resold by counterparties 3,256 3,562
1. Includes government guaranteed bonds.
HSBC Bank Canada First quarter 2020 interim report 37

8 Other assets
At
31 Mar 2020 31 Dec 2019
$m $m
Accounts receivable and other 532 350
Settlement accounts 4,181 710
Cash collateral 2,482 510
Other 15 10
At the end of the period 7,210 1,580
9 Trading liabilities
At
31 Mar 2020 31 Dec 2019
$m $m
Net short positions in securities 2,907 2,296
At the end of the period 2,907 2,296
10 Debt securities in issue
At
31 Mar 2020 31 Dec 2019
$m $m
Bonds and medium term notes 9,885 11,091
Covered bonds 2,460 2,266
Money market instruments 4,270 1,237
At the end of the period 16,615 14,594
Term to maturity
At
31 Mar 2020 31 Dec 2019
$m $m
Less than 1 year 6,909 4,018
1-5 years 9,631 10,452
5-10 years 75 124
At the end of the period 16,615 14,594
11 Other liabilities
At
31 Mar 2020 31 Dec 2019
Footnote $m $m
Mortgages sold with recourse 1,827 1,715
Lease liabilities 264 258
Accounts payable 230 256
Settlement accounts 2,096 915
Cash collateral 127 211
Loans payable 1 1,268 —
Other 27 18
Share based payment related liability 11 11
At the end of the period 5,850 3,384
1. During the quarter, the bank entered into two borrowing agreements with the HSBC Group which are related party transactions. Further details on related party transactions can be found in note 29 of our Annual Report and Accounts 2019.
Notes on the Consolidated Financial Statements (unaudited)
38 HSBC Bank Canada First quarter 2020 interim report

12 Fair values of financial instruments
The accounting policies, control framework and hierarchy used to determine fair values at 31 March 2020 are consistent with those applied for the Annual Report and Accounts 2019.
Financial instruments carried at fair value and bases of valuation
Valuation techniques
Quoted market price
Level 1
Using observable
inputsLevel 2
With significant
unobservable inputs
Level 3 Total
$m $m $m $m
Recurring fair value measurements
At 31 Mar 2020
Assets
Trading assets 5,022 189 1 5,212
Other financial assets mandatorily measured at fair value through profit or loss — 6 — 6
Derivatives — 9,009 — 9,009
Financial investments 23,247 15 — 23,262
Liabilities
Trading liabilities 2,868 39 — 2,907
Derivatives — 9,334 — 9,334
At 31 Dec 2019
Assets
Trading assets 4,257 65 — 4,322
Other financial assets mandatorily measured at fair value through profit or loss — 5 — 5
Derivatives — 3,267 — 3,267
Financial investments 23,612 33 — 23,645
Liabilities
Trading liabilities 2,286 10 — 2,296
Derivatives — 3,431 — 3,431
Transfers between Level 1 and Level 2 fair values
Assets Liabilities
Trading assetsFinancial
investmentsTrading
liabilities
$m $m $m
Quarter ended 31 Mar 2020
Transfer from Level 1 to Level 2 25 — 53
Transfer from Level 2 to Level 1 — 12 —
Quarter ended 31 Mar 2019
Transfer from Level 1 to Level 2 11 33 —
Transfer from Level 2 to Level 1 4 276 1
Transfers between levels of the fair value hierarchy are deemed to occur at the end of each reporting period. Transfers into and out of levels of the fair value hierarchy are primarily attributable to observability of valuation inputs and price transparency.
Fair values of financial instruments not carried at fair value
The bases for measuring the fair values of financial instruments not carried at fair value are explained on pages 97 and 98 of the Annual Report and Accounts 2019.
Fair values of financial instruments not carried at fair value
At
31 Mar 2020 31 Dec 2019
Carrying amount Fair value Carrying amount Fair value
Footnote $m $m $m $m
Assets
Loans and advances to customers 1 63,644 63,748 61,922 61,917
Liabilities
Customer accounts 65,451 65,734 62,889 63,166
Debt securities in issue 16,615 17,143 14,594 14,722
Subordinated liabilities 1,033 1,002 1,033 1,030
1. Loans and advances to customers specifically relating to Canada: carrying amount $59,810m and fair value $59,908m.
HSBC Bank Canada First quarter 2020 interim report 39

Other financial instruments not carried at fair value are typically short term in nature and reprice to current market rates frequently. Accordingly, their carrying amount is a reasonable approximation of fair value.
13 Legal proceedings and regulatory matters
The bank is subject to a number of legal proceedings and regulatory matters arising in the normal course of our business. The bank does not expect the outcome of any of these proceedings, in aggregate, to have a material effect on its consolidated balance sheet or its consolidated income statement.
14 Events after the reporting period
On 24 April 2020, the bank declared regular quarterly dividends for the second quarter of 2020 on all series of HSBC Bank Canada Class 1 preferred shares, to be paid in accordance with their terms in the usual manner on 30 June 2020 or the first business day thereafter to shareholder of record on 15 June 2020. As the dividends on preferred shares for the second quarter of 2020 were declared after 31 March 2020, the amounts have not been included in the balance sheet as a liability.
Changes in the COVID-19 situation subsequent to 31 March 2020, including the oil price movements in April 2020, could impact the measurement of assets and liabilities reported by the bank, as well as the stage distribution of credit exposures within its lending portfolios and the corresponding expected credit loss allowances. Further changes to economic and market conditions could also impact the fair value and liquidity of financial instruments. Many programs have been initiated by the Bank of Canada and Federal and Provincial governments to provide financial support to parts of the economy most impacted by the COVID-19 outbreak. The full extent of these relief programs, how they will operate, and impacts on our customers and the bank continue to evolve. The bank continues to monitor the situation closely, including regular monitoring of liquidity and capital levels.
There have been no other material events after the reporting period which would require disclosure or adjustment to the 31 March 2020 interim condensed consolidated financial statements.
These accounts were approved by the Board of Directors on 24 April 2020 and authorized for issue.
Notes on the Consolidated Financial Statements (unaudited)
40 HSBC Bank Canada First quarter 2020 interim report

Shareholder information
PRINCIPAL ADDRESSES INVESTOR RELATIONS CONTACT
Vancouver: Enquiries may be directed to Investor
HSBC Bank Canada Relations by writing to:
300-885 West Georgia Street
Vancouver, British Columbia HSBC Bank Canada
Canada V6C 3E9 Investor Relations -
Tel: 604-685-1000 Finance Department
Fax: 604-641-3098 4th Floor
2910 Virtual Way
Toronto: Vancouver, British Columbia
HSBC Bank Canada Canada V5M 0B2
70 York Street Email: [email protected]
Toronto, Ontario
Canada M5J 1S9
Media Inquiries:
English:
416-868-3878
604-641-1905
416-868-8282
French:
416-868-8282
Website
www.hsbc.ca
Social Media
Twitter: @HSBC_CA
Facebook: @HSBCCanada
YouTube: HSBC Canada
More HSBC contacts
HSBC Global Asset Management (Canada) Limited
1 (888) 390-3333
HSBC Investment Funds (Canada) Inc.
1 (800) 830-8888
www.hsbc.ca/funds
HSBC Private Wealth Services (Canada) Inc.
1 (844) 756-7783
HSBC Securities (Canada) Inc.
1 (800) 760-1180
For more information, or to find the HSBC Bank Canada branch nearest you, call 1 (888) 310-4722 or visit our website at www.hsbc.ca
HSBC Bank Canada First quarter 2020 interim report 41