Embed Size (px)
Citation preview

August 17, 2015
HSIL Ltd.
Solid Market Leader… leveraging customers with more solutions!
CMP INR 285 Target INR 351 (Re)Initiating Coverage - BUY
SKP Securities Ltd www.skpmoneywise.com Page 1 of 18
Key Share Data
Face Value (INR) 2.0
Equity Capital (INR Mn) 144.6
Market Cap 20611.7
52 Week High/Low (INR) 474.4/255.2
6 Month Avg. Daily Volume (NSE) 1,32,087
BSE Code 500187
NSE Code HSIL
Reuters Code HSNT.NS
Bloomberg Code HSI:IN
Shareholding Pattern (as on June 30, 2015)
47%
10%
25%
18%Promoters
FII
DII
Public & Others
Particulars FY14 FY15 FY16E FY17E
Net Sales 18,582.1 19,806.2 22,084.3 24,646.3
Growth (%) 5.5% 6.6% 11.5% 11.6%
EBITDA 2,533.1 3,325.2 3,710.2 4,288.5
PAT 339.8 854.4 1,135.4 1,472.3
Growth (%) -58.6% 151.4% 32.9% 29.7%
EPS (INR) 5.1 12.9 15.7 20.4
BVPS (INR) 155.7 183.0 195.5 212.7
Key Financials (INR Million)
Particulars FY14 FY15 FY16E FY17E
P/E (x) 55.4 22.1 18.2 14.0
P/BVPS (x) 1.8 1.6 1.5 1.3
Mcap/Sales (x) 1.0 1.0 0.9 0.8
EV/EBITDA (x) 10.9 7.9 7.1 6.2
ROCE (%) 7.2% 10.9% 12.0% 13.7%
ROE (%) 3.3% 6.5% 8.0% 9.6%
EBITDA Mar (%) 13.6% 16.8% 16.8% 17.4%
PAT Mar (%) 1.8% 4.3% 5.1% 6.0%
Debt - Equity (x) 0.9 0.4 0.4 0.4
Key Financials Ratios
Source: Company, SKP Research
1 Yr price performanceHSIL vis-à-vis BSE Mid Cap
-20%
0%
20%
40%
60%
80%
Aug-14 Oct-14 Jan-15 Mar-15 May-15 Aug-15
HSIL BSE Mid Cap
Company Background
Hindustan Sanitaryware and Industries Limited (HSIL), of R.K.Somany Group, is India’s largest player in sanitaryware (~40% organised market share) and second largest player in glass containers (~17%). It also manufacturers faucets to leverage its customers and channels; PET bottles as a substitute product extension for glass containers and has presence in home retail furnishing.
Investment Rationale
Capacity addition to sustain market share and growth; entering synergic products to leverage customers and sales network
Higher economic growth in India will result in increased buying power in
the hands of a growing affluent and mass affluent segment with aspirations to improve lifestyle. To meet the resultant demand in premium sanitaryware, HSIL is increasing its sanitaryware capacity by 0.4 mn pieces, up 10.5% from its current 3.8 mn pieces capacity at a Capex of ~Rs 570 mn. The expanded capacity is expected to commission by March 2016 with a potential to generate additional revenue of ~Rs 915 mn at full capacity utilization.
HSIL is also venturing into further product extensions; in CPVC & UPVC pipes in building products segment and security caps & closures for protection of products from counterfeiting in packaging product segment, at an investment of Rs 2.17 bn, funded through debt and equity in the ratio of 2:1. Both projects are expected to commission in next 18 months with a potential to generate additional revenue of ~Rs 5.5-6.0 bn over next 4-5 years.
Turnaround in container glass business
In the last few years, HSIL’s packaging business (primarily glass containers) did not fare well and has been a drag on profitability due to oversupply conditions and muted demand from user industry. It voluntarily shut its 280 TPD capacity at Hyderabad, reducing its total capacity by 18%. Margins have improved now with better capacity utilization and change of fuel mix from furnace oil to pet coke.
Margins expected to improve with better operating leverage
HSIL is set to increase its sanitaryware and faucets current capacity utilization to ~97% and ~57% by FY17E from ~88% and ~35% respectively in FY15, offering visibility of margin improvement due to better operating leverage and product mix.
During FY15, HSIL reported net sales of Rs 19.8 bn, registering a marginal growth of 7% y-o-y due to slowdown in real estate segment, discontinuation of the low margins tiles business and oversupply conditions in the container glass industry.
On the backdrop of strong brand equity and distribution network, increasing disposable income and changing consumer preferences towards premium lifestyle products, HSIL’s net sales is expected to grow at a CAGR of 11.6% during FY15-FY17 to Rs 24.6 bn and EBITDA margins to improve to ~17.4% from 16.8% reported in FY15.
Valuation
GoI’s new initiatives on housing and sanitation will give a fillip to demand of sanitaryware, although not necessarily in HSIL’s premium product segment. Given HSIL’s strong brand equity & distribution network, changing consumer preferences towards premium & lifestyle products along with diverse product basket and a turnaround in its glass containers business augurs well for HSIL. We have valued the stock on SOTP basis and recommend a Buy on HSIL with a target price of Rs 351.3/- in 12 months.
Analysts: Nikhil Saboo
Tel No: +91-33-40077019; Mobile: +91-9330186643
e-mail: [email protected]
Vineet Agrawal
Tel No: +91-22-49226006; Mobile: +91-9819510575
e-mail: [email protected]

HSIL Ltd.
SKP Securities Ltd www.skpmoneywise.com Page 2 of 18
Industry Overview – Sanitaryware & Bathroom Fittings
Size and Growth Trends: Indian sanitaryware contributes ~8% of total global production and is the second largest market in the Asia Pacific Region. India’s sanitaryware and bathroom fittings industry is estimated at ~Rs. 80 bn in FY14 of which sanitaryware itself accounts for more than Rs. 28 bn, growing at a CAGR of 12.5%. This growth trend is likely to continue through 2016. The remaining Rs. 52 bn is attributed to bathroom fittings, which is expected to record a CAGR of 15% until 2016. Organised players comprise ~60% of India’s sanitaryware industry and ~45% of bathroom fittings.
Major players and their market share: Market Leader HSIL, Parryware ROCA and Cera
collectively control ~ 80-85% of the organised sanitaryware industry, resulting in low competition in premium sanitaryware industry.
Usage and Utility: Demand for sanitaryware is highest in residential sector followed by
commercial sector which includes malls, offices, hotels, hospitals etc. Only ~40% of the
total population of India enjoys sanitation facilities. About 70% population in rural areas
and 19% in urban areas are deprived from sanitation facilities. 92% demand originates
from new customers and 8% comes from the replacement market. As such, there is
enough growth potential for sanitaryware industry in India.
Opportunities & Demand Drivers
Low Sanitation Penetration: Sanitation penetration is lowest in India vis-a-vis other
emerging economies. According to Census 2011, the national sanitation coverage is
~40%, whereas rural sanitation coverage has remained a mere 30.7%. Rising need for
sanitation and special initiatives taken by the government to enhance sanitation
penetration indicates ample scope and growth available in the industry, going forward.
Exhibit: Asian Sanitation Levels
Source: Company, SKP Research
36
59
65
82
92
93
100
India
Indonesia
China
Korea
Sri Lanka
Thailand
Singapore
Changing demographics to drive demand: With 50% of India population below the age
of 30, the country’s ‘youth bulge’ is unequivocal about change, and demands better quality
products. Shift in consumer preferences along with greater brand awareness, superior
standards of living and higher disposable income, has opened opportunities for new
products, leading to a shift from unorganised to organised sector.
Government’s Initiatives to improve sanitation: GoI is taking special initiatives to
improve sanitation penetration in India. It has launched a multi-million dollar sanitation
project, ‘Nirmal Bharat Abhiyaan’ to raise awareness and improve sanitation levels in
HSIL Ltd.
SKP Securities Ltd www.skpmoneywise.com Page 3 of 18
India. Although, this may not have a direct impact on premium quality producers like HSIL,
there will certianly be a rub off effect. GoI also plans to develop 100 smart cities in India,
which would further boost the demand for sanitaryware products, including premium ones.
Heavily dependent on real estate market: Sanitaryware industry is quite dependent on
real estate sector as majority demand comes from new construction. Various initiatives of
Central and State Governments will revitalise the real estate and housing sector in the
country. With increasing urbanisation and infrastructure growth, urban population is
expected to reach to about 600 mn by 2031 which would lead to enhanced demand for
modern housing and building products thereby increasing demand for sanitaryware.
The middle income segment has become one of the principal drivers for real estate boom.
This segment has grown from 11 mn households in 2001-02 to 31 mn households in 2010-
11and is further expected to grow to 114 mn households by 2025-26.
Industry Overview – Packaging Industry
Global Packaging Industry: The global packaging industry is estimated at ~USD 36.8
billion (2013), of which the container glass segment accounts for the largest share and
provides a diverse range of glass packaging solutions for food, pharmaceuticals, soft
drinks, spirits, beers, wine and other industries. The industry is witnessing sustainable rise
in exports from India. Substantial investments in technology and adherence to stringent
global quality norms have led to rising demand for Indian products.
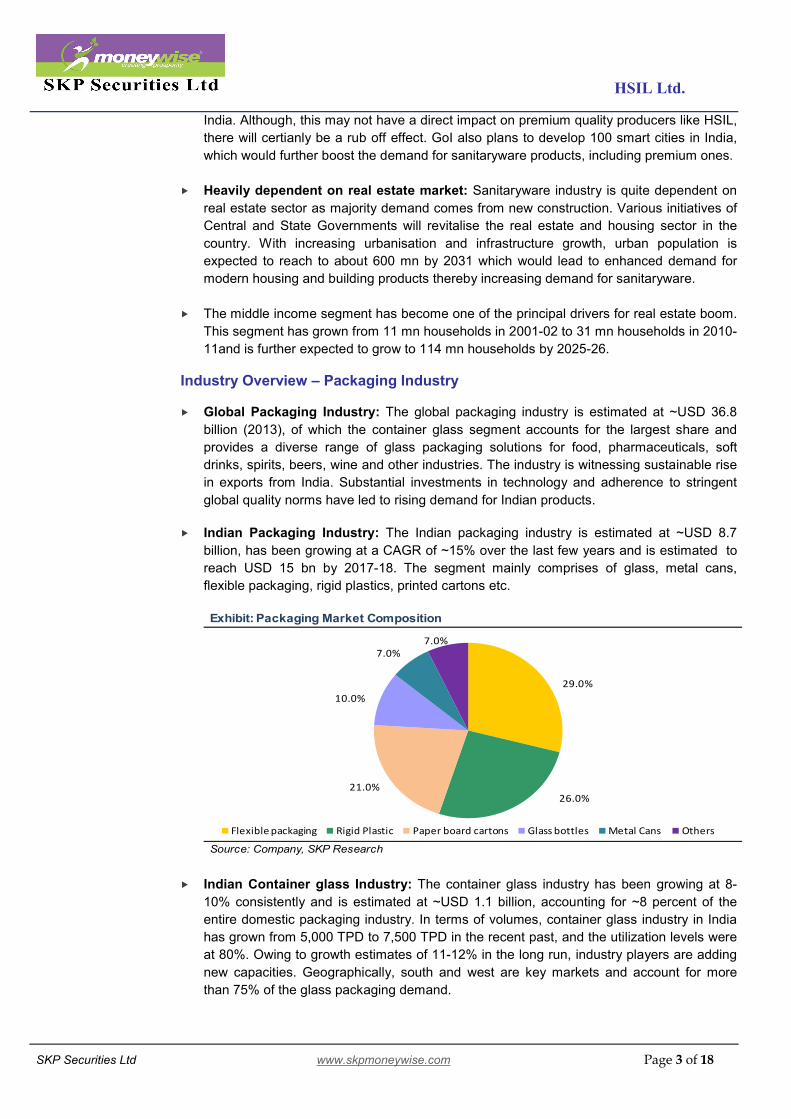
Indian Packaging Industry: The Indian packaging industry is estimated at ~USD 8.7
billion, has been growing at a CAGR of ~15% over the last few years and is estimated to
reach USD 15 bn by 2017-18. The segment mainly comprises of glass, metal cans,
flexible packaging, rigid plastics, printed cartons etc.
Source: Company, SKP Research
Exhibit: Packaging Market Composition
29.0%
26.0%21.0%
10.0%
7.0%7.0%
Flexible packaging Rigid Plastic Paper board cartons Glass bottles Metal Cans Others
Indian Container glass Industry: The container glass industry has been growing at 8-
10% consistently and is estimated at ~USD 1.1 billion, accounting for ~8 percent of the
entire domestic packaging industry. In terms of volumes, container glass industry in India
has grown from 5,000 TPD to 7,500 TPD in the recent past, and the utilization levels were
at 80%. Owing to growth estimates of 11-12% in the long run, industry players are adding
new capacities. Geographically, south and west are key markets and account for more
than 75% of the glass packaging demand.
HSIL Ltd.
SKP Securities Ltd www.skpmoneywise.com Page 4 of 18
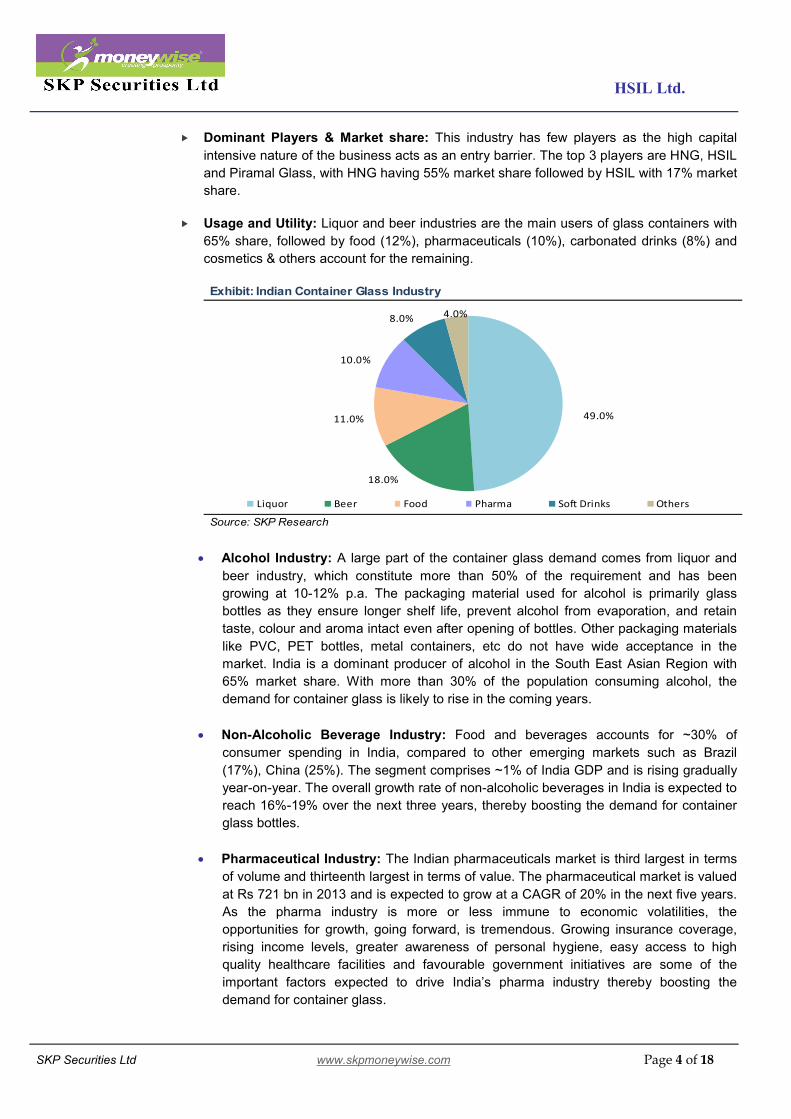
Dominant Players & Market share: This industry has few players as the high capital
intensive nature of the business acts as an entry barrier. The top 3 players are HNG, HSIL
and Piramal Glass, with HNG having 55% market share followed by HSIL with 17% market
share.
Usage and Utility: Liquor and beer industries are the main users of glass containers with
65% share, followed by food (12%), pharmaceuticals (10%), carbonated drinks (8%) and
cosmetics & others account for the remaining.
Source: SKP Research
Exhibit: Indian Container Glass Industry
49.0%
18.0%
11.0%
10.0%
8.0% 4.0%
Liquor Beer Food Pharma Soft Drinks Others
Alcohol Industry: A large part of the container glass demand comes from liquor and
beer industry, which constitute more than 50% of the requirement and has been
growing at 10-12% p.a. The packaging material used for alcohol is primarily glass
bottles as they ensure longer shelf life, prevent alcohol from evaporation, and retain
taste, colour and aroma intact even after opening of bottles. Other packaging materials
like PVC, PET bottles, metal containers, etc do not have wide acceptance in the
market. India is a dominant producer of alcohol in the South East Asian Region with
65% market share. With more than 30% of the population consuming alcohol, the
demand for container glass is likely to rise in the coming years.
Non-Alcoholic Beverage Industry: Food and beverages accounts for ~30% of
consumer spending in India, compared to other emerging markets such as Brazil
(17%), China (25%). The segment comprises ~1% of India GDP and is rising gradually
year-on-year. The overall growth rate of non-alcoholic beverages in India is expected to
reach 16%-19% over the next three years, thereby boosting the demand for container
glass bottles.
Pharmaceutical Industry: The Indian pharmaceuticals market is third largest in terms
of volume and thirteenth largest in terms of value. The pharmaceutical market is valued
at Rs 721 bn in 2013 and is expected to grow at a CAGR of 20% in the next five years.
As the pharma industry is more or less immune to economic volatilities, the
opportunities for growth, going forward, is tremendous. Growing insurance coverage,
rising income levels, greater awareness of personal hygiene, easy access to high
quality healthcare facilities and favourable government initiatives are some of the
important factors expected to drive India’s pharma industry thereby boosting the
demand for container glass.

HSIL Ltd.
SKP Securities Ltd www.skpmoneywise.com Page 5 of 18
Food Packaging Industry: India’s packaged food industry is valued at more than USD
24 bn and is expected to grow at a CAGR of 12% during next 4-5 years. Within the
food packaging industry, container glass segment is growing at 15% annually. The per
capita consumption of packaged food in India is as low as 4.3 kg as against Germany’s
42 kg and Taiwan’s 20 kg, which in turn provides ample scope of growth.
Exhibit: Demand Forecast: Glass bottle packaging market
Source: Company, SKP Research
2990 3190 4330
30540 33260
50300
85009110
12900
0
10000
20000
30000
40000
50000
60000
70000
80000
2011-12 2012-13 2017-18
Fig
s. in
Rs
mill
ion
Food Beverages Non-Foods
Food CAGR: 8.3% Beverages CAGR: 8.6% Non-food CAGR: 7.2% Total CAGR: 7.2%
Opportunities & Demand Drivers
Favourable Demographics to boost demand: Favourable demographics like
proportionate rise in youth population, shift in consumer preferences from unbranded to
branded ones and rise in organised retail would boost the demand and drive growth for
consumer industry of container glass.
Per capita consumption of user industry is low: The demand for the glass packaging
industry is largely dependent on the user industries mainly alcoholic and other beverages,
pharmaceuticals and food. India is one of the lowest consumer of beer and liquor at less
than 2 litres. Liquor industry is expected to grow at 8% CAGR, while pharma industry is
slated to grow at 20% for the next 5 years and food industry is expected to double in the
next 5 years. The expected growth in the user industry coupled with low per capita
consumption indicates ample scope for container glass industry going forward.

HSIL Ltd.
SKP Securities Ltd www.skpmoneywise.com Page 6 of 18
Exhibit: Per Capita Beer Consumption (Litres)
Source: Company, SKP Research
2
37
45
67
68
70
78
110
India
China
Japan
Russia
Brazil
UK
USA
Germany
Increasing emphasis on health based packaging: Food and drug regulators have put
special emphasis on hazards due to inappropriate packaging and have put greater
importance on the usage of safe recycled products like glass thereby driving the
consumption of glass as a packing substance.
PET Bottles Industry
Polyethylene Terephthalate (PET) is thermoplastic polyester which is widely used for the
production of beverage bottles. It is also used as a flexible packaging film due to its high
clarity, low permeability and excellent printability. Globally, PET demand is expected to
grow at a CAGR of 5-6% over the next five years and 15-18% domestically. The superior
characteristics of PET are expected to drive the growth of PET bottles for the industry.
India, Brazil, Russia and China are expected to dominate the overall PET market, with
India and China expected to emerge as market leaders. Asia-Pacific region is the
prominent consumer of PET accounting for ~40% of the global PET demand. Also global
demand for PET resin was 15.3 mn tonnes in 2012 which is expected to grow at 19.5%
CAGR during 2012-17.
Carbonated Soft Drinks (CSD) market is the largest consumer for PET bottles (blow
moulds) today. India is a major manufacturer and importer of soft drink beverages. The
Indian soft drink industry is vast and has been rapidly growing y-o-y. The volume of soft
drinks consumed in India stood at a whopping 11,755 mn litres in 2013. The industry has
grown at a CAGR of 11.2% during 2008-2013. It is further expected that soft drinks
industry may grow at a CAGR of 19%till 2018.

HSIL Ltd.
SKP Securities Ltd www.skpmoneywise.com Page 7 of 18
Company Profile
HSIL was incorporated in 1960 as Hindustan Twyfords Ltd, in collaboration with Twyfords
Ltd, UK, to introduce vitreous china ceramic sanitaryware in India. The name was changed
to Hindustan Sanitaryware & Industries Ltd, in 1967 and to HSIL Ltd, in 2009.
It diversified into manufacturing of container glass in 1981, through acquisition of
Associated Glass Industries Ltd. It acquired faucet and accessories unit of Havells in May
2010 and launched products under the brand name Benelave. In 2012, it acquired Garden
Polymers Private Ltd., marking its entry into PET bottle segment.
Source: Company, SKP Research
Exhibit: Key Milestones
1960: Incorporated as Hindustan Twyfords Ltd. to introduce vitreous China for the first time in India
1962: Commercial production at Bahadurgarh started (sanitaryware)
1967: Changes name to Hindustan Sanitaryware & Industries Limited
1981: Forays into container glass manufacturing through acquisition of Associated Glass Industries Ltd.
1989: Expanded ceramics capacity through acquisition of Krishna Ceramics Ltd. (Bibinagar)
1991: Launches Hindware Brand
1999: Acquired Raasi Ceramics, further expands its sanitaryware business
2000: Building Products Division expanded to Bathroom Wellness category (Bathtubs, Showers etc.)
2003: Strategic partnership with Sanitec for introducing high-end Keramag Brand in the Indian market
2004: Building Products Division expanded to chrome plated bathroom fittings (faucets)
2008: Entered into home interior fashion design retail industry through its subsidiary HHRPL.
Changes name to HSIL Ltd.Commissioned new container glass capacity of 475 MTPA at Bhongir, A.P.Launches Hindware Lacasa display showrooms
2009:
Acquired bath fittings business of Havells India & UK based Barwood Products Ltd.Forays into tiles business
2010:
Launches premium bath fittings brand BENELAVELaunches luxury brand QUEO
2011:
Completes expansion of sanitaryware (0.7mn psc) at Bibinagar and faucets plant at Bhiwadi Completes expansion of container glass capacity at Bhongir (475 MTPA)
2012:
Garden Polymer Private Ltd. merged with HSIL Ltd.Container glass division renamed as "Packaging Product Division"
2014:

HSIL Ltd.
SKP Securities Ltd www.skpmoneywise.com Page 8 of 18
The company has eight manufacturing facilities in India - three in Andhra Pradesh (two
container glass units and one sanitaryware unit), two at Rajasthan (faucet units) and one
each in Haryana (sanitaryware unit), Uttarakhand (plastic containers) and Karnataka
(plastic containers).
Exhibit: Plant Overview
Plant Location Capacity Plant Location Capacity
Bahadurgar, Haryana 1.8 Bhiwadi, Rajasthan 0.5
Bibinagar, Telangana 2 Kaharani, Rajasthan 2.5
Total Capacity 3.8 Total Capacity 3.0
Container Glass
Plant Location Capacity Plant Location Capacity
Sanathnagar, Hyderabad 650 Selaqui, Uttarakhand 7050
Bhongir, Telangana 950 Dharwad, Karnataka 2450
Total Capacity 1600 Total Capacity 9500.0
Source: Company, SKP Research
Building Products (Figs in mn pieces)
Sanitaryware Faucets
Packaging Products (Figs in TPD)
PET Bottles
Raw Materials: HSIL has a strategic raw material substitution policy, to avoid dependence
on a few suppliers without affecting the overall quality levels.
Sanitaryware
Faucets
Container Glass
PET Bottles
Exhibit: Raw materials used in production process
Source: Company, SKP Research
Particulars
Build
ing
Segm
ent
Pack
agin
g
Segm
ent
Raw Materials Used
Kaolinite, clay, feldspar, quartz sand etc.
Brass etc.
Sil ica, l imestone, dolomite, soda ash, cullet etc.
Polyethylene terepeththalate (PET)
Power & fuel is one of the major costs for HSIL. Over the years the company has
successfully been able to curtail its power & fuel cost (from 22.9% of sales in FY13 to
14.1% in FY15) by replacing it with cheaper substitutes (replacing high cost furnace oil to
fluidised pet coke). Going forward, we expect the power & fuel cost to remain stable and
any further cost saving initiatives would have positive impact on margins.

HSIL Ltd.
SKP Securities Ltd www.skpmoneywise.com Page 9 of 18
HSIL is engaged in manufacturing of building products and packaging products. The
product range in building products includes bathroom fittings, bath tubs, shower partitions,
shower enclosures, shower panels, kitchen appliances, sinks, ceramic tiles etc. while
product range in packaging products includes container glass and PET bottles.
* Manufactured
# Outsourced
Source: Company, SKP Research
Exhibit: Building Products Details
Building Products
Sanitaryware & Faucets *
Sanitaryware & Faucets #
Allied Products (Outsourced)
Hindware Italian Collection PVC Cisterns
Hindware Art Fitting & Seat Covers
Bathtubs, Showers, Enclosures, Whirlpools
Bath Accessories
Kitchen Sinks
Kitchen Chimneys & Hobs
Tiles
Vents
Queo:Luxury Sanitaryware Brand
AMore:Luxury Well ness & SPA Brands
Hindware
Raasi
Benelave
Market share: At present, HSIL is the largest manufacturer of sanitaryware products, with
~40% market share of the organised industry. It is also the market leader in the container
glass segment in the south (~66% market share) and the second largest player in India
with ~17% market share.
Robust distribution network: Over the years, HSIL established a strong and widespread
distribution network, encompassing ~3,000 dealers, ~18,000 retailers, 19 service locations
comprising 300 plumbers covering 600+ districts across India. Apart from this, company
also has ~458 hindware shop-in-shops, ~100 hindware Gallerias and direct dealer outlets.
This has helped the company to reach wide spectrum of retail customers and maintain its
dominating position in the sanitaryware industry. It plans to further expand dealer network,
gallerias, and shop-in-shops and increase its presence to Tier II & Tier III towns.

HSIL Ltd.
SKP Securities Ltd www.skpmoneywise.com Page 10 of 18
Strong brand recall: The Company’s greatest asset is the recall value of its brands
among customers. HSIL has separate category brands for different price points: Rassi &
Benelave for mass affluent, Hindware, Hindware Art & Hindware Italian for premium
segments, Amora and Queo for luxury segments. Major brands include Hindware Italian
collection, Hindware Art and Hindware, account for more than 50% of building products
revenues.
Category Brands Offerings
Exhibit: HSIL brands at a glance
This segment offers complete range of world class faucets
and accessories. The business was acquired from Havells
India in May, 2010.
Hindware Art and Hindware Italian collection offers high
value added bathroom fittings ( cisterns, water closets,
urinals, and wash basins) whereas Hindware also offers
kitchen appliances (chimneys and built-in-ovens).
Mass
Rassi
&
Benelave
Premium
Hindware,
Hindware ART
&
Hindware Italian
collection
Note: Vents, Evok excluded as they are not sanitaryware products
Source: Company, SKP Research
LuxuryQueo, UK
& Amore
Queo brand offers high-end luxury sanitaryware from
Barwood, UK. As of December 2014, it has over 80 dealers.
Amore brand offers range of wellness products and
targets high end bathware segment. As of December 2014,
it has over 90 dealers.
EVOK Brand: HSIL operates its home retail furnishing business via its wholly-owned
subsidiary Hindware Home Pvt Ltd (HHRPL). HSIL launched its mega store under the
brand name “Evok” and currently has 19 retail outlets all over India. It is a chain of
specialty home showcasing a range of over 20,000 home interior products and provides
‘value for style’ home interior solutions for B2C business whereas ‘design to build’ interior
solutions to B2B businesses. In FY14, EVOK introduced a franchisee model opportunity in
North and South India to focus on Modular kitchens, a novel and upcoming concept in mini
metros with good business potential. This segment accounted for ~Rs 1.3 bn of FY15
consolidated revenues.
Outsourcing of products: HSIL also undertakes marketing and distribution of outsourced
products to capitalize on its existing brand and distribution network. HSIL latest offering of
its kitchen appliance house aids in effortless and efficient cooking experience. The product
basket is constantly upgraded and modified to match current trends and improved lifestyle
demand.

HSIL Ltd.
SKP Securities Ltd www.skpmoneywise.com Page 11 of 18
Strong client base: Over five decades’ presence in the industry has enabled HSIL to
develop long standing customer relationships. It serves ~1,500 institutional clients in
building product segment and ~550 institutional clients in packaging product division. In
the building segment, company’s prominent client’s names include L&T, Shaporji Pallonji,
DLF, Prestige Group, Puravankara, Lokhandwala Developers etc. while in the packaging
segment it caters to growing brands like United Spirits, United Breweries, SAB Miller,
Pfizer, GSK, Ranbaxy, HUL, ITC Ltd, Coca Cola, Pepsi etc.
Liquor &
Beer
Food
Soft Drinks
Pharma
Source: Company, SKP Research
Exhibit: Clientele Base
Pac
kagi
ng
Div
isio
nB
uild
ing
Pro
du
cts
Investment Rationale
Capacity additions to sustain market share and growth India’s GDP is expected to grow ~8% in the coming years, resulting in increased buying
power in the hands of a growing and aspiring mass affluent segment. HSIL is increasing
its sanitaryware capacity by 0.4 million pieces (brownfield), of which, 0.1 million pieces is
added at Bahadurgarh and another 0.3 million pieces at Bibinagar respectively to take
advantage of the robust demand in premium category of sanitaryware. Premium category
sanitaryware products contributed ~56-57% to building product segment in FY15.
Capex for the expansion is ~Rs 570 mn which is expected to commission by March 2016
and has a potential to generate additional revenue of ~Rs 915 mn at full capacity.
Segmant Current Capacity Capacity Expansion Post Expansion
Sanitaryware 3.8 0.4 4.2
Faucets 3.0 - 3.0
Figs in million piecesExhibit: Capacity expansion at a glance
Source: Company, SKP research
HSIL Ltd.
SKP Securities Ltd www.skpmoneywise.com Page 12 of 18
HSIL has also planned to venture into new businesses of manufacturing CPVC & UPVC
pipes as an extension in building products segment (its these pipes which run into the
faucets installed on sanitaryware products) and producing security caps & closures for
protection of products from counterfeiting in packaging product segment, at an investment
of Rs 2.17 bn, funded through debt and equity in the ratio of 2:1. Both the projects are
expected to commission in next 18 months with a potential to generate additional revenue
of ~Rs 5.5-6.0 bn over next 4-5 years.
HSIL plans to setup 30,000 TPA capacity for manufacturing CPVC & UPVC (60% CPVC &
40% UPVC) pipes in Gujarat at a capex of Rs 1.05 bn and has entered into an agreement
with M/s Sekisui Chemical Co. Ltd, Japan for supply of CPVC resin. Security caps &
closures is required for protection of products from counterfeiting and mainly used in
pharma and liquor industry. This product will be a value addition to the existing portfolio
of the packaging products division and the company has filed for necessary product
patents for the same.
The overall capacity utilization of the company during FY15 for sanitaryware and faucets
were ~88% and 35%, which we expect to reach ~98% and 57% by FY17E.
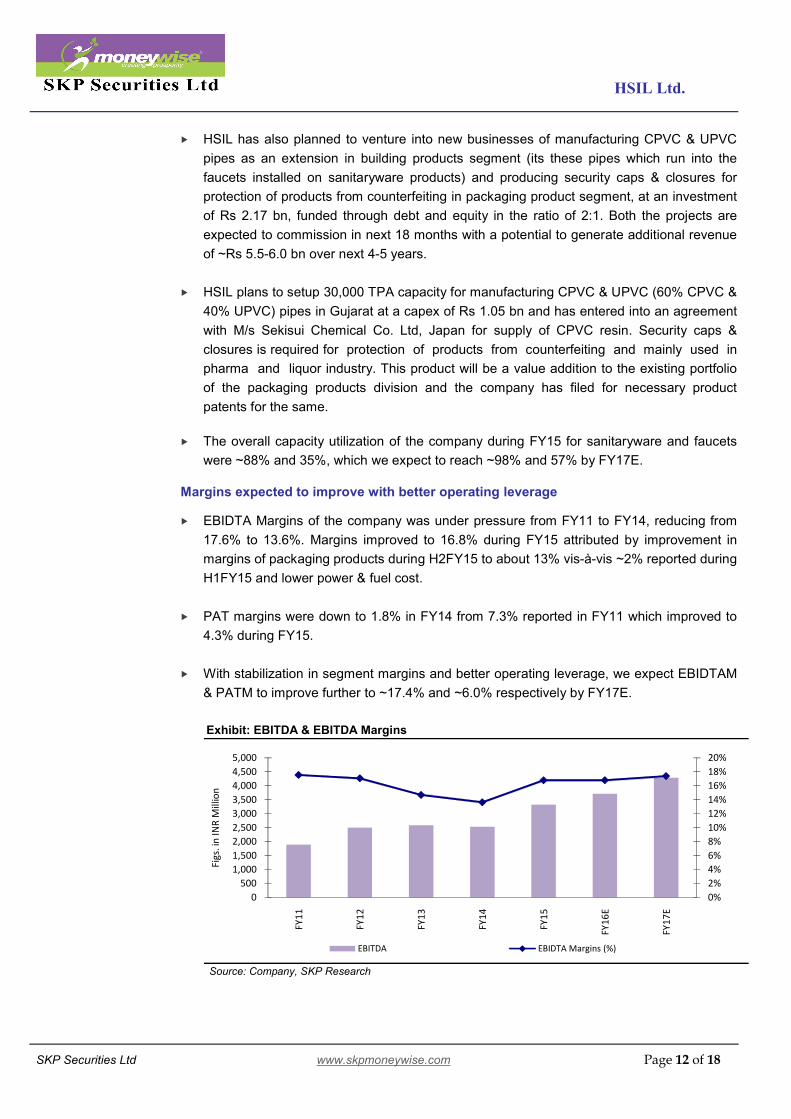
Margins expected to improve with better operating leverage EBIDTA Margins of the company was under pressure from FY11 to FY14, reducing from
17.6% to 13.6%. Margins improved to 16.8% during FY15 attributed by improvement in
margins of packaging products during H2FY15 to about 13% vis-à-vis ~2% reported during
H1FY15 and lower power & fuel cost.
PAT margins were down to 1.8% in FY14 from 7.3% reported in FY11 which improved to
4.3% during FY15.
With stabilization in segment margins and better operating leverage, we expect EBIDTAM
& PATM to improve further to ~17.4% and ~6.0% respectively by FY17E.
Exhibit: EBITDA & EBITDA Margins
Source: Company, SKP Research
0%
2%
4%
6%
8%
10%
12%
14%
16%
18%
20%
0
500
1,000
1,500
2,000
2,500
3,000
3,500
4,000
4,500
5,000
FY1
1
FY1
2
FY1
3
FY1
4
FY1
5
FY1
6E
FY1
7E
Figs
. in
INR
Mill
ion
EBITDA EBIDTA Margins (%)

HSIL Ltd.
SKP Securities Ltd www.skpmoneywise.com Page 13 of 18
Exhibit: ROE & ROCE
Source: Company, SKP Research
11.66%
9.69%7.99%
3.30%
6.46%
8.03%9.58%
12.4%
10.5%
8.4% 7.2%
10.9% 12.0%13.7%
0.00%
2.00%
4.00%
6.00%
8.00%
10.00%
12.00%
14.00%
16.00%
FY1
1
FY1
2
FY1
3
FY1
4
FY1
5
FY1
6E
FY1
7E
ROE D/E (x)
Top-line expected to grow at a CAGR of 11.6% over FY15-17E
In FY15, HSIL reported net sales of Rs 19.8 bn, registering a marginal growth of 7% y-o-y
due to slowdown in building products segment which could be attributed to slowdown in
real estate segment and discontinuation of low margins tiles business. The packaging
business reported 6% muted growth, on the back of oversupply conditions in the industry.
Building products and packaging product segments contributed 47% each, whereas EVOK
brand, under the subsidiary - Hindware Home Retail Pvt Ltd, contributed ~6% to the
consolidated revenues of the Company.
HSIL is the only manufacturer of specialized coloured bottles in India, over and above
regular bottles, catering to the demands of niche players in the segment.
Since, unorganized sector in sanitaryware and faucets accounts for ~62% and 55%
respectively therefore, on the backdrop of strong brand equity and distribution network,
changing consumer preferences towards good quality and branded lifestyle products,
increasing disposable income creates a significant potential for HSIL to increase its market
share going forward.
In view of the facts mentioned above, we expect HSIL to grow at a CAGR of 11.6% during
FY15-FY17 with 13.4% and 9.1% CAGR growth in building products and packaging
products division, respectively.
Source: Company, SKP Research
Exhibit: Segmental Revenue
4,8
35
6,2
13
7,4
66
8,8
15
9,3
67
10,6
20
12,0
52
5,5
07
7,1
64
8,2
55
8,6
43
9,2
12
10,0
54
10,9
73
404
1,239
1,8761,109
1,2131,395
1,604
0
3000
6000
9000
12000
15000
18000
21000
24000
27000
FY11 FY12 FY13 FY14 FY15 FY16E FY17E
Fig
s. in
Rs M
illio
n
Building Products Packaging Products Home Décor - EVOK Brand

HSIL Ltd.
SKP Securities Ltd www.skpmoneywise.com Page 14 of 18
Key Concerns
Competition from unorganised players:
Indian sanitaryware industry has significant presence of small unorganized players,
although mostly in non-premium products. Though, Indian consumers are gravitating
towards the organized segment, offering branded/premium products, any increase in
intensity of competition from unorganized segment may be detrimental for the
company. Indian container glass industry has a sizeable unorganized segment representing large
opportunities in terms of volume, which acts as a potential threat for the major
organised players. More so as packaging regulations are not very stringent in India.
There is always a real threat of consuming industries gravitating towards unorganised
segment to bring down their costs, which can reduce pricing power of organised
players, at least in some product segments.
Threat from substitutes packaging: Over the last few years, container glass industry
has been facing competition from segments like PET bottles, metal cans, Tetra Packs etc.
owing to factors like weight, fragility, cost etc. However, the threat is limited for HSIL due to
several advantages of glass over plastic. Glass is 100% recyclable with an excellent shelf
life. Besides, the growing awareness on account of hygienic packaging demand will drive
the demand for container glass over plastic alternatives. In any case, HSIL is already
present in PET bottles.
Extended slowdown in real estate sector may dampen business sentiments: HSIL’s
building product segment is highly dependent on real estate sector, any extension of
slowdown to Tier – I and Tier – II cities may dampen the business prospects of HSIL.
Valuations
Governments Initiative of “Housing for All” and “Swachh Bharat Abhiyan” is likely to give a
fillip to demand for low end sanitaryware products, thereby allowing organised players to
have a larger pie of the premium products segment. As HSIL accelerates up the chain
through premiumisation (premium and luxury segment accounting for ~57% of
sanitaryware business in FY14) coupled with strong brand equity & distribution network,
changing consumer preferences along with a gradual turnaround in demand of container
glass augurs well for HSIL.
We have valued the stock on SOTP basis and recommend a Buy on the stock with a
target price of Rs 351/- in 12 months (23.2% upside).
Segment EBITDA EV/EBITDA
Bui lding Products Segment 2567.8 9 x 23,110.2
Packaging Products Segment 1689.8 5 x 8,449.0
Target Enterprise Value 31,559.2
Less : FY17E Debt 6,454.1
Add: FY17E Cash 296.0
Target Market Cap 25,401.2
No of Shares 72.3
Target Price Per Share (Rs) 351
CMP (Rs) 285
Return (%) 23.2%
Source: SKP Research
Exhibit: SOTP Figs. in Rs Million
Multiple (x)

HSIL Ltd.
SKP Securities Ltd www.skpmoneywise.com Page 15 of 18
Q1FY16 Result Update
Particulars Q1 FY16 Q1 FY16 % Change Q4 FY15 % Change FY15 FY14 % Change
Net Sales 4,128.5 4,121.5 0.2% 5,589.1 -26.1% 19,806.2 18,582.0 6.6%
Total Expenditure 3,488.7 3,457.3 0.9% 4530.3 -23.0% 16,481.0 16,048.9 2.7%
Raw Material Consumed 969.0 754.6 28.4% 1409.0 -31.2% 3,341.2 2,941.2 13.6%
% to Sales 23.5% 18.3% -- 25.2% -- 16.9% 15.8% --
Purchase of traded goods 499.7 764.1 -34.6% 863.0 -42.1% 3,973.9 3,534.0 12.4%
% to Sales 12.1% 18.5% -- 15.4% -- 20.1% 19.0% --
Employee Expenses 515.1 429.4 20.0% 541.7 -4.9% 2,159.5 1,884.4 14.6%
% to Sales 12.5% 10.4% -- 9.7% -- 10.9% 10.1% --
Fuel Cost 577.6 684.6 -15.6% 631.5 -8.5% 2,801.2 3,770.2 -25.7%
% to Sales 14.0% 16.6% -- 11.3% -- 14.1% 20.3% --
Marketing & Advertisement 0.0 0.0 -- 0.0 -- 0.0 0.0 --
% to Sales 0.0% 0.0% -- 0.0% -- 0.0% 0.0% --
Other Expenses 927.3 824.6 12.5% 1085.1 -14.5% 4,205.2 3,919.1 7.3%
% to Sales 22.5% 20.0% -- 19.4% -- 21.2% 21.1% --
EBIDTA 639.8 664.2 -3.7% 1058.8 -39.6% 3,325.2 2,533.1 31.3%
EBIDTA Margin 15.5% 16.1% -- 18.9% -- 16.8% 13.6% --
Depreciation 282.2 275.5 2.4% 309.1 -8.7% 1,250.3 1,101.2 13.5%
EBIT 357.6 388.7 -8.0% 749.7 -52.3% 2,074.9 1,431.9 44.9%
EBIT Margin 8.7% 9.4% -- 13.4% -- 10.5% 7.7% --
Other Income 12.7 6.0 111.7% 5.2 144.2% 35.7 38.1 -6.3%
Interest 104.2 171.0 -39.1% 179.2 -41.9% 775.2 717.8 8.0%
Exceptional Items 0.0 0.0 -- 0.0 -- 0.0 0.0 --
Forex Difference 0.0 0.0 -- 0.0 -- 0.0 0.0 --
Tax 92.6 73.8 25.5% 177.2 -47.7% 481.0 412.4 16.6%
Extraordinary Items 0.0 0.0 -- 0.0 -- 0.0 0.0 --
Prior period taxes written bk. 0.0 0.0 -- 0.0 -- 0.0 0.0 --
Minority Interest 0.0 0.0 -- 0.0 -- 0.0 0.0 --
Share of Associate Company 0.0 0.0 -- 0.0 -- 0.0 0.0 --
Reported Profit After Tax 173.5 149.9 15.7% 398.5 -56.5% 854.4 339.8 151.4%
PAT Margin 4.2% 3.6% -- 7.1% -41.1% 4.3% 1.8% --
Diluted EPS (Rs) 2.4 2.3 5.7% 2.0 23.1% 12.9 5.1 150.6%
Figs in Rs. million
Source: Company, SKP Research

HSIL Ltd.
SKP Securities Ltd www.skpmoneywise.com Page 16 of 18
Exhibit: Balance Sheet
Particulars FY14 FY15 FY16E FY17E Particulars FY14 FY15 FY16E FY17E
Total Income 18,582.1 19,806.2 22,084.3 24,646.3 Share Capital 132.1 144.6 144.6 144.6
Growth (%) 5.5% 6.6% 11.5% 11.6% Reserve & Surplus 10,150.9 13,086.3 13,989.9 15,230.5
Expenditure 16,049.0 16,481.0 18,374.2 20,357.8 Shareholders Funds 10,283.0 13,230.9 14,134.5 15,375.1
Material Cost 2,941.2 3,341.2 5,079.4 5,520.8 Total Debt 9,490.5 5,761.6 5,839.2 6,454.1
Pur of Traded Goods 3,534.0 3,973.9 3,136.0 3,499.8 Deferred Tax (Net) 1,154.0 1,045.0 1,045.0 1,045.0
Employee Cost 1,884.4 2,159.5 2,374.1 2,649.5 Other Long Term Liab 154.4 179.9 200.6 223.9
Power & Fuel & Othr Exp. 7,689.3 7,006.4 7,784.7 8,687.8 Total Liabilities 21,081.9 20,217.4 21,219.3 23,098.0
EBITDA Margins (%) 13.6% 16.8% 16.8% 17.4%
EBITDA 2,533.1 3,325.2 3,710.2 4,288.5 Net Block inc. Capital WIP 16,388.2 16,181.9 16,309.9 16,654.1
Depreciation 1,101.2 1,250.3 1,315.4 1,302.4 Investments 108.6 108.6 108.6 108.6
EBIT 1,431.9 2,074.9 2,394.8 2,986.1 Non-Current Asset 19.6 14.7 16.4 18.3
Other Income 38.1 35.7 50.8 56.7 Inventories 4,443.3 4,743.6 5,410.7 5,742.6
Interest Expense 717.8 775.2 671.5 742.2 Sundry Debtors 4,191.7 4,137.8 4,969.0 5,299.0
Profit Before Tax (PBT) 752.3 1,335.4 1,774.1 2,300.5 Cash & Bank Balance 602.9 251.2 221.5 296.0
Income Tax 412.5 481.0 638.7 828.2 Other Current Assets 19.4 20.5 22.9 73.9
Effective Tax Rate (%) 54.8% 36.0% 36.0% 36.0% Loans & Advances 967.9 816.3 905.5 1,478.8
Profit After Tax (PAT) 339.8 854.4 1,135.4 1,472.3 Current Liabilities & Prov 5,659.7 6,092.0 6,779.8 6,608.1
Growth (%) -58.6% 151.4% 32.9% 29.7% Net Current Assets 4,565.5 3,877.4 4,749.7 6,282.2
Diluted EPS 5.1 12.9 15.7 20.4 Total Assets 21,081.9 20,217.4 21,219.3 23,098.0
Exhibit: Cash Flow
StatementExhibit: Ratio Analysis
Particulars FY14 FY15E FY16E FY17E Particulars FY14 FY15 FY16E FY17E
Profit Before Tax (PBT) 752.3 1,335.4 1,774.1 2,300.5 Earning Ratios (%)
Depreciation 1,101.2 1,250.3 1,315.4 1,302.4 EBITDA Margin (%) 13.6% 16.8% 16.8% 17.4%
Interest Provided 718.0 775.2 671.5 742.2 PAT Margins (%) 1.8% 4.3% 5.1% 6.0%
Chg. in Working Capital (787.0) 243.3 (883.0) (1,436.6) ROCE (%) 7.2% 10.9% 12.0% 13.7%
Direct Taxes Paid (157.0) (481.0) (638.7) (828.2) ROE (%) 3.3% 6.5% 8.0% 9.6%
Other Charges (3.0) - - - Per Share Data (INR)
Operating Cash Flows 1,624.5 3,123.2 2,239.3 2,080.3 Diluted EPS 5.1 12.9 15.7 20.4
Capital Expenditure (1,924.6) (1,044.0) (1,443.3) (1,646.7) Cash EPS (CEPS) 21.8 29.1 33.9 38.4
Investments (1,072.8) (0.0) - - BVPS 155.7 183.0 195.5 212.7
Others 1,111.6 - - - Valuation Ratios (x)
Investing Cash Flows (1,885.8) (1,044.0) (1,443.3) (1,646.7) P/E 55.4 22.1 18.2 14.0
Changes in Equity - 2,500.0 - - Price/BVPS 1.8 1.6 1.5 1.3
Inc / (Dec) in Debt 996.5 (3,728.9) 77.6 614.9 EV/Sales 1.5 1.3 1.2 1.1
Dividend Paid (inc tax) (231.0) (231.8) (231.8) (231.8) EV/EBITDA 10.9 7.9 7.1 6.2
Interest Paid (720.9) (775.2) (671.5) (742.2) EB/EBIT 19.4 12.6 11.0 9.0
Financing Cash Flows 44.6 (2,377.1) (825.7) (359.1) Balance Sheet Ratios
Chg. in Cash & Cash Eqv (216.8) (297.8) (29.7) 74.5 Debt - Equity 0.9 0.4 0.4 0.4
Opening Cash Balance 765.7 549.0 251.2 221.5 Current Ratio 1.8 1.6 1.7 2.0
Closing Cash Balance 549.0 251.2 221.5 296.0 Fixed Asset Turn. Ratios 1.2 1.2 1.4 1.7
Figures in INR Million
Source: Company Data, SKP Research
Exhibit: Income Statement Figures in INR Million Figures in INR Million

HSIL Ltd.
SKP Securities Ltd www.skpmoneywise.com Page 17 of 18
Notes:
The above analysis and data are based on last available prices and not official closing rates. SKP Research is also available on Bloomberg,
Thomson First Call & Investext Myiris, Moneycontrol, Tickerplant and ISI Securities.
DISCLAIMER:
This document has been prepared by SKP Securities Ltd, hereinafter referred to as SKP to provide information about the company(ies)/sector(s), if any, covered in the report and may be distributed by it and/or its affiliates. SKP Securities Ltd., offers broking and depository participant services and is regulated by Securities and Exchange Board of India (SEBI). It also distributes investment products/services like mutual funds, alternative investment funds, bonds, IPOs, etc., renders corporate advisory services and invests its own funds in securities and investment products. We declare that no material disciplinary action has been taken against SKP by any regulatory authority impacting Equity Research Analysis. As a value addition to its clients, it offers its research services and reports in various formats to its clients and prospects. As such, SKP is making these disclosures under SEBI (Research Analysts) Regulations, 2014, under which it is in the process of seeking registration.
Terms & Conditions and Other Disclosures:
This research report (“Report”) is for the personal information of the selected recipient(s), does not construe to be any investment, legal or taxation advice, is not for public distribution and should not be copied, reproduced or redistributed to any other person or in any form without SKP’s prior permission. The information provided in the Report is from publicly available data, which we believe, are reliable. While reasonable endeavors have been made to present reliable data in the Report so far as it relates to current and historical information, but SKP does not guarantee the accuracy or completeness of the data in the Report. Accordingly, SKP or its promoters, directors, subsidiaries, associates or employees shall not be in any way responsible for any loss or damage that may arise to any person from any inadvertent error in the information contained and views and opinions expressed in this publication. Past performance mentioned in the Report should not be taken as an indication or guarantee of future performance, and no representation or warranty, express or implied, is made regarding future performance. Information, opinions and estimates contained in this report reflect a judgment of its original date of publication by SKP and are subject to change without notice. The price, value of and income from any of the securities mentioned in this report can rise or fall. The Report includes analysis and views of individual research analysts (which, hereinafter, includes persons reporting to them) covering this Report. The Report is purely for information purposes. Opinions expressed in the Report are SKP’s or its research analysts’ current opinions as of the date of the Report and may be subject to change from time to time without notice. SKP or any person connected with it does not accept any liability arising from the use of this document. Investors should not solely rely on the information contained in this Report and must make investment decisions based on their own investment objectives, judgment, risk profile and financial position. The recipients of this Report may take professional advice before acting on this information. SKP, along with its affiliates, are engaged in various financial services and so might have financial, businesses or other interest in other entities, including the subject company or its affiliates mentioned in this report, for which it might have received any compensation in the past twelve months. SKP does not provide any merchant banking or market making service and does not manage public offers. However, SKP encourages independence in preparation of research reports and strives to minimize conflict in preparation of research reports.SKP and its analysts did not receive any compensation or other benefits from the subject company mentioned in the Report or from a third party in connection with preparation of the Report. Accordingly, SKP and its Research Analyst do not have any material conflict of interest at the time of publication of this Report. SKP’s research analysts may provide input into its other business activities. Investors should assume that SKP and/or its affiliates are seeking or will seek business assignments from the company(ies) that are the subject of this material and that the research analysts who are involved in preparing this material may educate investors on investments in such businesses. The research analysts responsible for the preparation of this document may interact with trading desk/sales personnel and other parties for the purpose of gathering, applying and interpreting information. Our research analysts are paid on the profitability of SKP, which may include earnings from business activities for which this Report is being used, but not for the preparation of this report. SKP generally prohibits its analysts, persons reporting to analysts and their relatives from maintaining a financial interest in the securities or derivatives of any company(ies) that the analyst covers. Additionally, SKP generally, prohibits its analysts and persons reporting to analysts from serving as an officer, director or advisory board member of any companies that the analyst cover. The following Disclosure of Interest Statement, clarifies it further: SKP or its Research Analyst(s) engaged in preparation of this Report or his/her relative (i) do not have any financial interests in the subject company mentioned in this report (ii) do not own 1% or
more of the equity securities of the subject company mentioned in the report as of the last day of the month preceding the publication of the research report (iii) do not have any other material conflict of interest at the time of publication of the research report. The distribution of this document in other jurisdictions may be strictly restricted and/ or prohibited by law, and persons into whose possession this document comes should inform themselves about such restriction and/ or prohibition, and observe any such restrictions and/ or prohibition.

HSIL Ltd.
SKP Securities Ltd www.skpmoneywise.com Page 18 of 18
Analyst Certification
The views expressed in this research report accurately reflect the personal views of the analyst about the subject securities or issues, which are subject to change without prior notice and does not represent to be an authority on the subject. No part of the compensation of the research analyst was, is, or will be directly or indirectly related to the specific recommendations and views expressed by research analyst in this report. The research analysts, strategists, or research associates principally responsible for preparation of SKP research receive compensation based upon various factors, including quality of research, investor client feedback, stock picking, competitive factors and firm revenues.
Disclosure of Interest Statement
Analyst ownership of the stock NIL
Served as an officer, director or employee NIL
SKP Securities Ltd
Contacts Research Sales
Mumbai Kolkata Mumbai Kolkata
Phone 022 4922 6006 033 4007 7000 022 4922 6000 033 4007 7400
Fax 022 4922 6066 033 4007 7007 022 4922 6066 033 4007 7007
E-mail [email protected] [email protected] [email protected]
Member: NSE BSE NSDL CDSL NCDEX* MCX* MCX-SX FPSB
*Group Entities INB/INF: 230707532, BSE INB: 010707538, CDSL IN-DP-CDSL-132-2000, DPID: 021800, NSDL IN-DP-NSDL: 222-2001, DP ID: IN302646, ARN: 0006, NCDEX: 00715, MCX: 31705, MCX-SX: INE 260707532
Institutional & Retail Broking Wealth Advisory & Distribution Investment Banking