Embed Size (px)
DESCRIPTION
Part 3 H St. Development Plan
Citation preview
7/18/2019 hstpart4
http://slidepdf.com/reader/full/hstpart4 1/45
theHOK PlanningGroup H S T R E E T N E S T R A T E G I C D E V E L O P M E N T P L A N
District of Columbia Office of Planning
-20.0%
0.0%
20.0%
40.0%
60.0%
80.0%
100.0%
120.0%
140.0%
160.0%
180.0%
1997 1998 1999 2000 2001 2nd Qtr 2002
(YTD)
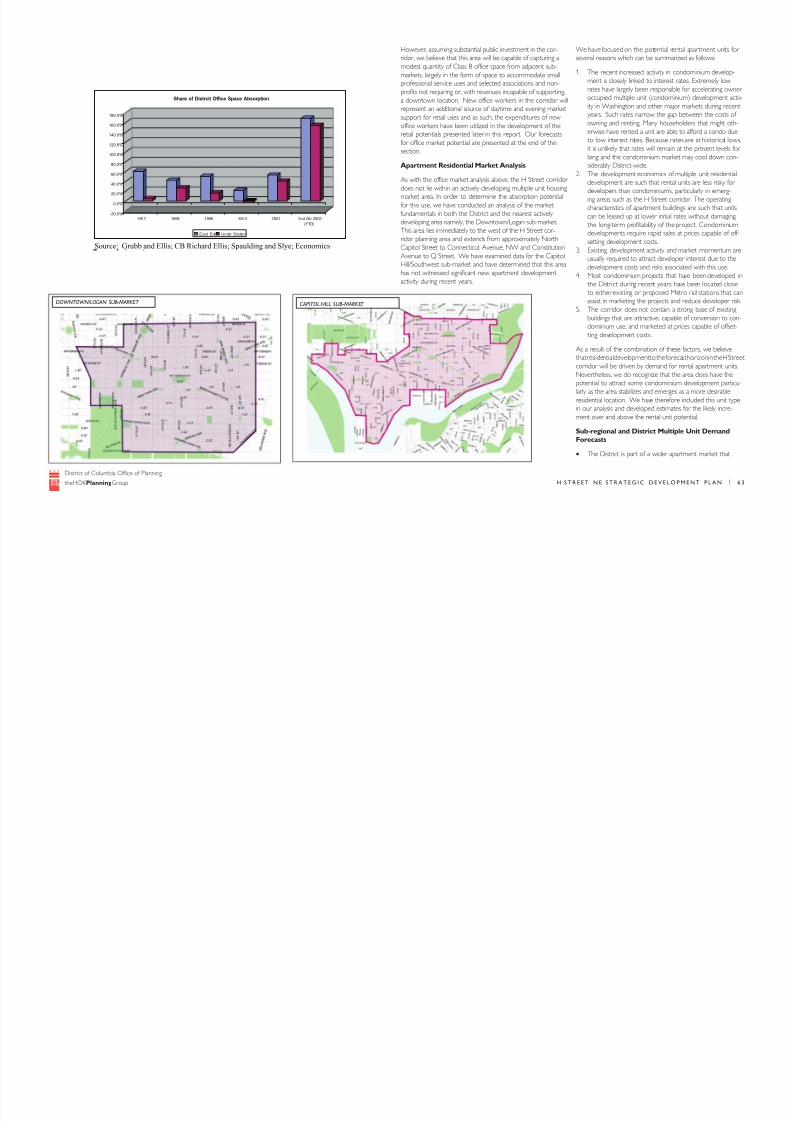
Share of Distrcit Office Space Absorption
East End Union Station
Source: Grubb and Ellis; CB Richard Ellis; Spaulding and Slye; Economics
DOWNTOWN/LOGAN SUB-MARKET CAPITOL HILL SUB-MARKET
However, assuming substantial public investment in the cor-
ridor, we believe that this area will be capable of capturing a
modest quantity of Class B office space from adjacent sub-
markets, largely in the form of space to accommodate small
professional service uses and selected associations and non-
profits not requiring or, with revenues incapable of supporting,
a downtown location. New office workers in the corridor will
represent an additional source of daytime and evening market
support for retail uses and as such, the expenditures of new
office workers have been utilized in the development of the
retail potentials presented later in this report. Our forecasts
for office market potential are presented at the end of this
section.
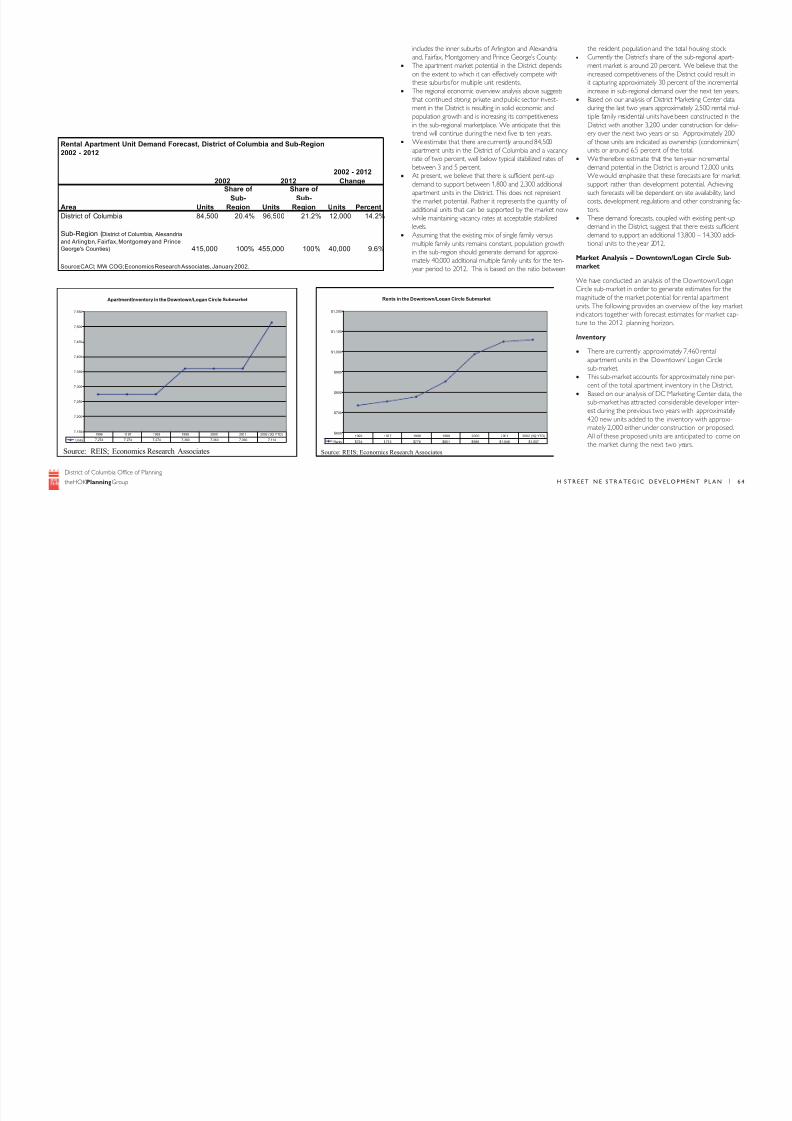
Apartment Residential Market Analysis
As with the office market analysis above, the H Street corridor
does not lie within an actively developing multiple unit housing
market area. In order to determine the absorption potential
for this use, we have conducted an analysis of the market
fundamentals in both the District and the nearest actively
developing area namely, the Downtown/Logan sub-market.
This area lies immediately to the west of the H Street cor-
ridor planning area and extends from approximately North
Capitol Street to Connecticut Avenue, NW and Constitution
Avenue to Q Street. We have examined data for the Capitol
Hill/Southwest sub-market and have determined that this area
has not witnessed significant new apartment developmentactivity during recent years.
We have focused on the potential rental apartment unit
several reasons which can be summarized as follows:
1. The recent increased activity in condominium devel
ment is closely linked to interest rates. Extremely lo
rates have largely been responsible for accelerating
occupied multiple unit (condominium) developmen
ity in Washington and other major markets during r
years. Such rates narrow the gap between the cost
owning and renting. Many householders that might
erwise have rented a unit are able to afford a condo
to low interest rates. Because rates are at historicalit is unlikely that rates will remain at the present leve
long and the condominium market may cool down
siderably District-wide.
2. The development economics of multiple unit reside
development are such that rental units are less risky
developers than condominiums, particularly in emer
ing areas such as the H Street corridor. The operati
characteristics of apartment buildings are such that u
can be leased up at lower initial rates without dama
the long-term profitability of the project. Condomi
developments require rapid sales at prices capable o
setting development costs.
3. Existing development activity and market momentu
usually required to attract developer interest due to
development costs and risks associated with this use
4. Most condominium projects that have been develo the District during recent years have been located c
to either existing or proposed Metro rail stations th
assist in marketing the projects and reduce develope
5. The corridor does not contain a strong base of exis
buildings that are attractive, capable of conversion to
dominium use, and marketed at prices capable of of
ting development costs.
As a result of the combination of these factors, we belie
that residential development to the forecast horizon in the H
corridor will be driven by demand for rental apartment
Nevertheless, we do recognize that the area does have t
potential to attract some condominium development pa
larly as the area stabilizes and emerges as a more desirab
residential location. We have therefore included this unit
in our analysis and developed estimates for the likely inc
ment over and above the rental unit potential.
Sub-regional and District Multiple Unit Deman
Forecasts
• The District is part of a wider apartment market th
7/18/2019 hstpart4
http://slidepdf.com/reader/full/hstpart4 2/45
theHOK PlanningGroup H S T R E E T N E S T R A T E G I C D E V E L O P M E N T P L A N
District of Columbia Office of Planning
includes the inner suburbs of Arlington and Alexandria
and, Fairfax, Montgomery and Prince George’s County.
• The apartment market potential in the District depends
on the extent to which it can effectively compete with
these suburbs for multiple unit residents.
• The regional economic overview analysis above suggests
that continued strong private and public sector invest-
ment in the District is resulting in solid economic and
population growth and is increasing its competitiveness
in the sub-regional marketplace. We anticipate that this
trend will continue during the next five to ten years.
• We estimate that there are currently around 84,500
apartment units in the District of Columbia and a vacancy
rate of two percent, well below typical stabilized rates of
between 3 and 5 percent.
• At present, we believe that there is sufficient pent-up
demand to support between 1,800 and 2,300 additional
apartment units in the District. This does not represent
the market potential. Rather it represents the quantity of
additional units that can be supported by the market now
while maintaining vacancy rates at acceptable stabilized
levels.
• Assuming that the existing mix of single family versus
multiple family units remains constant, population growth
in the sub-region should generate demand for approxi-
mately 40,000 additional multiple family units for the ten-
year period to 2012. This is based on the ratio between
the resident population and the total housing stock.• Currently the District’s share of the sub-regional ap
ment market is around 20 percent. We believe that
increased competitiveness of the District could resu
it capturing approximately 30 percent of the increm
increase in sub-regional demand over the next ten y
• Based on our analysis of District Marketing Center d
during the last two years approximately 2,500 renta
tiple family residential units have been constructed
District with another 3,200 under construction for d
ery over the next two years or so. Approximately 2
of those units are indicated as ownership (condomin
units or around 6.5 percent of the total.
• We therefore estimate that the ten-year incrementa
demand potential in the District is around 12,000 un
We would emphasize that these forecasts are for m
support rather than development potential. Achiev
such forecasts will be dependent on site availability, l
costs, development regulations and other constrainin
tors.
• These demand forecasts, coupled with existing pent
demand in the District, suggest that there exists suff
demand to support an additional 13,800 – 14,300 a
tional units to the year 2012.
Market Analysis – Downtown/Logan Circle Su
market
We have conducted an analysis of the Downtown/Log
Circle sub-market in order to generate estimates for t
magnitude of the market potential for rental apartmen
units. The following provides an overview of the key m
indicators together with forecast estimates for market
ture to the 2012 planning horizon.
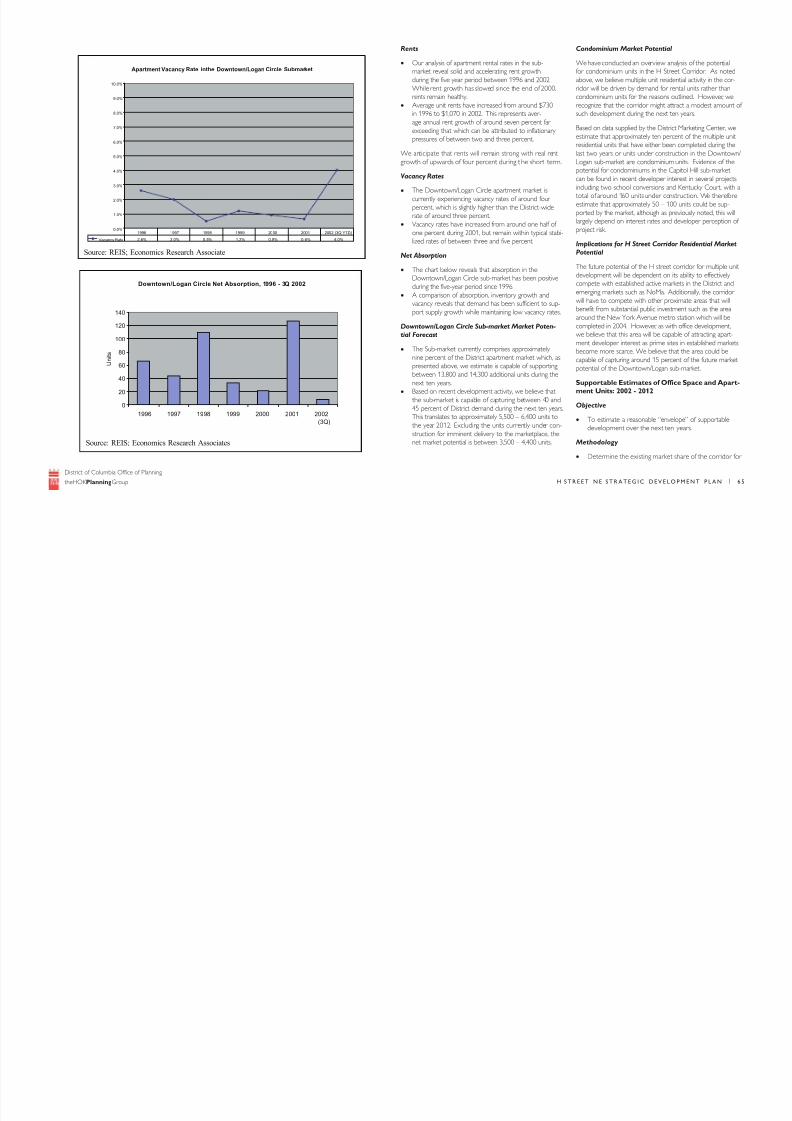
Inventory
• There are currently approximately 7,460 rental
apartment units in the Downtown/ Logan Circle
sub-market.
• This sub-market accounts for approximately nine p
cent of the total apartment inventory in t he Distr
• Based on our analysis of DC Marketing Center dat
sub-market has attracted considerable developer
est during the previous two years with approxima420 new units added to the inventory with approx
mately 2,000 either under construction or propos
All of these proposed units are anticipated to com
the market during the next two years.
Rental Apartment Unit Demand Forecast, District of Columbia and Sub-Region
2002 - 2012
Area Units
Share of
Sub-
Region Units
Share of
Sub-
Region Units Percent
District of Columbia 84,500 20.4% 96,500 21.2% 12,000 14.2%
Sub-Region (District of Columbia, Alexandria
and Arlington, Fairfax, Montgomery and Prince
George's Counties) 415,000 100% 455,000 100% 40,000 9.6%
Source:CACI; MW COG;Economics Research Associates, January 2002.
2002 2012
2002 - 2012
Change
ApartmentInventory in the Downtown/Logan Circle Submarket
7,150
7,200
7,250
7,300
7,350
7,400
7,450
7,500
7,550
Units 7,274 7,274 7,274 7,360 7,360 7,360 7,514
1996 1997 1998 1999 2000 2001 2002 (3Q YTD)
Source: REIS; Economics Research Associates
Rents in the Downtown/Logan Circle Submarket
$600
$700
$800
$900
$1,000
$1,100
$1,200
Rents $734 $753 $776 $851 $986 $1,048 $1,057
1996 1997 1998 1999 2000 2001 2002 (3Q YTD)
Source: REIS; Economics Research Associates
7/18/2019 hstpart4
http://slidepdf.com/reader/full/hstpart4 3/45
theHOK PlanningGroup H S T R E E T N E S T R A T E G I C D E V E L O P M E N T P L A N
District of Columbia Office of Planning
Rents
• Our analysis of apartment rental rates in the sub-
market reveal solid and accelerating rent growth
during the five year period between 1996 and 2002.
While rent growth has slowed since the end of 2000,
rents remain healthy.
• Average unit rents have increased from around $730
in 1996 to $1,070 in 2002. This represents aver-
age annual rent growth of around seven percent far
exceeding that which can be attributed to inflationary
pressures of between two and three percent.
We anticipate that rents will remain strong with real rent
growth of upwards of four percent during t he short term.
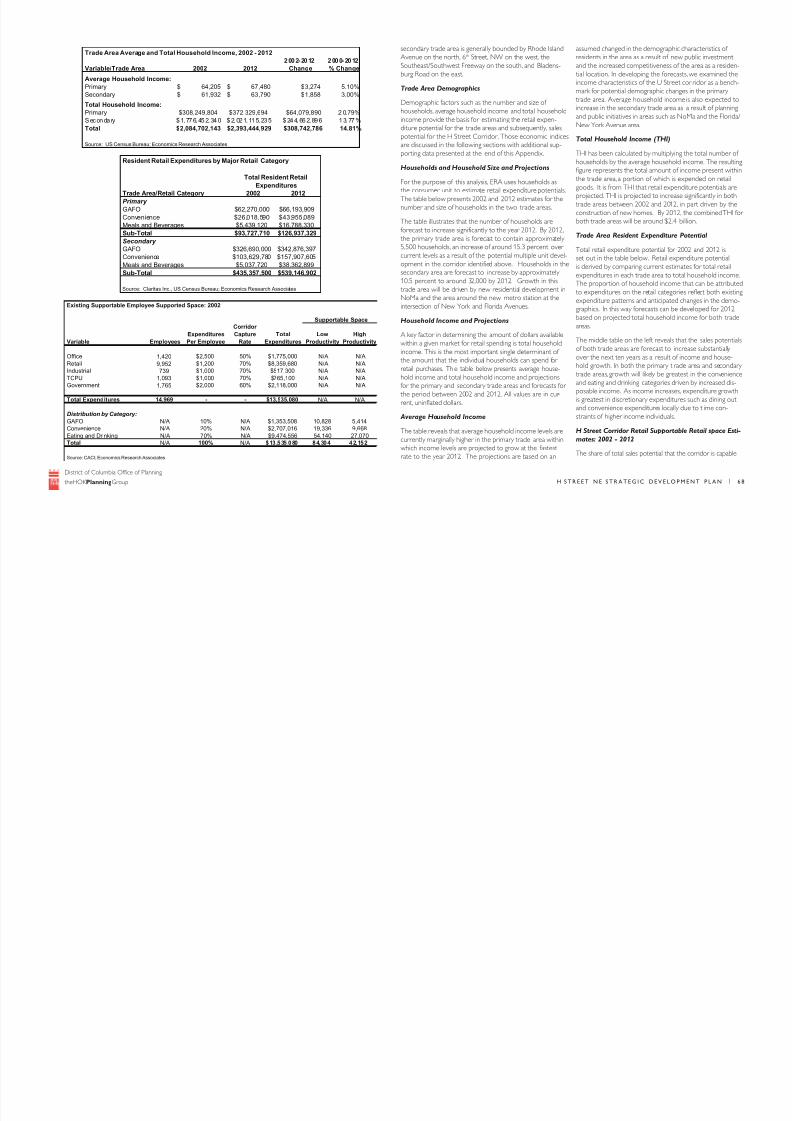
Vacancy Rates
• The Downtown/Logan Circle apartment market is
currently experiencing vacancy rates of around four
percent, which is slightly higher than the District-wide
rate of around three percent.
• Vacancy rates have increased from around one half of
one percent during 2001, but remain within typical stabi-
lized rates of between three and five percent.
Net Absorption
• The chart below reveals that absorption in the
Downtown/Logan Circle sub-market has been positiveduring the five-year period since 1996.
• A comparison of absorption, inventory growth and
vacancy reveals that demand has been sufficient to sup-
port supply growth while maintaining low vacancy rates.
Downtown/Logan Circle Sub-market Market Poten-
tial Forecast
• The Sub-market currently comprises approximately
nine percent of the District apartment market which, as
presented above, we estimate is capable of supporting
between 13,800 and 14,300 additional units during the
next ten years.
• Based on recent development activity, we believe that
the sub-market is capable of capturing between 40 and
45 percent of District demand during the next ten years.
This translates to approximately 5,500 – 6,400 units to
the year 2012. Excluding the units currently under con-
struction for imminent delivery to the marketplace, the
net market potential is between 3,500 – 4,400 units.
Condominium Market Potential
We have conducted an overview analysis of the potenti
for condominium units in the H Street Corridor. As no
above, we believe multiple unit residential activity in the c
ridor will be driven by demand for rental units rather tha
condominium units for the reasons outlined. However, w
recognize that the corridor might attract a modest amo
such development during the next ten years.
Based on data supplied by the District Marketing Center
estimate that approximately ten percent of the multiple residential units that have either been completed during
last two years or units under construction in the Downt
Logan sub-market are condominium units. Evidence of
potential for condominiums in the Capitol Hill sub-mark
can be found in recent developer interest in several proj
including two school conversions and Kentucky Court, w
total of around 160 units under construction. We there
estimate that approximately 50 – 100 units could be sup
ported by the market, although as previously noted, this
largely depend on interest rates and developer perceptio
project risk.
Implications for H Street Corridor Residential Mar
Potential
The future potential of the H street corridor for multiple
development will be dependent on its ability to effectivecompete with established active markets in the District a
emerging markets such as NoMa. Additionally, the corri
will have to compete with other proximate areas that w
benefit from substantial public investment such as the ar
around the New York Avenue metro station which will b
completed in 2004. However, as with office developmen
we believe that this area will be capable of attracting apa
ment developer interest as prime sites in established ma
become more scarce. We believe that the area could b
capable of capturing around 15 percent of the future ma
potential of the Downtown/Logan sub-market.
Supportable Estimates of Office Space and Ap
ment Units: 2002 - 2012
Objective
• To estimate a reasonable “envelope” of supportab
development over the next ten years.
Methodology
• Determine the existing market share of the corrid
Apartment Vacancy Rate inthe Downtown/Logan Circle Submarket
0.0%
1.0%
2.0%
3.0%
4.0%
5.0%
6.0%
7.0%
8.0%
9.0%
10.0%
Vacancy Rate 2.6% 2.0% 0.5% 1.2% 0.9% 0.6% 4.0%
1996 1997 1998 1999 2000 2001 2002 (3Q YTD)
Source: REIS; Economics Research Associate
Downtown/Logan Circle Net Absorption, 1996 - 3Q 2002
0
20
40
60
80
100
120
140
1996 1997 1998 1999 2000 2001 2002(3Q)
U n i t s
Source: REIS; Economics Research Associates

7/18/2019 hstpart4
http://slidepdf.com/reader/full/hstpart4 4/45
theHOK PlanningGroup H S T R E E T N E S T R A T E G I C D E V E L O P M E N T P L A N
District of Columbia Office of Planning
Office
Rental
Apartment
District market demand (2002-2012) 11,600,000 14,000
Estimated Class B Office Market Share:
East End 60% N/A
Union Station 10% N/A
Estimated M ulti -Family M arket Share:
Downtown/Logan N/A 45%
Estimated Adjacent Market Potential
East End 6,960,000 N/A
Union Station1,160,000 N/ADowntown/Logan N/A 6,300
Less Available Commited Space/Units 1,400,000 2,000
Net Sub-Market Market Potential 6,720,000 4,300
Corridor Capture of Adjacent Submarket Potential 2.5% 15%
Corridor Demand Potential (2002-2012) 168,000 645
Ave. FAR 2.0 3.0
Land required (Acres) 1.9 4.9
New Employees/Residents 670 970
Source: MWCOG; REIS; Grubb and Ellis; Economics Research Associates
Land Use Plann ing Target s, H Str eet Corrid or, 2002 - 2012
the various uses in the District
• Develop reasonable expectations for regional demand
over the next 10 years
• Determine the District share of regional demand
growth potential
• Assess the competitiveness of the corridor today and
the quantity of recent development activity that adja-
cent sub-markets are capturing
• Forecast the competitiveness of the corridor in the
future
• Estimate the quantity of support able development by
land use
The table provided herein presents a summary of the find-
ings of the market analysis and estimates of net new sup-
portable space and units in the corridor over the next ten
years or so. The preliminary planning targets are intended
to help illustrate the redevelopment potential. In prepar-
ing land use and development plans for the corridor, it is
important that aggregate totals of development for each
land use do not substantially exceed that which is capable
of being supported by the market. The planning targets are
therefore intended to act as a reasonable envelope of sup-
portable development.
Retail Market Analysis
Introduction and Methodology
ERA has examined the market supportable retail potential
for the H Street Corridor. We have developed estimates for
retail space potentials by major retail category under three
scenarios:
Existing Conditions and Productivity Rates (2002).
The purpose of this scenario is to illustrate the quantity
of space that is capable of being suppor ted by the market
under existing conditions and what are reported to be typi-
cal rent levels for retail space in the H Street Corridor. This
scenario assumes the existing mix of retail uses, resident
and worker expenditure potentials and productivity rates
which have been adjusted to reflect existing market condi-
tions in the corridor. ERA notes that the lower-than-market
rental rate averages (which range from approximately $8
to $12 per square foot) do not represent the level of sales
or rental revenue that would warrant significant investmentin H Street’s retail commercial structures. In other words,
many of the current retail tenants can be considered to be
under-performing according to industry standards.
Another way to express our evaluation of current condi-
tions is that (like many older commercial districts), H
Street has a segment of retailers that would be consid
marginal operations in more competitive environment
The total square footage of ‘supportable space’ under
this scenario is therefore an illustrative amount, since t
project’s goal is to upgrade both the amount and qual
H Street’s retail offerings.
Existing Conditions and Investment Productiv
Rates (2002). This scenario is intended to illustrate t
impact of increasing the productivity rates on t he quan
of space capable of being supported by the market. S the increases in the expenditure base identified below
occur gradually over a period of ten years, this scenari
represents the baseline estimate for the strategic repo
tioning of the corridor. It also assumes existing retail m
and resident and worker expenditure base. However,
while the quantity of supportable space will be lower t
in the above scenario, the higher productivity rates wil
produce higher sales volume and hence achievable ren
Such rents could support private sector investment in
retail commercial structures in the corridor at compet
locations. Surplus marginal space could be identified fo
land use succession. However, in order to determine t
quantity of supportable space as an input to the ten ye
planning strategy for the corridor, we must examine th
future growth potential of the expenditure base.
Future Conditions and Investment Productivi
Rates (2012). This represents the forecast of suppo
able retail space based on increases in the expenditure
potential and achievable capture rates. The expenditu
base increases as a result of new residents and worker
and adjacent to the t rade area and, changes in the dem
graphic composition and income levels of the trade ar
residents. These estimates of supportable space refle
changes in the competitive image of the corridor, mix
retail offerings and increased market penetration.
ERA’s intent in this analysis was to define a reasonable
mate of supportable space for a retail program compr
of the following major retail categories:
• General Merchandise, Apparel and Accessories,
Furniture/Home Furnishings and Other (GAFO) – General Merchandise includes merchandise typica
associated with department stores and specialty re
ers. Apparel and Accessories includes women’s, men
and children’s apparel, jewelry and footwear. Furni
and Home Furnishings includes textiles, furniture, f

7/18/2019 hstpart4
http://slidepdf.com/reader/full/hstpart4 5/45
theHOK PlanningGroup H S T R E E T N E S T R A T E G I C D E V E L O P M E N T P L A N
District of Columbia Office of Planning
TRADE AREA CENSUS TRACTS
H Street Corridor Study: Retail Market Analysis
2002-2012 2000-2012
Trade Area 2002 2012 Change % Change
Primary 4,801 5,518 717 14.93%
Secondary 28,684 31,684 3,000 10.46%
Source: CACI; Economics Research Associates, October 2002.
Trade Area Households, 2002 - 2012
coverings, major appliances, housewares, miscellaneous
household equipment and consumer electronics. The
Other (Miscellaneous Retail) category includes all other
retail merchandise not categorized as above (e.g. televi-
sion and sound equipment, pets/pet supplies, toys and
playground equipment, other entertainment supplies
and books).
• Convenience – includes items typically sold at a
supermarket including cold prepared and unprepared
food products primarily for consumption at home, per-
sonal care products, non-prescription dr ugs, alcoholic
beverages for consumption at home and newspapers/
magazines.
• Eating and Drinking – includes both table-service res-
taurants as well as fast food operations purchased away
from the home and retail liquor sales.
The retail market potential of the planning area is estab-
lished by examining the expenditure potential generated
from two major sources: expenditures of residents in the
primary and secondary trade areas and customers that have
been calculated as an “inflow” factor. The estimated market
share is based upon the evaluation of several economic fac-
tors: the strength and mix of retailing within the trade area,
the proximity of other retailing centers to the trade areas,
and the economic characteristics of the residents of the
area.
Trade Area Delineation
The primary and secondary trade areas for the subject site
represents the geographical area from which the majority
of customer sales are generated on a sustained basis. The
trade areas have been delineated based on a variety of
economic and market factors, including base census geog-
raphies, access and driving times, competitive locationa
terns and population distribution and density characte
These trade area definitions consider the Corridor’s lo
tional characteristics, including access and visibility; mar
competition facing existing retailers along the H Street
ridor; and the existing mix and quality of retail offering
the corridor. ERA has defined the primary trade area
the area comprised of the six census tracts that borde
Street, NE. Subject tr acts are shown in Figure 1 and g
ally defined below.
− Tract 83.1 is bounded by H Street, NE on the nor
side, 2nd Street, NE on the west, Massachusetts Ave
NE on the south, and 6 th Street, NE on the east.
− Tract 83.2 is bounded by H Street, NE on the nor
side, 6 th Street, NE on the west, Massachusetts Ave
NE on the south, and 8 th Street, NE on the east.
− Tract 84.2 is bounded by H Street, NE on the nor
side, 8 th Street, NE on the west, and Maryland Ave
NE on the south.
− Tract 84.1 is bounded by Florida and West Virginia
nues, NE on the north side, 8 th Street, NE on the w
and H Street, NE on the south.
− Tract 85 is bounded by Florida Avenue, NE on the
north side, 2nd Street, NE on the west, H Street, N
the south, and 8 th Street, NE on the east.
− Tract 86 is bounded by Florida Avenue, NE on the
north side, North Capitol Street, NE on the west,
sachusetts Avenue, NE on the south, and 2nd Stree
on the east.
The secondary trade area is the area comprised of the
25 additional census tracts within approximately 1.5 m
of the H Street, NE corri dor. Also shown in Figure 1, t
7/18/2019 hstpart4
http://slidepdf.com/reader/full/hstpart4 6/45
theHOK PlanningGroup H S T R E E T N E S T R A T E G I C D E V E L O P M E N T P L A N
District of Columbia Office of Planning
Trade Area Average and Total Household Income, 2002 - 2012
2002-2012 2000-2012
Variable/Trade Area 2002 2012 Change % Change
Average Household Income:
Primary 64,205$ 67,480$ $3,274 5.10%
Secondary 61,932$ 63,790$ $1,858 3.00%
Total Household Income:
Primary $308,249,804 $372,329,694 $64,079,890 2 0.79%
Seconda ry $1,776,452,340 $2,021,115,235 $244,662,896 13.77%
Total $2,084,702,143 $2,393,444,929 $308,742,786 14.81%
Source: US Census Bureau; Economics Research Associates
Resident Retail Expenditures by Major Retail Category
Trade Area/Retail Category 2002 2012Primary
GAFO $62,270,000 $66,193,909Convenience $26,018,590 $43,955,089Meals and Beverages $5,439,120 $16,788,330Sub-Total $93,727,710 $126,937,329Secondary
GAFO $326,690,000 $342,876,397Convenience $103,629,780 $157,907,605Meals and Beverages $5,037,720 $38,362,899Sub-Total $435,357,500 $539,146,902
Source: Claritas Inc., US Census Bureau; Economics Research Associates
Total Resident Retail
Expenditures
Existing Supportable Employee Supported Space: 2002
Variable Employees
Expenditures
Per Employee
Corridor
Capture
Rate
Total
Expenditures
Low
Productivity
High
Productivity
Office 1,420 $2,500 50% $1,775,000 N/A N/ARetail 9,952 $1,200 70% $8,359,680 N/A N/AIndustrial 739 $1,000 70% $517,300 N/A N/ATCPU 1,093 $1,000 70% $765,100 N/A N/AGovernment 1,765 $2,000 60% $2,118,000 N/A N/A
Total Expenditures 14,969 - - $13,535,080 N/A N/A
Distribution by Category:GAFO N/A 10% N/A $1,353,508 10,828 5,414Convenience N/A 20% N/A $2,707,016 19,336 9,668Eating and Drinking N/A 70% N/A $9,474,556 54,140 27,070Total N/A 100% N/A $13 ,535 ,080 84,304 42,152
Source: CACI; Economics Research Associates
Supportable Space
secondary trade area is generally bounded by Rhode Island
Avenue on the north, 6 th Street, NW on the west, the
Southeast/Southwest Freeway on the south, and Bladens-
burg Road on the east.
Trade Area Demographics
Demographic factors such as the number and size of
households, average household income and total household
income provide the basis for estimating the retail expen-
diture potential for the trade areas and subsequently, sales
potential for the H Street Corridor. Those economic indicesare discussed in the following sections with additional sup-
porting data presented at the end of this Appendix.
Households and Household Size and Projections
For the purpose of this analysis, ERA uses households as
the consumer unit to estimate retail expenditure potentials.
The table below presents 2002 and 2012 estimates for the
number and size of households in the two trade areas.
The table illustrates that the number of households are
forecast to increase significantly to the year 2012. By 2012,
the primary trade area is forecast to contain approximately
5,500 households, an increase of around 15.3 percent over
current levels as a result of the potential multiple unit devel-
opment in the corridor identified above. Households in the
secondary area are forecast to increase by approximately
10.5 percent to around 32,000 by 2012. Growth in this
trade area will be driven by new residential development in
NoMa and the area around the new metro station at the
intersection of New York and Florida Avenues.
Household Income and Projections
A key factor in determining the amount of dollars available
within a given market for retail spending is total household
income. This is the most important single determinant of
the amount that the individual households can spend for
retail purchases. The table below presents average house-
hold income and total household income and projections
for the primary and secondary trade areas and forecasts for
the period between 2002 and 2012. All values are in cur-
rent, uninflated dollars.
Average Household Income
The table reveals that average household income levels are
currently marginally higher in the primary trade area within
which income levels are projected to grow at the fastest
rate to the year 2012. The projections are based on an
assumed changed in the demographic characteristics o
residents in the area as a result of new public investme
and the increased competitiveness of the area as a res
tial location. In developing the forecasts, we examined
income characteristics of the U Street cor ridor as a be
mark for potential demographic changes in the primar
trade area. Average household income is also expecte
increase in the secondary trade area as a result of plan
and public initiatives in areas such as NoMa and the Flo
New York Avenue area.
Total Household Income (THI)
THI has been calculated by multiplying the total numb
households by the average household income. The res
figure represents the total amount of income present w
the trade area, a portion of which is expended on reta
goods. It is from THI that retail expenditure potentials
projected. THI is projected to increase significantly in b
trade areas between 2002 and 2012, in part driven by
construction of new homes. By 2012, the combined T
both trade areas will be around $2.4 billion.
Trade Area Resident Expenditure Potential
Total retail expenditure potential for 2002 and 2012 is
set out in the table below. Retail expenditure potentia
is derived by comparing current estimates for total ret
expenditures in each trade area to total household incThe proportion of household income that can be attri
to expenditures on the retail categories reflect both ex
expenditure patterns and anticipated changes in the de
graphics. In this way forecasts can be developed for 20
based on projected total household income for both t
areas.
The middle table on the left reveals that the sales pote
of both trade areas are forecast to increase substantia
over the next ten years as a result of income and hous
hold growth. In both the primary t rade area and seco
trade areas, growth will likely be greatest in the conven
and eating and drinking categories driven by increased
posable income. As income increases, expenditure gro
is greatest in discretionary expenditures such as dining
and convenience expenditures locally due to t ime con
straints of higher income individuals.
H Street Corridor Retail Supportable Retail space
mates: 2002 - 2012
The share of total sales potential that the corridor is cap

7/18/2019 hstpart4
http://slidepdf.com/reader/full/hstpart4 7/45
theHOK PlanningGroup H S T R E E T N E S T R A T E G I C D E V E L O P M E N T P L A N
District of Columbia Office of Planning
Summary of Supportable Retail Space: 2002 - 2012(Square Feet)
2012
Retail Category Low Producti vity
High
Productivity
High Productivity
(1)
GAFO (2) 181,000 91,000 160,000
Convenience (3) 108,000 54,000 94,000
Meals and Beverages 64,000 32,000 49,000
Total (4) 353,000 177,000 303,000
(4) Includes space supported by new workers and residents
Source: Claritas Inc.; Economics Research Associates, October 2002.
(3) Convenience includes groceries, personal services, stationery, drugs/sundries, books and magazines,and
tobacco.
2002
(1) Based on 2002 Mid-Atlantic sales per square foot averages from I nternational Council of Shopping
Centers' Monthly Mall Merchandise Index.
(2) General merchandise includes general merchandise stores, apparel stores, and furniture stores.
of capturing is dependent on many factors including: the type,
tenant mix and quality level of the stores, the availability of
parking, and the appeal and effectiveness of competing facili-
ties in the market. The following represents our analysis of
such factors and an assessment of the sales potential of the
corridor. Appendix B contains supporting data utilized in the
analysis.
Competitive Framework
An examination of the competitive retail environment reveals
significant competition within the primary and secondary trade areas and beyond elsewhere in the District, Northern
Virginia and Prince George’s County. Examples include con-
centrations at Union Station, Hechinger Mall, Capital Hill and
the new shopping center on Rhode Island Avenue contain-
ing a Giant Foods supermarket and a Home Depot home
improvement store. The overlapping trade areas of other
proximate retail concentrations will limit the potential retail
capture in both the primary and secondary trade areas. We
believe that market capture rates in the secondary trade area
will be lower than those in the primary trade area due to
both distance from the corridor and the existence of signifi-
cant competing concentrations primarily to the north, east in
Prince George’s County, west in downtown Washington and
potential retail development in NoMa
Resident Sales Capture
Capture rates shown in the primary trade area for the various
goods categories reflects existing nearby competition both
within and adjacent to the trade area as described above. The
lower capture rates in the secondary trade area for all catego-
ries analyzed reflect the distance from the corridor and nearby
established competition. We have applied higher capture
rates to the 2012 scenario based on the assumption that the
area will be more competitive as a retail location at that time
as a result of the increased expenditure base of residents and,
public and private sector investment in the corridor.
Existing Worker Supported Space Estimates
At present, there are approximately 15,000 workers in the
corridor. The expenditures of these workers contribute to
the support for retail uses in the corridor. We estimate that at
present the workers in the primary trade area spend approxi-mately $13.5 million in the corridor annually. This is capable of
supporting approximately 42,100 square feet of retail space.
Of this space, around 27,000 square feet falls in the eating and
drinking category.
Inflow
H Street is a major, heavily trafficked arterial with approx
mate average daily trip estimates of 24,000 cars. As suc
believe retail uses along the corridor are capable of capt
a significant proportion of their total retail sales from cus
ers who reside outside the trade area. Again, we have a
higher inflow rates to the 2012 forecast due to the incre
the resident and worker expenditure base and the impr
competitive image of the corridor as a result of public an
private investment in the corridor during the next ten ye
The impact of higher inflow rates will be an increase in t total expenditure base and therefore supportable space
corridor.
Supportable Space and Composition
Supportable space is a function of total sales potential d
by average sales productivity rates per square foot for e
major retail category. The chart below provides a brea
of the supportable size of all three retail categories and e
ing and future sales productivity and investment scenario
For the existing, low productivity scenario, we have utilize
sales productivity rates of between $125 per square foo
GAFO stores and $175 for eating and drinking establishm
Based on an existing retail inventory of approximately 37
square feet, the results of the analysis indicate that at pre
ent, the retail uses in the corridor are achieving similar saproductivity rates as reflected in the high levels of vacant
marginal space and current achievable rents of between
- $12 per square foot.
As previously noted, we do not believe that such rents w
rant significant private investment in the retail building str
tures along H Street. In other words, the retail business
along H Street are under-performing according to indust
standards. Since improving the quality of the urban fabr
along H Street is a central goal of the planning effort, the
portable square footage indicated in this scenario should
viewed in conjunction with that indicated in the existing,
productivity scenario. This illustrates the gap between ex
space estimates and those capable of achieving rents at
that can support private investment in the corridor.
In the existing, high productivity “investment” scenario, whave assumed industry standard sales volumes of betwe
$250 for GAFO businesses and $350 per square foot fo
eating and drinking establishments. The resultant suppo
able space estimate is approximately half that which curr
exists in the corridor. We therefore believe that in orde

7/18/2019 hstpart4
http://slidepdf.com/reader/full/hstpart4 8/45
theHOK PlanningGroup H S T R E E T N E S T R A T E G I C D E V E L O P M E N T P L A N
District of Columbia Office of Planning
attract private investment in retail uses in the corridor today
and improve the quality of the retail space, substantial public
investment would likely be required together with across-
the-board reductions in the quantity of space. However, such
an approach would be inconsistent with the District’s goals
of retention and enhancement of the retail tax base of the
District and reversing expenditure leakage to the suburbs
based on the continued resurgence of the District economy.
The objective is to increase competitiveness of retail areas in
developing land use strategies that incorporate an appropriate
mix and quantity of retail space. Given the medium to long-
term nature of approaches to urban revitalization, we mustexamine future growth potentials to determine the ultimate
“envelope” of supportable space as an input to a ten year
planning strategy for the area.
The estimated 2012 supportable space forecast also assumes
industry standard productivity rates. The results clearly illus-
trate the impact of public improvements in the corridor,
additional residential and office development and, changes
in the demographic composition of residents in the trade
areas. Household income growth reflective of that which has
occurred along U Street coupled with additional office and
retail workers should be capable of supporting approximately
300,000 – 310,000 square feet of space by 2012. While we
should emphasize that this forecast is an estimate, it represents
a 70 – 75 percent increase of the quantity of space that can
be supported in the corridor while also attracting privateinvestment in the structures.
Implications of Potential Cultural and Entertain-
ment Facilities
ERA also reviewed the impact of entertainment/cultural
facilities on retail potential along the H Street Corridor. At
present, two theater projects are under development or in
early stages of operations. The most ambitious project is
the Atlas Theater, which has been proposed to include two
smaller theaters for live performances; one is to include 150
seats, while the larger theater would include up to 250 seats.
The other is the H Street Theater, which includes 150 seats.
Theaters and other cultural venues do create traffic for retail
corridors, and are particularly supportive of generated busi-
ness for food and beverage establishments (cafes, table service
restaurants, coffee and liquor bars designed to serve the tastesand expenditure potentials of theater patrons), and draw visi-
tors to the area during the evenings when many traditional
retail stores have closed. However, ERA points out that, while
the cultural venues are a critical and very positive addition to
the H Street mix, the impact on supportable retail is more
modest. Issues such as the total number of theater attend-
ees and the popularity of the venue in drawing numbers of
patrons would have a major effect on how much additional
retail demand is created.
For example, if the 550 seats in the two theaters are pro-
grammed to have performances on 100 nights per year and
were 75 percent occupied (a very successful attendance rate
for non-commercial theater), and using a capture rate of 20
percent (the percentage of all food and beverage expendi-
tures available anywhere to theater goers which might be
‘captured’ by restaurants along H Street) the total amount ofretail supported would be less than 500 square feet of space
(assuming an average expenditure of $15 per person). Even
if the number of performance nights, the capture rate, and the
expenditure levels were doubled, the theaters would still only
support about 2,500 square feet of space.
This is not to discount the importance of attracting theater
patrons to H Street in the evenings; the theaters would be
very positive activating uses for the area. But it should be
noted that the economic spin-off for restaurants is not strong
enough to solely generate enough business to carry the
required investment and operating costs for a food and bev-
erage location; they constitute a very good complement to
other markets, but the other markets are critical if the restau-
rants are to be economically feasible.
Implications of Development on Large Sites at BothEnds of the Corridor
Part of the planning and economic viability issues for H Street
concerns the potential and impact of the large sites at the
ends of the corridor – the Hechinger site and the proposed
air rights development at Union Station, Station Place. A
number of stakeholders at the Design Charrette suggested
that it would be beneficial to the area (and would provide
missing product lines and values) if one or more ‘Big Box’
retailers (large format retail stores selling a large assortment
of consumer products such as electronics, linens and house-
wares, or other lines; examples include stores such as Target
or Best Buy) could be recruited to a location along H Street.
ERA reviewed preliminary plans for Station Place as well as
discussed the build-out potential for the Hechinger site. After
consideration of both sites, ERA concluded the following:
• Introduction of a Big Box retailer (55,000 to 80,000
square feet) would require either that the store be con-
structed on two levels (no longer considered an impos-
sibility by national chains, but more costly to operate
than conventional suburban sites and far from common
in the industry) and/or that structured parking woul
required to support the needed number of spaces (
higher than usual cost, if compared to suburban site
• The market impact on H Street corridor retailers w
be indirect rather than direct for either location. Be
of the prevailing pedestrian shopper behaviors (con
ers are reluctant to walk more than 1,200 to 1,500
part of a shopping experience), neither site would c
fortably be a ‘walk-to’ location from the proposed M
Street core area along the central portion of H Stre
is more likely that the introduction of one or more B
Box retailers at the eastern or western end of the cridor would help in recapturing a large share of Dist
based expenditures which are currently ‘leaking’ out
the District to these types of stores in Northern Vir
(particularly to the Potomac Yards ‘Big Box’ mall nea
Alexandria on Route 1) or to stores located in Princ
Georges County. Recapturing these ‘lost’ expenditu
would also increase pass through traffic along H Stre
they would generate what the retail industry calls “i
defined as a retail use that is a strong enough destin
that customers will seek it/them out and are willing
travel further than the distance that the more proxi
markets (motivated by convenience) would be willin
go.
These recovered sales, largely from District of Columbia
dents from Capitol Hill and other neighborhoods in NE NW Washington, would attract more people driving to
destination Big Box stores along the H Street corridor, in
ing the level of exposure for locally owned and Mom-an
businesses located in the more pedestrian-oriented cent
portion of H Street. While it may be argued that destin
retailers may not generate sales in specialty shops and re
taurants on the same trip as their Big Box visit, the expo
could foster another shopping trip later as more and mo
customers become familiar with the H Street cor ridor. T
fore, the benefits of introducing/recruiting Big Box retaile
H Street is less direct, but would build customer traffic fr
other parts of the area which would be less likely to com
H Street at all without the Big Box destinations.
With regard to the potential linkage between the centra
pedestrian retail zone of the Corridor with the Station Place p
ERA is concerned that the walking distance inside the prfrom central H Street, combined with the grade change
the Bridge from the street level below, will act as discou
agements to the expectation of an easy flow of pedestri
shoppers between Station Place and the central (most a
pedestrian oriented) core of the H Street corridor.

7/18/2019 hstpart4
http://slidepdf.com/reader/full/hstpart4 9/45
theHOK PlanningGroup H S T R E E T N E S T R A T E G I C D E V E L O P M E N T P L A N
District of Columbia Office of Planning
AppendixTable 1
Demographic Profil e, 1990-2000Core Trade Area
1 99 0 2 00 0 Ch an ge 1 99 0 2 00 0 Ch an ge 1 99 0 2 00 0 Ch an ge 1 99 0 2 00 0 Ch an ge 1 99 0 2 00 0 Ch an ge
Pop ul at ion 2, 34 6 2, 243 - 4% 1, 96 4 1,9 56 0% 2, 763 2 ,1 39 - 23% 1, 714 1 ,5 06 - 12 % 3 ,666 3 ,2 09 - 12 %
Households 1,078 1,162 8% 830 885 7% 1,080 1,114 3% 540 499 -8% 1,178 1,129 -4%
Family Households 378 383 1% 354 346 -2% 389 342 -12% 353 327 -7% 733 673 -8%
Percentage Family Households 35% 33% - 43% 39% - 36% 31% - 65% 66% - 62% 60% -
AverageHousehold Size N/A 1.92 - N/A 2.08 - - 1.84 - - 2.95 - - 2.81 -
Race
White 57% 60% 0% 54% 55% 3% 21% 22% -17% 4% 4% -29% 5% 5% -15%
Black 41% 34% -20% 45% 40% -10% 77% 71% -29% 95% 92% -15% 93% 92% -14%
American Indian, Eskimo, Aleut 0% 0% 50% 0% 0% -67% 0% 0% -9% 0% 0% 400% 0% 0% -38%
Asian or PacificIslander 1% 3% 89% 1% 2% 88% 1% 2% 40% 0% 1% 60% 1% 1% 9%
Other 1% 1% 69% 1% 1% 36% 1% 1% 13% 1% 2% 145% 1% 1% 8%
Hispanic Origin 2% 3% 45% 2% 3% 25% 2% 3% 0% 2% 3% 50% 2% 3% 29%
Population Age < 18 11% 10% -13% 13% 13% 3% 10% 14% 6% 23% 26% -1% 22% 26% 3%
Population Age 65+ 10% 8% -25% 9% 12% 30% 15% 17% -14% 14% 14% -15% 14% 13% -16%
Male 48% 52% 4% 52% 51% -3% 55% 45% -36% 47% 4 8% -9% 50% 4 8% -16%
Female 52% 4 8% -12% 4 8% 4 9% 2% 4 5% 5 5% -6% 5 3% 5 2% -15% 5 0% 5 2% -9%
Income
M ed ian Ho usehol d In come 43, 29 8 6 6, 550 5 4% 4 5, 357 67 ,8 68 5 0% 2 3, 696 31 ,4 84 3 3% 3 5, 156 43 ,3 33 23 % 27 ,708 35, 22 5 27 %
AverageHousehold Income 51,897 74,353 43% 56,880 79,674 40% 39,432 42,882 9% 38,114 61,127 60% 33,417 43,880 31%
Per Cap it a Inco me 23, 84 7 3 8, 519 6 2% 2 4, 038 36 ,0 49 5 0% 1 5, 413 22 ,3 33 4 5% 1 2, 008 20 ,2 54 69 % 10 ,738 15, 43 8 44 %
Housing Units 1,237 1,254 1% 930 950 2% 1,181 1,245 5% 666 650 -2% 1,394 1,390 0%
Vacant 159 103 -35% 100 61 -39% 101 114 13% 126 165 31% 216 261 21%
Vacant percentage 13% 8% 11% 6% 9% 9% 19% 25% 15% 19%
Owner-occupied 511 609 19% 4 81 515 7% 3 49 418 20% 3 62 336 -7% 6 61 671 2%
Owner-occupied percentage 41% 49% 52% 54% 30% 34% 54% 52% 47% 48%
Renter-occupied 567 553 -2% 349 370 6% 731 696 -5% 178 163 -8% 517 458 -11%
Renter-occupied percentage 46% 44% 38% 39% 62% 56% 27% 25% 37% 33%
Note: Wherepercentages areshown (Race, Age, and Gender), the percent changein units, not composition, isshown in the Changecolumn.
Source: US Census, Economics Research Associates
8583.1 83.2 84.2 84.1
Appendix Table 2
Housing Profile, 2000
Primary Trade Area
83.1 83.2 84.2 84.1 85 86 Total District
Housing Units 1276 921 1199 696 1389 27 5508 274,845
Owner Occupied 623 497 372 381 677 7 2557 101,216
Renter Occupied 550 363 713 147 451 6 2230 147,122
Vacant 103 61 114 168 261 14 721 26,507
Units in Structure
1, detached 48 29 31 0 75 3 186 36,331
1, attached 599 530 457 606 1109 24 3325 72,668
2 231 186 124 38 88 0 667 8,304
3 or 4 104 7 32 43 16 0 202 21,944
5 to 9 42 78 14 0 50 0 184 21,735
10 to 19 51 36 129 9 38 0 263 28,429
20 to 49 119 48 101 0 7 0 275 20,585
50+ 82 7 311 0 0 0 400 64,362
Mobile home 0 0 0 0 6 0 6 203
Boat, RV, Van 0 0 0 0 0 0 0 284
Median rent $740 $806 $480 $599 $522 $625 - $577
Median house value $229,400 $227,200 $143,800 $108,800 $103,200 $98,800 - $157,200
Source: US Census, Economics Research Associat es
Table 3
Aver ag e An nu al Hou seh o ld Con sum er Expen d it ur es
Core and Second ary Trade Areas
Distribution Amount Distribution Amoun
Food
Food at home 7.2% $4,315 7.3% $4,18
Food away from home 4.3% $2,550 4.3% $2,45
Alcoholic beverages 0.8% $466 0.8% $45
Apparel and Accessories
Men's apparel 0.9% $535 0.9% $51
Women's apparel 1.6% $973 1.6% $92
Children's apparel 0.5% $303 0.5% $29
Footwear 0.8% $504 0.9% $49
Watches & jewelry 0.5% $295 0.5% $27
Health Services 2.3% $1,351 2.2% $1,27
Automotive 1.7% $1,000 1.7% $96
Leisure and Entertainment 4.7% $2,788 4.7% $2,70
Home Furnishings 3.6% $2,142 3.6% $2,06
Tot al Household Consumer Expendit ures 28.9% $17,222 28.9% $16,60
Average Household Income $59,621 $57,51
Source: ESRI, USCensus Bureau, Economics Research Associates
Core Secondary
7/18/2019 hstpart4
http://slidepdf.com/reader/full/hstpart4 10/45
theHOK PlanningGroup H S T R E E T N E S T R A T E G I C D E V E L O P M E N T P L A N
District of Columbia Office of Planning
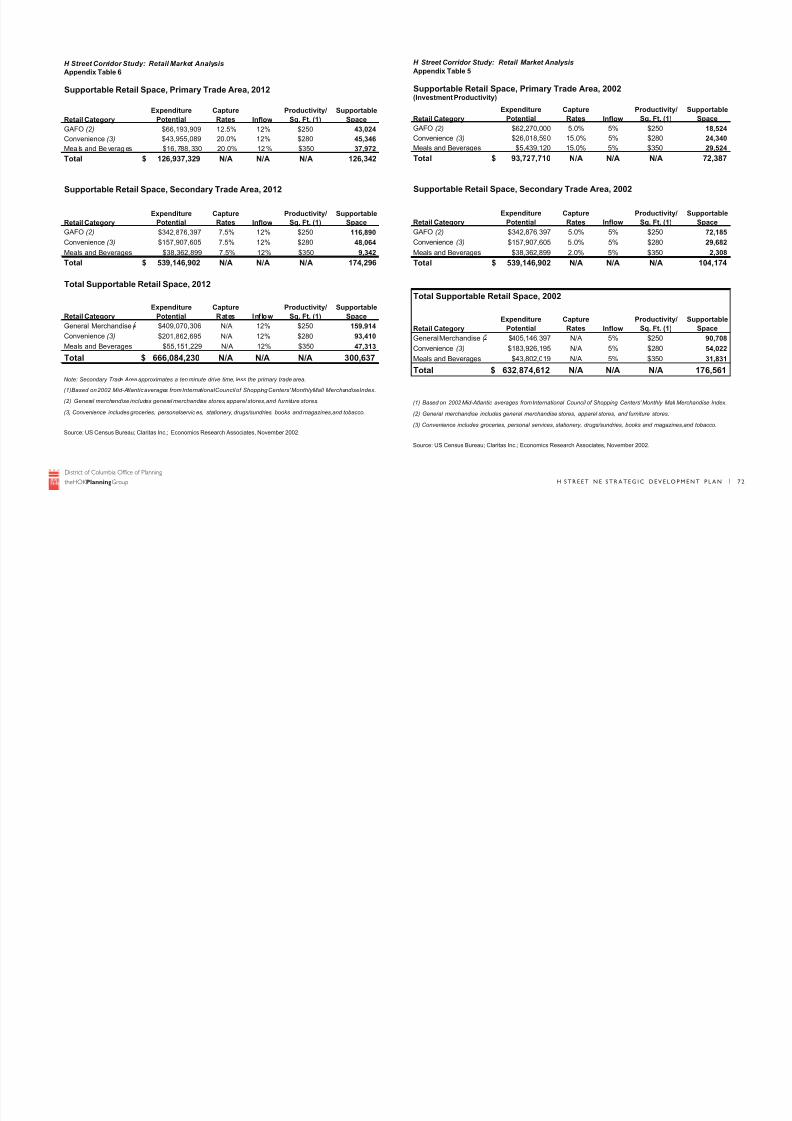
H Street Corridor Study: Retail Market Analysis
Appendix Table 6
Supportable Retail Space, Primary Trade Area, 2012
Retail Category
Expenditure
Potential
Capture
Rates Inflow
Productivity/
Sq. Ft. (1)
Supportable
Space
GAFO (2) $66,193,909 12.5% 12% $250 43,024
Convenience (3) $43,955,089 20.0% 12% $280 45,346Mea ls and Be verag es $16, 788, 330 20 .0% 12 % $350 37,972
Total 126,937,329$ N/A N/A N/A 126,342
Supportable Retail Space, Secondary Trade Area, 2012
Retail Category
Expenditure
Potential
Capture
Rates Inflow
Productivity/
Sq. Ft. (1)
Supportable
Space
GAFO (2) $342,876,397 7.5% 12% $250 116,890
Convenience (3) $157,907,605 7.5% 12% $280 48,064
Meals and Beverages $38,362,899 7.5% 12% $350 9,342
Total 539,146,902$ N/A N/A N/A 174,296
Total Supportable Retail Space, 2012
Retail Category
Expenditure
Potential
Capture
Rates Inf low
Productivity/
Sq. Ft. (1)
Supportable
Space
General Merchandise ( $409,070,306 N/A 12% $250 159,914
Convenience (3) $201,862,695 N/A 12% $280 93,410
Meals and Beverages $55,151,229 N/A 12% $350 47,313
Total 666,084,230$ N/A N/A N/A 300,637
Note: Secondary Trade Area approximates a ten minute drive time, less the primary trade area.
(1)Based on 2002 Mid-Atlantic averages from InternationalCouncil of Shopping Centers' MonthlyMall MerchandiseIndex.
(2) General merchandise includes general merchandise stores, apparel stores,and furniture stores.
(3) Convenience includes groceries, personalservic es, stationery, drugs/sundries, books and magazines,and tobacco.
Source: US Census Bureau; Claritas Inc.; Economics Research Associates, November 2002.
H Street Corridor Study: Retail Market Analysis
Appendix Table 5
Supportable Retail Space, Primary Trade Area, 2002(Investment Productivity)
Retail Category
Expenditure
Potential
Capture
Rates Inflow
Productivity/
Sq. Ft. (1)
Supportable
Space
GAFO (2) $62,270,000 5.0% 5% $250 18,524
Convenience (3) $26,018,590 15.0% 5% $280 24,340Meals and Beverages $5,439,120 15.0% 5% $350 29,524
Total 93,727,710$ N/A N/A N/A 72,387
Supportable Retail Space, Secondary Trade Area, 2002
Retail Category
Expenditure
Potential
Capture
Rates Inflow
Productivity/
Sq. Ft. (1)
Supportable
Space
GAFO (2) $342,876,397 5.0% 5% $250 72,185
Convenience (3) $157,907,605 5.0% 5% $280 29,682
Meals and Beverages $38,362,899 2.0% 5% $350 2,308
Total 539,146,902$ N/A N/A N/A 104,174
Total Supportable Retail Space, 2002
Retail Category
Expenditure
Potential
Capture
Rates Inflow
Productivity/
Sq. Ft. (1)
Supportable
Space
General Merchandise ( $405,146,397 N/A 5% $250 90,708
Convenience (3) $183,926,195 N/A 5% $280 54,022
Meals and Beverages $43,802,019 N/A 5% $350 31,831
Total 632,874,612$ N/A N/A N/A 176,561
(1) Based on 2002 Mid-Atlantic averages from International Council of Shopping Centers' Monthly Mall Merchandise Index.
(2) General merchandise includes general merchandise stores, apparel stores, and furniture stores.(3) Convenience includes groceries, personal services, stationery, drugs/sundries, books and magazines,and tobacco.
Source: US Census Bureau; Claritas Inc.; Economics Research Associates, November 2002.

7/18/2019 hstpart4
http://slidepdf.com/reader/full/hstpart4 11/45
theHOK PlanningGroup H S T R E E T N E S T R A T E G I C D E V E L O P M E N T P L A N
District of Columbia Office of Planning
H Street Corridor Study: Retail Market Analysis
Appendix Table 6
Supportable Retail Space, Primary Trade Area, 2012
Retail Category
Expenditure
Potential
Capture
Rates Inflow
Productivity/
Sq. Ft. (1)
Supportabl
Space
GAFO (2) $66,193,909 12.5% 12% $250 43,02
Convenience (3) $43,955,089 20.0% 12% $280 45,34
Meals and Beverages $16,788,330 20.0% 12% $350 37,97
Total 126,937,329$ N/A N/A N/A 126,342
Supportable Retail Space, Secondary Trade Area, 2012
Retail Category
Expenditure
Potential
Capture
Rates Inflow
Productivity/
Sq. Ft. (1)
Supportabl
Space
GAFO (2) $342,876,397 7.5% 12% $250 116,89
Convenience (3) $157,907,605 7.5% 12% $280 48,06
Meals and Beverages $38,362,899 7.5% 12% $350 9,34
Total 539,146,902$ N/A N/A N/A 174,29
Total Supportable Retail Space, 2012
Retail Category
Expenditure
Potential
Capture
Rates Inflow
Productivity/
Sq. Ft. (1)
Supportabl
Space
General Merchandise ( $409,070,306 N/A 12% $250 159,91
Convenience (3) $201,862,695 N/A 12% $280 93,41
Meals and Beverages $55,151,229 N/A 12% $350 47,31
Total 666,084,230$ N/A N/A N/A 300,637
Note: Secondary Trade Area approximates a ten minute drive time, less the primary trade area.
(1) Based on 2002 Mid-Atlantic averages from International Council of Shopping Centers' Monthly Mall Merchandise Index.
(2) General merchandise includes general merchandise stores, apparel stores, and furniture stores.
(3) Convenience includes groceries, personal services, stationery, drugs/sundries, books and magazines,and tobacco.
Source: US Census Bureau; Claritas Inc.; Economics Research Associates, November 2002.

7/18/2019 hstpart4
http://slidepdf.com/reader/full/hstpart4 12/45
theHOK PlanningGroup H S T R E E T N E S T R A T E G I C D E V E L O P M E N T P L A N
District of Columbia Office of Planning
A P P E N D I X B - M E R C H A N T A N D C O N S U M E R S U R V E Y S A N D S U M M A R I E S

7/18/2019 hstpart4
http://slidepdf.com/reader/full/hstpart4 13/45
theHOK PlanningGroup H S T R E E T N E S T R A T E G I C D E V E L O P M E N T P L A N
District of Columbia Office of Planning
Government of the District of Columbia Office of Planning H Street Revitalization Study
H Street Merchants Survey
Business
Name:
Address:
Owner Name: Address:
Property
Owner:
Address:
1. What is your type of Business:
Take-out restaurant Hair/nail salon barber shop Retail-mens clothing
Sit-down eatery Non-profit/social services Retail-womens clothing
Grocery-no liquor Church Retail-sporting goods
Grocery-liquor sale Entertainment Retail-shoes
Liquor store Dry cleaner/Laundromat Retail other:
Arts/cultural related Professional services: (specify) Electronics
2. Size of Business: Square feet Number of floors occupied Number of floors in building
3a. How long has your businessoperated?
Yrs. Months 3g. Do you have the option to Yes No
renew?
3b. How long have you been at thisaddress?
Yrs. Months
3c. How long have you operated
in DC?
Yrs. Months
3h. What is you rent? or
$ Per month $ Per year
3d. How many employees do
you have?
Full-time Part-time 3i. Are your accounting systems Yes No
automated/electronic?
3e. Do you own or rent yourspace/building?
Own Rent 3j. Do you use a computer at Yes No
your business?
3f . How long is your term of
lease?
Yrs. Yrs.
Remaining
3k. Do you accept credit cards? Yes No
4a. What hours do you operate? AM to PM 4d. Do you have a current Yes No
business plan?
4b. When is your peak business : M to : M
period?
4e. When do you receive Early AM AM
deliveries?Noon Afternoon PM
4c. How do you advertise? Community newspaper(s) City newspaper Radio Churches
Schools Website Other
5a. What was your total annual sales in 2001?
5b. In the last 3 5 years, has your business volume Increased Remained stable Declined
5c. In the last year, what percentage at your sales could be 0-20% 21-44% 50% or more
considered new business?
5d. What percentage of your customers come from within the 51% or more 50% Less than 50%
surrounding H Street neighborhood?
5e. How do your customers come to your business?
% Walk % Drive % Bus % Bike or taxi
5g. If your patrons drive where do they generally park?
Street Parking lot
5f . What is your average number of customers daily?
H Street Merchants Survey (continued)
6a. Which of these do you know about?
Enterprise Zone Incentives Master Business Licenses
HUB Zone Incentives Historic Preservation tax credit benefits
Advantages of status as a Local Small-DisadvantagedBusiness Entrepreneur (LSDBE)
reSTORE DC Main Street Initiative
Setting up a Business Improvement District (BID) Strategic Neighborhood Action Plan (SNAP)recommendations regarding H Street NE and
surrounding communities6b. Do you participate in the H Street Merchants & Professionals Association? Yes No
6c. Have you used the services of the H Street Community Development Corporation? Yes No
(If so, which?)
6d. Do you participate in any other merchants organization(s)? Yes No
(If so, which?)
7a. Why are you on H Street? 7b. What made you locate here? 7c. Why do you stay?
Family business
Affordable rent
Community demand forservice
Other
Rate the H Street corridor in the following factors: (PLACE X IN BOX)
Very poor Poor Average Good Excelle
Physical Image and Character
Cleanliness
Safety
Area name recognition
Parking
Credit availability/ease for getting loans
Loyalty/patronage of local shoppers
Government Services
(OPTIONAL)Race of business owner. Black White Asian
Other (specify) ____________________________
X X

7/18/2019 hstpart4
http://slidepdf.com/reader/full/hstpart4 14/45
theHOK PlanningGroup H S T R E E T N E S T R A T E G I C D E V E L O P M E N T P L A N
District of Columbia Office of Planning
demand periods.
7. An estimated 67% of businesses do not have a current business
plan. 62% of renters do not have a business plan, and 71% of
owners do not.
8. 67% of business do not have electronic accounting systems.
62% and 71% of renters and owners, respectively, do not.
9. 52% of all businesses indicated that they have access to a
computer at their business. 64% of owners have computer
access onsite while only 38% of renters have access.
10. 41% of businesses accept credit card purchases. 54% ofrenters accept credit cards while 71% of owners do not. This
variation may relate to the age of the business as well as the
type of business.
Sales and Customer Base
11. Of the nine owners repor ting annual sales information,
sales average approximately $475,000. For the four renters
reporting, the average is just over $293,000.
12. 43% of businesses report that over 50% of their customer
base comes from the local neighborhood. 22% estimate that
half of their customers are local residents while 35% believe
that less than half are area residents.
13. Over the last 3 to 5 year period, businesses old enough
to report indicate that their customer base has primar ily
remained stable (44%). 28% repor t an increase. 11% of
businesses report declining customer bases. Review ofcustomer base dynamics by age of business was largely
consistent as business between 3 and 5 years, 5 and 10, 10 and
20, 20 and 30, and over 30 years old, predominantly repor ted
a stable customer base.
14. 60% of businesses reported that less than 20% of their
customers could be considered “new business.”
Trends and Attitudes
15. Between 26 and 37% of businesses indicated that they are on
H Street due to community demand for their products and
services. 19% report family ties and rent issues, individually, as
the reason for their H Street location.
16. Respondents rated the corridors physical image and character
as predominantly poor or average (36% in each category).
17. 42% view the corridor’s cleanliness as average. 27 % found itpoor.
18. Safety received a poor rating from 42 % of respondents. 38%
found it average.
Summary of Trends Regarding H Street Business
Owners
From mid April to mid May 2002, the District of Columbia’s Office
of Planning implemented a survey of business/property owners
on H Street NE from 3rd to 17th Street. The purpose of the
survey was to gather a sample of information to discern trends
affecting H Street owners and their opinions of resources, services
and information available to them. This survey was prompted
by a pending planning process that would result in a series of
recommendations about revitalizing this important neighborhood
serving and regional commercial street.
Between 120 and 150 surveys were mailed to H Street business
owners. District staff visited each business on the H Street
corridor to assist in completing the sur vey, to provide a copy of
the survey to those who did not receive it via mail, to pick up
surveys, to encourage completion of the survey and to inform
owners about the pending planning process. Twenty-seven surveys
(27) were returned. The response level was roughly 20% of
owners on the corridor. Geographically, owners were spread
across the corridor. Respondents were predominantly local
businesses.
The results of the sampling are as follows:
Operations
1. Of those responding, property owner operate approximately
half of businesses. Sur veys were returned from 14 property
owners (52%) and 13 renters (48%).
2. The range of the age of businesses is wide, from a few months
up to over 50 years. The average business age is approximately
14 years. On average, just over 11 of those years were spent on
H Street.
3. Of those who own their proper ty and business, the average
age is almost 16 years, roughly 5 years more than others on H
Street. Those renting averaged 6.5 years on H Street.
4. The average employee/staff size is between 3 and 5 full and
part-time employees for small business owners. If employment
at the corridor’s institutions is factored in, the number increases
noticeable. Major employers include Capitol Children’s Museum,
Department of Employment Services, etc. With employment at
the Museum alone, the range increases up to over 7 employees
on average.
5. Amongst renters, the typical lease term is about 5 years with
85% reporting options to renew.
6. Most businesses maintain 9 AM to 6 PM business owner s.
However, several reported opening as early as 7 AM and closing
as late as 9 or 10 PM. This information will be most useful
if mapped for all corridor businesses to determine parking
19. 46% found the corridor’s name recognition as average.
believe it is good.
20. Respondents rated parking from very poor to average.
view parking availability as poor. 23% rated parking as v
poor and another 23% rated it as average.
21. 44% rated credit availability as poor ; 25%, very poor; an
average.
22. Business owners rated customer loyalty as good (45%)
average (41%).
23. 36% find government service delivery to be average; 32good; 18%, very poor; and 1 4%, poor.
24. 65% of all respondents are black; 9%, white; 22%, Asian
other.
25. Of owners, blacks constitute 73%; whites, 18%; and Asia
Of renters, 58% are black; 33%, Asian; and 8%, other.
Services and Incentives
26. There is an astoundingly clear n eed for District Govern
to better disseminate information about its programs, in
and incentives.
85% do not know about the Enterprise Zone on H Stre
85% do not know about the HUB zone.
81% do not know about the advantages of Local Small
Disadvantage Business Entrepreneur status (LSDBE).
93% do not know about how a Business Improvement
(BID) is established.
81% do not know about Master Business Licenses.
93% do not know about the pros and cons of historic
preservation and tax credits available for landmark build
restoration.
81% do not know about reStore DC Main Streets thou
Street was recently designated as such.
93% do not know what the Strategic Neighborhood Ac
Plan (SNAP) for their Cluster says about H Street.
27. 37% of respondents are active members of the H Stree
Merchants and Professionals Association.
28. 30% have accessed the services available through the H
Community Development Corporation (HSCDC).
29. 11% are at least members of another merchants or
professional organization.

7/18/2019 hstpart4
http://slidepdf.com/reader/full/hstpart4 15/45
theHOK PlanningGroup H S T R E E T N E S T R A T E G I C D E V E L O P M E N T P L A N
District of Columbia Office of Planning
H Street NE Revitalization
DC Office of Planning
DCOffi ce of Planning801 N. Capitol Street, NE -4th Floor
Washington, DC 20002
Phone: 202-442-7600Fax: 202-442-7637
[email protected]@dc.gov
Government of the District of Columbia
1. Where do you live?
� Within 3 blocks of H Street NE
� Near Northeast, Stanton Park,Linden, Rosedale, or KingmanPark (Cluster 25)
� Elsewhere Zip Code
2. Where do you work/go to school?
� Within 3 blocks of H Street NE
� In Near Northeast, Stanton Park,Linden, Rosedale, or KingmanPark (Cluster 25)
� Elsewhere Zip Code
� Not Applicable
3. What is your annual household income?
� Under $10,000
� $10,000 - $25,000
� $25,000 - $50,000
� $50,000 - $100,000
� Over $100,000
4. Ho w old are you?� Under 18� 18-24� 25-34� 35-49� 50-64� 65 or over
5. What is your gender?
� Male
� Female
6. How many people are in your household? ______________
What are their ages? (please list)
7. When was the last time you visitedH Street NE? (if never go to #11)
� Today
� This week
� Last week
� Several weeks/months ago
� Never: Why not?____________
__________________________
10. What was the purpose of your most recent visit?
� Work
� Shopping or running errands
� To eat/getlunch or dinner
� Church
� Exercising/just passing through
� Visiting friends/hanging out
� Catching the bus
� Browsing/just looking around
� Other:__________________
8. How often do you visit H Street?
� Daily
� Weekly
� Once or twice a month
� Rarely
9. When do you usually visit?
� Workday/school time (9am-5pm)
� Mornings
� Noontime/lunchtime
� Afternoon
� Evening
� Weekends
H Street NE
Consumer Survey
For more information on the HStreet NE Revitalization Plan please contact
Please take a momentto complete the follow-
ing survey. The infor-mation you providewill help guide the re-vitalization of the HStreet NE commercial
corridor with valuableinformation on currentconditions and percep-tions on and about HStreet, NE. All infor-
mation is voluntaryand anonymous.
For Internal Uses Only:Date: ______________
� H� EM� U
� FM� PS� CS
H Street NE Revitalization
DC Office of Planning
Please describe what you would like to see on the H Street corridor or your vision for the street:
DCOffice of Planning801 N. Capitol Street, NE -4th Floor
Washington, DC 20002
Phone: 202-442-7600Fax: 202-442-7637
[email protected]@dc.gov
Government of the District of
Columbia
11. Where do you buy the following
goods and services most frequently?H - for H Street, NE
U - for Union Station
M - fort he HechingerMall
DC - for elsewhere in DC
O - for outside the District
If you do not purchase, leave the lineblank.
Retail Items
___ Everyday clothing
___ Specialty clothing (hats, hip-hop)
___ Shoes
___ Home furnishings (furniture, etc.)
___ Hardware items
___ Music (tapes, CDs, etc.)
___ Books and magazines
___ Health products (prescription
drugs, drug store items, etc.)
___ Specialty retail (antiques, jewelry,
etc.)
Food Sales
___ Groceries
___ Convenience shop items (soda, etc.
___ Carry-out or delivery food
___ Eat-in or sit down restaurant food
___ Alcohol purchases (take home)
___ Specialty foods (nutritional suppli-
ments, fresh fish, etc.)
Services
___ Beauty services
___ Financial services (banking, etc.)
___ Legal or health services (doctor,
lawyer, dentist, etc.)
___ Automotive services
___ Contracting services
___ Entertainment (movies, dancing,)
12. How would you rate H Street
on the following characteristics?
Mark:1 - for excellent
2 - for good
3 - for average4 - for poor
5 - for very poor
(fill in each blank)
_____ Variety of goods and services _____ Cost of goods and services
_____ Quality of goods and services
_____ Sense of comfort/safety
_____ Physical appearance/character
_____ Cleanliness
_____ Friendliness of retailers
_____ Easy and safe for pedestrians
_____ Transit service/access by transit
_____ Parking availability
_____ Neighborhood/commun ity pride
H Street NE
Consumer Survey
13. What are the top two things thatwould attract you to H Street more?
� Better mix of goods & services
� More attractive character
�Better sense of personal safety
� Easier access (transit/parking)
� More things to do
� Better sense of what is there
� Better prices
� Other _________________
14. What do you like most about H
Street today ?
Thankyou fo r participating.
RETURN SURVEY TO:

7/18/2019 hstpart4
http://slidepdf.com/reader/full/hstpart4 16/45
theHOK PlanningGroup H S T R E E T N E S T R A T E G I C D E V E L O P M E N T P L A N
District of Columbia Office of Planning
H Street Consumer Survey Summary ResultsTotal number of returned surveys 534
Surveying period - June - August '02
home zip
Outside DC 104
Other DC 159
20003 12
20002 14
Not identified 245
Work zip
Outside DC 94
Other DC 105
20003 13
20002 14
Not identified 308
Age
Under 18 21
18 - 24 29
25 - 34 149
35 - 49 162
50 - 64 106
Over 65 47
Not identified 20
Home residence19%
30%
46%
2%3%
Outside DC
Other DC
20003
20002
Not identified
Work location18%
20%
2%
57%
3%
Outside DC
Other DC
20003
20002
Not identified
Age of respondants
4% 5%
28%
30%
20%
9% 4% Under 18
18 - 24
25 - 34
35 - 49
50 - 64
Over 65
Not identified
Gender
Male 179Female 339Not identified 16
Annual Income
Under $10,000 38$10,000 - $25,000 64$25,000 - $50,000 150$50,000 - $100,000 147Over $100,000 80Not identified 55
Last Visit
Today 286This Week 56Last Week 50Several weeks ago 94Never 23Not identified 25
* Note 10 "nevers" comment on H Street with familiarity and respond that their frequency of visits to H Street is "rarely" indicating
they have probably been to H Street before
Gender
34%
63%
3%
MaleFemale
Not identified
Annual Income7%
12%
28%28%
15%
10%
Under $10,000
$10,000 - $25,000
$25,000 - $50,000
$50,000 - $100,000
Over $100,000
Not identified
Last Visit
54%
10%
9%
18%
4% 5%
Today
This Week
Last Week
Several weeks ago
Never
Not identified
Frequency of Visits
Daily 179
Weekly 133
Once or twice a month 102
Rarely 88
Not identified 32
Time of Visit
Mornings 63
Work/School time 161
N oon ti me /l un ch ti me 3 4
Afternoon 54
Evening 81
Weekends 93
Not identified 48
Purpose of Visit
Work 131
Shopping/running errands 159
Waiting for the bus 20
Church 57
Vi si ti ng/ han gi ng o ut 1 3
Browsing/looking around 14
Eating lunch/dinner 19
Exercising/passing through 12
Not identified 37
Other: 72
Hair 38
DMV 6
Other 28
Frequency of Vis
34%
25%
19%
16%6%
Daily
Weekly
Once or twice a mo
Rarely
Not identified
Time of Vis12%
31%
6%10%15%
17%
9%
Mornings
Work/School time
Noontime/luncht
Afternoon
Evening
Weekends
Not identified
0
20
40
60
80
100
120
140
160
180
Purpose of Visit
Work
Shopping/running errands
Waiting for the bus
Church
Visiting/hanging out
Browsing/looking around
Eating lunch/dinner
Exercising/passing throug
Not identified
Other:
Everyday Spe Sho Home iteHar Mus Boo Hea Spe Gro Con TakeRes AlcoSpe Bea bankHea autoCon entert
Total responding 367 305 357 335 345 355 334 358 318 361 334 348 340 267 318 329 336 324 294 238 325
Union Station 15 9 13 0 0 23 38 3 3 1 8 20 27 8 4 3 4 1 2 0 42
Outside DC 230 183 210 268 165 180 155 135 212 148 74 67 145 90 132 103 95 120 183 141 148Hechinger Mall 4 4 3 7 14 3 6 24 0 48 12 4 0 0 7 7 2 1 0 1 3
H Street 38 32 40 10 47 37 12 45 17 20 65 83 10 23 16 94 43 7 14 3 5
Elsewhere in DC 80 77 91 50 119 112 123 151 86 144 175 174 158 146 159 122 192 195 95 93 127
No response 168 230 178 200 190 180 201 177 217 174 201 187 195 268 217 206 199 211 241 297 210
Total responding
050
100150200250300350400
E v e r y d
a y C l o t h i
n g
S p e c i a l
C l o t h i
n g
S h o e s
H o m e i t e m
s
H a r d w a
r e
M u s
i c
B o o k s
H e a l t h
s u p p l i
e s
S p e c i a l
t y r e t a i l
G r o c e r y
C o n v
e n i e n c e
T a k e - o
u t
R e s t a
u r a n t
A l c o h o l
S p e c i a l
t y f o o d s
B e a u t y
s e r v i c
e s
b a n k i n g
H e a l t h
s e r v i c
e s
a u t o
s e r v i c
e s
C o n t r a c t i n g
s e r v i c
e s
e n t e
r t a i n m e
n t

7/18/2019 hstpart4
http://slidepdf.com/reader/full/hstpart4 17/45
theHOK PlanningGroup H S T R E E T N E S T R A T E G I C D E V E L O P M E N T P L A N
District of Columbia Office of Planning
RETAIL ITEMS
Everyday Clothing Hardware
Union Station 15 Unio 0
Outside DC 230 Out 165
Hechinger Mall 4 Hec 14
H Street 38 H St 47
Elsewhere in DC 80 Else119
Special Clothing Music
Union Station 9 Unio 23
Outside DC 183 Outs180
Hechinger Mall 4 Hec 3
H Street 32 H St 37
Elsewhere in DC 77 Else112
Shoes Books
Union Station 13 Unio 38
Outside DC 210 Outs155
Hechinger Mall 3 Hec 6
H Street 40 H St 12
Elsewhere in DC 91 Else123
Home items
Union Station 0 Health supplies
Outside DC 268 Unio 3
Hechinger Mall 7 Outs135
H Street 10 Hec 24
Elsewhere in DC 50 H St 45
Else151
Everyday Clothing
4%
63%
1%
10%
22%
UnionStation
OutsideDC
HechingerMall
HStreet
ElsewhereinDC
Special Clothing3%
61%
1%
10%
25%
Union Station
Outside DC
Hechinger Mall
H Street
Elsewhere in DC
Shoes4%
59%
1%
11%
25%
UnionStation
OutsideDC
HechingerMall
HStreet
Elsewherein DC
Home items0%
80%
2%
3%
15%
UnionStation
OutsideDC
HechingerMall
HStreet
ElsewhereinDC
Hardware0%
48%
4%14%
34%UnionStation
OutsideDC
HechingerMall
HStreet
Elsewherein DC
Music
6%
51%
1%
10%
32%
UnionStation
OutsideDC
HechingerMall
HStreet
ElsewhereinDC
Books
11%
46%
2%4%
37% UnionStation
OutsideDC
HechingerMall
HStreet
ElsewhereinDC
Health supplies
1%
38%
7%13%
41%UnionStation
OutsideDC
HechingerMall
HStreet
ElsewhereinDC
Food Purchases
Grocery Alcohol
Union Station 1 Uni 8
Outside DC 148 Outs 90
Hechinger Mall 48 Hec 0H Street 20 H St 23
Elsewhere in DC 144 Else146
Convenience Specialty foods
Union Station 8 Uni 4
Outside DC 74 Outs132
Hechinger Mall 12 Hec 7
H Street 65 H St 16
Elsewhere in DC 175 Else159
Take-out
Union Station 20 Restaurant
Outside DC 67 Uni 27
Hechinger Mall 4 Outs145
H Street 83 Hec 0
Elsewhere in DC 174 H St 10
Else158
Grocery
0%
41%
13%6%
40% Union Station
Outside DC
Hechinger Mall
H Street
Elsewhere in DC
Convenience2%
22%
4%
19%
53%
Union Station
Outside DC
Hechinger Mall
H Street
Elsewhere in DC
Take-out6%
19%
1%
24%
50%
UnionStation
OutsideDC
HechingerMall
HStreet
Elsewherein DC
Restaurant8%
43%
0%3%
46%
Union Station
Outside DC
Hechinger Mall
H Street
Elsewhere in DC
Alcohol3%
34%
0%
9%
54%
Union Station
Outside DC
Hechinger Mall
H Street
Elsewhere in DC
Specialty foods1%
42%
2%5%
50%
UnionStation
OutsideDC
HechingerMall
HStreet
ElsewhereinDC
SERVICES
Beauty services Contracting services
Union Station 3 Unio 0
Outside DC 103 Out 141
Hechinger Mall 7 Hec 1
H Street 94 H St 3
Elsewhere in DC 122 Else 93
auto services
banking Unio 2
Union Station 4 Out 183
Outside DC 95 Hec 0
Hechinger Mall 2 H St 14H Street 43 Else 95
Elsewhere in DC 192
Health services entertainment
Union Station 1 Unio 42
Outside DC 120 Out 148
Hechinger Mall 1 Hec 3
H Street 7 H St 5
Elsewhere in DC 195 Else127
Beauty services1%
31%
2%
29%
37%UnionStation
OutsideDC
HechingerMall
HStreet
ElsewhereinDC
Banking
1%
28%
1%
13%
57%
UnionStation
OutsideDC
HechingerMall
HStreet
ElsewhereinDC
Health services0%
37%
0%
2%
61%
UnionStation
OutsideDC
HechingerMall
HStreet
ElsewhereinDC
auto service1%
62%
0%
5%
32%
UnionStation
OutsideDC
HechingerMal
HStreet
ElsewhereinD
Contracting service
0%
60%
0%1%
39%UnionStation
OutsideDC
HechingerMa
HStreet
ElsewhereinD
entertainme
13%
45%
1%2%
39%UnionStation
OutsideDC
HechingerMall
HStreet
ElsewhereinD
Rating Variety Cos QuaPersonalApp Cle Frie Saft Tra ParkNeighborhood Pride
Very Poor 81 27 58 122 131 131 26 80 21 82 69
Poor 115 48 88 116 164 141 46 105 35 85 93 Average 134 184 165 116 95 87 174 139 116 137 139
Good 50 85 52 45 35 45 92 56 128 58 51
Excellent 27 24 28 14 11 8 40 17 87 18 34
0%
10%
20%
30%
40%
50%
60%
70%
80%
90%
100%
V a r i e t y C o s t
Q u a l i t y
P e r s o n a l C o m f o r t
A p p e a r a n c e
C l e a n l i n e s s
F r i e n d l i n e s s
S a f t e y
T r a n s i t
P a r k i n g
N e i g h b o r h o o d P r i d e
Very Poor Poor Average Good Excellent

7/18/2019 hstpart4
http://slidepdf.com/reader/full/hstpart4 18/45
theHOK PlanningGroup H S T R E E T N E S T R A T E G I C D E V E L O P M E N T P L A N
District of Columbia Office of Planning
A P P E N D I X C - N O N - P R E F E R R E D S T R E E T S E C T I O N A L T E R N A T I V E S

7/18/2019 hstpart4
http://slidepdf.com/reader/full/hstpart4 19/45
theHOK PlanningGroup H S T R E E T N E S T R A T E G I C D E V E L O P M E N T P L A N
District of Columbia Office of Planning
1 Valley Connections, About Light Rail: Fact Sheet ,
http://www. va lleyconnections.com/images/newsletters/pdf/About_2 McCormick Rankin International, Bus Rapid Transit, A Creative Solut
Some of Today’s Urban Transportation Problems, November 2000. p p3 United States General Accounting Office, Bus Rapid Transit Shows
Promise, Washing ton, DC., 2001. pp . 17.4 Ibid. pp. 25.5 Arrington, Jr., G.B.,Beyond the Field of Dreams: Light Rail and Growt
Management in Portland , Portland, OR, 1996. pp. 10.
STREET SECTION & PLAN
Non-Preferred Alternative 1 - Two 12’ Light Rail
Tracks / Center Pole / Four 11’ Travel Lanes / No
Parking / 10’ Sidewalks
Vehicular
Advantages
§ Maintains three travel lanes (two traffic and one light rail)
to accommodate peak traffic.
§ 11’ travel lanes vs. 10’ travel lanes could potentially increase
traffic capacity by approximately 4%.
§Light rail could play a significant role in reducing vehicular traffic demands.
Disadvantages
§ Inability to use a third traffic lane as a travel/turning lane in
the peak direction during rush periods.
§ Potential growth in the H Street and North Capitol Street
corridors may cause a need to keep three traffic lanes
in the peak direction during weekday commuter peak
periods.
Transit
Advantages
§ Ability to maintain local bus service similar to current bus
service in addition to light rail.
§ Two dedicated lanes each carrying four-car light rail trainswith 450 passengers every five minutes has seven-and-
a-half times (7.5X) the ridership capacity as conventional
bus service with 60-passenger buses at the same interval. 1
§ Because dedicated rights-of-way separate light rail vehicles
from other traffic, light rail can operate faster and with
greater schedule reliability than local bus service.
§ Light rail provides user-friendly service, which enhances
access throughout the H Street corridor and also to other
key areas in the city.
§ Light rail on a dedicated transit lane is generally perceived
by the public as a more attractive transit mode than
conventional bus service in mixed traffic lanes or even bus
rapid transit.2
Disadvantages
§ Average infrastructure construction capital cost per milefor light rail is $34.8 million vs. $680,000 to $13.5 million
for bus rapid transit.3
§ Light rail vehicle speed is generally slower than that for bus
rapid transit.4
Pedestrian
Advantages
§ Mid-street light rail station platforms provide pedestri
refuge islands.
§ Higher quality and more frequent transit service gene
translates into more on-street foot-traffic.5
Disadvantages
§ Elimination of curbside parking lanes eliminates any b
between the sidewalk pedestrian zone and private vehicle tr
travel lanes.
§ Some sidewalk space is narrower than 10’, due to stre
furniture and bus stops, which does not permit adequ
space for pedestrians to walk comfortably on a busy
commercial street.
§ Two additional 11’ travel lanes need to be traversed (
parking lanes would be removed) to reach other side
street, which increases pedestrian/vehicular conflicts.
§ Two travel lanes need to be traversed to reach mid-st
light rail station platforms.
Parking
Advantages
§ Light rail could reduce the vehicular parking demands
corridor with less private vehicle dependency.
Disadvantages
§ Permanent cu rbside travel lanes along H Street elim
convenient parking spaces.

7/18/2019 hstpart4
http://slidepdf.com/reader/full/hstpart4 20/45
theHOK PlanningGroup H S T R E E T N E S T R A T E G I C D E V E L O P M E N T P L A N
District of Columbia Office of Planning
Non-Preferred Alternative 2 - Light Rail / Two 11’5
inch Tracks / No Center Pole / Four 11’ Travel Lanes
/ 11’7 inch Sidewalks / No Parking
Vehicular
Advantages
§ Maintenance of three (3) travel lanes needed (two traffic
and one light rail) to accommodate peak traffic demands.
§ Light rail could play a significant role in reducing vehicular
traffic demands.
§11’ traffic lanes vs. 10’ traffic lanes could potentially increase traffic capacity by approximately 4%.
Disadvantages
§ Inability to use a third traffic/turning lane as a travel lane in
the peak direction during rush periods.
§ Potential growth in the H Street and North Capitol Street
corridors may cause a need to keep three traffic lanes in the
peak direction during weekday commuter peak periods.
Transit
Advantages
§ Ability to maintain local bus service similar to current bus
service in addition to light rail.
§ Two dedicated lanes each carrying four-car light rail trains
with 450 passengers every five minutes has seven-and-a-half times (7.5X) the ridership capacity as conventional bus
service with 60-passenger buses at the same interval.
§ Because dedicated rights-of-way separate light rail vehicles
from other traffic, light rail can operate faster and with
greater schedule reliability than local bus service.
§ Light rail provides user-friendly service that enhances access
throughout the H Street corridor and also to other key
areas in the city.
§ Light rail on a dedicated transit lane is generally perceived
by the public as a more attractive transit mode than
conventional bus service in mixed traffic lanes.
Disadvantages
§ Average infrastructure construction capital cost per mile for
light rail is $34.8 million vs. $680,000 to $13.5 million for
bus rapid transit.§ Light rail vehicle speed is generally slower than that for bus
rapid transit.
Pedestrian
Advantages
§ Increase in sidewalk space from 10’ to 11’7 inch, pro
more pedestrian space on heavily used sidewalks.
§ Mid-street light rail station platforms provide pede
refuge islands.
Disadvantages
§ Removal of curbside parking lanes eliminates any
between the sidewalk pedestrian zone and private vehicle tr
travel lanes.
§ Two additional 11’ travel lanes need to be trav
to reach other side of street, which increases r
pedestrian/vehicular conflicts.
§ Two travel lanes need to be crossed to reach mid-
light rail station platforms.
Parking
Advantages
§ Light rail would reduce the vehicular parking deman
the corridor with less private vehicle dependency.
Disadvantages
§ Permanent curbside travel lanes along H Street elim
convenient parking spaces.
STREET SECTION & PLAN
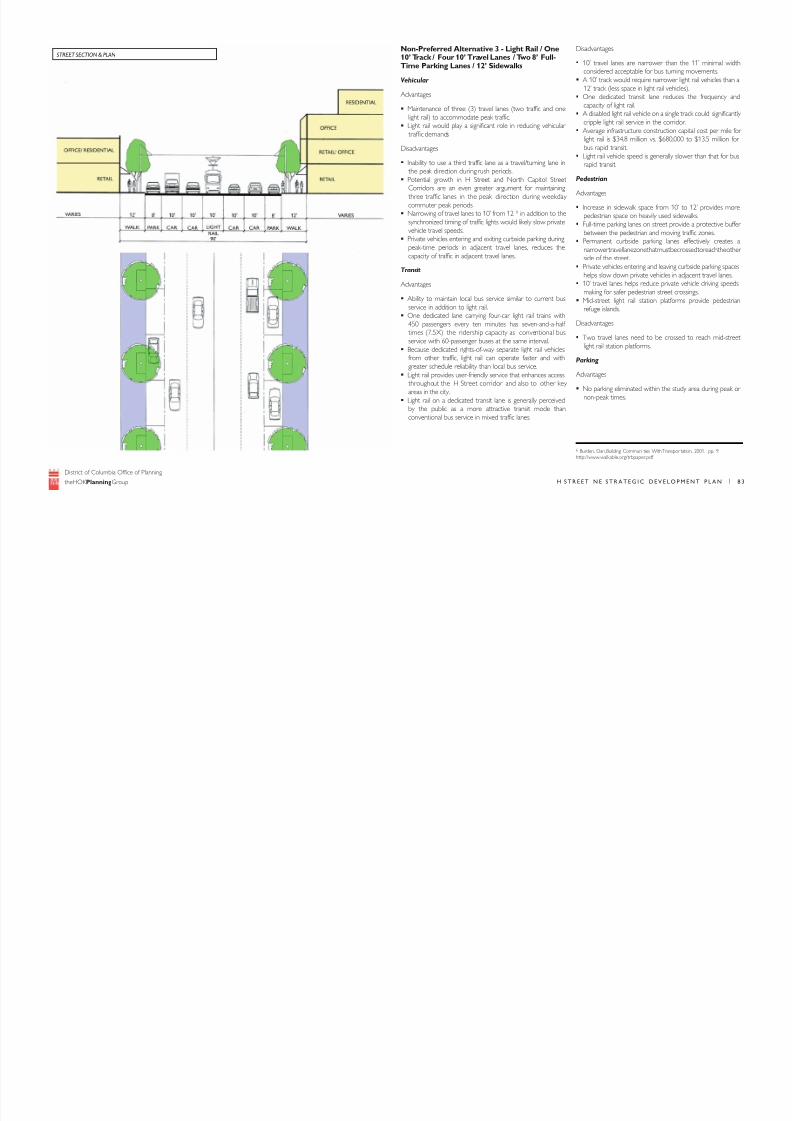
7/18/2019 hstpart4
http://slidepdf.com/reader/full/hstpart4 21/45
theHOK PlanningGroup H S T R E E T N E S T R A T E G I C D E V E L O P M E N T P L A N
District of Columbia Office of Planning
Non-Preferred Alternative 3 - Light Rail / One10’ Track / Four 10’ Travel Lanes / Two 8’ Full-Time Parking Lanes / 12’ Sidewalks
Vehicular
Advantages
§ Maintenance of three (3) travel lanes (two traffic and one
light rail) to accommodate peak traffic.
§ Light rail would play a significant role in reducing vehicular
traffic demands
Disadvantages
§ Inability to use a third traffic lane as a travel/turning lane in
the peak direction during rush periods.
§ Potential growth in H Street and North Capitol Street
Corridors are an even greater argument for maintaining
three traffic lanes in the peak direction during weekday
commuter peak periods.
§ Narrowing of travel lanes to 10’ from 12’ 6 in addition to the
synchronized timing of traffic lights would likely slow private
vehicle travel speeds.
§ Private vehicles entering and exiting curbside parking during
peak-time periods in adjacent travel lanes, reduces the
capacity of traffic in adjacent travel lanes.
Transit
Advantages
§ Ability to maintain local bus service similar to current bus
service in addition to light rail.
§ One dedicated lane carrying four-car light rail trains with
450 passengers every ten minutes has seven-and-a-half
times (7.5X) the ridership capacity as conventional bus
service with 60-passenger buses at the same interval.
§ Because dedicated rights-of-way separate light rail vehicles
from other traffic, light rail can operate faster and with
greater schedule reliability than local bus service.
§ Light rail provides user-friendly service that enhances access
throughout the H Street corridor and also to other key
areas in the city.
§ Light rail on a dedicated transit lane is generally perceived
by the public as a more attractive transit mode than
conventional bus service in mixed traffic lanes.
6 Burden, Dan, Building Communi ties With Transpor tation, 2001. pp. 9.
http://www.walkable.org/trbpaper.pdf
STREET SECTION & PLAN
Disadvantages
§ 10’ travel lanes are narrower than the 11’ minimal
considered acceptable for bus turning movements.
§ A 10’ track would require narrower light rail vehicles t
12’ track (less space in light rail vehicles).
§ One dedicated transit lane reduces the frequency
capacity of light rail.
§ A disabled light rail vehicle on a single track could signif
cripple light rail service in the corridor.
§ Average infrastructure construction capital cost per m
light rail is $34.8 million vs. $680,000 to $13.5 millio
bus rapid transit.
§ Light rail vehicle speed is generally slower than that fo
rapid transit.
Pedestrian
Advantages
§ Increase in sidewalk space from 10’ to 12’ provides
pedestrian space on heavily used sidewalks.
§ Full-time parking lanes on street provide a protective
between the pedestrian and moving traffic zones.
§ Permanent curbside parking lanes effectively crea
narrower travel lane zone that must be crossed to reach the
side of the street.
§ Private vehicles entering and leaving curbside parking s
helps slow down private vehicles in adjacent travel lan
§ 10’ travel lanes helps reduce private vehicle driving spmaking for safer pedestrian street crossings.
§ Mid-street light rail station platforms provide pede
refuge islands.
Disadvantages
§ Two travel lanes need to be crossed to reach mid-
light rail station platforms.
Parking
Advantages
§ No parking eliminated within the study area during pe
non-peak times.

7/18/2019 hstpart4
http://slidepdf.com/reader/full/hstpart4 22/45
theHOK PlanningGroup H S T R E E T N E S T R A T E G I C D E V E L O P M E N T P L A N
District of Columbia Office of Planning
Non-Preferred Alternative 4 - Light Rail / One 12’
Track / Four 11’ Travel Lanes / No Parking / 16’
Sidewalks
Vehicular
Advantages
§ Maintain three travel lanes (two traffic and one light rail)
needed to accommodate peak traffic demands.
§ Light rail would play a significant role in reducing vehicular
traffic demands. 11’ travel lanes vs. 10’ travel lanes could
potentially increase traffic capacity by 4%.
Disadvantages
§ Inability to use a third traffic lane as travel/turning lane in the
peak direction during rush periods.
Transit
Advantages
§ Ability to maintain local bus service similar to current bus
service in addition to light rail.
§ One dedicated lane carrying four-car light rail trains with
450 passengers every ten minutes has seven-and-a-half
times (7.5X) the ridership capacity as conventional bus
service with 60-passenger buses at the same interval.
§ Because dedicated rights-of-way separate light rail vehicles
from other traffic, light rail can operate faster and withgreater schedule reliability than local bus service.
§ Light rail provides user-friendly service that enhances access
throughout the H Street corridor and also to other key
areas in the city.
§ Light rail on a dedicated transit lane is generally perceived
by the public as a more attractive transit mode than
conventional bus service in mixed traffic lanes.
Disadvantages
§ One dedicated transit lane reduces the frequency and
capacity of light rail.
§ A disabled light rail vehicle on a single track coul d significantly
cripple light rail service in the corridor.
§ Average infrastructure construction capital cost per mile for
light rail is $34.8 million vs. $680,000 to $13.5 million for
bus rapid transit.§ Light rail vehicle speed is generally slower than that for bus
rapid transit.
Pedestrian
Advantages
§ Increase in sidewalk space from 10’ to 16’ provides
pedestrian space on heavily used sidewalks.
§ Mid-street light rail station platforms provide pede
refuge islands.
Disadvantages
§ Elimination of curbside parking lanes eliminates any
between the sidewalk pedestrian zone and private vehicle tr
travel lanes.
§ Two additional 11’ travel lanes need to be crosse
reach other side of street, increasing the risk of pedes
vehicular conflicts.
§ Two 11’ travel lanes need to be crossed to reach lig
station platforms.
Parking
Advantages
§ Light rail would reduce the vehicular parking deman
the corridor with less private vehicle dependency.
Disadvantages
§ Permanent curbside travel lanes along H Street elim
convenient parking spaces.
STREET SECTION & PLAN

7/18/2019 hstpart4
http://slidepdf.com/reader/full/hstpart4 23/45
theHOK PlanningGroup H S T R E E T N E S T R A T E G I C D E V E L O P M E N T P L A N
District of Columbia Office of Planning
Non-Preferred Alternative 5 - Bus Rapid Transit /
One 10’ Center Lane (rush direction) / Four 10’
Travel Lanes / Two 8’ Full-Time Parking Lanes / 12’
Sidewalks
Vehicular
Advantages
§ Four to five travel lanes along H Street accommodates
heavy traffic volumes during peak and non-peak times.
§ Maintains three travel lanes (two traffic and one bus rapid
transit) to accommodate peak traffic.§ Bus rapid transit would play a significant role in reducing
vehicular traffic demands.
Disadvantages
§ Inability to use a third traffic lane as a travel/turning lane for
private vehicles in the peak direction during rush periods.
§ Narrowing travel lanes to 10’ from 12’ reduces private
vehicle travel speeds.
§ Private vehicles entering and exiting curbside parking during
peak-time periods in adjacent travel lanes reduces the
capacity of traffic in adjacent travel lanes.
Transit
Advantages
§Ability to maintain local bus service similar to current busservice in addition to bus rapid transit.
§ One dedicated lane in the peak direction for bus rapid
transit increases the ridership capacity of transit.
§ Because dedicated rights-of-way separate buses from other
traffic, bus rapid transit can operate faster and with greater
schedule reliability than local bus service.7
§ Use of green light signal prioritization, satellite vehicle
tracking systems, and real-time bus arrival information at
stations, further enhances the schedule reliability of bus
rapid transit.
§ Bus rapid transit provides user-friendly service that improves
access throughout the H Street corridor and also to other
key areas in the city.
§ Costs for bus rapid transit facilities on dedicated lane are
one quarter (1/4) that for facilities using light rail .8
Disadvantages
§ 10’ travel lanes are narrower than the 11’ minimal width
considered acceptable for bus turning movements.
§ 10’ dedicated bus rapid transit lane is narrower than the 11’
minimal width considered acceptable for bus rapid t
vehicles.
§ One dedicated bus lane reduces the frequency and ca
of bus rapid transit.
§ Bus rapid transit vehicles are smaller and have less ca
than light rail vehicles.
Pedestrian
Advantages
§ Increase in sidewalk space from 10’ to 12’ provides
pedestrian space on heavily used sidewalks.§ Full-time parking lanes on street provide a protective
between the pedestrian and moving traffic zones.
§ Permanent curbside parking lanes effectively crea
narrower travel lane zone that must be crossed to reach the
side of the street.
§ Private vehicles entering and leaving curbside parking s
helps slow down private vehicles in adjacent travel lan
§ 10’ travel lanes helps reduce private vehicle driving sp
making for safer pedestrian street crossings.
§ Mid-street bus rapid transit station platforms pr
pedestrian refuge islands.
Parking
Advantages
§ Parking is added within the study area during peak and
peak times.
7 McCormick Rankin International, Bus Rapid Transit, A Creative Solution for So
Today’s Urban Transportation Problems, November 2000. pp. 8-10.8 United States General Accounting Office,Bus Rapid Transit Shows Promise
Washington, DC., 2001. pp. 17.
STREET SECTION & PLAN

7/18/2019 hstpart4
http://slidepdf.com/reader/full/hstpart4 24/45
theHOK PlanningGroup H S T R E E T N E S T R A T E G I C D E V E L O P M E N T P L A N
District of Columbia Office of Planning
Non-Preferred Alternative 6 - Existing with Rush
Hour Parking (Four 10’ Travel Lanes / One 10’ Rush
Hour Lane / Two 8’ Full-Time Parking Lanes / 12’
Sidewalks)
Vehicular
Advantages
§ Four to five traffic lanes available all day to handle heavy
traffic volumes (24,000 per day).
§ Extra travel lanes in the peak direction during rush
periods provide the motorist with three lanes in peakdirection. Two to three travel lanes are needed to handle
this level of traffic with turning movements and frequent
bus activity. H Street carries about 1,600 vehicles per
hour going at about 25 to 30 miles per hour in the peak
direction.
§ Potential growth in H Street and North Capitol Street
Corridors are an even greater argument for maintaining
three traffic lanes in the peak direction during weekday
commuter peak periods.
Disadvantages
§ Narrowing travel lanes to 10’ from 12’ slows private
vehicle travel speeds.
§ Private vehicles entering and exiting curbside parking
during peak time periods in adjacent travel lanes reduces
the capacity of traffic in adjacent travel lanes.
Transit
Advantages
§ Corridor currently well-served by a number of Metrobus
lines, which connect H Street to Union Station,
Downtown, East of the River, and other key activity nodes
and residential areas.
§ Compared with light rail or bus rapid transit, infrastructure
costs for the present system of Metrobuses in mixed-
traffic lanes are small and the vehicles are less expensive
to operate.
§ Some Metrobuses that serve the corridor provide
additional capacity.
§ Fairly frequent service along corridor, with buses coming
between every 5 and 30 minutes.
Disadvantages
§ 10’ travel lanes are narrower than the 11’ minimal
considered acceptable for bus turning movements.
§ Buses operating in mixed t raffic lanes are generally s
and have less schedule reliability than vehicles o
exclusive transit lane.
§ Older bus models with steps at entrance take long
board and disembark than generally low-floor light R
bus rapid transit cars.
Pedestrian
Advantages
§ Increase in sidewalk space from 10’ to 12’ provides
pedestrian space on heavily used sidewalks.
§ Full-time parking lanes on street provide a prote
buffer between the pedestrian and moving tr affic zo
§ Permanent curbside parking lanes effectively crea
narrower travel lane zone that must be crossed to reach the
side of the street.
§ Private vehicles entering and leaving curbside pa
spaces helps slow down private vehicles in adjacent
lanes.
§ 10’ travel lanes helps reduce private vehicle driving sp
making for safer pedestrian street crossings.
Disadvantages
§ An extra travel lane in either direction during
periods creates an additional 10’ of private vehicle
space that a pedestrian needs to cross, increasing r
pedestrian/vehicular conflicts.
§ No mid-street transit platforms to serve as pede
refuge islands.
Parking
Advantages
§ No parking eliminated within the study area during
or non-peak times.
STREET SECTION & PLAN

7/18/2019 hstpart4
http://slidepdf.com/reader/full/hstpart4 25/45
theHOK PlanningGroup H S T R E E T N E S T R A T E G I C D E V E L O P M E N T P L A N
District of Columbia Office of Planning
A P P E N D I X D - “ E C O N O M I C D E V E L O P M E N T I N C E N T I V E S I N O U R N A T I O N ‘ S C A P I T A L “

7/18/2019 hstpart4
http://slidepdf.com/reader/full/hstpart4 26/45
theHOK PlanningGroup H S T R E E T N E S T R A T E G I C D E V E L O P M E N T P L A N
District of Columbia Office of Planning
�
� � � �

7/18/2019 hstpart4
http://slidepdf.com/reader/full/hstpart4 27/45
theHOK PlanningGroup H S T R E E T N E S T R A T E G I C D E V E L O P M E N T P L A N
District of Columbia Office of Planning
�
�
�
�
��

7/18/2019 hstpart4
http://slidepdf.com/reader/full/hstpart4 28/45
theHOK PlanningGroup H S T R E E T N E S T R A T E G I C D E V E L O P M E N T P L A N
District of Columbia Office of Planning
�
�
� � � � �
� �
�

7/18/2019 hstpart4
http://slidepdf.com/reader/full/hstpart4 29/45
theHOK PlanningGroup H S T R E E T N E S T R A T E G I C D E V E L O P M E N T P L A N
District of Columbia Office of Planning
�
�
�
�
�
��
� � � �
�
��
�
� �
�
�
�

7/18/2019 hstpart4
http://slidepdf.com/reader/full/hstpart4 30/45
theHOK PlanningGroup H S T R E E T N E S T R A T E G I C D E V E L O P M E N T P L A N
District of Columbia Office of Planning
�
�
� �
� �
� �

7/18/2019 hstpart4
http://slidepdf.com/reader/full/hstpart4 31/45
theHOK PlanningGroup H S T R E E T N E S T R A T E G I C D E V E L O P M E N T P L A N
District of Columbia Office of Planning
�
�
� � � �
�
�
� �
� � � �
�

7/18/2019 hstpart4
http://slidepdf.com/reader/full/hstpart4 32/45
theHOK PlanningGroup H S T R E E T N E S T R A T E G I C D E V E L O P M E N T P L A N
District of Columbia Office of Planning
�
�
� �
� � � �
�
�
��
� � � �
�

7/18/2019 hstpart4
http://slidepdf.com/reader/full/hstpart4 33/45
theHOK PlanningGroup H S T R E E T N E S T R A T E G I C D E V E L O P M E N T P L A N
District of Columbia Office of Planning
�
� �
�
� �

7/18/2019 hstpart4
http://slidepdf.com/reader/full/hstpart4 34/45
theHOK PlanningGroup H S T R E E T N E S T R A T E G I C D E V E L O P M E N T P L A N
District of Columbia Office of Planning
�
�
�
�
�
�
�
�
� �
� �
�
�
� �

7/18/2019 hstpart4
http://slidepdf.com/reader/full/hstpart4 35/45
theHOK PlanningGroup H S T R E E T N E S T R A T E G I C D E V E L O P M E N T P L A N
District of Columbia Office of Planning
�
�
�
�
�
� �
� �
�
�
�
�
�
� �
� �

7/18/2019 hstpart4
http://slidepdf.com/reader/full/hstpart4 36/45
theHOK PlanningGroup H S T R E E T N E S T R A T E G I C D E V E L O P M E N T P L A N
District of Columbia Office of Planning
�
�
�
� �
� �
� �
�
� � �

7/18/2019 hstpart4
http://slidepdf.com/reader/full/hstpart4 37/45
theHOK PlanningGroup H S T R E E T N E S T R A T E G I C D E V E L O P M E N T P L A N
District of Columbia Office of Planning
�
�
�
� �

7/18/2019 hstpart4
http://slidepdf.com/reader/full/hstpart4 38/45
theHOK PlanningGroup H S T R E E T N E S T R A T E G I C D E V E L O P M E N T P L A N |
District of Columbia Office of Planning
� � � � � � � �
�
� � � �
�
�
� � �
�� ��
�
�
� � � �
�
�
� � � � �
�� �� �
�
�

7/18/2019 hstpart4
http://slidepdf.com/reader/full/hstpart4 39/45
theHOK PlanningGroup H S T R E E T N E S T R A T E G I C D E V E L O P M E N T P L A N |
District of Columbia Office of Planning
�
�
�
� � � �
��

7/18/2019 hstpart4
http://slidepdf.com/reader/full/hstpart4 40/45
theHOK PlanningGroup H S T R E E T N E S T R A T E G I C D E V E L O P M E N T P L A N |
District of Columbia Office of Planning
�
� �
�
� � � �
�

7/18/2019 hstpart4
http://slidepdf.com/reader/full/hstpart4 41/45
theHOK PlanningGroup H S T R E E T N E S T R A T E G I C D E V E L O P M E N T P L A N |
District of Columbia Office of Planning
� �
�
� � � �
�
� �
�
�
�
�
� � � �

7/18/2019 hstpart4
http://slidepdf.com/reader/full/hstpart4 42/45
theHOK PlanningGroup H S T R E E T N E S T R A T E G I C D E V E L O P M E N T P L A N |
District of Columbia Office of Planning
�
�
�
�
�
�
� � � �
� �
�
�
�
�
� � � �

7/18/2019 hstpart4
http://slidepdf.com/reader/full/hstpart4 43/45
theHOK PlanningGroup H S T R E E T N E S T R A T E G I C D E V E L O P M E N T P L A N |
District of Columbia Office of Planning
�
�� �
� � � �
� �
�
�
� � � �

7/18/2019 hstpart4
http://slidepdf.com/reader/full/hstpart4 44/45
theHOK PlanningGroup H S T R E E T N E S T R A T E G I C D E V E L O P M E N T P L A N |
District of Columbia Office of Planning
� �
�
� � � �
� �
�
�
�

7/18/2019 hstpart4
http://slidepdf.com/reader/full/hstpart4 45/45
theHOK PlanningGroup H S T R E E T N E S T R A T E G I C D E V E L O P M E N T P L A N |
District of Columbia Office of Planning
�
� �
�
�
�


