Embed Size (px)
Citation preview
HSUPA Performance in Indoor Locations
Pedro Miguel Cardoso Ferreira
Abstract – This paper presents results of HSUPA
performance tests in a live network and in various
indoor environments. Tests were performed in
locations with different indoor coverage solutions:
indoor locations covered by outdoor sites,
dedicated indoor site, optical repeater and RF
repeater.
Keywords – HSUPA, indoor, real live
performance, throughput.
I. Introduction
This paper collects the results of several tests were
data transfers were performed using UMTS
HSUPA feature. HSUPA also known as Enhanced
Uplink was defined by 3GPP [1] in Release 6 with
the goal of improving UMTS uplink data transfers
in a somewhat similar way HSDPA did for
downlink. The main innovations which came with
HSUPA were: fast Node B based scheduling, fast
physical layer HARQ and optional 2ms TTI. These
features together with the possibility of using SF2
it will allow in the near future peak data rates of
5.76MBps[2]. The tests were performed in four
different indoor locations, each one with different
characteristics and different solutions for indoor
coverage. In the first test scenario the indoor
coverage was provided by the outdoor network
whereas in the rest a dedicated indoor system was
present. The second test scenario was in a location
with a dedicated indoor site, the third in an indoor
location with an optical repeater and finally the
fourth test scenario was located in a building with
a RF repeater. From those tests a number of
different metrics were collected to evaluate the
performance of the data transfer, namely:
Throughput [kbps], Ec [dBm], Ec/I0 [dB] and
Noise Rise [dB].
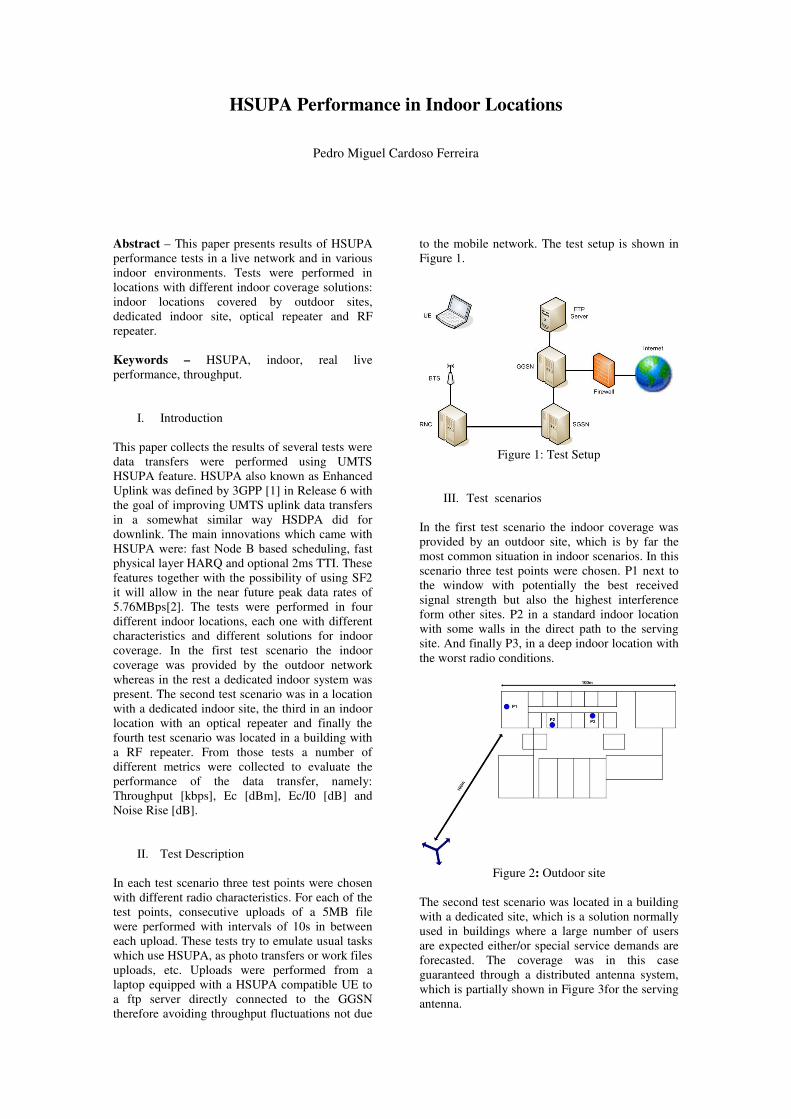
II. Test Description
In each test scenario three test points were chosen
with different radio characteristics. For each of the
test points, consecutive uploads of a 5MB file
were performed with intervals of 10s in between
each upload. These tests try to emulate usual tasks
which use HSUPA, as photo transfers or work files
uploads, etc. Uploads were performed from a
laptop equipped with a HSUPA compatible UE to
a ftp server directly connected to the GGSN
therefore avoiding throughput fluctuations not due
to the mobile network. The test setup is shown in
Figure 1.
Figure 1: Test Setup
III. Test scenarios
In the first test scenario the indoor coverage was
provided by an outdoor site, which is by far the
most common situation in indoor scenarios. In this
scenario three test points were chosen. P1 next to
the window with potentially the best received
signal strength but also the highest interference
form other sites. P2 in a standard indoor location
with some walls in the direct path to the serving
site. And finally P3, in a deep indoor location with
the worst radio conditions.
Figure 2: Outdoor site
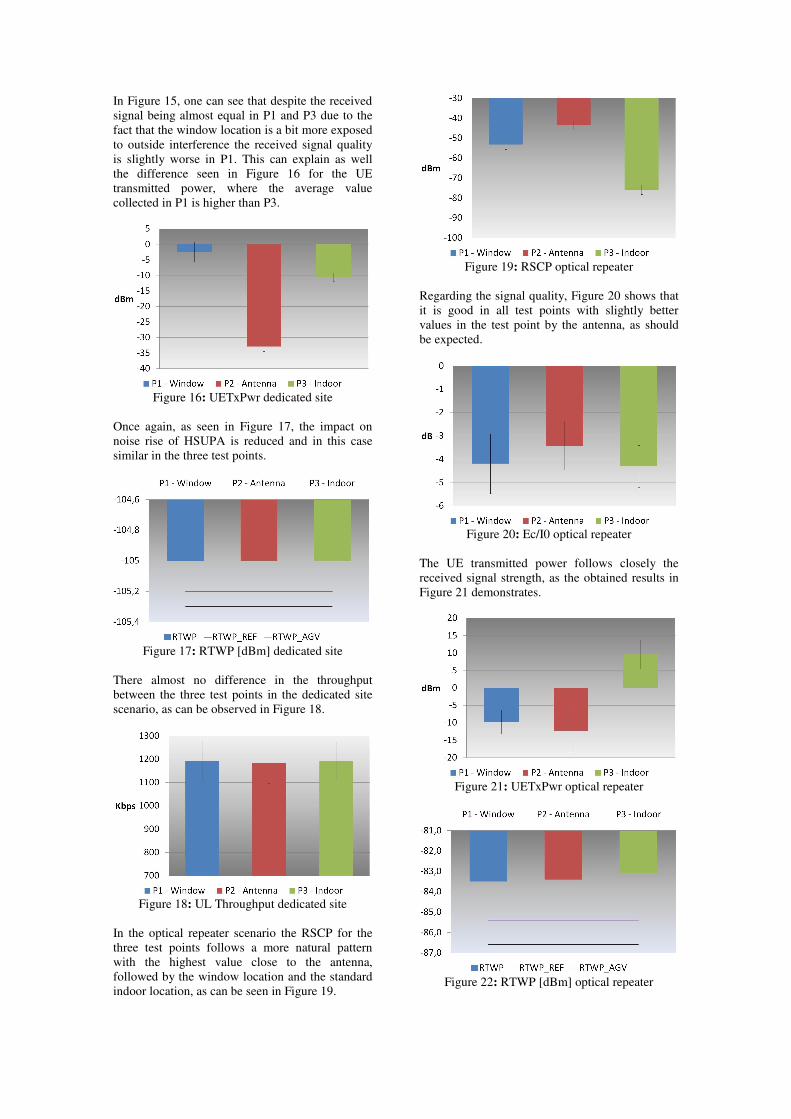
The second test scenario was located in a building
with a dedicated site, which is a solution normally
used in buildings where a large number of users
are expected either/or special service demands are
forecasted. The coverage was in this case
guaranteed through a distributed antenna system,
which is partially shown in Figure 3for the serving
antenna.
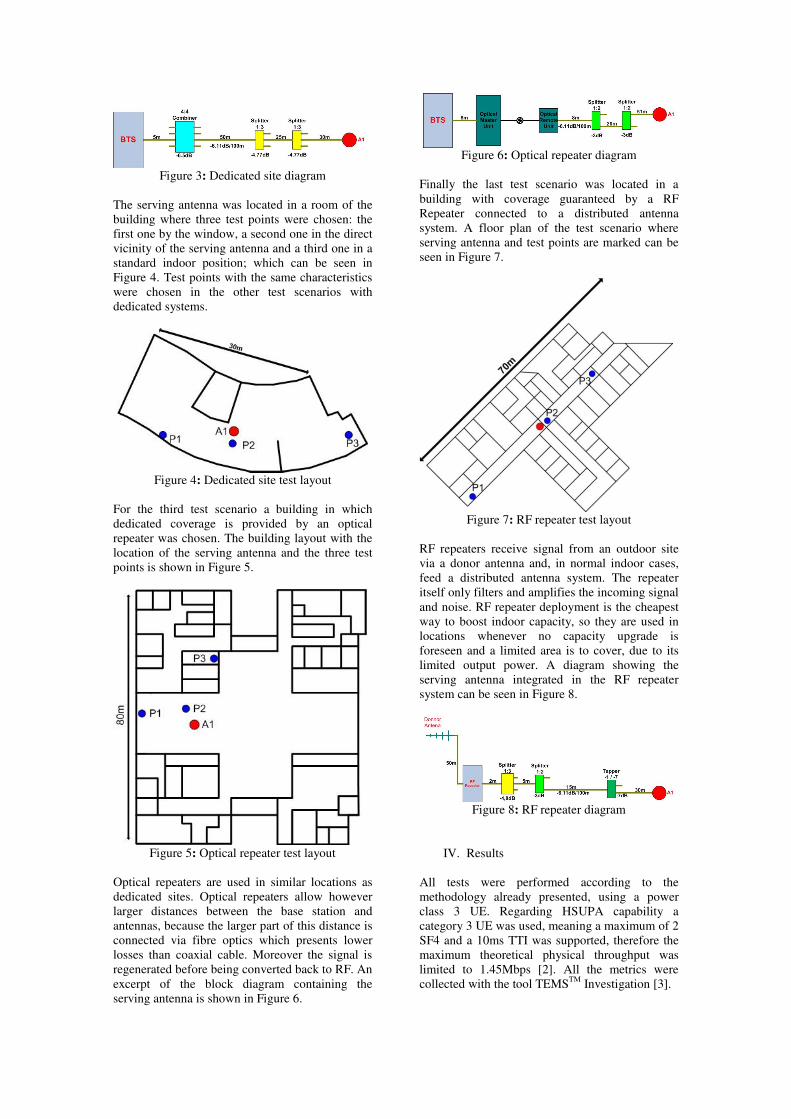
Figure 3: Dedicated site diagram
The serving antenna was located in a room of the
building where three test points were chosen: the
first one by the window, a second one in the direct
vicinity of the serving antenna and a third one in a
standard indoor position; which can be seen in
Figure 4. Test points with the same characteristics
were chosen in the other test scenarios with
dedicated systems.
Figure 4: Dedicated site test layout
For the third test scenario a building in which
dedicated coverage is provided by an optical
repeater was chosen. The building layout with the
location of the serving antenna and the three test
points is shown in Figure 5.
Figure 5: Optical repeater test layout
Optical repeaters are used in similar locations as
dedicated sites. Optical repeaters allow however
larger distances between the base station and
antennas, because the larger part of this distance is
connected via fibre optics which presents lower
losses than coaxial cable. Moreover the signal is
regenerated before being converted back to RF. An
excerpt of the block diagram containing the
serving antenna is shown in Figure 6.
Figure 6: Optical repeater diagram
Finally the last test scenario was located in a
building with coverage guaranteed by a RF
Repeater connected to a distributed antenna
system. A floor plan of the test scenario where
serving antenna and test points are marked can be
seen in Figure 7.
Figure 7: RF repeater test layout
RF repeaters receive signal from an outdoor site
via a donor antenna and, in normal indoor cases,
feed a distributed antenna system. The repeater
itself only filters and amplifies the incoming signal
and noise. RF repeater deployment is the cheapest
way to boost indoor capacity, so they are used in
locations whenever no capacity upgrade is
foreseen and a limited area is to cover, due to its
limited output power. A diagram showing the
serving antenna integrated in the RF repeater
system can be seen in Figure 8.
Figure 8: RF repeater diagram
IV. Results
All tests were performed according to the
methodology already presented, using a power
class 3 UE. Regarding HSUPA capability a
category 3 UE was used, meaning a maximum of 2
SF4 and a 10ms TTI was supported, therefore the
maximum theoretical physical throughput was
limited to 1.45Mbps [2]. All the metrics were
collected with the tool TEMSTM
Investigation [3].

In the test scenario where the indoor coverage was
provided by an outdoor site one can see in Figure 9
that, as expected, the average received signal
strength decreases as we move indoor.
Figure 9: RSCP outdoor site
Nevertheless this reduction as little impact on the
signal quality as can be seen in Figure 10, only test
point 3 shows a small degradation.
Figure 10: Ec/I0 outdoor site
The UE transmitted power increase is, as expected,
proportional to the received signal strength
decrease, as can be seen in Figure 11.
Figure 11: UETxPwr outdoor site
Regarding the noise rise due to the tests, Figure 12
shows that its value is small. It varies between
0.3dB and 0.8dB in test points 2 and 3
respectively. However the difference towards the
average RTWP is smaller or even inexistent in P2.
This RTWP_AVG values was calculated based on
hours adjacent to the ones the tests were performed
when mostly R99 services were carried by the
network.
Figure 12: RTWP [dBm] outdoor site
Finally in Figure 13 one can observe that despite
the previous differences in some collected
statistics the uplink application throughput was
practically constant in all test points.
Figure 13: UL Throughput outdoor site
For the dedicated site scenario the received signal
strength was as foreseen, stronger on the antenna
test point and almost equal in the other two points.
Figure 14 presents the collected values.
Figure 14: RSCP dedicated site
Figure 15: Ec/I0 dedicated site
In Figure 15, one can see that despite the received
signal being almost equal in P1 and P3 due to the
fact that the window location is a bit more exposed
to outside interference the received signal quality
is slightly worse in P1. This can explain as well
the difference seen in Figure 16 for the UE
transmitted power, where the average value
collected in P1 is higher than P3.
Figure 16: UETxPwr dedicated site
Once again, as seen in Figure 17, the impact on
noise rise of HSUPA is reduced and in this case
similar in the three test points.
Figure 17: RTWP [dBm] dedicated site
There almost no difference in the throughput
between the three test points in the dedicated site
scenario, as can be observed in Figure 18.
Figure 18: UL Throughput dedicated site
In the optical repeater scenario the RSCP for the
three test points follows a more natural pattern
with the highest value close to the antenna,
followed by the window location and the standard
indoor location, as can be seen in Figure 19.
Figure 19: RSCP optical repeater
Regarding the signal quality, Figure 20 shows that
it is good in all test points with slightly better
values in the test point by the antenna, as should
be expected.
Figure 20: Ec/I0 optical repeater
The UE transmitted power follows closely the
received signal strength, as the obtained results in
Figure 21 demonstrates.
Figure 21: UETxPwr optical repeater
Figure 22: RTWP [dBm] optical repeater
Figure 22 shows that noise rise is in this scenario
much higher than in previous ones, reaching
values around 3dB. Nevertheless, differences
between the three test points remain small.
Figure 23: UL Throughput optical repeater
Albeit the differences in noise rise, one can see in
Figure 23 that the uplink application throughput
values remain high. In this case P3 shows a small
but noticeable worse value than the other points.
The RSCP in the RF repeater scenario is shown in
Figure 24. The values follow what should be
expected according to the test locations.
Figure 24: RSCP RF repeater
This is not the case for the Ec/I0, seen in Figure
25, where the window location strangely presents
the best values. A possible explanation is a
coherent combination of the signal from the indoor
antenna and the repeated outdoor site at this point.
Figure 25: Ec/I0 RF repeater
Again there is in this case a match between the
RSCP and the UE transmitted power, which can be
observed in Figure 26.
Figure 26: UETxPwr RF repeater
Regarding the noise rise, Figure 27 shows that also
in this scenario the tests caused a bigger impact
than in the solutions with no repeaters. Although
in this case the value is about 1dB which is
significantly less than in the optical repeater
scenario. Once again the difference between test
points is barely visible.
Figure 27: RTWP [dBm] RF repeater
Once again Figure 28 shows very good and even
results in terms of throughput in all test points.
Figure 28: UL Throughput RF repeater
In Figure 29, one can observe the average radio
conditions and standard deviations values in which
the tests were performed, for the four scenarios.
The presented values sum up the results from the
three test points in each scenario. As can be seen
the scenarios with indoor dedicated coverage
systems present, as expect, higher received signal
strength than the case where indoor is covered by
an outdoor site. Conversely, the signal quality
shows higher values for the outdoor scenario than
the dedicated systems scenarios.

Figure 29: Radio conditions Ec vs Ec/I0
The average UE transmitted power and standard
deviation values are shown in Figure 30. The
achieved results follow closely the ones from the
received signal strength, with the exception of the
optical repeater. This scenario despite the fact of
presenting the highest RSCP shows a higher UE
transmitted power value. This should be caused by
the attenuator used to reduce the downlink signal
due to the input power limitations of the optical
system, which also attenuates the uplink signal.
Figure 30: UE transmitted power
Rise over thermal average values for the four test
scenarios are presented in Figure 31, showing a
significant difference between the solutions with
and without repeaters. The dedicated site and
outdoor site scenarios presented small noise rise
values during the tests, therefore is expectable that
a large number of users might use HSUPA
simultaneously in the cell. The tests impact in the
noise rise is much more visible in the repeater
scenarios, especially in the optical repeater. This
behaviour might put a more strict limitation on the
number of HSUPA users allowed in these cases.
Figure 31: Rise over thermal
Despite the differences in the radio conditions on
the several scenarios the achieved uplink
throughput values are quite good for all of them, as
seen in Figure 32. This results are also possible
because the UE is capable of compensate the worst
radio conditions with extra power. Despite the
values being all good there are slight differences
that are inversely proportional to the noise rise
values.
Figure 32: Uplink throughput
V. Conclusions
From the results collected in the conducted tests
one can conclude that HSUPA is a major
improvement in the uplink data transfer
performance. These results were nevertheless
achieved in good radio conditions and low load.
Moreover, the tests were performed with HSUPA
limited to 2 SF4 and 10ms. There is also no
significant difference in uplink throughput
between the different indoor coverage solutions.
However indoor coverage solutions based on
repeaters present a higher noise rise due to
HSUPA which can be an important limitation to
the cell capacity.
REFERENCES
[1] http://www.3gpp.org/specifications
[2] Holma,H. and Toskala,A., HSDPA/HSUPA
For UMTS, High Speed Radio Access forMobile
Communications, John Wiley & Sons, UK, 2006.
[3]http://www.ericsson.com/solutions/tems/index.s
html


![[Job training] hsdpa+hsupa](https://img.pdfslide.net/doc/110x75/58e7b4ac1a28abbb4e8b5297/job-training-hsdpahsupa.jpg)