Embed Size (px)
Citation preview

HTGR Technology Course for the Nuclear R l t C i i Regulatory Commission
May 24 – 27, 2010ay , 0 0
Module 6bPebble Bed HTGR Nuclear Design
Pieter VenterPebble Bed Modular Reactor (Pty) Ltd.
1Slide 1

Outline
• Pebble bed nuclear design characteristicsPebble bed nuclear design characteristics• Nuclear design considerations• Analytical toolsy
2Slide 2
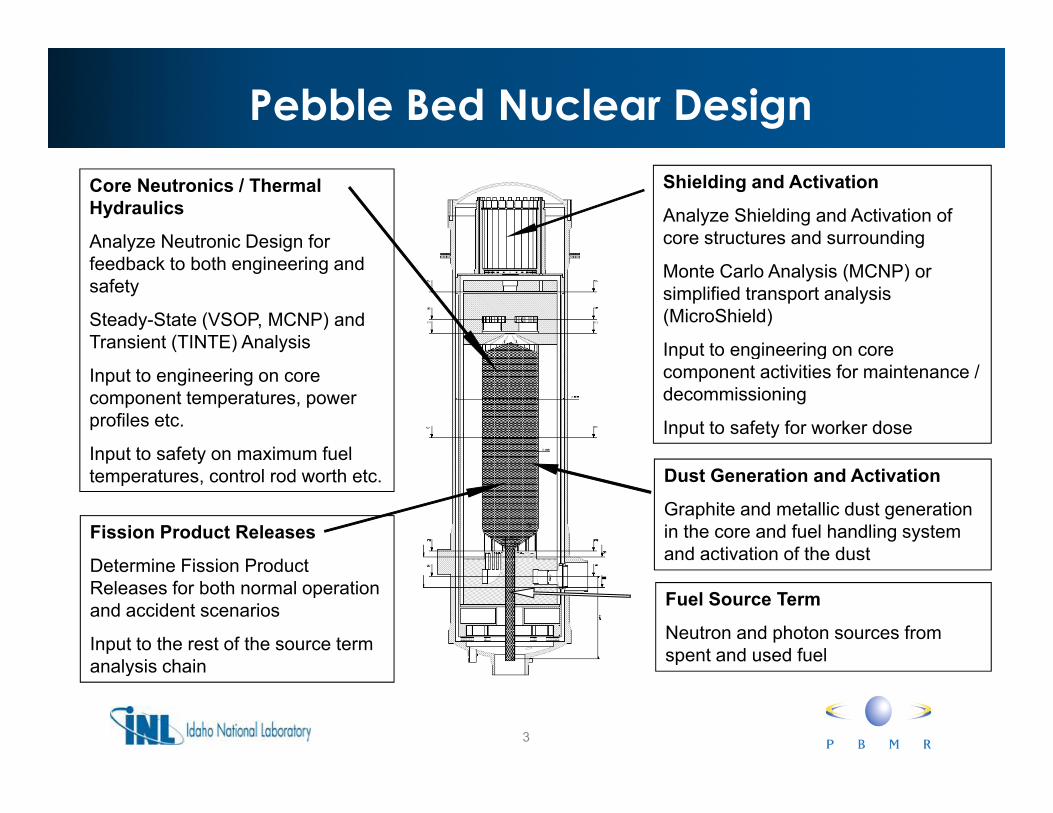
Pebble Bed Nuclear DesignCore Neutronics / Thermal Hydraulics
Analyze Neutronic Design for
Shielding and Activation
Analyze Shielding and Activation of core structures and surrounding
feedback to both engineering and safety
Steady-State (VSOP, MCNP) and Transient (TINTE) Analysis
Monte Carlo Analysis (MCNP) or simplified transport analysis (MicroShield)
Input to engineering on coreInput to engineering on core component temperatures, power profiles etc.
Input to safety on maximum fuel
Input to engineering on core component activities for maintenance / decommissioning
Input to safety for worker doseInput to safety on maximum fuel temperatures, control rod worth etc.
Fission Product Releases
D t i Fi i P d t
Dust Generation and Activation
Graphite and metallic dust generation in the core and fuel handling system and activation of the dustDetermine Fission Product
Releases for both normal operation and accident scenarios
Input to the rest of the source term analysis chain
Fuel Source Term
Neutron and photon sources from spent and used fuel
3Slide 3
analysis chain p

Key Pebble Bed Nuclear Characteristics
• Continuous fueling provides core design Continuous fueling provides core design flexibility to introduce different fuel cycles on-line
• Burnup measurement of each sphere instead of calculations reduces core design uncertaintyuncertainty
• No reload analyses are required and approach to criticality is only required for approach to criticality is only required for initial core loading or after reflector replacement is performed
4Slide 4

Fuel Cycle Flexibility
• Pebble bed can also be used for U-Th, Pu Pebble bed can also be used for U Th, Pu disposition and MOX
• AVR experience demonstrated core operation with between 4 and 14 different fuel elements
Heavy metal loadings ranging from 5g to 20g– Heavy metal loadings ranging from 5g to 20g– Enrichments ranging from 5% to 93% U-235
• Different fuel cycle can be introduced on-line • Different fuel cycle can be introduced on-line and the reactivity effect can be monitored continuously during the transition period
5Slide 5

Outline
• Pebble bed nuclear design characteristicsPebble bed nuclear design characteristics• Nuclear design considerations• Analytical toolsy
6Slide 6
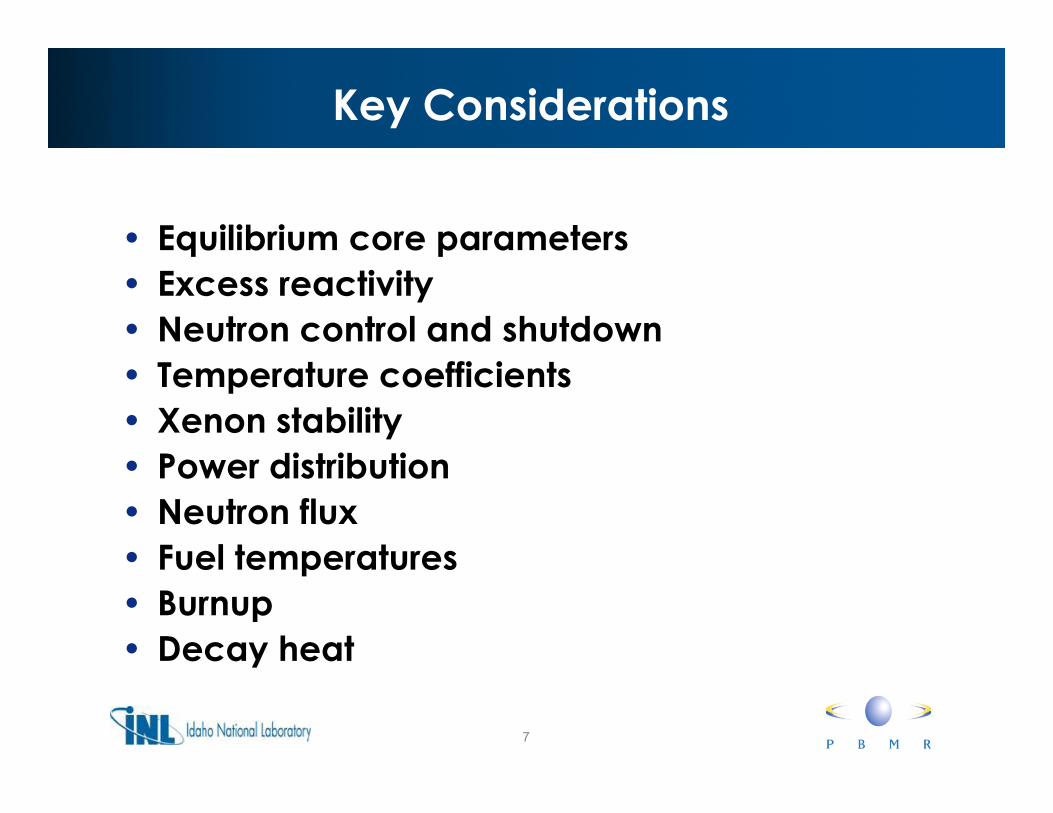
Key Considerations
• Equilibrium core parametersq p• Excess reactivity• Neutron control and shutdown• Temperature coefficients• Xenon stability
P di t ib ti• Power distribution• Neutron flux• Fuel temperatures• Fuel temperatures• Burnup• Decay heat
7Slide 7
y

Typical Equilibrium Core Parameters
Description Units PBMR-400MW
PBMR-250MW
Thermal power MW 400 250
Core diameter (inner/outer) m 2.0/3.7 1.5
Core height (average) M 11.0 10.5
Helium coolant temperatures (Inlet/Outlet) °C 500/900 250/750Helium coolant temperatures (Inlet/Outlet) C 500/900 250/750
U-235 enrichment wt% 9.6 7.8
Number of average fuel sphere cycles 6 15
Average residence time in core Days ~ 930 ~ 1080
Average discharge burn-up MWd/t 91 450 81 565
Number of Fuel Spheres (FS) ~ 452 000 ~ 400 300p ( )
Average number of fresh fuel spheres to be loaded per day ~ 486 ~ 438
Average number of fuel spheres recirculated per day ~ 2 913 ~ 6 566
8Slide 8

Load Following RequirementXenon Reactivity Effect Due To Power Changes
1.50
180
200
Cylindrical 250MW 700°C
0.50
1.00
ct o
f Xen
on
k]
120
140
160
of T
otal
]
Cylindrical, 250MW, 700 C
-0.50
0.000 20 40 60 80 100 120
eact
ivity
Effe
[%Δ
k
60
80
100
Pow
er [%
o
-1.50
-1.00
Time [h]
Re
0
20
40%ΔkPower
• Changes in reactor power causes Xe changes in core that affects the reactivity
• This lowering of reactivity following a power change needs to be compensated for by adding excess reactivity
Time [h]
9Slide 9
compensated for by adding excess reactivity

Excess Reactivity• The excess reactivity is the additional reactivity
available in the core during operating conditions by the loading of a fuel mixture that is more reactive (less the loading of a fuel mixture that is more reactive (less burned) than what is required to keep the reactor critical at the full power operational conditions (temperatures and equilibrium fission products)(temperatures and equilibrium fission products)
• The excess reactivity is balanced by the insertion of the control rods to keep the reactor critical
• The excess reactivity can be changed by changing • The excess reactivity can be changed by changing the position of the control rods and the adjusting loading of fresh fuel into the core
10Slide 10

Neutron Control and Instrumentation Requirements
• Provide two independent and diverse Provide two independent and diverse systems of reactivity control for reactor shutdown
• Each system shall be capable of maintaining hot subcriticalityO t h ll b bl f i t i i • One system shall be capable of maintaining cold shutdown
• Provide neutron flux (low intermediate and • Provide neutron flux (low, intermediate and high range) and axial profile measurements
11Slide 11

Typical Pebble Bed Neutron Control Systems
• Control rods are used for operational (ROT) control and hot shutdown
• Small absorber spheres Small absorber spheres (SAS) are used to achieve cold shutdown
• Control rods and SAS
Control Rod
• Control rods and SAS are located in reflectors (SR/SR or SR/CR)
SAS Channel
• Control rods can be operated in banks SAS
Extraction Point
12Slide 12

Reactor Shutdown with Control Rods
Annular 400MW 900°CAnnular, 400MW, 900 C
• Rapid shutdown of reactor for two different control rod speeds• 1 cm/s is the normal controlled insertion
13Slide 13
1 cm/s is the normal controlled insertion• 50 cm/s is the scram speed when the power is cut to the CRDMs

Shutdown by Interruption of Coolant Flow
Annular, 400MW, 900°C
• When the coolant flow is stopped through the core, the sphere temperatures increase and the reactor is shutdown, even with no movement of the control rods
i ffi i ff f i
14Slide 14
• This temperature coefficient effect has been successfully demonstrated in the AVR and HTR-10

Temperature Coefficients
Temperature Coefficients Unit At Operating Conditions
Annular, 400MW, 900°C
Fuel (Doppler coefficient of mainly 238U) Δρ/°C - 4.4 x10⁻⁵
Moderator Δρ/°C - 1.0 x10⁻⁵
Reflector regions (all together) Δρ/°C + 1.8 x10⁻⁵
• The Doppler temperature coefficient acts promptly and stabilizes the nuclear chain ti
g ( g ) ρ
TOTAL Δρ/°C - 3.6 x10⁻⁵
reaction.
• The moderator coefficient acts promptly when temperature change of the moderator is the primary event, and causes a response in the neutron flux and fission rate.
• The reflector temperature changes are not so strongly coupled to power changes in the fuel. The side reflector temperature is dominated by the coolant temperature in the riser channel and combined with the large heat capacity will cause a considerable delay of effect of the reflector temperature coefficient.
15Slide 15

Xenon Stability
• Xenon stability refer to the degree to which the spatial flux distribution varies for a specific reactor design due to distribution varies for a specific reactor design due to spatial xenon dynamics
• The main question is whether the change in xenon q gconcentration with time exhibits a damped or un-damped oscillatory behavior
• Previous studies on HTGR specific xenon stability reported • Previous studies on HTGR-specific xenon stability reported the following conclusions:– Un-damped axial xenon oscillations only occurred for HTR
cores when the core height was increased to larger than 8 m, with a simultaneous power density increase to more than 20 with a simultaneous power density increase to more than 20 MW/m3
– No un-damped radial xenon oscillations were observed for cylindrical cores of up to 6.4 m in radius
16Slide 16
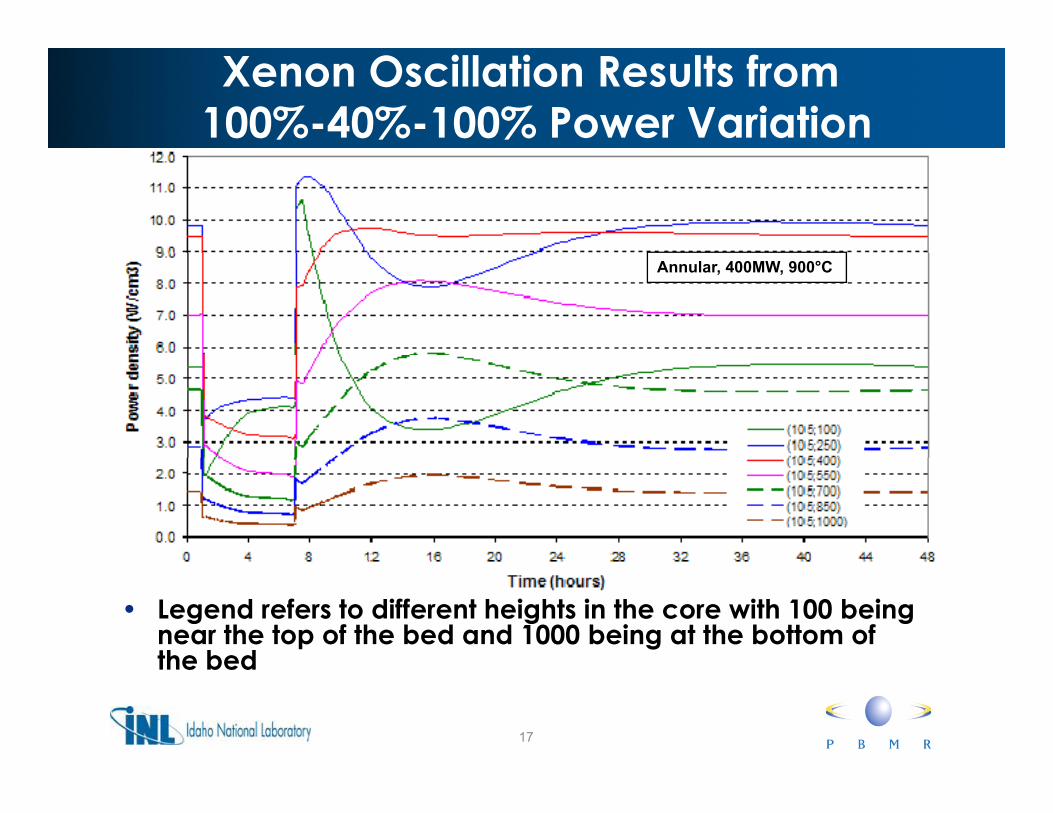
Xenon Oscillation Results from100%-40%-100% Power Variation
Annular, 400MW, 900°C
• Legend refers to different heights in the core with 100 being near the top of the bed and 1000 being at the bottom of the bed
17Slide 17
the bed
Power Shaping
• Pebble beds do not have to use fuel loading Pebble beds do not have to use fuel loading or burnable poison to affect power shaping
• Fuel can be circulated faster through the core to flatten the axial power profile
• Once equilibrium conditions are established t l d d t d t b d t control rods do not need to be moved to
compensate for burnup
18Slide 18

Axial Power Distribution• The power profile is biased
towards the top of the core due to the lower fuel temperatures and fresh fuel
Axial Power Distribution
0Cylindrical, 250MW, 700°C
temperatures and fresh fuel• The top of the power profile is
depressed due to the partially inserted control rods
• Since no burnable poisons
200
400[cm
]
Since no burnable poisons are used with on-line refueling, this power profile is representative of the greater part of plant operation
400
600
ght (
From
Top
) [
Note: channels are not physical but represent sphere flow regions for modeling with
800
1000
Axi
al H
eig
Channel 1Channel 2Channel 3 g g
channel 1 towards the centre of the core and channel 5 towards the outside of the core
1000
12000 0.5 1 1.5 2
Channel 4Channel 5
19Slide 19
Relative Power Density

Power Distribution per Pass
• The power produced
Power Per Pass for Channel 1 (Center of Core)
0Cylindrical, 250MW, 700°C p p
per fuel sphere reduces with each pass through the core
0
200
cm]
400
600
t (fr
om T
op) [
c
800
1000
Axia
l Hei
ght
Pass 1Pass 5
1000
12000 0.5 1 1.5 2
Pass 10Pass 15
20Slide 20
Power Per Pebble [kW]

Neutron Flux Distribution (Radial)Radial Flux Profile
1.6E+14CORE SIDE REFLECTOR
Cylindrical, 250MW, 700°C
1.2E+14
1.4E+14
] > 0 1 MeV
CORE SIDE REFLECTOR
8E+13
1E+14
x [n
cm
-2 s
-1 > 0.1 MeV0.1 MeV - 0.009 MeV0.009 MeV - 130 eV130 eV - 1.86 eV< 1 86 eV
2E 13
4E+13
6E+13
Flux
< 1.86 eV
0
2E+13
0 50 100 150 200 250 300
R di l Di t (f t ) [ ]
21Slide 21
Radial Distance (from center) [cm]

Neutron Flux Distribution (Axial)Axial Flux Profile (Center of Core)
1.6E+14 CORETOP REFLECTOR
BOTTOM REFLECTOR
Cylindrical, 250MW, 700°C
1.2E+14
1.4E+14
> 0.1 MeV
REFLECTOR REFLECTOR
8E+13
1E+14
x [n
cm
-2 s
-1]
0.1 MeV0.1 MeV - 0.009 MeV0.009 MeV - 130 eV130 eV - 1.86 eV< 1.86 eV
4E+13
6E+13Flux
0
2E+13
0 200 400 600 800 1000 1200 1400 1600 1800
22Slide 22
Axial Distance (from top) [cm]

Temperature Distribution for Equilibrium Core
Axial Fuel Temperature Distribution
0Cylindrical, 250MW, 700°C
0
200
[cm
]
400
600
ght (
from
top)
800
1000
Axi
al H
eig Core Center
Between Core Center and Side Reflector
Near Side Reflector
1200200 300 400 500 600 700 800 900 1000
Average Fuel Temperature [°C]
23Slide 23

Fuel Temperature DistributionTemperature Distribution
18Average Pebble Surface Temperature
Cylindrical, 250MW, 700°C
14
16 Average Fuel (UO2)Temperature(Doppler)
8
10
12
age
of S
pher
es
4
6
8
Perc
enta
0
2
24Slide 24
295 341 387 433 479 525 571 617 663 709 755 801 847 893 939
Temperature [°C]

Burnup• Fuel spheres are circulated through the core continuously and
each sphere is measured for burnup as it comes out of the core
• Fuel spheres that have not yet reached target burn-up, or more specifically the burnup limit setpoint, can be reloaded and recycled continuously during normal reactor operation.
• Fuel spheres with higher burn-up as the setpoint are discharged from the refueling line, and replaced with a fresh fuel sphere. In practice some fuel may pass through the reactor less than the practice some fuel may pass through the reactor less than the average number of passes while others may pass more times before reaching the setpoint burnup value.
The Burnup Measurement System discriminates between spent • The Burnup Measurement System discriminates between spent and used fuel spheres by analyzing the gamma energy spectrum to determine the inventory of specific nuclides (specifically Cs-137).
25Slide 25

Decay Heat• German standard DIN is used to evaluate decay heat• The standard provide the methodology to calculate the heat power
generated by the decay of the fission products (valid for all kinds of thermal reactors) and rules concerning the additional sources of ) gdecay heat (activation) in the fuel of pebble-bed high temperature reactors
7
Cylindrical, 250MW, 700°C
4
5
6
of P
ower
]
2
3
4
Dec
ay H
eat [
% o
0
1
0 00001 0 0001 0 001 0 01 0 1 1 10 100 1000 10000 100000 1000000
26Slide 26
0.00001 0.0001 0.001 0.01 0.1 1 10 100 1000 10000 100000 1000000Time [h]
Outline
• Pebble bed nuclear design characteristicsPebble bed nuclear design characteristics• Nuclear design considerations• Analytical toolsy
27Slide 27
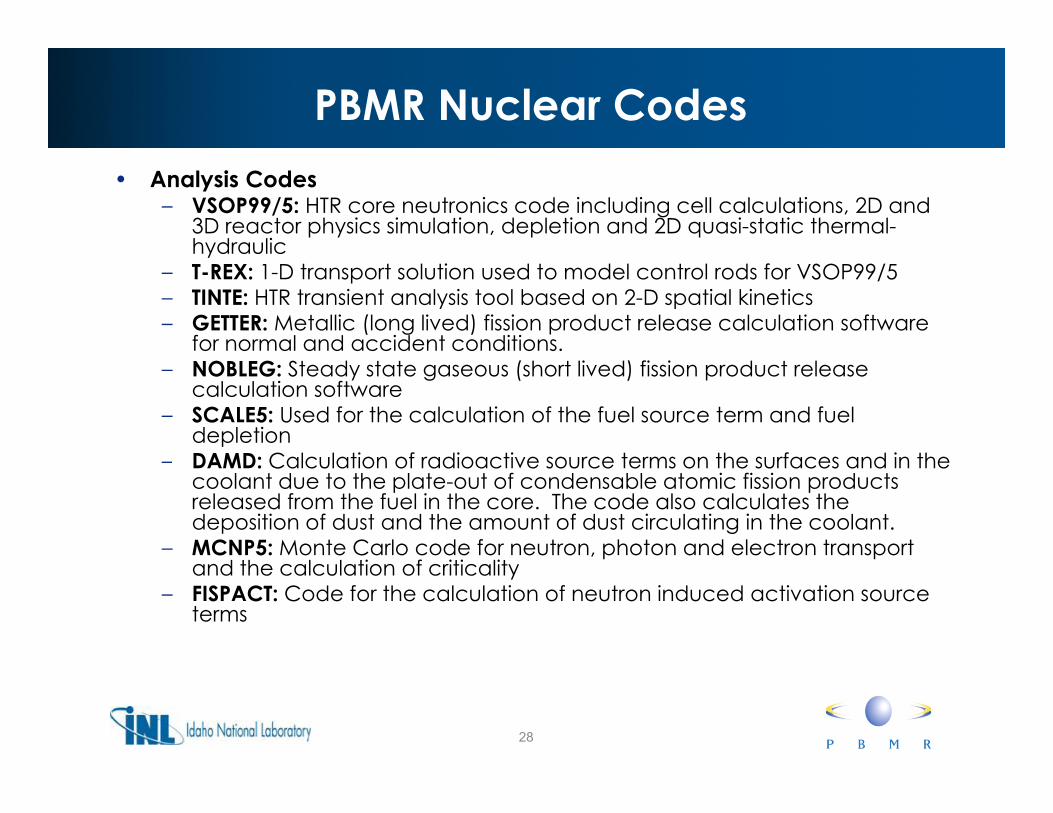
PBMR Nuclear Codes• Analysis Codes
– VSOP99/5: HTR core neutronics code including cell calculations, 2D and 3D reactor physics simulation, depletion and 2D quasi-static thermal-hydraulichydraulic
– T-REX: 1-D transport solution used to model control rods for VSOP99/5– TINTE: HTR transient analysis tool based on 2-D spatial kinetics– GETTER: Metallic (long lived) fission product release calculation software
for normal and accident conditions.– NOBLEG: Steady state gaseous (short lived) fission product release
calculation software– SCALE5: Used for the calculation of the fuel source term and fuel
depletionDAMD: Calculation of radioactive source terms on the surfaces and in the – DAMD: Calculation of radioactive source terms on the surfaces and in the coolant due to the plate-out of condensable atomic fission products released from the fuel in the core. The code also calculates the deposition of dust and the amount of dust circulating in the coolant.
– MCNP5: Monte Carlo code for neutron, photon and electron transport d th l l ti f iti litand the calculation of criticality
– FISPACT: Code for the calculation of neutron induced activation source terms
28Slide 28

Summary• The nuclear design of a pebble bed reactor is
simple and straightforwardsimple and straightforward• The on-line refueling provides significant
flexibility to the core designer to choose a fuel y gcycle whilst reducing uncertainty in the core calculations
i• The core designer has well proven and validated nuclear design codes at his disposal to calculate the core behavior and to calculate the core behavior and characteristics
29Slide 29

Suggested Reading• PBMR Nuclear Design and Safety Analysis: An Overview, Stoker, C.C.,
PHYSOR 2006, Vancouver, BC, Canada, September 10-14. • Plutonium Disposition in the PBMR-400 HTGR, E. Mulder, PHYSOR 2004,
A il 2004April 2004• The Pebble Bed Modular Reactor Layout and Neutronics Design of the
Equilibrium Cycle, Reitsma, F., Proceedings of PHYSOR2004 Meeting, Chicago, USA, April 25-29, 2004.
• An Overview of the FZJ Tools for HTR Core Design and Reactor • An Overview of the FZJ-Tools for HTR Core Design and Reactor Dynamics, the Past, Present and Future, Reitsma, F., Rütten, H. J. and Scherer, W., Mathematics and Computation, Supercomputing, Reactor Physics and Nuclear and Biological Applications, Palais des Papes, Avignon, France, September 12-15, 2006
• Comparison of VSOP and MCNP Results of PBMR Equilibrium Core Model, Sen, S., Albornoz, F., and Reitsma, F., Proceedings of the 3rd International Topical Meeting on High Temperature Reactor Technology, Johannesburg, Gauteng, South Africa, 2006
• The Re evaluation of the AVR Melt Wire Experiment Using Modern • The Re-evaluation of the AVR Melt-Wire Experiment Using Modern Methods with Specific Focus on Bounding the Bypass Flow Effects, Viljoen, C. F., et al Proceedings of the 4th International Topical Meeting on High Temperature Reactor Technology, HTR-2008, Washington DC, USA, 2008
30Slide 30

![(HTGR) [330-MW(e)]€¦ · HTGRAPPLICATIONFORSHALEOILRECOVERY R.N. QuadeandR.Rao GATechnologiesInc. P.0.Box85608 SanDiego,CA 92138 ABSTRACT TheHigh-TemperatureGas-CooledReactor(HTGR](https://img.pdfslide.net/doc/110x75/5ead7d43e997f37a39150759/htgr-330-mwe-htgrapplicationforshaleoilrecovery-rn-gatechnologiesinc-p0box85608.jpg)