Embed Size (px)
Citation preview

HUAHIN CONDOMINIUM MARKET REPORT 1H 2016
RESIDENTIAL RESEARCH

2
FIGURE 1
Accumulated Supply 2007-1H 2016
HIGHLIGHTS
RISINEE SARIKAPUTRADirector, Research and Consultancy
“ The average new unit
sold each year in Hua-hin
was approximately 2,600
units with the remaining of
5,200 units now, it will
probably take a few
more years to clear the
stock. ”
Market Overview
In mid-2016, the Hua-hin condominium
market is recovering from the stagnancy
earlier in the year. The market shows a
slightly increasing absorption rate and the
highlight of the first half of this year was to
release the remaining stock from the last
year. Demand for Hua-hin condominiums
is quite stable now, not massive as a
few years ago. New supply is likely to be
limited all through this year. There were
only two new projects launched in the
first half of 2016; both are located in the
Cha-am area. Also, two projects have
been halted due to financial problems
and political uncertainties, as their main
clients are foreigners. From a market
survey, we found that some projects with
units previously rented out as hotel rooms
on a daily rate have either decreased the
number of such units or have destined
the units for sale. This is in response to
negative media attention and the crack
down of authorities on such developers.
Regarding the potential growth of the
area, Hua-hin is ever changing, compared
to other areas. We have seen lots of
•Onlythreenewprojectswerelaunched in the first half of 2016; Two projects are located in Cha-am and one projects is located on the mountain side.
• Thenumberofprojectsde-creased, obviously implying that the developers decided to wait and see the absorption of remaining stock.
• Duetopromotionsfromthedevelopers and limited new supply, the overall take-up rate rose from 74 percent at the end of 2015 to 78 percent in 2Q 2016.
• Buyingtorenttrendisdecreasingcontinuously. Most buyers this year purchased based on real demand for second weekend homes.
•Weforecastthatthenewsupplyin the second half will be lower than the first half and mainly from listed developers. Until 2017 we might see various developers jumping into the market and we expect to see higher numbers of new projects, compared to this year. The anticipated new supply should be around 3,000 units for the upcoming year.
economic activities, with many hip
restaurants and ventures opening all the
time. Hua-hin will be more vibrant once
BluportResortMall,aprojectvaluedat
THB4billion,officiallyopensthisOctober.
Supply
The total accumulated supply located
between Cha-am and Khao Tao from 2007
to the first half of 2016 is 23,400 units and
sold rate is 78%, rising from 74% at the
end of 2015; approximately 5,200 unsold
units remain. The majority of remaining
stock is located in the Cha-am area, which
mostly includes mega projects by listed
developers. New supply added in the first
half of this year is from three projects:
Lumpini Seaview, which is high-rise
building containing 1,130 units; The
collections, a low-rise building containing
308 units; and Sansara retirement
condominiumprojectinBlackMountain.
The latter targets foreigners aged over 50
years old from Sweden and other Northern
European countries, the United Kingdom
and Australia.
20070
5,000
10,000
15,000
25,000
20,000
2008 2009 2010 2011 2012 2013 2014 2015 1H 2016
Existing SupplyNew Supply
942 1,06
7
303
1,02
9
6,07
9
5,44
3
3,08
7
3,08
7 1,46
8
895
Source : Knight Frank Thailand’s Research

3
2007
0 0 %
10 %
20 %
30 %
40 %
50 %
60 %
70 %
80 %
90 %
39 %55 %
79 % 79 %
45 %
57 %61 %
72 %74 %
78 %
5,000
10,000
15,000
20,000
25,000
2008 2009 2010 2011 2012 2013 2014 2015 1H 2016
Supply Demand Sold rate
FIGURE 2
Supply by location
FIGURE 3
Supply by view
FIGURE 4
Huahin Condominium demand, supply, take-up rate between 2007-1H 2016
RESIDENTIAL RESEARCHHUAHIN MARKET REPORT 1H 2016
From the above graph, we see that after
2012 the average new supply added to
the market is roughly 3,000 units per
year, except in 2014 when Thailand
experienced political turmoil and a coup
d’état. In terms of known future supply,
about 300 units from two projects will
come on board: Lumpini place at Huahin
Soi7andLumpiniParkBeach2on
Cha-amBeach.Bothareexpectedtobe
added to the market by the end of 2016.
The majority of supply is located in
the Cha-am area, encompassing up
to 16,058 units, accounting for nearly
70 percent of the total supply. This is
followed by Khao Takiab at 12 percent.
Condominiums in Hua-hin and Khao Tao
included 1,753 units and 1,593 units,
respectively. Hence, both represent
the same proportion of the market, at 7
percent. The lowest-supply area is inland
located in the even-numbered sois,
representing only 5 percent of the total
supply.
The number of non-seaview units is
approximately 2 percent higher than
seaviewunits.But,attheendof2015,
the percentage of non-seaview units
was far greater than the percentage of
seaview units, roughly 10 percent higher.
This change mainly results from one
project in Cha-am, which launched 1,130
units in a high-rise building, allowing
most of the units to have partial seaviews
from their balconies.
Demand
As of 2Q2016, the take-up rate of Hua-hin
condominiums is 78 percent, rising
from 74 percent at the end 2015. This is
nearly equal to the highest sold rate in
the historical data that was 79 percent
in the years 2009 and 2010. The positive
Source : Knight Frank Thailand’s Research
Source : Knight Frank Thailand’s Research
Cha am 69 %
Inland 5 %
Khao Tao 7 %
Huahin 7 %
Khao Takiab 12 %
Non-seaview 51 %
Seaview 49 %
Source : Knight Frank Thailand’s Research
4
Cha am Huahin Khao Tao InlandKhaoTakiab
0
2,000
4,000
6,000
8,000
10,000
12,000
14,000
16,000
18,000
0 %
10 %
20 %
30 %
40 %
50 %
60 %
70 %
80 %
90 %
100 %
74 %
94 %
91 %
67 %
89 %
Sum of Total Demand Sold rate
performance of demand in the first half
of this year implies that the demand is
catching up to the supply in the market.
In addition, the average take-up over
the last three years is approximately
2,600 units per year. And, the remaining
stock now is about 5,200 units so it
will probably take a few more years to
clear the stock. As such, it is rational to
forecast more new supply launching in
2017 than in 2016. It seems 2016 is the
year of clearing inventory for developers;
the benefits belong to the purchaser via a
variety of promotions: special prices, free
common fees for one year, etc.
In terms of buyers, the majority are still
ThaipeoplelivinginBangkokwhoare
looking for a second home in Hua-hin.
From the survey, we found that, for some
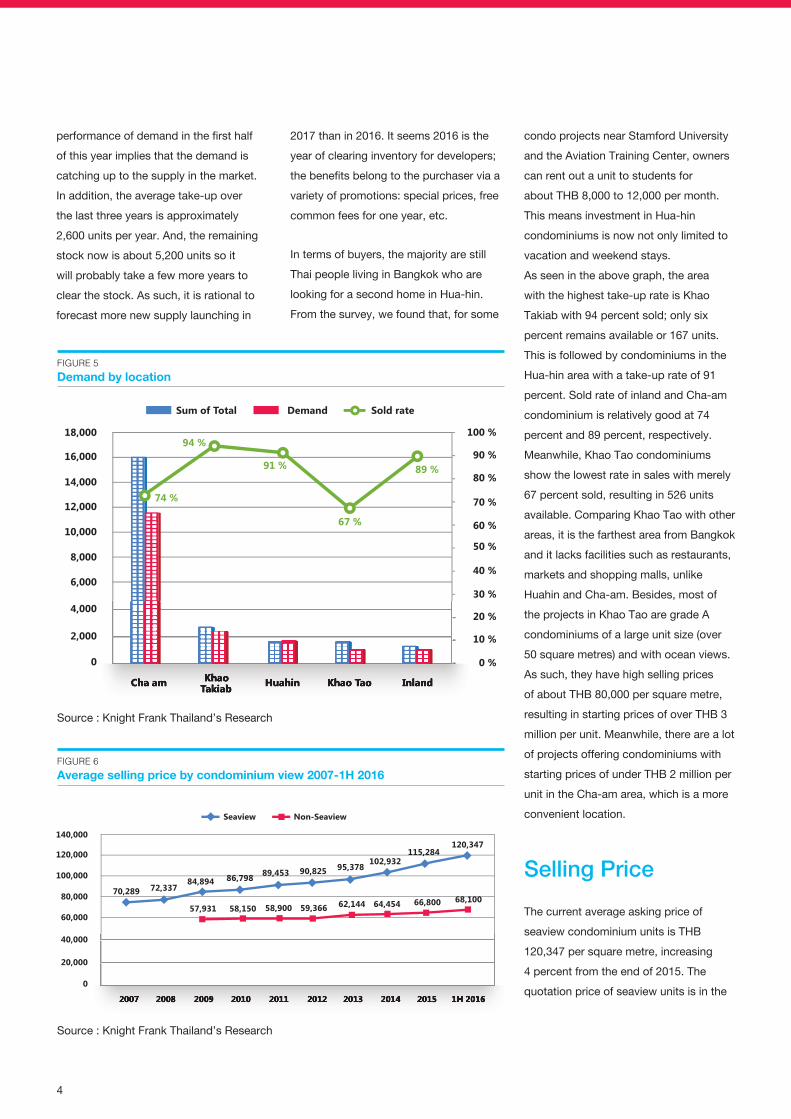
FIGURE 5
Demand by location
FIGURE 6
Average selling price by condominium view 2007-1H 2016
Source : Knight Frank Thailand’s Research
condo projects near Stamford University
and the Aviation Training Center, owners
can rent out a unit to students for
aboutTHB8,000to12,000permonth.
This means investment in Hua-hin
condominiums is now not only limited to
vacation and weekend stays.
As seen in the above graph, the area
with the highest take-up rate is Khao
Takiab with 94 percent sold; only six
percent remains available or 167 units.
This is followed by condominiums in the
Hua-hin area with a take-up rate of 91
percent. Sold rate of inland and Cha-am
condominium is relatively good at 74
percent and 89 percent, respectively.
Meanwhile, Khao Tao condominiums
show the lowest rate in sales with merely
67 percent sold, resulting in 526 units
available. Comparing Khao Tao with other
areas,itisthefarthestareafromBangkok
and it lacks facilities such as restaurants,
markets and shopping malls, unlike
HuahinandCha-am.Besides,mostof
the projects in Khao Tao are grade A
condominiums of a large unit size (over
50 square metres) and with ocean views.
As such, they have high selling prices
ofaboutTHB80,000persquaremetre,
resultinginstartingpricesofoverTHB3
million per unit. Meanwhile, there are a lot
of projects offering condominiums with
startingpricesofunderTHB2millionper
unit in the Cha-am area, which is a more
convenient location.
Selling Price
The current average asking price of
seaviewcondominiumunitsisTHB
120,347 per square metre, increasing
4 percent from the end of 2015. The
quotation price of seaview units is in the 2007 2008 2009 2010 2011 2012 2013 2014 2015 1H 2016
0
20,000
40,000
60,00057,931
70,289 72,33784,894 86,798 89,453 90,825 95,378
102,932115,284
120,347
58,150 58,900 59,366 62,144 64,454 66,800 68,10080,000
100,000
120,000
140,000
Seaview Non-Seaview
Source : Knight Frank Thailand’s Research

5
For the latest news, views and analysison the world of prime property, visit
KnightFrankblog.com/global-briefing
GLOBAL BRIEFING
Thailand Contacts
Phanom KanjanathiemthaoManaging Director+66 (0)2643 8223 Ext [email protected]
Chaturawit WattanaprukExecutive Director+66 (0)2643 8223 Ext [email protected]
Surasak Limpa-ArayakulExecutive Director, Head of Valuation and Advisory+66 (0)2643 8223 Ext [email protected]
Roong SitthisankunchornExecutive Director, Head of Property Management+66 (0)2643 8223 Ext [email protected]
Marcus BurtenshawExecutive Director, Head of Commercial Agency+66 (0)2643 8223 Ext [email protected]
Frank KhanExecutive Director, Head of Residential +66 (0)2643 8223 Ext [email protected]
Risinee SarikaputraDirector, Research and Consultancy+66 (0)2643 8223 Ext [email protected] Phuket ContactNattha KahapanaExecutive Director, Knight Frank Phuket+66 (0)7631 8151 Ext [email protected]
Important Notice© Knight Frank LLP 2016 – This report ispublished for general information only andnot to be relied upon in any way. Althoughhigh standards have been used in the preparation of the information, analysis, viewsand projections presented in this report, noresponsibility or liability whatsoever can beaccepted by Knight Frank LLP for any loss ordamage resultant from any use of, reliance onor reference to the contents of this document.As a general report, this material does notnecessarily represent the view of Knight FrankLLP in relation to particular properties or projects. Reproduction of this report in wholeor in part is not allowed without prior writtenapproval of Knight Frank LLP to the form and content within which it appears. KnightFrank LLP is a limited liability partnership registered in England with registered numberOC305934.Ourregisteredofficeis55BakerStreet, London, W1U 8AN, where you maylook at a list of members’ names.
RECENT MARKET-LEADING RESEARCH PUBLICATIONS
Knight Frank Research, Reports are available at KnightFrank.co.th/Research
Pattaya CondominiumMarket Overview 1H 2016
RESIDENTIAL RESEARCH
BangkokcondominiUm market Q2 2015
RESIDENTIAL RESEARCH
rangebetweenTHB80,000to130,000
per square metre; the lower price point
is likely to be partial seaview units not
directly facing the ocean. And, the
average selling prices in Hua-hin tend
to be higher than the other areas. Non-
seaview condominium units are now
quotedbetweenTHB55,000to80,000
per square metre. Even though some
units are non-seaview but if they face
the swimming pool inside the project,
they can command a higher selling price,
especially pool access units. The average
sellingpricefornon-seaviewunitisTHB
68,100 per square metre, a 2 percent
increase from the end of 2015.
APPENDIX
Location Definition :
Cha Am
the area incorporating Petchkasem Road
Km 210 to Km 225, as well as the sois in
between
Hua Hin
the area incorporating Soi Hua Hin 1
(next to Hua Hin Airport) to Soi Petchkasem
Road Km 235, as well as the sois in
between
Khao Takiab
the area from the road connected from
Petchkasem Road KM 235 to the south
for a distance of 14 km
Khao Tao
the area incorporating the Khao Tao area,
including Soi Hua Hin 126 to Soi Hua Hin
156, as well as the sois in between
Inland
the area incorporating the northern side of
Petchkasem Highway
*Knight Frank Thailand research data is
not inclusive of Areas in Pranburi
Condominium Type :
There are two condominium types
according to Knight Frank, which are :
Sea View Condominium
is defined as a condominium project that
is located on the beachfront with at least
50% of total units having sea views.
Non-Sea View Condominium
is defined as a condominium project
where less than 50% of total units have
non-sea views.
H1 2016 Logistics Property Market
RESIDENTIAL RESEARCH
BangkokcondominiUm market Q2 2015
RESIDENTIAL RESEARCH
BANGKOKSUPERPRIME AND PRIME CONDOMINIUM MARKET OVERVIEW H1 2016
Q2 2016 BangkokOficceMarket
RESIDENTIAL RESEARCH
BangkokcondominiUm market Q2 2015
RESIDENTIAL RESEARCH
BANGKOKSUPERPRIME AND PRIME CONDOMINIUM MARKET OVERVIEW H1 2016
COMMERCIAL RESEARCH
BANGKOKOFFICEMARKET OVERVIEW Q2 2016
COMMERCIAL RESEARCH
LOGISTICS PROPERTY MARKET H1 2016
Phuket CondominiumReport 2016
RESIDENTIAL RESEARCH
BangkokcondominiUm market Q2 2015
RESIDENTIAL RESEARCH
BANGKOKSUPERPRIME AND PRIME CONDOMINIUM MARKET OVERVIEW H1 2016
COMMERCIAL RESEARCH
LOGISTICS PROPERTY MARKET H1 2016PHUKET CONDOMINIUMREPORT 2016
RESIDENTIAL RESEARCH
PATTAYA CONDOMINIUMMARKET OVERVIEW 1H 2016
RESIDENTIAL RESEARCH