Embed Size (px)
DESCRIPTION
Basic for HUC
Citation preview
AIOC Chirag Oil Project Environmental & Socio-Economic Impact Assessment
Chapter 10: Construction, Installation and HUC Environmental Impact Assessment,
Mitigation and Monitoring
February 2010 10/1 Final
10. Construction, Installation, Hook-Up & Commissioning Impact Assessment, Mitigation and Monitoring Contents 10.1 Introduction........................................................................................................................3 10.2 Scoping Assessment.........................................................................................................3 10.3 Existing Controls, Monitoring and Reporting.....................................................................7 10.4 Impacts to the Atmosphere .............................................................................................12
10.4.1 Construction Yard Emission Sources.................................................................12 10.4.2 Onshore Platform Generator Commissioning ....................................................15 10.4.3 Jacket and Pipeline Installation Vessels ............................................................17
10.5 Impacts to the Terrestrial Environment Associated with Onshore Noise........................19 10.5.1 Construction Yard Plant......................................................................................19 10.5.2 Onshore Platform Generator Commissioning ....................................................22
10.6 Impacts to the Marine Environment ................................................................................24 10.6.1 Construction Yard Cooling Water Discharge......................................................24 10.6.2 Pipeline Cleaning and Hydrotest Discharge.......................................................26 10.6.3 Cement Discharges ............................................................................................31 10.6.4 Underwater Noise and Vibration ........................................................................32 10.6.5 Seabed Disturbance...........................................................................................35 10.6.6 Other Discharges................................................................................................37
10.7 Summary of COP Construction, Installation and HUC Residual Environmental Impacts40 List of Figures Figure 10.1 Maximum Short Term Ground Level Increase in NO2 Concentration (µg/m3) At Distance from Centre of Yard (High Wind Speed Conditions) 13 Figure 10.2 Maximum Short Term Ground Level NO2 Concentration (µg/m3) at Distance from Source (High Wind Speed Conditions) 16 Figure 10.3 Predicted Noise Levels from Plant/Machinery at the Construction Yard 20 Figure 10.4 Predicted Noise Level Associated with Onshore Platform Generator Commissioning 22 Figure 10.5 Predicted Cooling Water Plume Temperature Above Ambient at Distance from Discharge 24 Figure 10.6 Plume Dimensions for Discharge of 1,200 m3 ‘Fresh’ Hydrotest Water Under Stagnant and Predominant Current Conditions 27 Figure 10.7 Plume Dimensions for Discharge of 7,000m3 Degraded Hydrotest Water 27 Figure 10.8 Relationship Between Produced Water Toxicity (LC50 expressed as % Dilution in Caspian Seawater) and Total Hydrocarbon Concentration 28 Figure 10.9 Predicted Distances Within Which Fish and Seals React to Underwater Piling and Vessel Noise 33 List of Tables Table 10.1 “Scoped Out” COP Construction, Hook Up and Commissioning Routine and Non- routine Activities 4 Table 10.2 “Assessed” COP Construction, Installation, Hook Up and Commissioning Routine and Non-routine Activities & Interactions 7 Table 10.3 COP Construction, Installation and HUC Existing Controls, Monitoring and Reporting 8 Table 10.4 Event Magnitude 13 Table 10.5 Human Receptor Sensitivity 14 Table 10.6 Biological/Ecological Receptor Sensitivity 14 Table 10.7 Impact Significance 15 Table 10.8 Maximum Short Term NO2 Concentrations Under High, Low and Typical Wind Conditions (Platform Generator Emissions) 15
AIOC Chirag Oil Project Environmental & Socio-Economic Impact Assessment
Chapter 10: Construction, Installation and HUC Environmental Impact Assessment,
Mitigation and Monitoring
February 2010 10/2 Final
Table 10.9 Event Magnitude 16 Table 10.10 Impact Significance 17 Table 10.11 Event Magnitude 18 Table 10.12 Human Receptor Sensitivity 18 Table 10.13 Biological/Ecological Receptor Sensitivity 18 Table 10.14 Impact Significance 19 Table 10.15 Event Magnitude 20 Table 10.16 Human Receptor Sensitivity 21 Table 10.17 Biological/Ecological Receptor Sensitivity 21 Table 10.18 Impact Significance 21 Table 10.19 Event Magnitude 23 Table 10.20 Impact Significance 23 Table 10.21 Event Magnitude 25 Table 10.22 Receptor Sensitivity 25 Table 10.23 Impact Significance 26 Table 10.24 Event Magnitude 29 Table 10.25 Receptor Sensitivity 29 Table 10.26 Impact Significance 30 Table 10.27 Event Magnitude 31 Table 10.28 Receptor Sensitivity 31 Table 10.29 Impact Significance 32 Table 10.30 Event Magnitude (Piling) 33 Table 10.31 Event Magnitude (Vessels) 34 Table 10.32 Receptor Sensitivity 34 Table 10.33 Impact Significance 35 Table 10.34 Event Magnitude 35 Table 10.35 Receptor Sensitivity 36 Table 10.36 Impact Significance 36 Table 10.37 Event Magnitude 38 Table 10.38 Receptor Sensitivity (All Receptors) 39 Table 10.39 Impact Significance 39 Table 10.40 Summary of Construction, Installation and HUC Residual Environmental Impacts 40
AIOC Chirag Oil Project Environmental & Socio-Economic Impact Assessment
Chapter 10: Construction, Installation and HUC Environmental Impact Assessment,
Mitigation and Monitoring
February 2010 10/3 Final
10.1 Introduction This Chapter of the Chirag Oil Project (COP) Environmental and Socio-Economic Impact Assessment (ESIA) presents the assessment of environmental impacts associated with the following COP phases: • Onshore Construction and Commissioning of Offshore Facilities; • Infield Pipeline Installation, Tie-in and Commissioning; and • Platform Installation, Hook Up and Commissioning (HUC). The impact assessment methodology followed and the structure of the COP impact assessment are described in full within Chapters 3 and 9 of this ESIA respectively. 10.2 Scoping Assessment The COP Construction, Installation and HUC Activities and Events have been determined based on the COP Base Case, as detailed within Chapter 5: Project Description (see Appendix 10A). Table 10.1 presents the Activities and associated Events that have been scoped out of the full assessment process due to their limited potential to result in discernable environmental impacts. Judgement is based on prior experience of similar Activities and Events, especially with respect to earlier ACG developments. In some instances, scoping level quantification/numerical analysis has been used to justify the decision. Reference is made to relevant quantification, analysis, survey and/or monitoring reports in these instances.
AIOC Chirag Oil Project Environmental & Socio-Economic Impact Assessment
Chapter 10: Construction, Installation and HUC Environmental Impact Assessment,
Mitigation and Monitoring
February 2010 10/4 Final
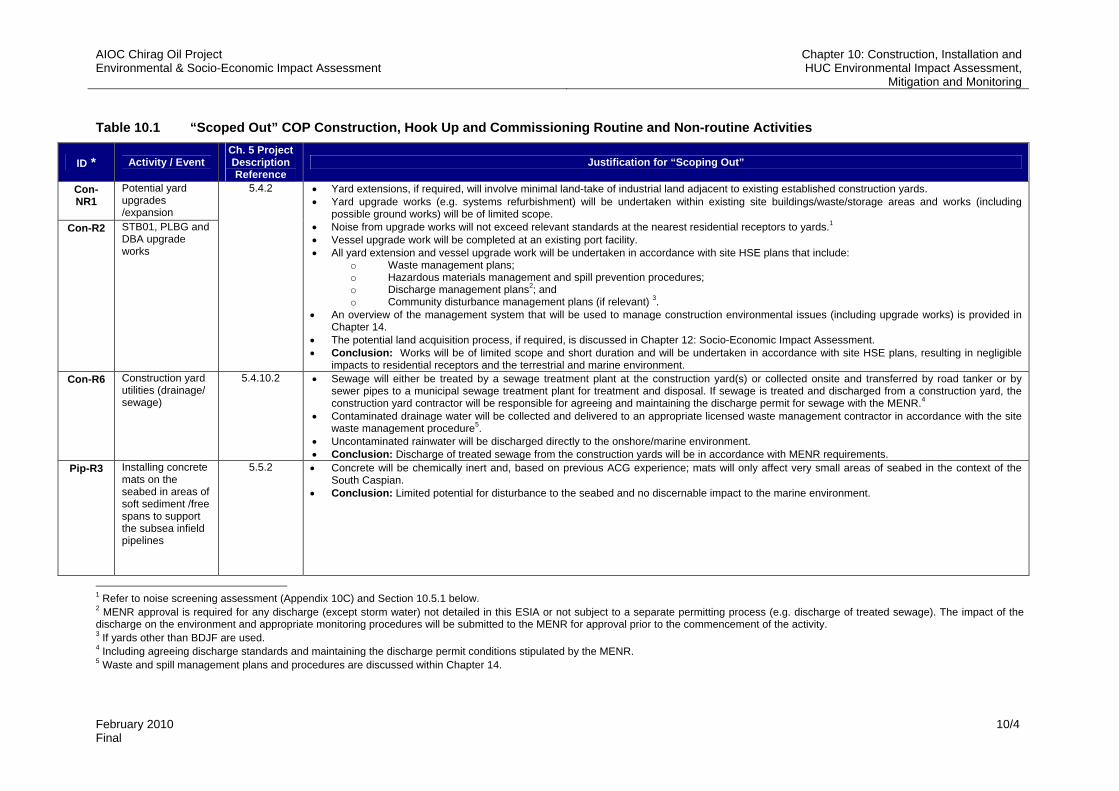
Table 10.1 “Scoped Out” COP Construction, Hook Up and Commissioning Routine and Non-routine Activities
ID * Activity / Event Ch. 5 Project Description Reference
Justification for “Scoping Out”
Con-NR1
Potential yard upgrades /expansion
Con-R2 STB01, PLBG and DBA upgrade works
5.4.2 • Yard extensions, if required, will involve minimal land-take of industrial land adjacent to existing established construction yards. • Yard upgrade works (e.g. systems refurbishment) will be undertaken within existing site buildings/waste/storage areas and works (including
possible ground works) will be of limited scope. • Noise from upgrade works will not exceed relevant standards at the nearest residential receptors to yards.1 • Vessel upgrade work will be completed at an existing port facility. • All yard extension and vessel upgrade work will be undertaken in accordance with site HSE plans that include:
o Waste management plans; o Hazardous materials management and spill prevention procedures; o Discharge management plans2; and o Community disturbance management plans (if relevant) 3.
• An overview of the management system that will be used to manage construction environmental issues (including upgrade works) is provided in Chapter 14.
• The potential land acquisition process, if required, is discussed in Chapter 12: Socio-Economic Impact Assessment. • Conclusion: Works will be of limited scope and short duration and will be undertaken in accordance with site HSE plans, resulting in negligible
impacts to residential receptors and the terrestrial and marine environment. Con-R6 Construction yard
utilities (drainage/ sewage)
5.4.10.2 • Sewage will either be treated by a sewage treatment plant at the construction yard(s) or collected onsite and transferred by road tanker or by sewer pipes to a municipal sewage treatment plant for treatment and disposal. If sewage is treated and discharged from a construction yard, the construction yard contractor will be responsible for agreeing and maintaining the discharge permit for sewage with the MENR.4
• Contaminated drainage water will be collected and delivered to an appropriate licensed waste management contractor in accordance with the site waste management procedure5.
• Uncontaminated rainwater will be discharged directly to the onshore/marine environment. • Conclusion: Discharge of treated sewage from the construction yards will be in accordance with MENR requirements.
Pip-R3 Installing concrete mats on the seabed in areas of soft sediment /free spans to support the subsea infield pipelines
5.5.2
• Concrete will be chemically inert and, based on previous ACG experience; mats will only affect very small areas of seabed in the context of the South Caspian.
• Conclusion: Limited potential for disturbance to the seabed and no discernable impact to the marine environment.
1 Refer to noise screening assessment (Appendix 10C) and Section 10.5.1 below. 2 MENR approval is required for any discharge (except storm water) not detailed in this ESIA or not subject to a separate permitting process (e.g. discharge of treated sewage). The impact of the discharge on the environment and appropriate monitoring procedures will be submitted to the MENR for approval prior to the commencement of the activity. 3 If yards other than BDJF are used. 4 Including agreeing discharge standards and maintaining the discharge permit conditions stipulated by the MENR. 5 Waste and spill management plans and procedures are discussed within Chapter 14.
AIOC Chirag Oil Project Environmental & Socio-Economic Impact Assessment
Chapter 10: Construction, Installation and HUC Environmental Impact Assessment,
Mitigation and Monitoring
February 2010 10/5 Final
ID * Activity / Event Ch. 5 Project Description Reference
Justification for “Scoping Out”
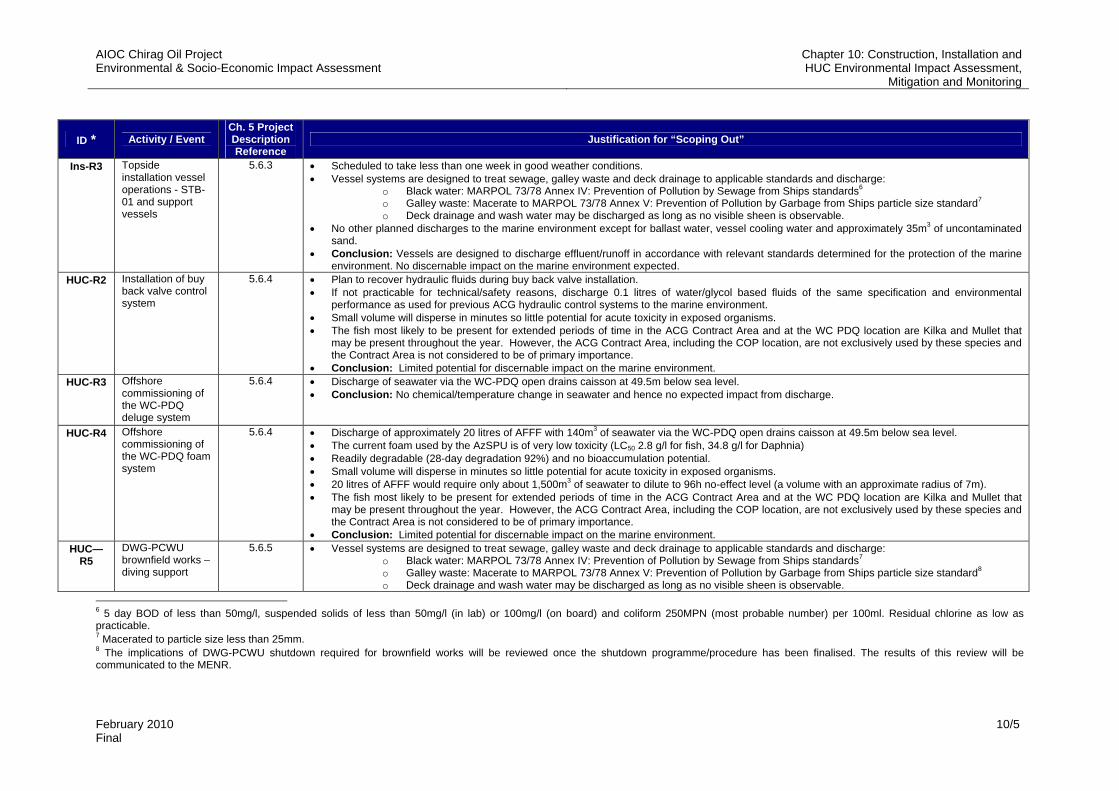
Ins-R3 Topside installation vessel operations - STB-01 and support vessels
5.6.3 • Scheduled to take less than one week in good weather conditions. • Vessel systems are designed to treat sewage, galley waste and deck drainage to applicable standards and discharge:
o Black water: MARPOL 73/78 Annex IV: Prevention of Pollution by Sewage from Ships standards6 o Galley waste: Macerate to MARPOL 73/78 Annex V: Prevention of Pollution by Garbage from Ships particle size standard7 o Deck drainage and wash water may be discharged as long as no visible sheen is observable.
• No other planned discharges to the marine environment except for ballast water, vessel cooling water and approximately 35m3 of uncontaminated sand.
• Conclusion: Vessels are designed to discharge effluent/runoff in accordance with relevant standards determined for the protection of the marine environment. No discernable impact on the marine environment expected.
HUC-R2 Installation of buy back valve control system
5.6.4 • Plan to recover hydraulic fluids during buy back valve installation. • If not practicable for technical/safety reasons, discharge 0.1 litres of water/glycol based fluids of the same specification and environmental
performance as used for previous ACG hydraulic control systems to the marine environment. • Small volume will disperse in minutes so little potential for acute toxicity in exposed organisms. • The fish most likely to be present for extended periods of time in the ACG Contract Area and at the WC PDQ location are Kilka and Mullet that
may be present throughout the year. However, the ACG Contract Area, including the COP location, are not exclusively used by these species and the Contract Area is not considered to be of primary importance.
• Conclusion: Limited potential for discernable impact on the marine environment. HUC-R3 Offshore
commissioning of the WC-PDQ deluge system
5.6.4 • Discharge of seawater via the WC-PDQ open drains caisson at 49.5m below sea level. • Conclusion: No chemical/temperature change in seawater and hence no expected impact from discharge.
HUC-R4 Offshore commissioning of the WC-PDQ foam system
5.6.4 • Discharge of approximately 20 litres of AFFF with 140m3 of seawater via the WC-PDQ open drains caisson at 49.5m below sea level. • The current foam used by the AzSPU is of very low toxicity (LC50 2.8 g/l for fish, 34.8 g/l for Daphnia) • Readily degradable (28-day degradation 92%) and no bioaccumulation potential. • Small volume will disperse in minutes so little potential for acute toxicity in exposed organisms. • 20 litres of AFFF would require only about 1,500m3 of seawater to dilute to 96h no-effect level (a volume with an approximate radius of 7m). • The fish most likely to be present for extended periods of time in the ACG Contract Area and at the WC PDQ location are Kilka and Mullet that
may be present throughout the year. However, the ACG Contract Area, including the COP location, are not exclusively used by these species and the Contract Area is not considered to be of primary importance.
• Conclusion: Limited potential for discernable impact on the marine environment. HUC—
R5 DWG-PCWU brownfield works – diving support
5.6.5 • Vessel systems are designed to treat sewage, galley waste and deck drainage to applicable standards and discharge: o Black water: MARPOL 73/78 Annex IV: Prevention of Pollution by Sewage from Ships standards7 o Galley waste: Macerate to MARPOL 73/78 Annex V: Prevention of Pollution by Garbage from Ships particle size standard8 o Deck drainage and wash water may be discharged as long as no visible sheen is observable.
6 5 day BOD of less than 50mg/l, suspended solids of less than 50mg/l (in lab) or 100mg/l (on board) and coliform 250MPN (most probable number) per 100ml. Residual chlorine as low as practicable. 7 Macerated to particle size less than 25mm. 8 The implications of DWG-PCWU shutdown required for brownfield works will be reviewed once the shutdown programme/procedure has been finalised. The results of this review will be communicated to the MENR.
AIOC Chirag Oil Project Environmental & Socio-Economic Impact Assessment
Chapter 10: Construction, Installation and HUC Environmental Impact Assessment,
Mitigation and Monitoring
February 2010 10/6 Final
ID * Activity / Event Ch. 5 Project Description Reference
Justification for “Scoping Out”
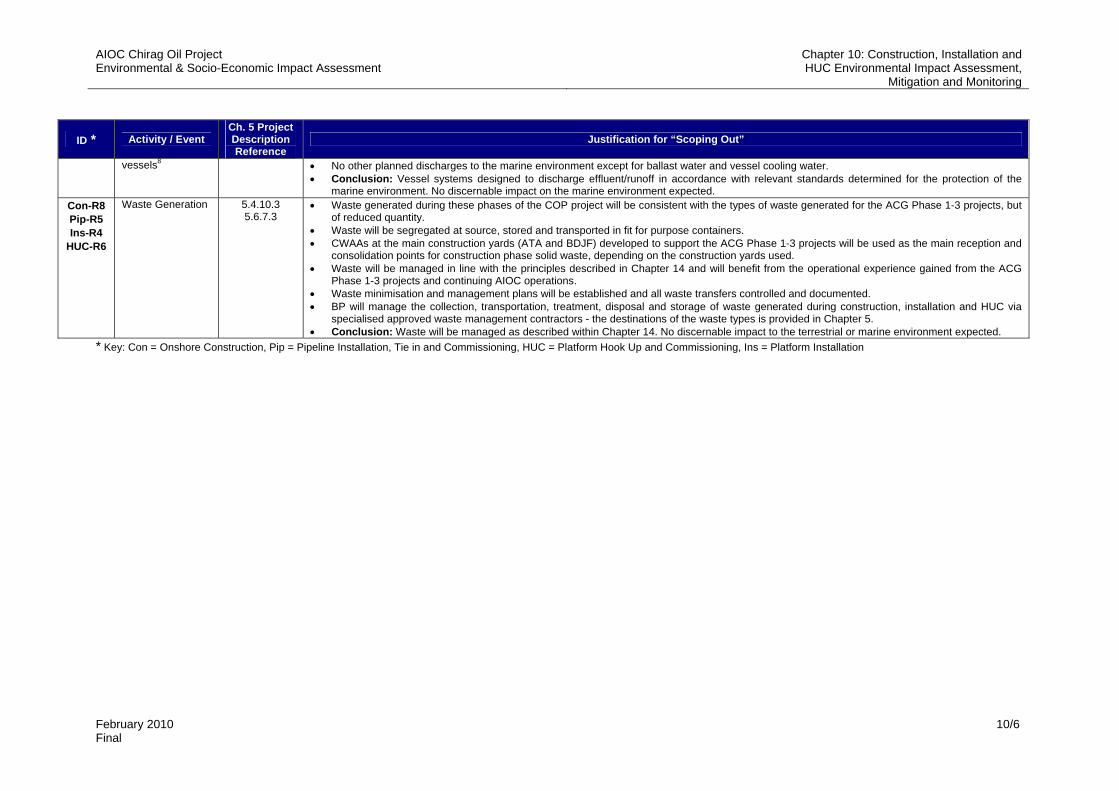
vessels8 • No other planned discharges to the marine environment except for ballast water and vessel cooling water. • Conclusion: Vessel systems designed to discharge effluent/runoff in accordance with relevant standards determined for the protection of the
marine environment. No discernable impact on the marine environment expected. Con-R8 Pip-R5 Ins-R4
HUC-R6
Waste Generation 5.4.10.3 5.6.7.3
• Waste generated during these phases of the COP project will be consistent with the types of waste generated for the ACG Phase 1-3 projects, but of reduced quantity.
• Waste will be segregated at source, stored and transported in fit for purpose containers. • CWAAs at the main construction yards (ATA and BDJF) developed to support the ACG Phase 1-3 projects will be used as the main reception and
consolidation points for construction phase solid waste, depending on the construction yards used. • Waste will be managed in line with the principles described in Chapter 14 and will benefit from the operational experience gained from the ACG
Phase 1-3 projects and continuing AIOC operations. • Waste minimisation and management plans will be established and all waste transfers controlled and documented. • BP will manage the collection, transportation, treatment, disposal and storage of waste generated during construction, installation and HUC via
specialised approved waste management contractors - the destinations of the waste types is provided in Chapter 5. • Conclusion: Waste will be managed as described within Chapter 14. No discernable impact to the terrestrial or marine environment expected.
* Key: Con = Onshore Construction, Pip = Pipeline Installation, Tie in and Commissioning, HUC = Platform Hook Up and Commissioning, Ins = Platform Installation
AIOC Chirag Oil Project Environmental & Socio-Economic Impact Assessment
Chapter 10: Construction, Installation and HUC Environmental Impact Assessment,
Mitigation and Monitoring
February 2010 10/7 Final
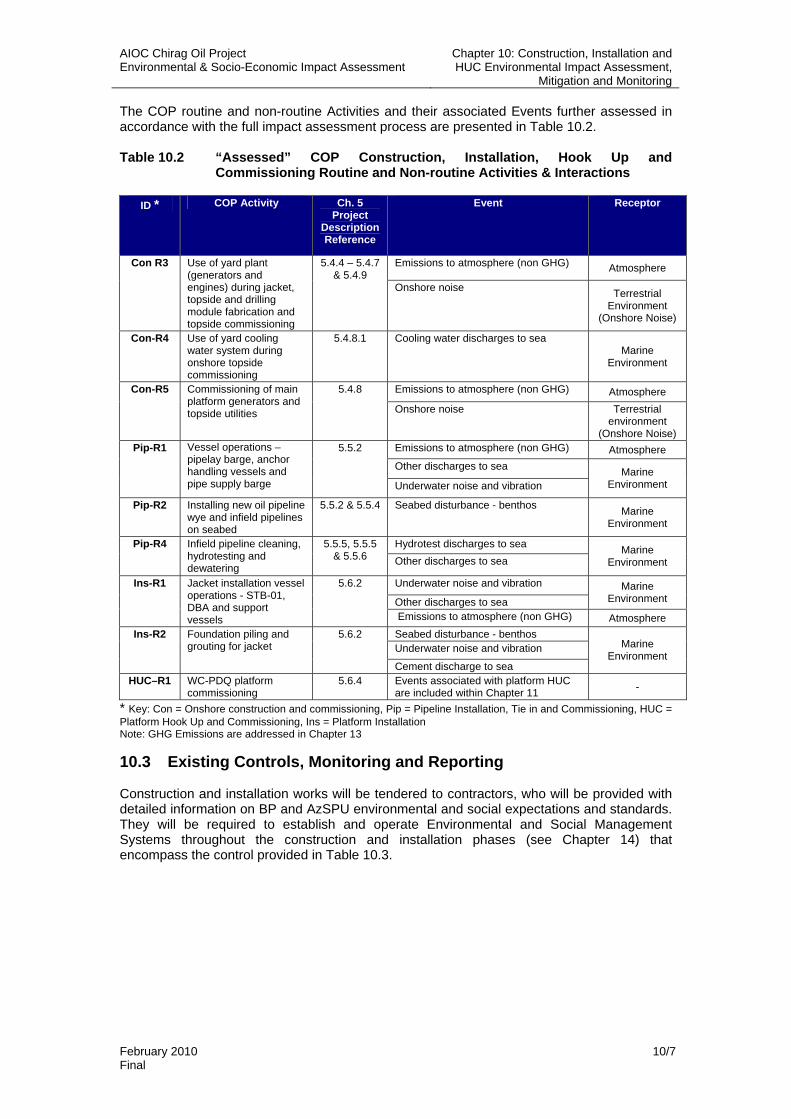
The COP routine and non-routine Activities and their associated Events further assessed in accordance with the full impact assessment process are presented in Table 10.2. Table 10.2 “Assessed” COP Construction, Installation, Hook Up and
Commissioning Routine and Non-routine Activities & Interactions
* Key: Con = Onshore construction and commissioning, Pip = Pipeline Installation, Tie in and Commissioning, HUC = Platform Hook Up and Commissioning, Ins = Platform Installation Note: GHG Emissions are addressed in Chapter 13 10.3 Existing Controls, Monitoring and Reporting Construction and installation works will be tendered to contractors, who will be provided with detailed information on BP and AzSPU environmental and social expectations and standards. They will be required to establish and operate Environmental and Social Management Systems throughout the construction and installation phases (see Chapter 14) that encompass the control provided in Table 10.3.
ID * COP Activity Ch. 5 Project
Description Reference
Event Receptor
Emissions to atmosphere (non GHG) Atmosphere Con R3 Use of yard plant (generators and engines) during jacket, topside and drilling module fabrication and topside commissioning
5.4.4 – 5.4.7 & 5.4.9
Onshore noise Terrestrial Environment
(Onshore Noise)
Con-R4 Use of yard cooling water system during onshore topside commissioning
5.4.8.1 Cooling water discharges to sea Marine
Environment
Emissions to atmosphere (non GHG) Atmosphere Con-R5 Commissioning of main platform generators and topside utilities
5.4.8
Onshore noise Terrestrial environment
(Onshore Noise) Emissions to atmosphere (non GHG) Atmosphere Other discharges to sea
Pip-R1 Vessel operations – pipelay barge, anchor handling vessels and pipe supply barge
5.5.2
Underwater noise and vibration Marine
Environment
Pip-R2 Installing new oil pipeline wye and infield pipelines on seabed
5.5.2 & 5.5.4
Seabed disturbance - benthos Marine Environment
Hydrotest discharges to sea Pip-R4 Infield pipeline cleaning, hydrotesting and dewatering
5.5.5, 5.5.5 & 5.5.6
Other discharges to sea
Marine Environment
Underwater noise and vibration
Other discharges to sea Marine
Environment Ins-R1 Jacket installation vessel
operations - STB-01, DBA and support vessels
5.6.2
Emissions to atmosphere (non GHG) Atmosphere Seabed disturbance - benthos Underwater noise and vibration
Ins-R2 Foundation piling and grouting for jacket
5.6.2
Cement discharge to sea
Marine Environment
HUC–R1 WC-PDQ platform commissioning
5.6.4 Events associated with platform HUC are included within Chapter 11 -
AIOC Chirag Oil Project Environmental & Socio-Economic Impact Assessment
Chapter 10: Construction, Installation and HUC Environmental Impact Assessment,
Mitigation and Monitoring
February 2010 10/8 Final
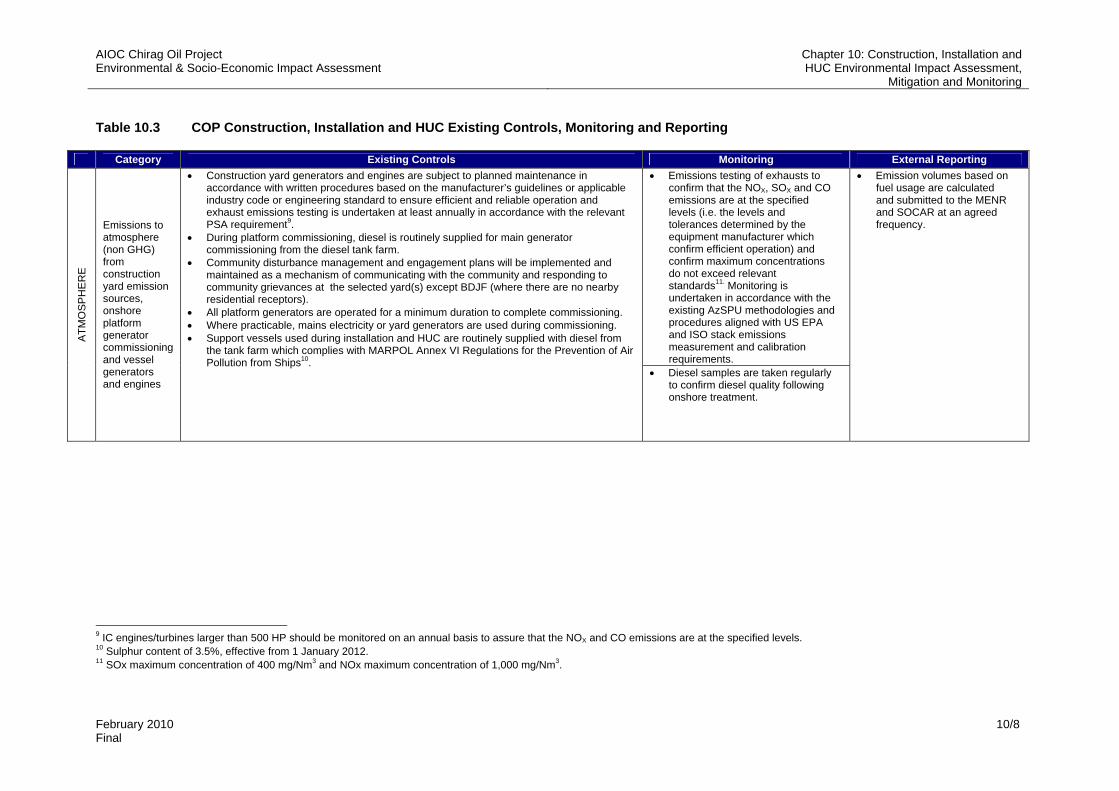
Table 10.3 COP Construction, Installation and HUC Existing Controls, Monitoring and Reporting
Category Existing Controls Monitoring External Reporting • Emissions testing of exhausts to
confirm that the NOX, SOX and CO emissions are at the specified levels (i.e. the levels and tolerances determined by the equipment manufacturer which confirm efficient operation) and confirm maximum concentrations do not exceed relevant standards11. Monitoring is undertaken in accordance with the existing AzSPU methodologies and procedures aligned with US EPA and ISO stack emissions measurement and calibration requirements.
ATM
OS
PH
ER
E
Emissions to atmosphere (non GHG) from construction yard emission sources, onshore platform generator commissioning and vessel generators and engines
• Construction yard generators and engines are subject to planned maintenance in accordance with written procedures based on the manufacturer’s guidelines or applicable industry code or engineering standard to ensure efficient and reliable operation and exhaust emissions testing is undertaken at least annually in accordance with the relevant PSA requirement9.
• During platform commissioning, diesel is routinely supplied for main generator commissioning from the diesel tank farm.
• Community disturbance management and engagement plans will be implemented and maintained as a mechanism of communicating with the community and responding to community grievances at the selected yard(s) except BDJF (where there are no nearby residential receptors).
• All platform generators are operated for a minimum duration to complete commissioning. • Where practicable, mains electricity or yard generators are used during commissioning. • Support vessels used during installation and HUC are routinely supplied with diesel from
the tank farm which complies with MARPOL Annex VI Regulations for the Prevention of Air Pollution from Ships10.
• Diesel samples are taken regularly to confirm diesel quality following onshore treatment.
• Emission volumes based on fuel usage are calculated and submitted to the MENR and SOCAR at an agreed frequency.
9 IC engines/turbines larger than 500 HP should be monitored on an annual basis to assure that the NOX and CO emissions are at the specified levels. 10 Sulphur content of 3.5%, effective from 1 January 2012. 11 SOx maximum concentration of 400 mg/Nm3 and NOx maximum concentration of 1,000 mg/Nm3.
AIOC Chirag Oil Project Environmental & Socio-Economic Impact Assessment
Chapter 10: Construction, Installation and HUC Environmental Impact Assessment,
Mitigation and Monitoring
February 2010 10/9 Final
Category Existing Controls Monitoring External Reporting
TER
RE
STR
IAL
NO
ISE
EN
VIR
ON
ME
NT
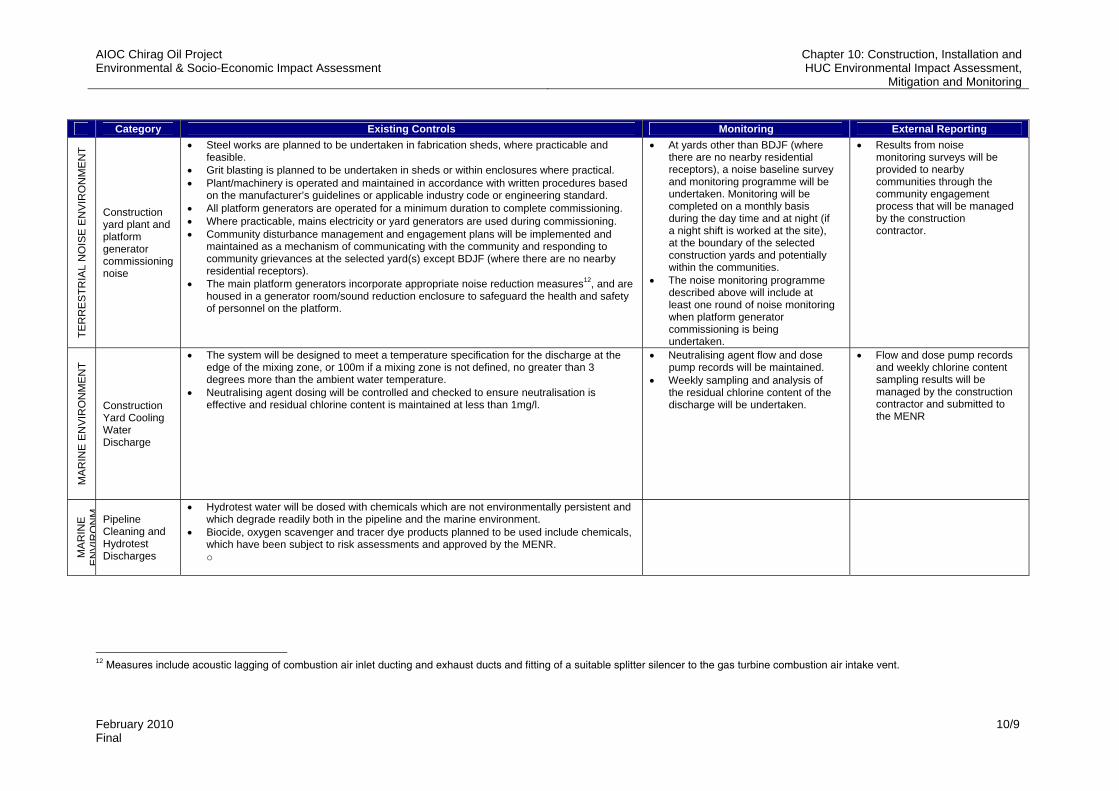
Construction yard plant and platform generator commissioning noise
• Steel works are planned to be undertaken in fabrication sheds, where practicable and feasible.
• Grit blasting is planned to be undertaken in sheds or within enclosures where practical. • Plant/machinery is operated and maintained in accordance with written procedures based
on the manufacturer’s guidelines or applicable industry code or engineering standard. • All platform generators are operated for a minimum duration to complete commissioning. • Where practicable, mains electricity or yard generators are used during commissioning. • Community disturbance management and engagement plans will be implemented and
maintained as a mechanism of communicating with the community and responding to community grievances at the selected yard(s) except BDJF (where there are no nearby residential receptors).
• The main platform generators incorporate appropriate noise reduction measures12, and are housed in a generator room/sound reduction enclosure to safeguard the health and safety of personnel on the platform.
• At yards other than BDJF (where there are no nearby residential receptors), a noise baseline survey and monitoring programme will be undertaken. Monitoring will be completed on a monthly basis during the day time and at night (if a night shift is worked at the site), at the boundary of the selected construction yards and potentially within the communities.
• The noise monitoring programme described above will include at least one round of noise monitoring when platform generator commissioning is being undertaken.
• Results from noise monitoring surveys will be provided to nearby communities through the community engagement process that will be managed by the construction contractor.
MA
RIN
E E
NV
IRO
NM
EN
T
Construction Yard Cooling Water Discharge
• The system will be designed to meet a temperature specification for the discharge at the edge of the mixing zone, or 100m if a mixing zone is not defined, no greater than 3 degrees more than the ambient water temperature.
• Neutralising agent dosing will be controlled and checked to ensure neutralisation is effective and residual chlorine content is maintained at less than 1mg/l.
• Neutralising agent flow and dose pump records will be maintained.
• Weekly sampling and analysis of the residual chlorine content of the discharge will be undertaken.
• Flow and dose pump records and weekly chlorine content sampling results will be managed by the construction contractor and submitted to the MENR
MA
RIN
E
EN
VIR
ON
M Pipeline Cleaning and Hydrotest Discharges
• Hydrotest water will be dosed with chemicals which are not environmentally persistent and which degrade readily both in the pipeline and the marine environment.
• Biocide, oxygen scavenger and tracer dye products planned to be used include chemicals, which have been subject to risk assessments and approved by the MENR. o
12 Measures include acoustic lagging of combustion air inlet ducting and exhaust ducts and fitting of a suitable splitter silencer to the gas turbine combustion air intake vent.
AIOC Chirag Oil Project Environmental & Socio-Economic Impact Assessment
Chapter 10: Construction, Installation and HUC Environmental Impact Assessment,
Mitigation and Monitoring
February 2010 10/10 Final
Category Existing Controls Monitoring External Reporting
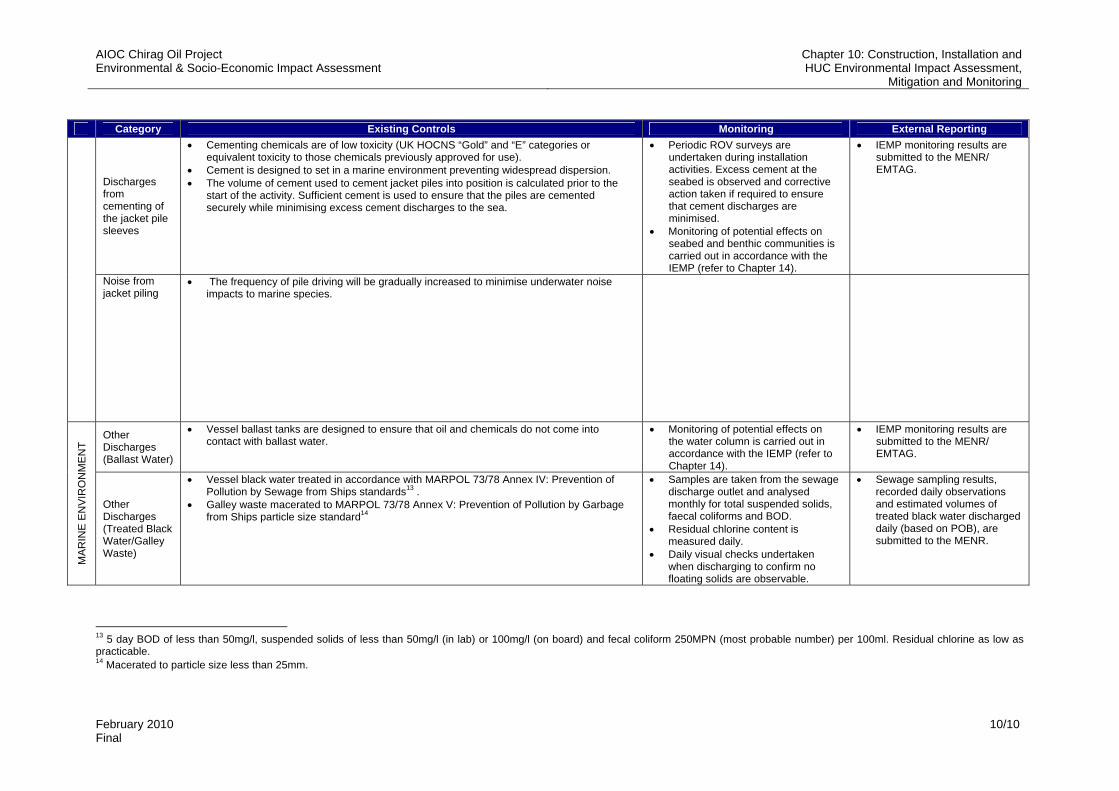
Discharges from cementing of the jacket pile sleeves
• Cementing chemicals are of low toxicity (UK HOCNS “Gold” and “E” categories or equivalent toxicity to those chemicals previously approved for use).
• Cement is designed to set in a marine environment preventing widespread dispersion. • The volume of cement used to cement jacket piles into position is calculated prior to the
start of the activity. Sufficient cement is used to ensure that the piles are cemented securely while minimising excess cement discharges to the sea.
• Periodic ROV surveys are undertaken during installation activities. Excess cement at the seabed is observed and corrective action taken if required to ensure that cement discharges are minimised.
• Monitoring of potential effects on seabed and benthic communities is carried out in accordance with the IEMP (refer to Chapter 14).
• IEMP monitoring results are submitted to the MENR/ EMTAG.
Noise from jacket piling
• The frequency of pile driving will be gradually increased to minimise underwater noise impacts to marine species.
Other Discharges (Ballast Water)
• Vessel ballast tanks are designed to ensure that oil and chemicals do not come into contact with ballast water.
• Monitoring of potential effects on the water column is carried out in accordance with the IEMP (refer to Chapter 14).
• IEMP monitoring results are submitted to the MENR/ EMTAG.
MA
RIN
E E
NV
IRO
NM
EN
T
Other Discharges (Treated Black Water/Galley Waste)
• Vessel black water treated in accordance with MARPOL 73/78 Annex IV: Prevention of Pollution by Sewage from Ships standards13 .
• Galley waste macerated to MARPOL 73/78 Annex V: Prevention of Pollution by Garbage from Ships particle size standard14
• Samples are taken from the sewage discharge outlet and analysed monthly for total suspended solids, faecal coliforms and BOD.
• Residual chlorine content is measured daily.
• Daily visual checks undertaken when discharging to confirm no floating solids are observable.
• Sewage sampling results, recorded daily observations and estimated volumes of treated black water discharged daily (based on POB), are submitted to the MENR.
13 5 day BOD of less than 50mg/l, suspended solids of less than 50mg/l (in lab) or 100mg/l (on board) and fecal coliform 250MPN (most probable number) per 100ml. Residual chlorine as low as practicable. 14 Macerated to particle size less than 25mm.
AIOC Chirag Oil Project Environmental & Socio-Economic Impact Assessment
Chapter 10: Construction, Installation and HUC Environmental Impact Assessment,
Mitigation and Monitoring
February 2010 10/11 Final
Category Existing Controls Monitoring External Reporting
Other Discharges (Deck drainage and washwater)
• Deck drainage and wash water may be discharged as long as no visible sheen is observable.
• Daily visual checks undertaken when discharging to confirm no visible sheen
General • Support vessels are subject to periodical performance review which include environmental
performance. Corrective actions would be taken to address any performance gaps
AIOC Chirag Oil Project Environmental & Socio-Economic Impact Assessment
Chapter 10: Construction, Installation and HUC Environmental Impact Assessment,
Mitigation and Monitoring
February 2010 10/12 Final
10.4 Impacts to the Atmosphere 10.4.1 Construction Yard Emission Sources
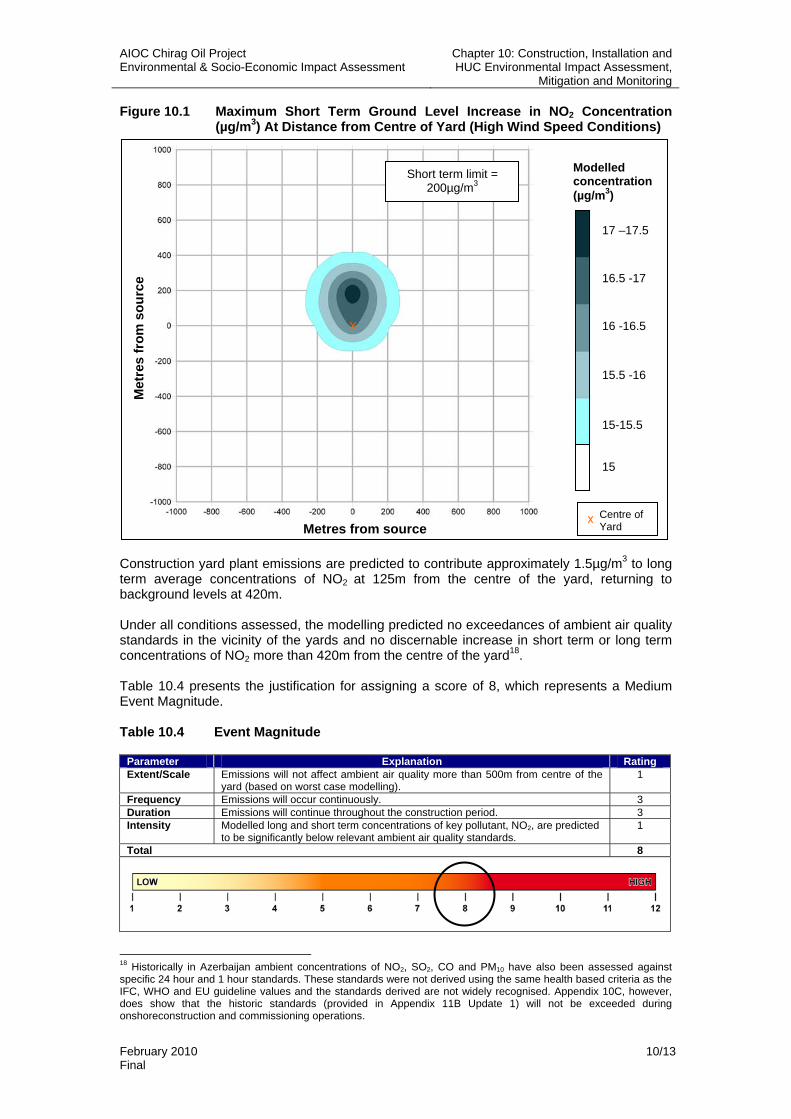
10.4.1.1 Event Magnitude As stated within Chapter 5: Section 5.4, the WC-PDQ topside, jacket and drilling module will be constructed at a combination of established construction yards. At present, the options that are being considered for the construction and commissioning of the WC-PDQ topside and drilling support module include: • BDJF yard; • Zykh yard; and • Bibi Heybet/South Dock yards15. It is intended that the WC-PDQ jacket will be constructed at the BDJF yard. At each yard, the majority of power required for construction activities such as steel cutting, rolling and shaping will be provided from the Azerbaijan national grid. Onsite plant and equipment used including cranes, generators and vehicles, will consume diesel and gasoline resulting in emissions to atmosphere (refer to Appendix 5A). A dispersion modelling assessment was undertaken to assess the potential magnitude of impacts from onshore construction phase emissions to any nearby receptors (see Appendix 10C). The assessment was based on an estimated diesel consumption by construction yard plant of 8.5 tonnes per day (sourced from records from previous ACG projects) and assumed plant was distributed evenly across the construction yard. The assessment considered NO2 emissions, comparing the short term and long term average modelled concentrations at ground level to applicable air quality standards for the protection of human health16. Modelling of SO2 and particulates was not deemed necessary as concentrations are expected to be very low based on efficient plant operation, regular maintenance and planned use of good quality, low sulphur diesel. Wind conditions were determined from recent data available from the meteorological station at Baku and typical, high and low speed wind conditions were assessed. To assess a realistic worst case, emissions were modelled based on topside and drilling module construction being undertaken simultaneously at the same yard17. The background concentration of NO2 (15µg/m3) was determined from the air quality assessment undertaken in the vicinity of Sangachal (refer to Chapter 6: Section 6.4.2). The modelling demonstrated that construction plant emissions are predicted to result in a maximum short term ground level NO2 concentration of 17.5µg/m3 125m from the centre of the yard, extending up to a distance of 230m away. This reduces to 16.5µg/m3 at 275m and returns to background concentrations at distances over 420m under high wind speeds (15 m/s) (Figure 10.1). There is predicted to be no increase in short term NO2 concentrations beyond a distance of 200m from the centre of the yard for low wind speeds (1m/s); and 280m for medium wind speeds (5m/s).
15 The Bibi Heybet yard will be operated by Amec-Tekfen-Azfen (ATA) and the South Dock yard will be operated by the Caspian Shipyard Company (CSC). 16 Applicable 1 hour average (short term) and annual average (long term) standards for NO2 are 200µg/m3 and 40µg/m3 respectively. 17 This is an overestimate of emissions from the South Dock yard, as these activities will not occur simultaneously.
AIOC Chirag Oil Project Environmental & Socio-Economic Impact Assessment
Chapter 10: Construction, Installation and HUC Environmental Impact Assessment,
Mitigation and Monitoring
February 2010 10/13 Final
Figure 10.1 Maximum Short Term Ground Level Increase in NO2 Concentration (µg/m3) At Distance from Centre of Yard (High Wind Speed Conditions)
Construction yard plant emissions are predicted to contribute approximately 1.5µg/m3 to long term average concentrations of NO2 at 125m from the centre of the yard, returning to background levels at 420m. Under all conditions assessed, the modelling predicted no exceedances of ambient air quality standards in the vicinity of the yards and no discernable increase in short term or long term concentrations of NO2 more than 420m from the centre of the yard18. Table 10.4 presents the justification for assigning a score of 8, which represents a Medium Event Magnitude. Table 10.4 Event Magnitude
Parameter Explanation Rating Extent/Scale Emissions will not affect ambient air quality more than 500m from centre of the
yard (based on worst case modelling). 1
Frequency Emissions will occur continuously. 3 Duration Emissions will continue throughout the construction period. 3 Intensity Modelled long and short term concentrations of key pollutant, NO2, are predicted
to be significantly below relevant ambient air quality standards. 1
Total 8
18 Historically in Azerbaijan ambient concentrations of NO2, SO2, CO and PM10 have also been assessed against specific 24 hour and 1 hour standards. These standards were not derived using the same health based criteria as the IFC, WHO and EU guideline values and the standards derived are not widely recognised. Appendix 10C, however, does show that the historic standards (provided in Appendix 11B Update 1) will not be exceeded during onshoreconstruction and commissioning operations.
Metres from source
Met
res
from
sou
rce
Modelled concentration (µg/m3)
15-15.5
15.5 -16
16 -16.5
16.5 -17
17 –17.5
15
Centre of Yard
Short term limit = 200µg/m3
AIOC Chirag Oil Project Environmental & Socio-Economic Impact Assessment
Chapter 10: Construction, Installation and HUC Environmental Impact Assessment,
Mitigation and Monitoring
February 2010 10/14 Final
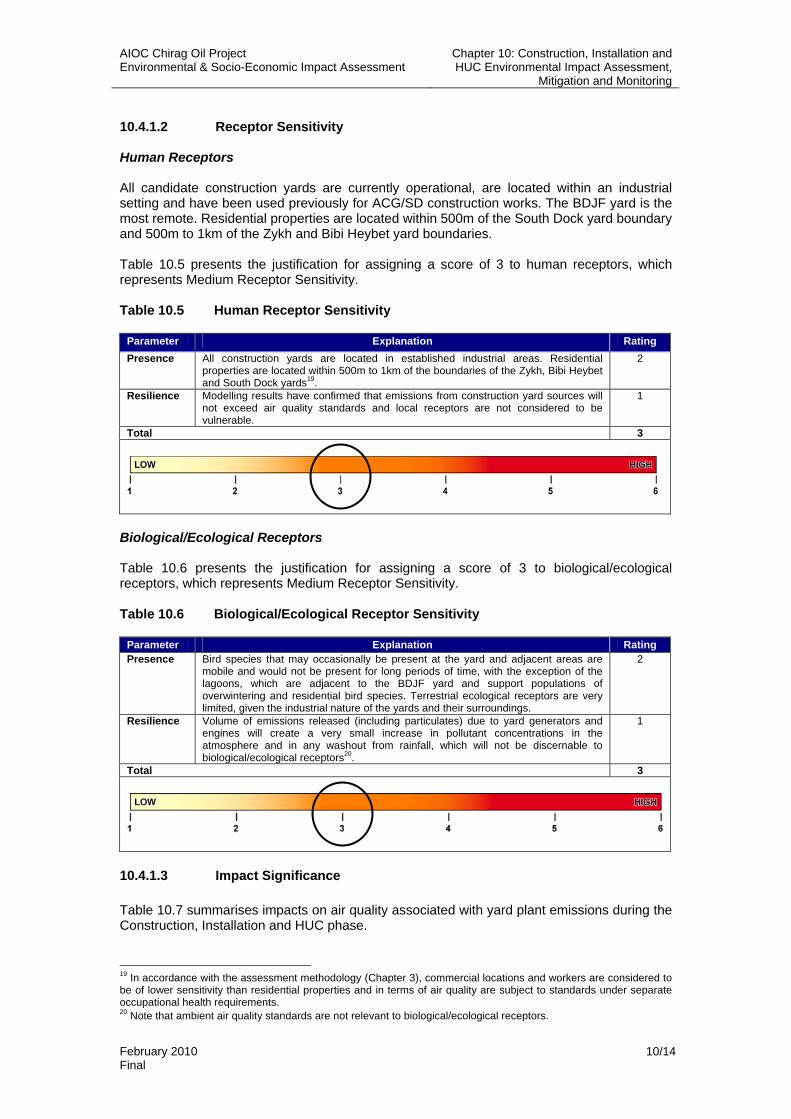
10.4.1.2 Receptor Sensitivity Human Receptors All candidate construction yards are currently operational, are located within an industrial setting and have been used previously for ACG/SD construction works. The BDJF yard is the most remote. Residential properties are located within 500m of the South Dock yard boundary and 500m to 1km of the Zykh and Bibi Heybet yard boundaries. Table 10.5 presents the justification for assigning a score of 3 to human receptors, which represents Medium Receptor Sensitivity. Table 10.5 Human Receptor Sensitivity
Parameter Explanation Rating Presence All construction yards are located in established industrial areas. Residential
properties are located within 500m to 1km of the boundaries of the Zykh, Bibi Heybet and South Dock yards19.
2
Resilience Modelling results have confirmed that emissions from construction yard sources will not exceed air quality standards and local receptors are not considered to be vulnerable.
1
Total 3
Biological/Ecological Receptors Table 10.6 presents the justification for assigning a score of 3 to biological/ecological receptors, which represents Medium Receptor Sensitivity. Table 10.6 Biological/Ecological Receptor Sensitivity
Parameter Explanation Rating Presence Bird species that may occasionally be present at the yard and adjacent areas are
mobile and would not be present for long periods of time, with the exception of the lagoons, which are adjacent to the BDJF yard and support populations of overwintering and residential bird species. Terrestrial ecological receptors are very limited, given the industrial nature of the yards and their surroundings.
2
Resilience Volume of emissions released (including particulates) due to yard generators and engines will create a very small increase in pollutant concentrations in the atmosphere and in any washout from rainfall, which will not be discernable to biological/ecological receptors20.
1
Total 3
10.4.1.3 Impact Significance Table 10.7 summarises impacts on air quality associated with yard plant emissions during the Construction, Installation and HUC phase.
19 In accordance with the assessment methodology (Chapter 3), commercial locations and workers are considered to be of lower sensitivity than residential properties and in terms of air quality are subject to standards under separate occupational health requirements. 20 Note that ambient air quality standards are not relevant to biological/ecological receptors.
AIOC Chirag Oil Project Environmental & Socio-Economic Impact Assessment
Chapter 10: Construction, Installation and HUC Environmental Impact Assessment,
Mitigation and Monitoring
February 2010 10/15 Final
Table 10.7 Impact Significance
Event Event Magnitude
Receptor Sensitivity Impact Significance
(Humans) Medium Moderate Negative Yard generators and engines Medium (Biological/Ecological)
Medium Moderate Negative
It is considered that impacts are minimised as far as practicable and necessary through the implementation of the existing control measures (see Table 10.3) and therefore no additional mitigation is required. 10.4.2 Onshore Platform Generator Commissioning 10.4.2.1 Event Magnitude As stated within Chapter 5: Section 5.4.8.3, all topside utilities will be commissioned at the topside construction yard over a 10 month period. Onshore commissioning of the 3 RB211 generators using diesel is planned to include: • Each generator run separately and intermittently for a week, for up to 8 hours a day at
a maximum load of approximately 26%; and • 3 synchronisation tests of 8 hour duration, running 2 of the 3 generators together at a
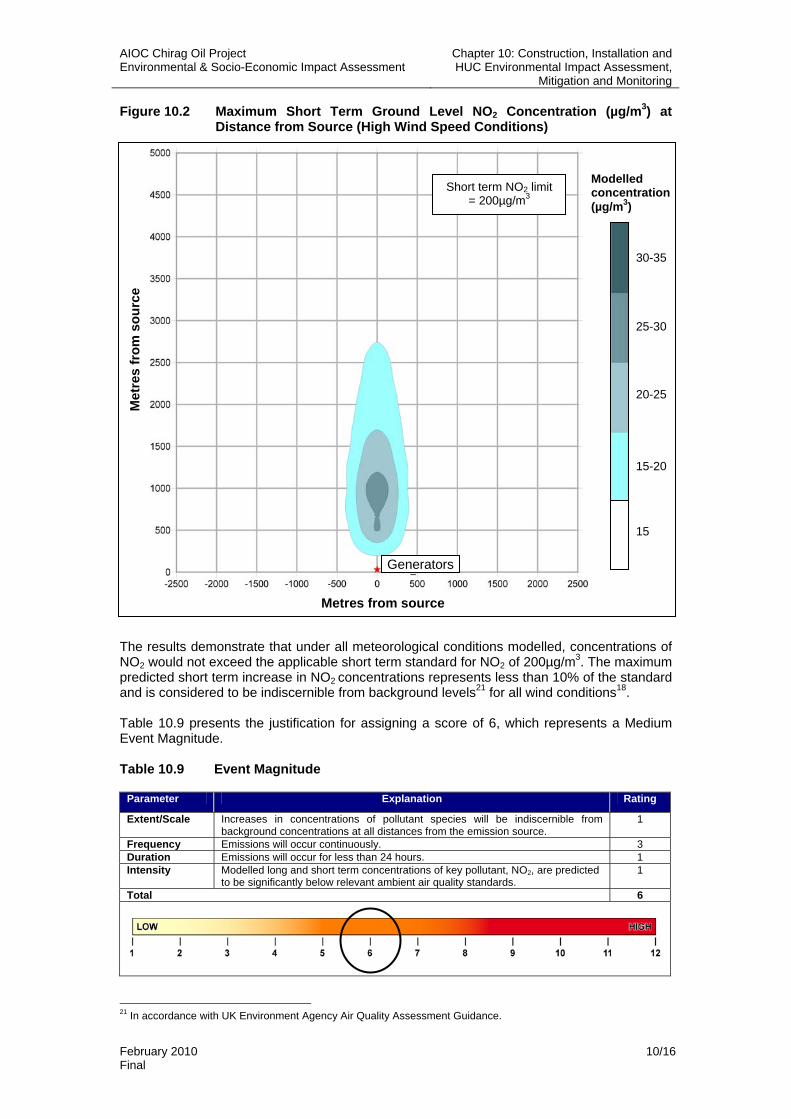
maximum load of approximately 26%. During commissioning of the compression system and topside utilities, the platform generators are planned to run separately and intermittently for approximately 6 months. Commissioning of the topside will occur at either the BDJF yard or the Bibi Heybet yard. Dispersion modelling, as described in Section 10.4.1, was undertaken to determine the likely magnitude of impacts from platform generator emissions to any nearby receptors (see Appendix 10C). Worst case impacts were considered based on the three 8 hour synchronisation tests and the results obtained were compared against the relevant short term standard for NO2. The short term concentrations obtained from the modelling under high, medium and low wind speed conditions are presented in Table 10.8. Table 10.8 Maximum Short Term NO2 Concentrations Under High, Low and Typical
Wind Conditions (Platform Generator Emissions)
Wind Conditions
Maximum short term ground level NO2 concentration
(µg/m3)
Distance from source (m)
Increase in short term concentration as % of short term
standard High (15 m/s) 30 500 7.5% Medium (5 m/s) 25 1600 5% Low (1 m/s) 16 3600 0.5%
Figure 10.2 presents the short term ground level NO2 concentrations under high wind conditions.
AIOC Chirag Oil Project Environmental & Socio-Economic Impact Assessment
Chapter 10: Construction, Installation and HUC Environmental Impact Assessment,
Mitigation and Monitoring
February 2010 10/16 Final
Figure 10.2 Maximum Short Term Ground Level NO2 Concentration (µg/m3) at Distance from Source (High Wind Speed Conditions)
The results demonstrate that under all meteorological conditions modelled, concentrations of NO2 would not exceed the applicable short term standard for NO2 of 200µg/m3. The maximum predicted short term increase in NO2 concentrations represents less than 10% of the standard and is considered to be indiscernible from background levels21 for all wind conditions18. Table 10.9 presents the justification for assigning a score of 6, which represents a Medium Event Magnitude. Table 10.9 Event Magnitude
Parameter Explanation Rating
Extent/Scale Increases in concentrations of pollutant species will be indiscernible from background concentrations at all distances from the emission source.
1
Frequency Emissions will occur continuously. 3 Duration Emissions will occur for less than 24 hours. 1 Intensity Modelled long and short term concentrations of key pollutant, NO2, are predicted
to be significantly below relevant ambient air quality standards. 1
Total 6
21 In accordance with UK Environment Agency Air Quality Assessment Guidance.
Generators
Metres from source
Met
res
from
sou
rce
Modelled concentration (µg/m3)
15-20
20-25
25-30
30-35
15
Short term NO2 limit = 200µg/m3
AIOC Chirag Oil Project Environmental & Socio-Economic Impact Assessment
Chapter 10: Construction, Installation and HUC Environmental Impact Assessment,
Mitigation and Monitoring
February 2010 10/17 Final
10.4.2.2 Receptor Sensitivity In terms of Emissions to Atmosphere, Receptor Sensitivity is considered to be the same regardless of the Event. As per Section 10.4.1.2, Receptor Sensitivity is Medium for both human and biological/ecological receptors. 10.4.2.3 Impact Significance Table 10.10 summarises impacts on air quality associated with onshore commissioning of the platform generators during the construction, installation and HUC phase. Table 10.10 Impact Significance
Event Event Magnitude Receptor Sensitivity Impact Significance Medium (Humans)
Medium Moderate Negative Onshore Platform Generator
Commissioning Medium (Biological/Ecological)
Medium Moderate Negative
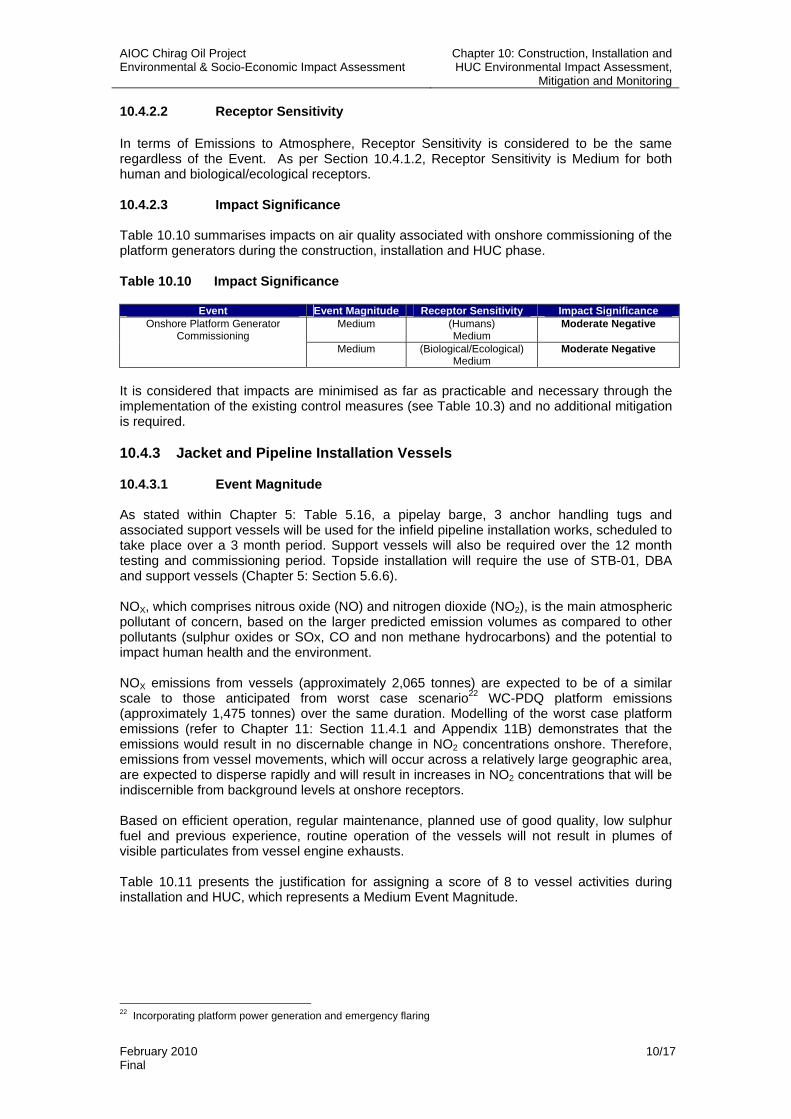
It is considered that impacts are minimised as far as practicable and necessary through the implementation of the existing control measures (see Table 10.3) and no additional mitigation is required. 10.4.3 Jacket and Pipeline Installation Vessels 10.4.3.1 Event Magnitude As stated within Chapter 5: Table 5.16, a pipelay barge, 3 anchor handling tugs and associated support vessels will be used for the infield pipeline installation works, scheduled to take place over a 3 month period. Support vessels will also be required over the 12 month testing and commissioning period. Topside installation will require the use of STB-01, DBA and support vessels (Chapter 5: Section 5.6.6). NOX, which comprises nitrous oxide (NO) and nitrogen dioxide (NO2), is the main atmospheric pollutant of concern, based on the larger predicted emission volumes as compared to other pollutants (sulphur oxides or SOx, CO and non methane hydrocarbons) and the potential to impact human health and the environment. NOX emissions from vessels (approximately 2,065 tonnes) are expected to be of a similar scale to those anticipated from worst case scenario22 WC-PDQ platform emissions (approximately 1,475 tonnes) over the same duration. Modelling of the worst case platform emissions (refer to Chapter 11: Section 11.4.1 and Appendix 11B) demonstrates that the emissions would result in no discernable change in NO2 concentrations onshore. Therefore, emissions from vessel movements, which will occur across a relatively large geographic area, are expected to disperse rapidly and will result in increases in NO2 concentrations that will be indiscernible from background levels at onshore receptors. Based on efficient operation, regular maintenance, planned use of good quality, low sulphur fuel and previous experience, routine operation of the vessels will not result in plumes of visible particulates from vessel engine exhausts. Table 10.11 presents the justification for assigning a score of 8 to vessel activities during installation and HUC, which represents a Medium Event Magnitude.
22 Incorporating platform power generation and emergency flaring
AIOC Chirag Oil Project Environmental & Socio-Economic Impact Assessment
Chapter 10: Construction, Installation and HUC Environmental Impact Assessment,
Mitigation and Monitoring
February 2010 10/18 Final
Table 10.11 Event Magnitude
Parameter Explanation Rating Extent/Scale Increases in concentrations of pollutant species will be indiscernible from
background concentrations at onshore receptors 1
Frequency Emissions will occur continuously. 3 Duration Emissions will continue throughout the installation and HUC period. 3 Intensity Modelled long and short term concentrations of key pollutant, NO2, are predicted to
be significantly below relevant ambient air quality standards. 1
Total 8
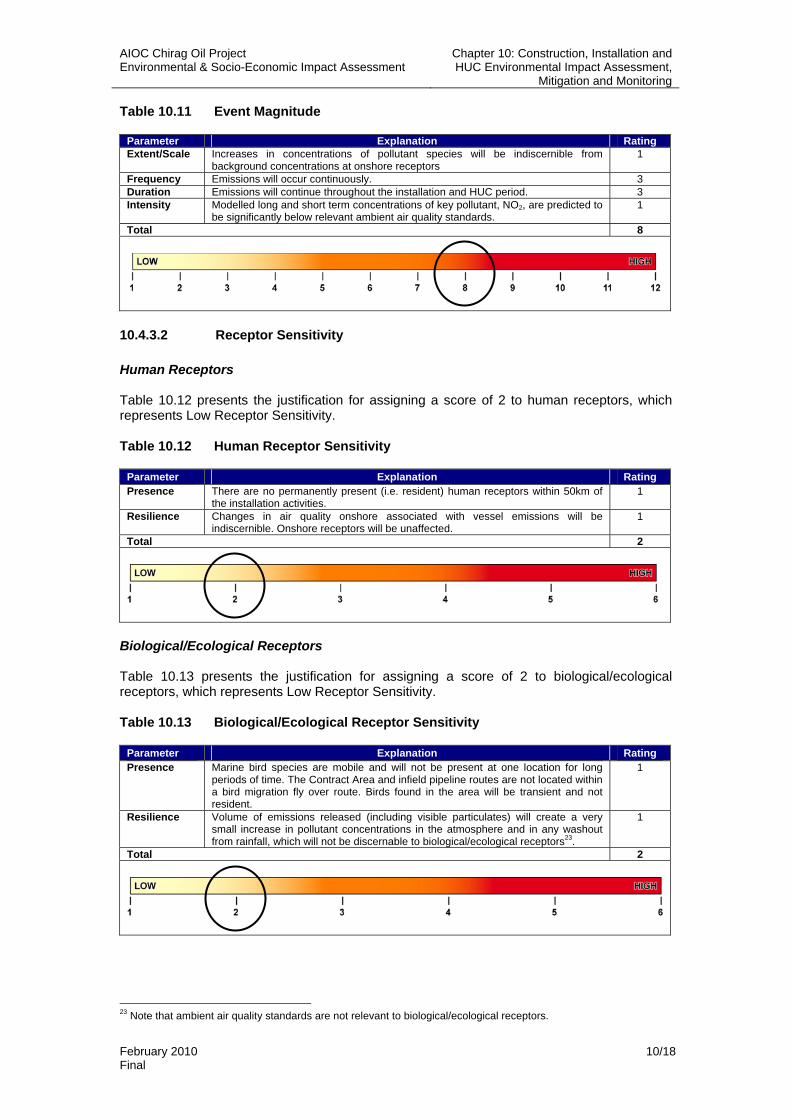
10.4.3.2 Receptor Sensitivity Human Receptors Table 10.12 presents the justification for assigning a score of 2 to human receptors, which represents Low Receptor Sensitivity. Table 10.12 Human Receptor Sensitivity
Parameter Explanation Rating Presence There are no permanently present (i.e. resident) human receptors within 50km of
the installation activities. 1
Resilience Changes in air quality onshore associated with vessel emissions will be indiscernible. Onshore receptors will be unaffected.
1
Total 2
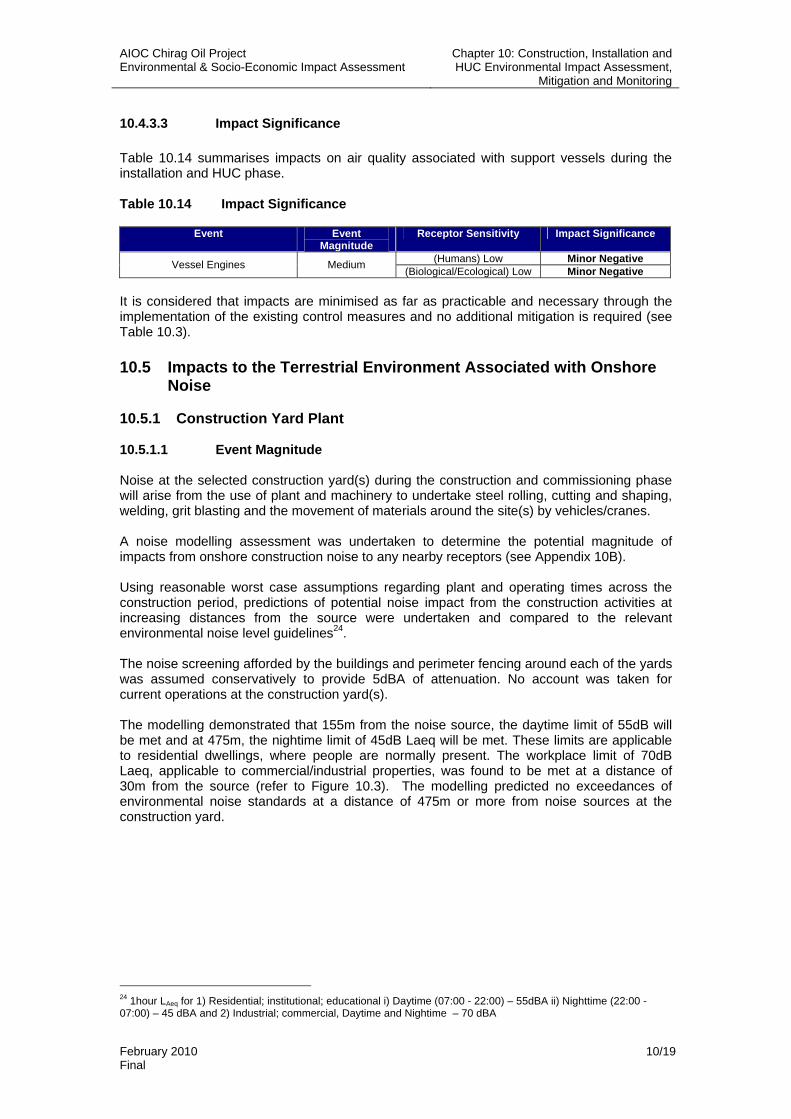
Biological/Ecological Receptors Table 10.13 presents the justification for assigning a score of 2 to biological/ecological receptors, which represents Low Receptor Sensitivity. Table 10.13 Biological/Ecological Receptor Sensitivity
Parameter Explanation Rating Presence Marine bird species are mobile and will not be present at one location for long
periods of time. The Contract Area and infield pipeline routes are not located within a bird migration fly over route. Birds found in the area will be transient and not resident.
1
Resilience Volume of emissions released (including visible particulates) will create a very small increase in pollutant concentrations in the atmosphere and in any washout from rainfall, which will not be discernable to biological/ecological receptors23.
1
Total 2
23 Note that ambient air quality standards are not relevant to biological/ecological receptors.
AIOC Chirag Oil Project Environmental & Socio-Economic Impact Assessment
Chapter 10: Construction, Installation and HUC Environmental Impact Assessment,
Mitigation and Monitoring
February 2010 10/19 Final
10.4.3.3 Impact Significance Table 10.14 summarises impacts on air quality associated with support vessels during the installation and HUC phase. Table 10.14 Impact Significance
Event Event Magnitude
Receptor Sensitivity Impact Significance
(Humans) Low Minor Negative Vessel Engines Medium (Biological/Ecological) Low Minor Negative It is considered that impacts are minimised as far as practicable and necessary through the implementation of the existing control measures and no additional mitigation is required (see Table 10.3). 10.5 Impacts to the Terrestrial Environment Associated with Onshore
Noise 10.5.1 Construction Yard Plant 10.5.1.1 Event Magnitude Noise at the selected construction yard(s) during the construction and commissioning phase will arise from the use of plant and machinery to undertake steel rolling, cutting and shaping, welding, grit blasting and the movement of materials around the site(s) by vehicles/cranes. A noise modelling assessment was undertaken to determine the potential magnitude of impacts from onshore construction noise to any nearby receptors (see Appendix 10B). Using reasonable worst case assumptions regarding plant and operating times across the construction period, predictions of potential noise impact from the construction activities at increasing distances from the source were undertaken and compared to the relevant environmental noise level guidelines24. The noise screening afforded by the buildings and perimeter fencing around each of the yards was assumed conservatively to provide 5dBA of attenuation. No account was taken for current operations at the construction yard(s). The modelling demonstrated that 155m from the noise source, the daytime limit of 55dB will be met and at 475m, the nightime limit of 45dB Laeq will be met. These limits are applicable to residential dwellings, where people are normally present. The workplace limit of 70dB Laeq, applicable to commercial/industrial properties, was found to be met at a distance of 30m from the source (refer to Figure 10.3). The modelling predicted no exceedances of environmental noise standards at a distance of 475m or more from noise sources at the construction yard.
24 1hour LAeq for 1) Residential; institutional; educational i) Daytime (07:00 - 22:00) – 55dBA ii) Nighttime (22:00 - 07:00) – 45 dBA and 2) Industrial; commercial, Daytime and Nightime – 70 dBA

AIOC Chirag Oil Project Environmental & Socio-Economic Impact Assessment
Chapter 10: Construction, Installation and HUC Environmental Impact Assessment,
Mitigation and Monitoring
February 2010 10/20 Final
Figure 10.3 Predicted Noise Levels from Plant/Machinery at the Construction Yard Table 10.15 presents the justification for assigning a score of 8 to construction yard plant operations, which represents a Medium Event Magnitude. Table 10.15 Event Magnitude
Parameter Explanation Rating Extent/Scale Noise will affect an area less than 500m from the source. 1 Frequency Noise will occur continuously during the construction period. 3 Duration Noise will be generated throughout the construction period. 3 Intensity Noise standards will not be exceeded at the nearest residential receptors. 1 Total 8
10.5.1.2 Receptor Sensitivity Human Receptors All of the candidate construction yards are currently operational, located within an industrial setting and have been used previously for ACG/SD construction works. The BDJF yard is the most remote. Residential properties are located within 500m of the South Dock yard boundary and 500m to 1km of the Zykh and Bibi Heybet yard boundaries. Table 10.16 presents the justification for assigning a score of 3 to human receptors, which represents Medium Receptor Sensitivity.
30
35
40
45
50
55
60
65
70
75
80
85
90
0 100 200 300 400 500 600 700 800 900 1000Distance from source (m)
Noi
se L
evel
(dB
) LA
eq
Predicted Noise Level
Daytime Noise Limit
Night-time Noise Limit
Industrial Noise Limit
AIOC Chirag Oil Project Environmental & Socio-Economic Impact Assessment
Chapter 10: Construction, Installation and HUC Environmental Impact Assessment,
Mitigation and Monitoring
February 2010 10/21 Final
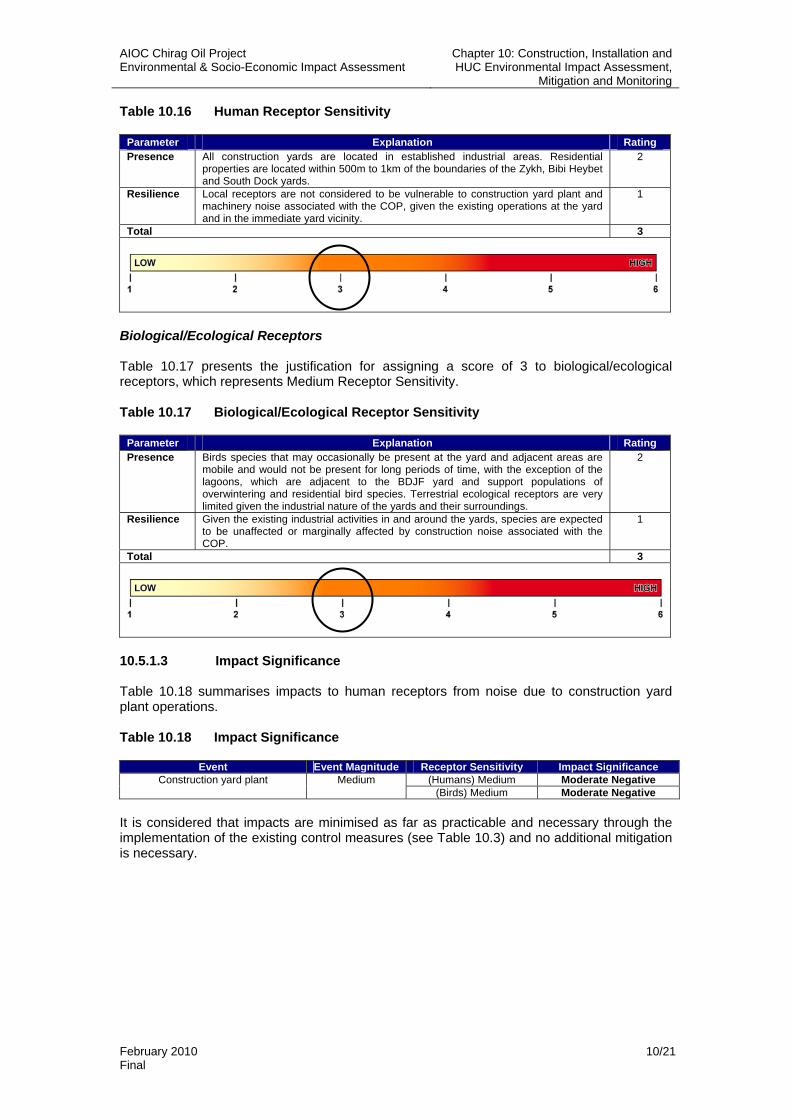
Table 10.16 Human Receptor Sensitivity
Parameter Explanation Rating Presence All construction yards are located in established industrial areas. Residential
properties are located within 500m to 1km of the boundaries of the Zykh, Bibi Heybet and South Dock yards.
2
Resilience Local receptors are not considered to be vulnerable to construction yard plant and machinery noise associated with the COP, given the existing operations at the yard and in the immediate yard vicinity.
1
Total 3
Biological/Ecological Receptors Table 10.17 presents the justification for assigning a score of 3 to biological/ecological receptors, which represents Medium Receptor Sensitivity. Table 10.17 Biological/Ecological Receptor Sensitivity
Parameter Explanation Rating Presence Birds species that may occasionally be present at the yard and adjacent areas are
mobile and would not be present for long periods of time, with the exception of the lagoons, which are adjacent to the BDJF yard and support populations of overwintering and residential bird species. Terrestrial ecological receptors are very limited given the industrial nature of the yards and their surroundings.
2
Resilience Given the existing industrial activities in and around the yards, species are expected to be unaffected or marginally affected by construction noise associated with the COP.
1
Total 3
10.5.1.3 Impact Significance Table 10.18 summarises impacts to human receptors from noise due to construction yard plant operations. Table 10.18 Impact Significance
Event Event Magnitude Receptor Sensitivity Impact Significance (Humans) Medium Moderate Negative Construction yard plant Medium
(Birds) Medium Moderate Negative It is considered that impacts are minimised as far as practicable and necessary through the implementation of the existing control measures (see Table 10.3) and no additional mitigation is necessary.
AIOC Chirag Oil Project Environmental & Socio-Economic Impact Assessment
Chapter 10: Construction, Installation and HUC Environmental Impact Assessment,
Mitigation and Monitoring
February 2010 10/22 Final
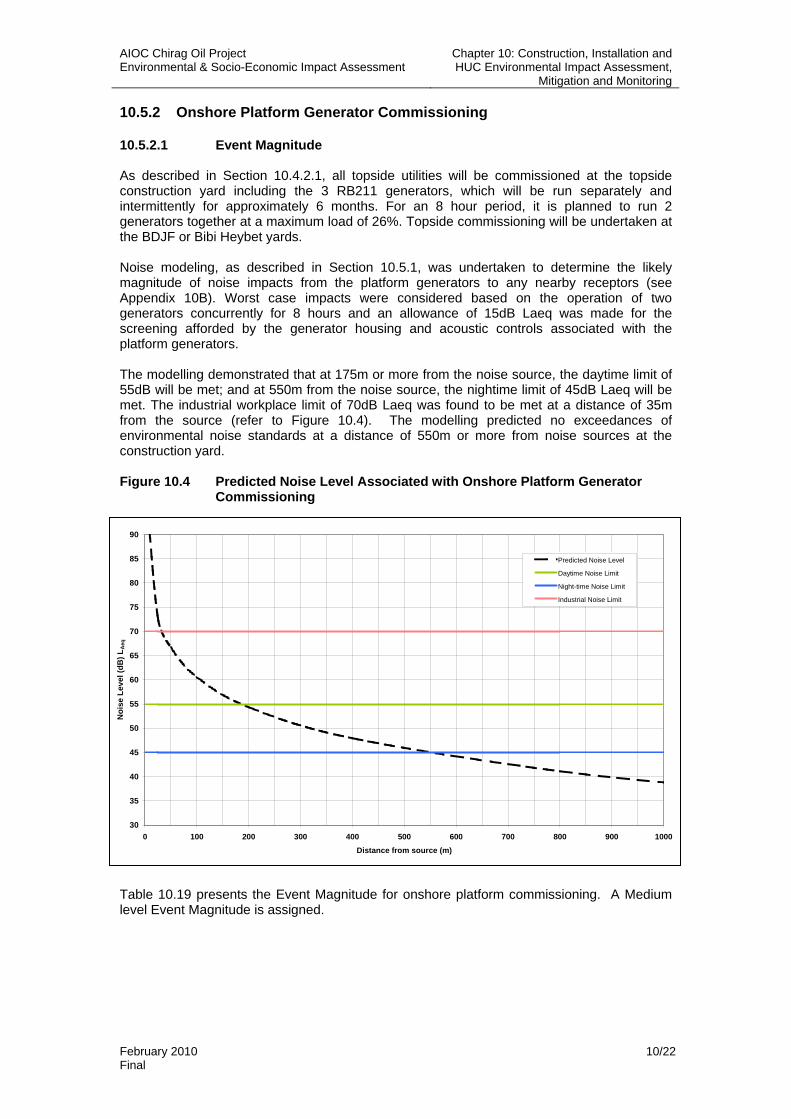
10.5.2 Onshore Platform Generator Commissioning 10.5.2.1 Event Magnitude As described in Section 10.4.2.1, all topside utilities will be commissioned at the topside construction yard including the 3 RB211 generators, which will be run separately and intermittently for approximately 6 months. For an 8 hour period, it is planned to run 2 generators together at a maximum load of 26%. Topside commissioning will be undertaken at the BDJF or Bibi Heybet yards. Noise modeling, as described in Section 10.5.1, was undertaken to determine the likely magnitude of noise impacts from the platform generators to any nearby receptors (see Appendix 10B). Worst case impacts were considered based on the operation of two generators concurrently for 8 hours and an allowance of 15dB Laeq was made for the screening afforded by the generator housing and acoustic controls associated with the platform generators. The modelling demonstrated that at 175m or more from the noise source, the daytime limit of 55dB will be met; and at 550m from the noise source, the nightime limit of 45dB Laeq will be met. The industrial workplace limit of 70dB Laeq was found to be met at a distance of 35m from the source (refer to Figure 10.4). The modelling predicted no exceedances of environmental noise standards at a distance of 550m or more from noise sources at the construction yard. Figure 10.4 Predicted Noise Level Associated with Onshore Platform Generator
Commissioning Table 10.19 presents the Event Magnitude for onshore platform commissioning. A Medium level Event Magnitude is assigned.
30
35
40
45
50
55
60
65
70
75
80
85
90
0 100 200 300 400 500 600 700 800 900 1000Distance from source (m)
Noi
se L
evel
(dB
) LA
eq
Predicted Noise Level
Daytime Noise Limit
Night-time Noise Limit
Industrial Noise Limit
AIOC Chirag Oil Project Environmental & Socio-Economic Impact Assessment
Chapter 10: Construction, Installation and HUC Environmental Impact Assessment,
Mitigation and Monitoring
February 2010 10/23 Final
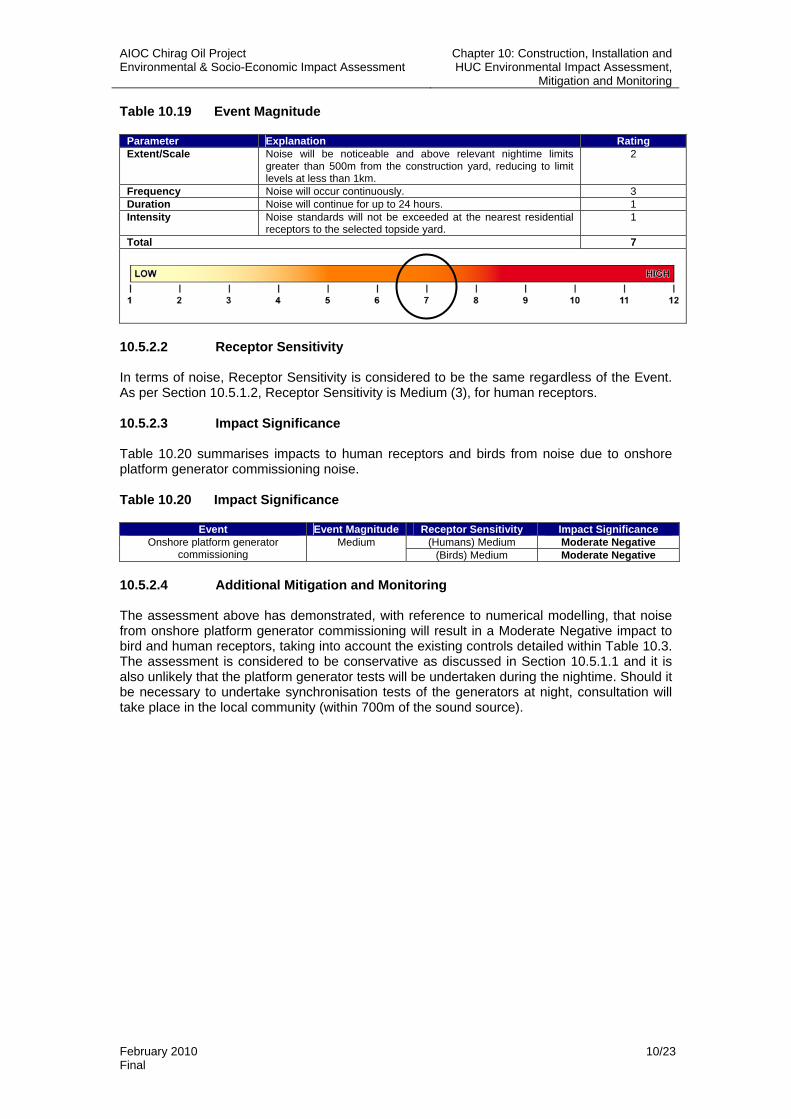
Table 10.19 Event Magnitude
Parameter Explanation Rating Extent/Scale Noise will be noticeable and above relevant nightime limits
greater than 500m from the construction yard, reducing to limit levels at less than 1km.
2
Frequency Noise will occur continuously. 3 Duration Noise will continue for up to 24 hours. 1 Intensity Noise standards will not be exceeded at the nearest residential
receptors to the selected topside yard. 1
Total 7
10.5.2.2 Receptor Sensitivity In terms of noise, Receptor Sensitivity is considered to be the same regardless of the Event. As per Section 10.5.1.2, Receptor Sensitivity is Medium (3), for human receptors. 10.5.2.3 Impact Significance Table 10.20 summarises impacts to human receptors and birds from noise due to onshore platform generator commissioning noise. Table 10.20 Impact Significance
Event Event Magnitude Receptor Sensitivity Impact Significance (Humans) Medium Moderate Negative Onshore platform generator
commissioning Medium
(Birds) Medium Moderate Negative 10.5.2.4 Additional Mitigation and Monitoring The assessment above has demonstrated, with reference to numerical modelling, that noise from onshore platform generator commissioning will result in a Moderate Negative impact to bird and human receptors, taking into account the existing controls detailed within Table 10.3. The assessment is considered to be conservative as discussed in Section 10.5.1.1 and it is also unlikely that the platform generator tests will be undertaken during the nightime. Should it be necessary to undertake synchronisation tests of the generators at night, consultation will take place in the local community (within 700m of the sound source).
AIOC Chirag Oil Project Environmental & Socio-Economic Impact Assessment
Chapter 10: Construction, Installation and HUC Environmental Impact Assessment,
Mitigation and Monitoring
February 2010 10/24 Final
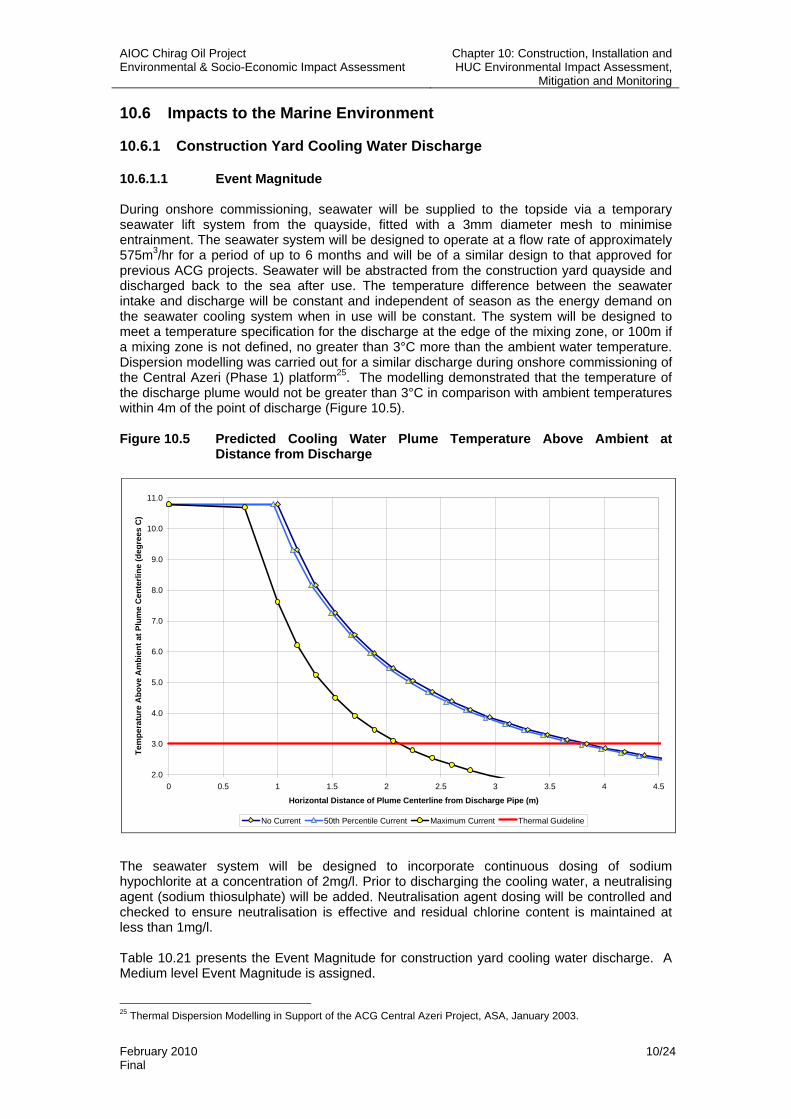
10.6 Impacts to the Marine Environment 10.6.1 Construction Yard Cooling Water Discharge 10.6.1.1 Event Magnitude During onshore commissioning, seawater will be supplied to the topside via a temporary seawater lift system from the quayside, fitted with a 3mm diameter mesh to minimise entrainment. The seawater system will be designed to operate at a flow rate of approximately 575m3/hr for a period of up to 6 months and will be of a similar design to that approved for previous ACG projects. Seawater will be abstracted from the construction yard quayside and discharged back to the sea after use. The temperature difference between the seawater intake and discharge will be constant and independent of season as the energy demand on the seawater cooling system when in use will be constant. The system will be designed to meet a temperature specification for the discharge at the edge of the mixing zone, or 100m if a mixing zone is not defined, no greater than 3°C more than the ambient water temperature. Dispersion modelling was carried out for a similar discharge during onshore commissioning of the Central Azeri (Phase 1) platform25. The modelling demonstrated that the temperature of the discharge plume would not be greater than 3°C in comparison with ambient temperatures within 4m of the point of discharge (Figure 10.5). Figure 10.5 Predicted Cooling Water Plume Temperature Above Ambient at
Distance from Discharge
The seawater system will be designed to incorporate continuous dosing of sodium hypochlorite at a concentration of 2mg/l. Prior to discharging the cooling water, a neutralising agent (sodium thiosulphate) will be added. Neutralisation agent dosing will be controlled and checked to ensure neutralisation is effective and residual chlorine content is maintained at less than 1mg/l. Table 10.21 presents the Event Magnitude for construction yard cooling water discharge. A Medium level Event Magnitude is assigned.
25 Thermal Dispersion Modelling in Support of the ACG Central Azeri Project, ASA, January 2003.
2.0
3.0
4.0
5.0
6.0
7.0
8.0
9.0
10.0
11.0
0 0.5 1 1.5 2 2.5 3 3.5 4 4.5
Horizontal Distance of Plume Centerline from Discharge Pipe (m)
Tem
pera
ture
Abo
ve A
mbi
ent a
t Plu
me
Cen
terli
ne (d
egre
es C
)
No Current 50th Percentile Current Maximum Current Thermal Guideline
AIOC Chirag Oil Project Environmental & Socio-Economic Impact Assessment
Chapter 10: Construction, Installation and HUC Environmental Impact Assessment,
Mitigation and Monitoring
February 2010 10/25 Final
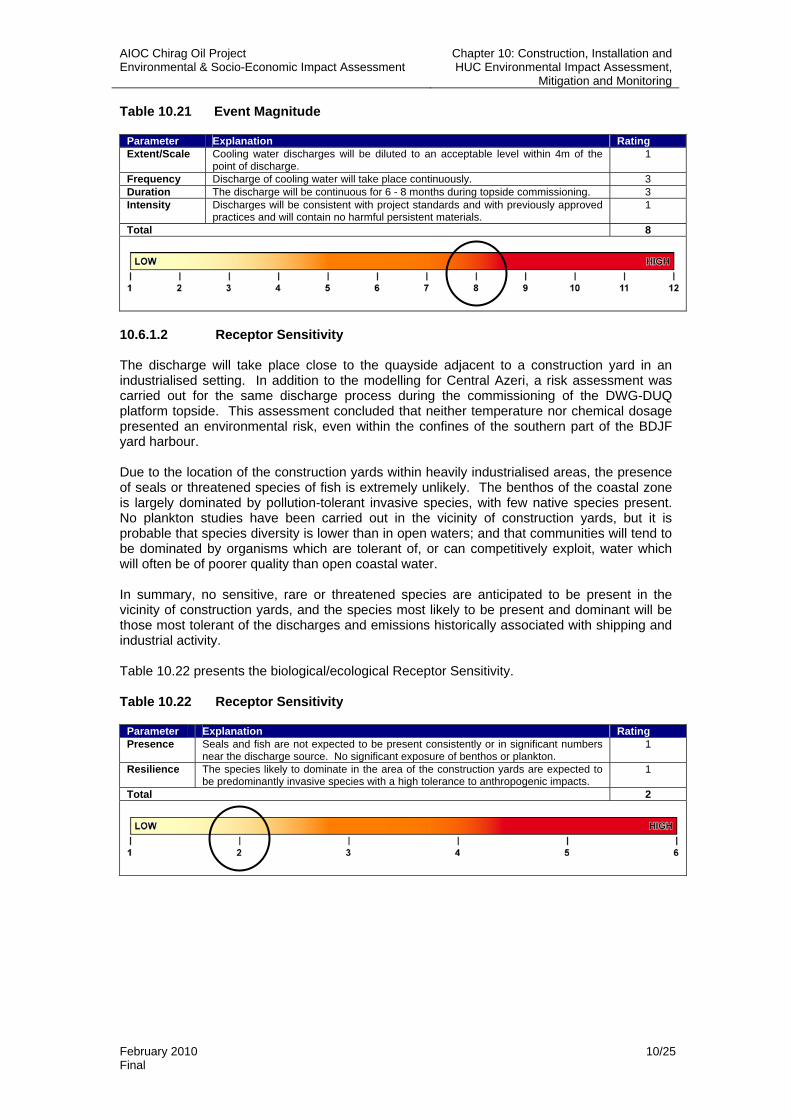
Table 10.21 Event Magnitude
Parameter Explanation Rating Extent/Scale Cooling water discharges will be diluted to an acceptable level within 4m of the
point of discharge. 1
Frequency Discharge of cooling water will take place continuously. 3 Duration The discharge will be continuous for 6 - 8 months during topside commissioning. 3 Intensity Discharges will be consistent with project standards and with previously approved
practices and will contain no harmful persistent materials. 1
Total 8
10.6.1.2 Receptor Sensitivity The discharge will take place close to the quayside adjacent to a construction yard in an industrialised setting. In addition to the modelling for Central Azeri, a risk assessment was carried out for the same discharge process during the commissioning of the DWG-DUQ platform topside. This assessment concluded that neither temperature nor chemical dosage presented an environmental risk, even within the confines of the southern part of the BDJF yard harbour. Due to the location of the construction yards within heavily industrialised areas, the presence of seals or threatened species of fish is extremely unlikely. The benthos of the coastal zone is largely dominated by pollution-tolerant invasive species, with few native species present. No plankton studies have been carried out in the vicinity of construction yards, but it is probable that species diversity is lower than in open waters; and that communities will tend to be dominated by organisms which are tolerant of, or can competitively exploit, water which will often be of poorer quality than open coastal water. In summary, no sensitive, rare or threatened species are anticipated to be present in the vicinity of construction yards, and the species most likely to be present and dominant will be those most tolerant of the discharges and emissions historically associated with shipping and industrial activity. Table 10.22 presents the biological/ecological Receptor Sensitivity. Table 10.22 Receptor Sensitivity
Parameter Explanation Rating Presence Seals and fish are not expected to be present consistently or in significant numbers
near the discharge source. No significant exposure of benthos or plankton. 1
Resilience The species likely to dominate in the area of the construction yards are expected to be predominantly invasive species with a high tolerance to anthropogenic impacts.
1
Total 2
AIOC Chirag Oil Project Environmental & Socio-Economic Impact Assessment
Chapter 10: Construction, Installation and HUC Environmental Impact Assessment,
Mitigation and Monitoring
February 2010 10/26 Final
10.6.1.3 Impact Significance Table 10.23 summarises impacts to biological/ecological receptors from construction yard onshore topside commissioning cooling water discharge. Table 10.23 Impact Significance
Event Event Magnitude Receptor Sensitivity Impact Significance Cooling water discharge from
onshore commissioning of topside Medium (Biological/Ecological)
Low Minor Negative
It is considered that impacts are minimised as far as practicable and necessary through the implementation of the existing control measures (see Table 10.3) and no additional mitigation is required. 10.6.2 Pipeline Cleaning and Hydrotest Discharge 10.6.2.1 Event Magnitude The process of gauging, hydrotesting, leak testing and integrity testing the infield pipelines (gas and oil, water injection and produced water) will use seawater dosed with a biocide, oxygen scavenger and tracer dye. The products planned to be used include a THPS-based biocide product (tetrakys-hydroxymethyl phosphonium sulphate), ammonium bisulphite (oxygen scavenger) and fluorescein (tracer dye). All 3 COP pipeline hydrotest chemicals (biocide, oxygen scavenger and tracer dye) have been subject to a comprehensive risk assessment for ACG Phases 1, 2 and 3 and for Shah Deniz Stage 1. The oxygen scavenger and tracer dye products are both of very low toxicity and have low bioaccumulation potential. 2 THPS-containing biocide products (B TROSKIL 88 and BIOTREAT 4535) are under consideration both of which meet the performance standards established by previous ACG studies and approved by the MENR. THPS biocide products have been shown to degrade by more than 90% within six months in the pipeline and an extensive World Health Organisation review has provided evidence that the biocide hydrolyses rapidly in the environment. Experimental studies conducted for ACG Phase 2, Phase 3 and Produced Water Disposal Projects has indicated that toxicity also reduces by 90% during a 6 month holding period26. On the basis of the aforementioned studies, it was estimated conservatively that: • For degraded biocide (i.e. biocide which had been in the pipeline for more than 6
months), a dilution ratio of 300:1 would be required to reach the point at which no biological effects would occur; and
• For ‘fresh’ biocide (e.g. discharged as overfill during initial flooding operations), a dilution ratio of 3,000:1 would be required to reach the point at which no biological effects would occur.
Table 5.18 in Chapter 5: Project Description27 indicates that a number of separate discharges of hydrotest water will take place. These will range in volume up to 4,675m3. These discharges will be of limited duration (from approximately 1 minute to approximately 8 hours) and will not overlap in time and space. The discharge of hydrotest water from infield pipelines was thoroughly assessed for ACG Phase 2 and a risk assessment submitted to, and approved by, the MENR. To provide further information specific to the COP on the volume of water potentially impacted, a representative range of discharges (covering depth, volume and
26 Refer to DWG Hydrotest Final Report 2007 27 As stated in Chapter 5: Section 5.5, the design and routing of the infield pipelines is ongoing throughout Define. The cleaning and hydrotest discharge volumes and associated chemical dosing, represent the likely worst case for the purposes of this assessment.
AIOC Chirag Oil Project Environmental & Socio-Economic Impact Assessment
Chapter 10: Construction, Installation and HUC Environmental Impact Assessment,
Mitigation and Monitoring
February 2010 10/27 Final
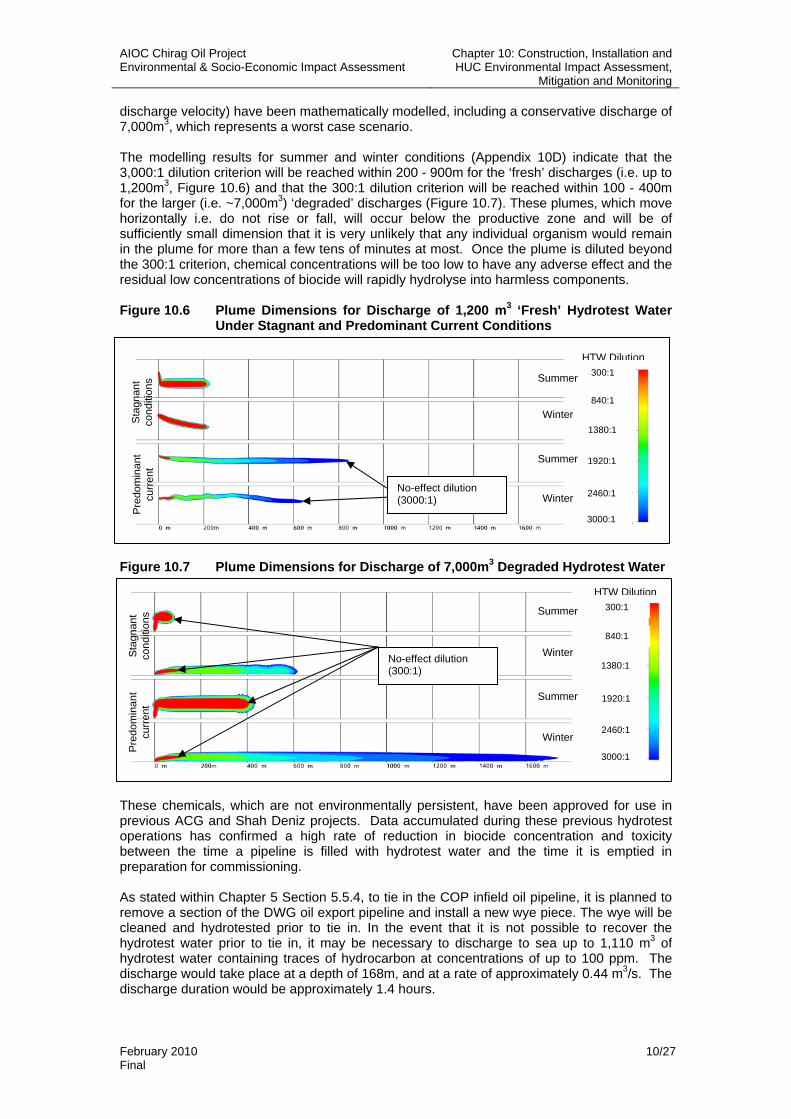
discharge velocity) have been mathematically modelled, including a conservative discharge of 7,000m3, which represents a worst case scenario. The modelling results for summer and winter conditions (Appendix 10D) indicate that the 3,000:1 dilution criterion will be reached within 200 - 900m for the ‘fresh’ discharges (i.e. up to 1,200m3, Figure 10.6) and that the 300:1 dilution criterion will be reached within 100 - 400m for the larger (i.e. ~7,000m3) ‘degraded’ discharges (Figure 10.7). These plumes, which move horizontally i.e. do not rise or fall, will occur below the productive zone and will be of sufficiently small dimension that it is very unlikely that any individual organism would remain in the plume for more than a few tens of minutes at most. Once the plume is diluted beyond the 300:1 criterion, chemical concentrations will be too low to have any adverse effect and the residual low concentrations of biocide will rapidly hydrolyse into harmless components. Figure 10.6 Plume Dimensions for Discharge of 1,200 m3 ‘Fresh’ Hydrotest Water
Under Stagnant and Predominant Current Conditions
Figure 10.7 Plume Dimensions for Discharge of 7,000m3 Degraded Hydrotest Water
These chemicals, which are not environmentally persistent, have been approved for use in previous ACG and Shah Deniz projects. Data accumulated during these previous hydrotest operations has confirmed a high rate of reduction in biocide concentration and toxicity between the time a pipeline is filled with hydrotest water and the time it is emptied in preparation for commissioning. As stated within Chapter 5 Section 5.5.4, to tie in the COP infield oil pipeline, it is planned to remove a section of the DWG oil export pipeline and install a new wye piece. The wye will be cleaned and hydrotested prior to tie in. In the event that it is not possible to recover the hydrotest water prior to tie in, it may be necessary to discharge to sea up to 1,110 m3 of hydrotest water containing traces of hydrocarbon at concentrations of up to 100 ppm. The discharge would take place at a depth of 168m, and at a rate of approximately 0.44 m3/s. The discharge duration would be approximately 1.4 hours.
HTW Dilution300:1
840:1
1380:1
1920:1
2460:1
3000:1
No-effect dilution (3000:1)
Pre
dom
inan
t cu
rren
t S
tagn
ant
cond
ition
s Summer
Summer
Winter
Winter
HTW Dilution300:1
840:1
1380:1
1920:1
2460:1
3000:1
No-effect dilution (300:1)
Sta
gnan
t co
nditi
ons
Pre
dom
inan
t cu
rren
t
Summer
Summer
Winter
Winter
AIOC Chirag Oil Project Environmental & Socio-Economic Impact Assessment
Chapter 10: Construction, Installation and HUC Environmental Impact Assessment,
Mitigation and Monitoring
February 2010 10/28 Final
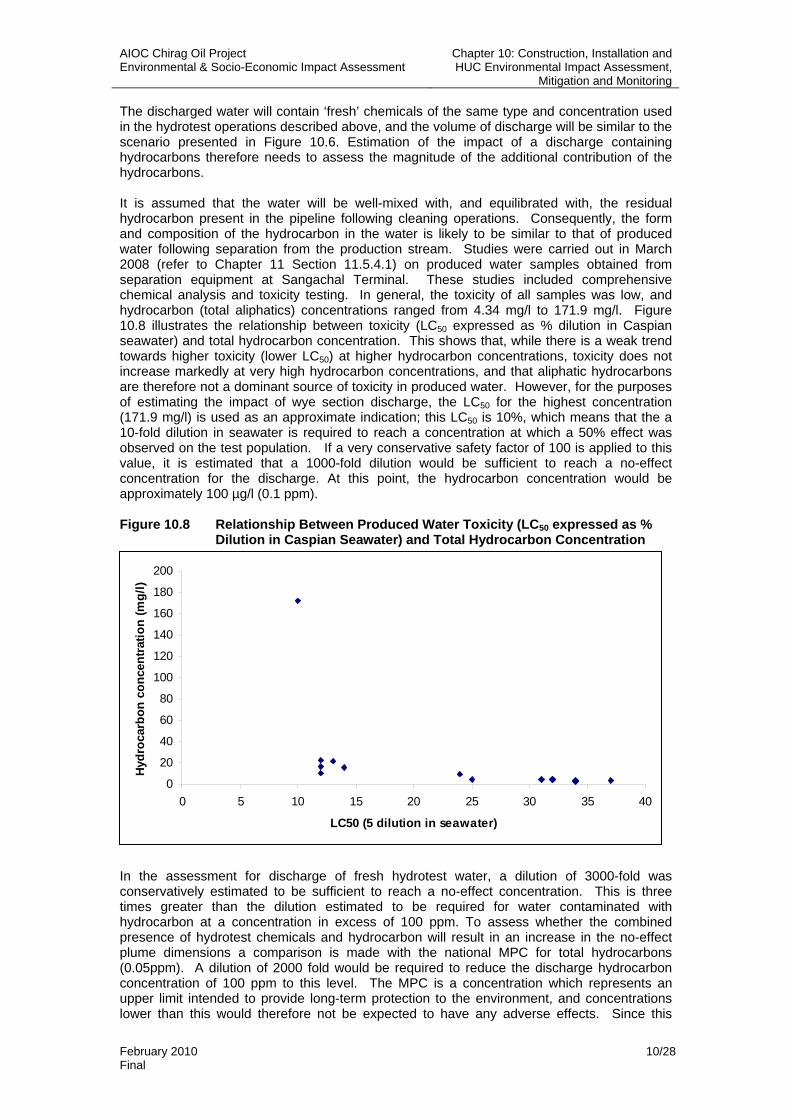
The discharged water will contain ‘fresh’ chemicals of the same type and concentration used in the hydrotest operations described above, and the volume of discharge will be similar to the scenario presented in Figure 10.6. Estimation of the impact of a discharge containing hydrocarbons therefore needs to assess the magnitude of the additional contribution of the hydrocarbons. It is assumed that the water will be well-mixed with, and equilibrated with, the residual hydrocarbon present in the pipeline following cleaning operations. Consequently, the form and composition of the hydrocarbon in the water is likely to be similar to that of produced water following separation from the production stream. Studies were carried out in March 2008 (refer to Chapter 11 Section 11.5.4.1) on produced water samples obtained from separation equipment at Sangachal Terminal. These studies included comprehensive chemical analysis and toxicity testing. In general, the toxicity of all samples was low, and hydrocarbon (total aliphatics) concentrations ranged from 4.34 mg/l to 171.9 mg/l. Figure 10.8 illustrates the relationship between toxicity (LC50 expressed as % dilution in Caspian seawater) and total hydrocarbon concentration. This shows that, while there is a weak trend towards higher toxicity (lower LC50) at higher hydrocarbon concentrations, toxicity does not increase markedly at very high hydrocarbon concentrations, and that aliphatic hydrocarbons are therefore not a dominant source of toxicity in produced water. However, for the purposes of estimating the impact of wye section discharge, the LC50 for the highest concentration (171.9 mg/l) is used as an approximate indication; this LC50 is 10%, which means that the a 10-fold dilution in seawater is required to reach a concentration at which a 50% effect was observed on the test population. If a very conservative safety factor of 100 is applied to this value, it is estimated that a 1000-fold dilution would be sufficient to reach a no-effect concentration for the discharge. At this point, the hydrocarbon concentration would be approximately 100 µg/l (0.1 ppm). Figure 10.8 Relationship Between Produced Water Toxicity (LC50 expressed as %
Dilution in Caspian Seawater) and Total Hydrocarbon Concentration In the assessment for discharge of fresh hydrotest water, a dilution of 3000-fold was conservatively estimated to be sufficient to reach a no-effect concentration. This is three times greater than the dilution estimated to be required for water contaminated with hydrocarbon at a concentration in excess of 100 ppm. To assess whether the combined presence of hydrotest chemicals and hydrocarbon will result in an increase in the no-effect plume dimensions a comparison is made with the national MPC for total hydrocarbons (0.05ppm). A dilution of 2000 fold would be required to reduce the discharge hydrocarbon concentration of 100 ppm to this level. The MPC is a concentration which represents an upper limit intended to provide long-term protection to the environment, and concentrations lower than this would therefore not be expected to have any adverse effects. Since this
0
20
40
60
80
100
120
140
160
180
200
0 5 10 15 20 25 30 35 40
LC50 (5 dilution in seawater)
Hydr
ocar
bon
conc
entra
tion
(mg/
l)
AIOC Chirag Oil Project Environmental & Socio-Economic Impact Assessment
Chapter 10: Construction, Installation and HUC Environmental Impact Assessment,
Mitigation and Monitoring
February 2010 10/29 Final
concentration will be reached within the plume predicted for hydrotest chemicals alone, the presence of hydrocarbons at the margins of the hydrotest plume will not contribute any additional effects. It is therefore concluded that the impact of this discharge will be similar, in terms of plume dimension and duration, to that predicted for a 1,200m3 discharge of hydrotest water. Table 10.24 presents the justification for assigning a score of 5, which represents a Medium Event Magnitude for all hydrotest discharges. Table 10.24 Event Magnitude
Parameter Explanation Rating Extent/Scale Hydrotest discharges will be diluted to a ‘no effect’ level within 500m of the source. 1 Frequency Discharges will take place up to 50 times. 2 Duration Individual events will have a duration of between a few minutes and a few hours. 1 Intensity Discharges will be consistent with project standards and with previously approved
practices and will contain no harmful persistent materials. 1
Total 5
10.6.2.2 Receptor Sensitivity Small volume (i.e. approximately 1-20m3) discharges of short duration will take place near the sea surface. No receptors are considered to be sensitive to these small discharges. Dispersion modelling (see Appendix 10D) indicates that a no-effect concentration will be reached within 300m of the source for all surface and near-surface hydrotest discharges. Larger volume discharges of treated seawater will occur near the seabed and at a level below the productive zone. Plankton (which is present in highest abundance at or near the productive zone around the thermocline) is not considered to be sensitive to these discharges. While it is possible that seals and bottom-feeding fish may occasionally be present near the location of seabed discharges, the frequency of discharge occurrence is low and the maximum zone of potential impact will be within a radius of no more than 800m. It is therefore considered that seals and fish do not have a particular sensitivity to near seabed discharges. As the seabed discharges will be discharged in an upward direction, the dispersion plumes will have minimum contact with the seabed and so the potential for benthic invertebrates to be exposed to the hydrotest discharges is low. Table 10.25 presents the justification for assigning a score of 2 to biological/ecological receptors, which represents Low Receptor Sensitivity. Table 10.25 Receptor Sensitivity
Parameter Explanation Rating Presence Seals and fish are not expected to be present consistently or in significant numbers
near the seabed discharge sources. No significant exposure of benthos or plankton. 1
Resilience Although exposure is unlikely, seals and fish would not be adversely affected by short-term exposure to the discharges.
1
Total 2
AIOC Chirag Oil Project Environmental & Socio-Economic Impact Assessment
Chapter 10: Construction, Installation and HUC Environmental Impact Assessment,
Mitigation and Monitoring
February 2010 10/30 Final
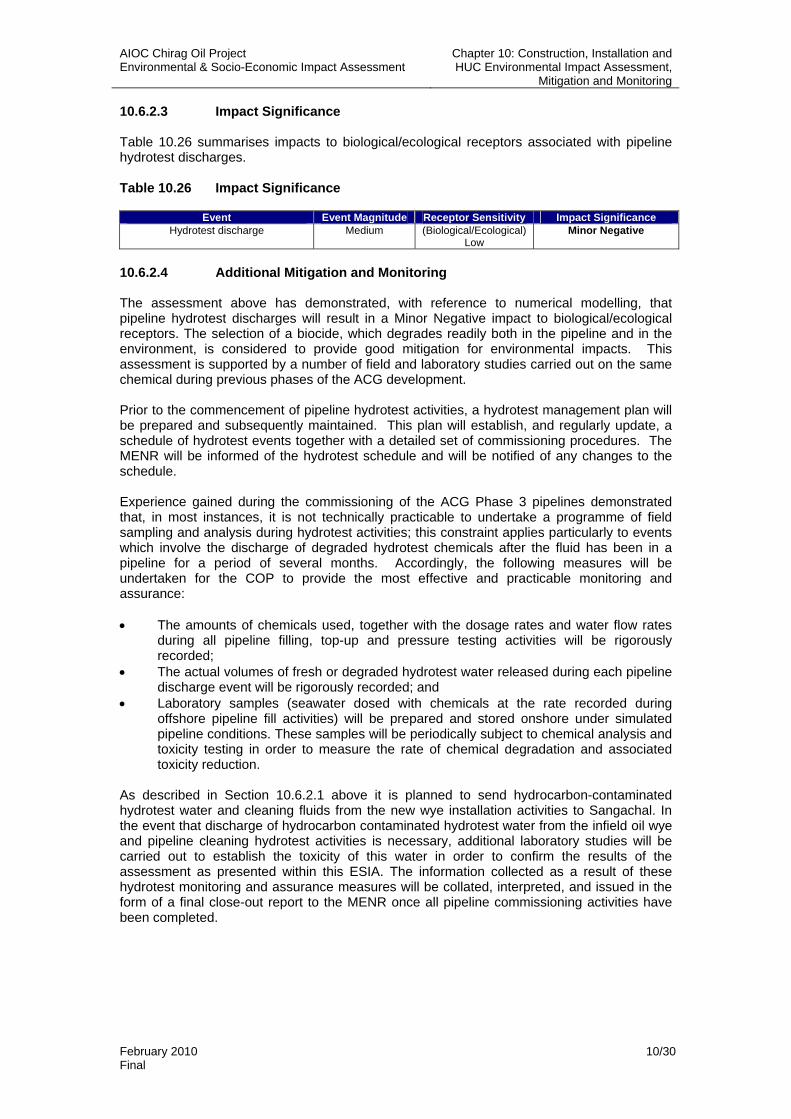
10.6.2.3 Impact Significance Table 10.26 summarises impacts to biological/ecological receptors associated with pipeline hydrotest discharges. Table 10.26 Impact Significance
Event Event Magnitude Receptor Sensitivity Impact Significance Hydrotest discharge Medium (Biological/Ecological)
Low Minor Negative
10.6.2.4 Additional Mitigation and Monitoring The assessment above has demonstrated, with reference to numerical modelling, that pipeline hydrotest discharges will result in a Minor Negative impact to biological/ecological receptors. The selection of a biocide, which degrades readily both in the pipeline and in the environment, is considered to provide good mitigation for environmental impacts. This assessment is supported by a number of field and laboratory studies carried out on the same chemical during previous phases of the ACG development. Prior to the commencement of pipeline hydrotest activities, a hydrotest management plan will be prepared and subsequently maintained. This plan will establish, and regularly update, a schedule of hydrotest events together with a detailed set of commissioning procedures. The MENR will be informed of the hydrotest schedule and will be notified of any changes to the schedule. Experience gained during the commissioning of the ACG Phase 3 pipelines demonstrated that, in most instances, it is not technically practicable to undertake a programme of field sampling and analysis during hydrotest activities; this constraint applies particularly to events which involve the discharge of degraded hydrotest chemicals after the fluid has been in a pipeline for a period of several months. Accordingly, the following measures will be undertaken for the COP to provide the most effective and practicable monitoring and assurance: • The amounts of chemicals used, together with the dosage rates and water flow rates
during all pipeline filling, top-up and pressure testing activities will be rigorously recorded;
• The actual volumes of fresh or degraded hydrotest water released during each pipeline discharge event will be rigorously recorded; and
• Laboratory samples (seawater dosed with chemicals at the rate recorded during offshore pipeline fill activities) will be prepared and stored onshore under simulated pipeline conditions. These samples will be periodically subject to chemical analysis and toxicity testing in order to measure the rate of chemical degradation and associated toxicity reduction.
As described in Section 10.6.2.1 above it is planned to send hydrocarbon-contaminated hydrotest water and cleaning fluids from the new wye installation activities to Sangachal. In the event that discharge of hydrocarbon contaminated hydrotest water from the infield oil wye and pipeline cleaning hydrotest activities is necessary, additional laboratory studies will be carried out to establish the toxicity of this water in order to confirm the results of the assessment as presented within this ESIA. The information collected as a result of these hydrotest monitoring and assurance measures will be collated, interpreted, and issued in the form of a final close-out report to the MENR once all pipeline commissioning activities have been completed.
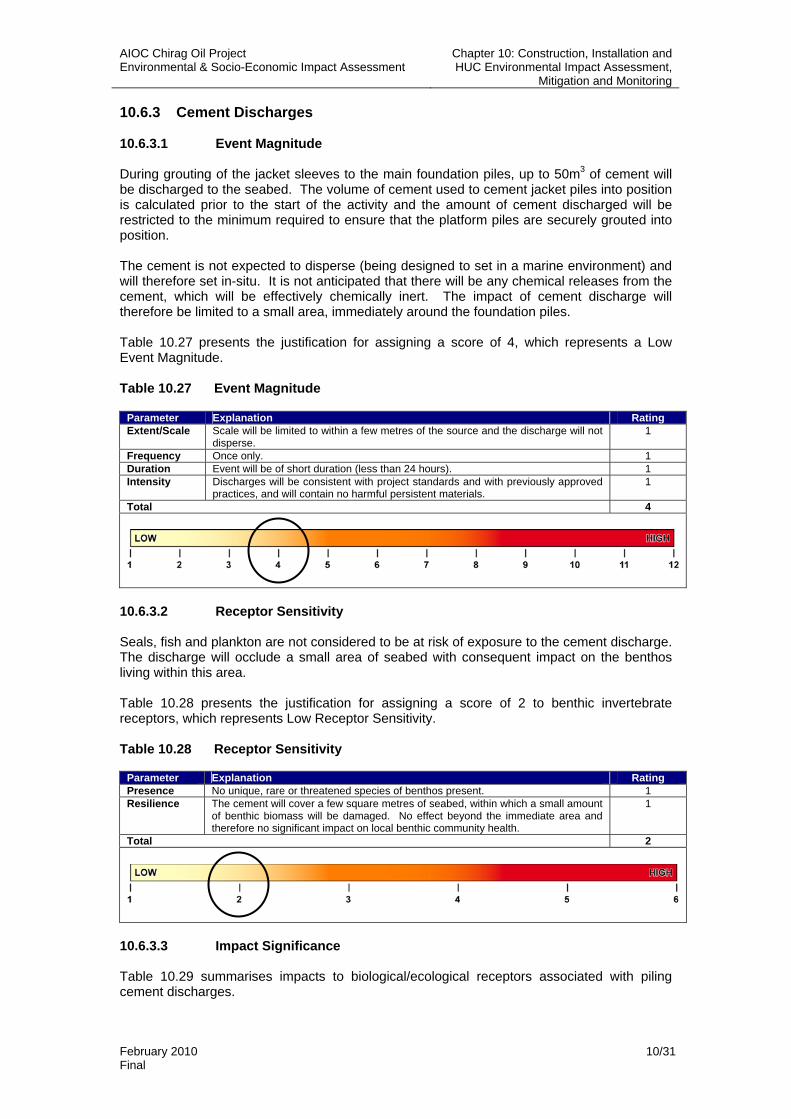
AIOC Chirag Oil Project Environmental & Socio-Economic Impact Assessment
Chapter 10: Construction, Installation and HUC Environmental Impact Assessment,
Mitigation and Monitoring
February 2010 10/31 Final
10.6.3 Cement Discharges 10.6.3.1 Event Magnitude During grouting of the jacket sleeves to the main foundation piles, up to 50m3 of cement will be discharged to the seabed. The volume of cement used to cement jacket piles into position is calculated prior to the start of the activity and the amount of cement discharged will be restricted to the minimum required to ensure that the platform piles are securely grouted into position. The cement is not expected to disperse (being designed to set in a marine environment) and will therefore set in-situ. It is not anticipated that there will be any chemical releases from the cement, which will be effectively chemically inert. The impact of cement discharge will therefore be limited to a small area, immediately around the foundation piles. Table 10.27 presents the justification for assigning a score of 4, which represents a Low Event Magnitude. Table 10.27 Event Magnitude
Parameter Explanation Rating Extent/Scale Scale will be limited to within a few metres of the source and the discharge will not
disperse. 1
Frequency Once only. 1 Duration Event will be of short duration (less than 24 hours). 1 Intensity Discharges will be consistent with project standards and with previously approved
practices, and will contain no harmful persistent materials. 1
Total 4
10.6.3.2 Receptor Sensitivity Seals, fish and plankton are not considered to be at risk of exposure to the cement discharge. The discharge will occlude a small area of seabed with consequent impact on the benthos living within this area. Table 10.28 presents the justification for assigning a score of 2 to benthic invertebrate receptors, which represents Low Receptor Sensitivity. Table 10.28 Receptor Sensitivity
Parameter Explanation Rating Presence No unique, rare or threatened species of benthos present. 1 Resilience The cement will cover a few square metres of seabed, within which a small amount
of benthic biomass will be damaged. No effect beyond the immediate area and therefore no significant impact on local benthic community health.
1
Total 2
10.6.3.3 Impact Significance Table 10.29 summarises impacts to biological/ecological receptors associated with piling cement discharges.
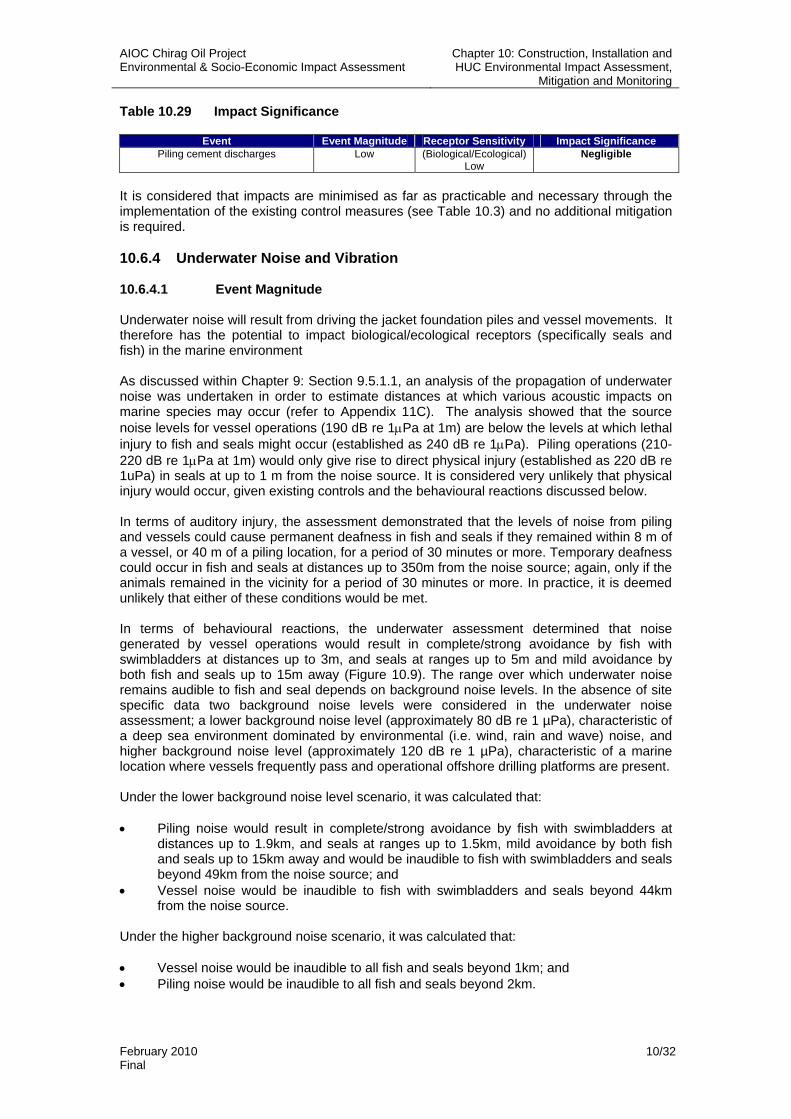
AIOC Chirag Oil Project Environmental & Socio-Economic Impact Assessment
Chapter 10: Construction, Installation and HUC Environmental Impact Assessment,
Mitigation and Monitoring
February 2010 10/32 Final
Table 10.29 Impact Significance
Event Event Magnitude Receptor Sensitivity Impact Significance Piling cement discharges Low (Biological/Ecological)
Low Negligible
It is considered that impacts are minimised as far as practicable and necessary through the implementation of the existing control measures (see Table 10.3) and no additional mitigation is required. 10.6.4 Underwater Noise and Vibration 10.6.4.1 Event Magnitude Underwater noise will result from driving the jacket foundation piles and vessel movements. It therefore has the potential to impact biological/ecological receptors (specifically seals and fish) in the marine environment As discussed within Chapter 9: Section 9.5.1.1, an analysis of the propagation of underwater noise was undertaken in order to estimate distances at which various acoustic impacts on marine species may occur (refer to Appendix 11C). The analysis showed that the source noise levels for vessel operations (190 dB re 1µPa at 1m) are below the levels at which lethal injury to fish and seals might occur (established as 240 dB re 1µPa). Piling operations (210-220 dB re 1µPa at 1m) would only give rise to direct physical injury (established as 220 dB re 1uPa) in seals at up to 1 m from the noise source. It is considered very unlikely that physical injury would occur, given existing controls and the behavioural reactions discussed below. In terms of auditory injury, the assessment demonstrated that the levels of noise from piling and vessels could cause permanent deafness in fish and seals if they remained within 8 m of a vessel, or 40 m of a piling location, for a period of 30 minutes or more. Temporary deafness could occur in fish and seals at distances up to 350m from the noise source; again, only if the animals remained in the vicinity for a period of 30 minutes or more. In practice, it is deemed unlikely that either of these conditions would be met. In terms of behavioural reactions, the underwater assessment determined that noise generated by vessel operations would result in complete/strong avoidance by fish with swimbladders at distances up to 3m, and seals at ranges up to 5m and mild avoidance by both fish and seals up to 15m away (Figure 10.9). The range over which underwater noise remains audible to fish and seal depends on background noise levels. In the absence of site specific data two background noise levels were considered in the underwater noise assessment; a lower background noise level (approximately 80 dB re 1 µPa), characteristic of a deep sea environment dominated by environmental (i.e. wind, rain and wave) noise, and higher background noise level (approximately 120 dB re 1 µPa), characteristic of a marine location where vessels frequently pass and operational offshore drilling platforms are present. Under the lower background noise level scenario, it was calculated that: • Piling noise would result in complete/strong avoidance by fish with swimbladders at
distances up to 1.9km, and seals at ranges up to 1.5km, mild avoidance by both fish and seals up to 15km away and would be inaudible to fish with swimbladders and seals beyond 49km from the noise source; and
• Vessel noise would be inaudible to fish with swimbladders and seals beyond 44km from the noise source.
Under the higher background noise scenario, it was calculated that: • Vessel noise would be inaudible to all fish and seals beyond 1km; and • Piling noise would be inaudible to all fish and seals beyond 2km.
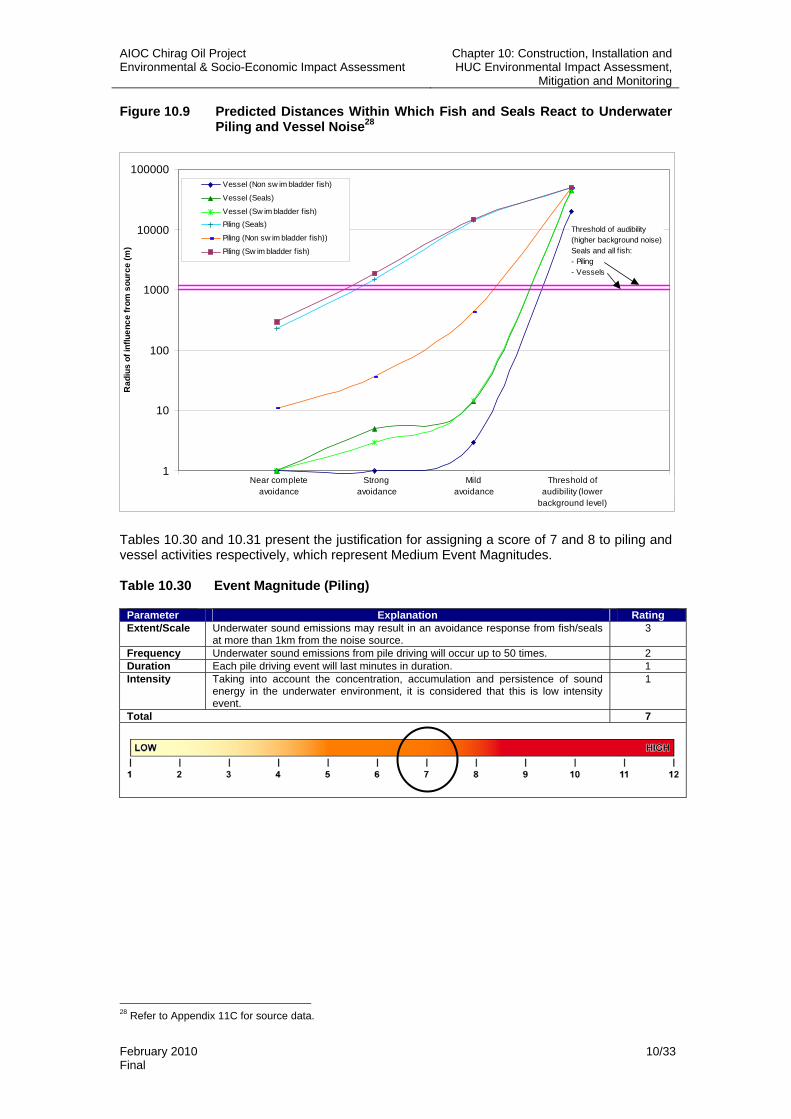
AIOC Chirag Oil Project Environmental & Socio-Economic Impact Assessment
Chapter 10: Construction, Installation and HUC Environmental Impact Assessment,
Mitigation and Monitoring
February 2010 10/33 Final
1
10
100
1000
10000
100000
0 1 2 3 4 5
Rad
ius
of in
fluen
ce fr
om s
ourc
e (m
)
Vessel (Non sw im bladder fish)
Vessel (Seals)
Vessel (Sw im bladder fish)Piling (Seals)
Piling (Non sw im bladder f ish))
Piling (Sw im bladder f ish)
Near complete avoidance
Strong avoidance
Mild avoidance
Threshold of audibility (lower
background level)
Threshold of audibility (higher background noise) Seals and all f ish:- Piling- Vessels
Figure 10.9 Predicted Distances Within Which Fish and Seals React to Underwater Piling and Vessel Noise28
Tables 10.30 and 10.31 present the justification for assigning a score of 7 and 8 to piling and vessel activities respectively, which represent Medium Event Magnitudes. Table 10.30 Event Magnitude (Piling)
Parameter Explanation Rating Extent/Scale Underwater sound emissions may result in an avoidance response from fish/seals
at more than 1km from the noise source. 3
Frequency Underwater sound emissions from pile driving will occur up to 50 times. 2 Duration Each pile driving event will last minutes in duration. 1 Intensity Taking into account the concentration, accumulation and persistence of sound
energy in the underwater environment, it is considered that this is low intensity event.
1
Total 7
28 Refer to Appendix 11C for source data.
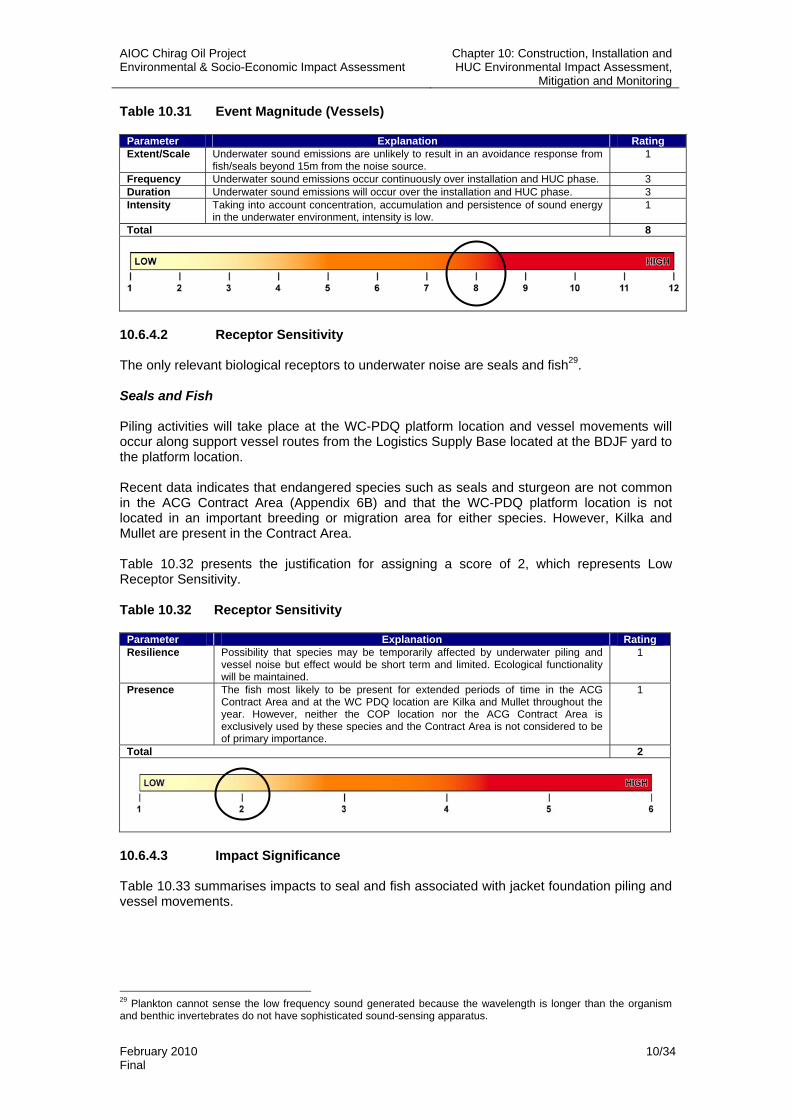
AIOC Chirag Oil Project Environmental & Socio-Economic Impact Assessment
Chapter 10: Construction, Installation and HUC Environmental Impact Assessment,
Mitigation and Monitoring
February 2010 10/34 Final
Table 10.31 Event Magnitude (Vessels)
Parameter Explanation Rating Extent/Scale Underwater sound emissions are unlikely to result in an avoidance response from
fish/seals beyond 15m from the noise source. 1
Frequency Underwater sound emissions occur continuously over installation and HUC phase. 3 Duration Underwater sound emissions will occur over the installation and HUC phase. 3 Intensity Taking into account concentration, accumulation and persistence of sound energy
in the underwater environment, intensity is low. 1
Total 8
10.6.4.2 Receptor Sensitivity The only relevant biological receptors to underwater noise are seals and fish29. Seals and Fish Piling activities will take place at the WC-PDQ platform location and vessel movements will occur along support vessel routes from the Logistics Supply Base located at the BDJF yard to the platform location. Recent data indicates that endangered species such as seals and sturgeon are not common in the ACG Contract Area (Appendix 6B) and that the WC-PDQ platform location is not located in an important breeding or migration area for either species. However, Kilka and Mullet are present in the Contract Area. Table 10.32 presents the justification for assigning a score of 2, which represents Low Receptor Sensitivity. Table 10.32 Receptor Sensitivity
Parameter Explanation Rating Resilience Possibility that species may be temporarily affected by underwater piling and
vessel noise but effect would be short term and limited. Ecological functionality will be maintained.
1
Presence The fish most likely to be present for extended periods of time in the ACG Contract Area and at the WC PDQ location are Kilka and Mullet throughout the year. However, neither the COP location nor the ACG Contract Area is exclusively used by these species and the Contract Area is not considered to be of primary importance.
1
Total 2
10.6.4.3 Impact Significance Table 10.33 summarises impacts to seal and fish associated with jacket foundation piling and vessel movements.
29 Plankton cannot sense the low frequency sound generated because the wavelength is longer than the organism and benthic invertebrates do not have sophisticated sound-sensing apparatus.
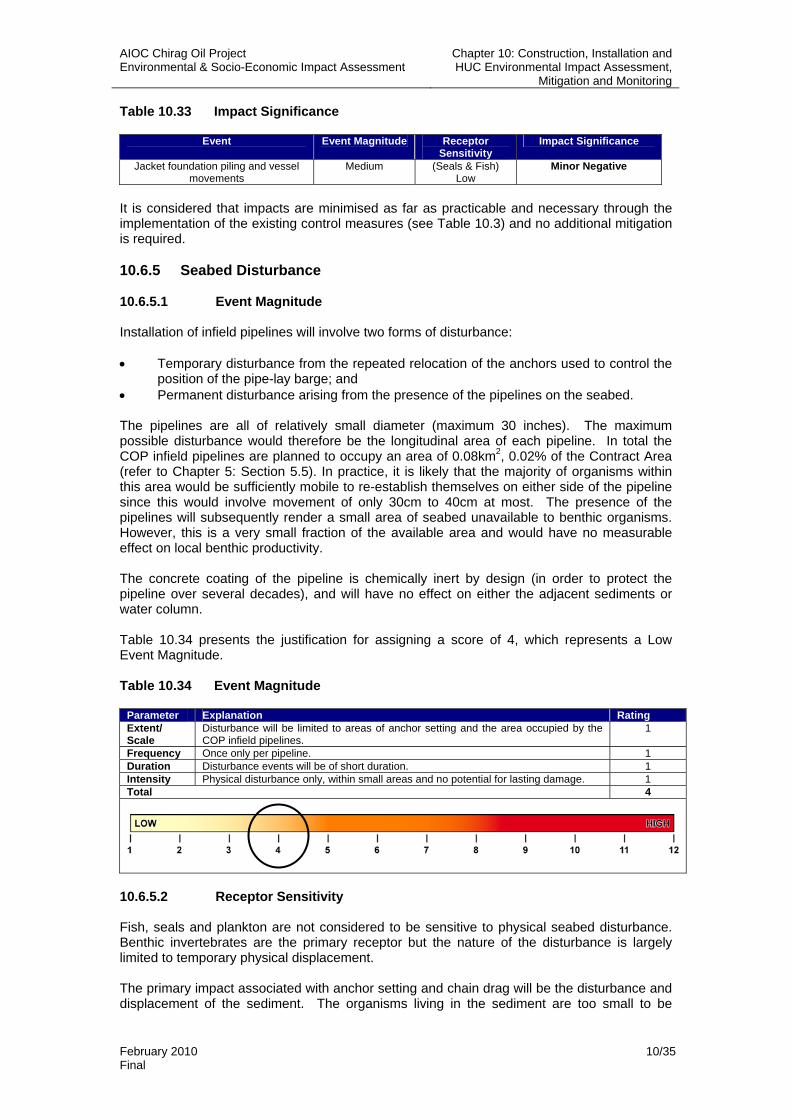
AIOC Chirag Oil Project Environmental & Socio-Economic Impact Assessment
Chapter 10: Construction, Installation and HUC Environmental Impact Assessment,
Mitigation and Monitoring
February 2010 10/35 Final
Table 10.33 Impact Significance
Event Event Magnitude Receptor Sensitivity
Impact Significance
Jacket foundation piling and vessel movements
Medium (Seals & Fish) Low
Minor Negative
It is considered that impacts are minimised as far as practicable and necessary through the implementation of the existing control measures (see Table 10.3) and no additional mitigation is required. 10.6.5 Seabed Disturbance 10.6.5.1 Event Magnitude Installation of infield pipelines will involve two forms of disturbance: • Temporary disturbance from the repeated relocation of the anchors used to control the
position of the pipe-lay barge; and • Permanent disturbance arising from the presence of the pipelines on the seabed. The pipelines are all of relatively small diameter (maximum 30 inches). The maximum possible disturbance would therefore be the longitudinal area of each pipeline. In total the COP infield pipelines are planned to occupy an area of 0.08km2, 0.02% of the Contract Area (refer to Chapter 5: Section 5.5). In practice, it is likely that the majority of organisms within this area would be sufficiently mobile to re-establish themselves on either side of the pipeline since this would involve movement of only 30cm to 40cm at most. The presence of the pipelines will subsequently render a small area of seabed unavailable to benthic organisms. However, this is a very small fraction of the available area and would have no measurable effect on local benthic productivity. The concrete coating of the pipeline is chemically inert by design (in order to protect the pipeline over several decades), and will have no effect on either the adjacent sediments or water column. Table 10.34 presents the justification for assigning a score of 4, which represents a Low Event Magnitude. Table 10.34 Event Magnitude
Parameter Explanation Rating Extent/ Scale
Disturbance will be limited to areas of anchor setting and the area occupied by the COP infield pipelines.
1
Frequency Once only per pipeline. 1 Duration Disturbance events will be of short duration. 1 Intensity Physical disturbance only, within small areas and no potential for lasting damage. 1 Total 4
10.6.5.2 Receptor Sensitivity Fish, seals and plankton are not considered to be sensitive to physical seabed disturbance. Benthic invertebrates are the primary receptor but the nature of the disturbance is largely limited to temporary physical displacement. The primary impact associated with anchor setting and chain drag will be the disturbance and displacement of the sediment. The organisms living in the sediment are too small to be
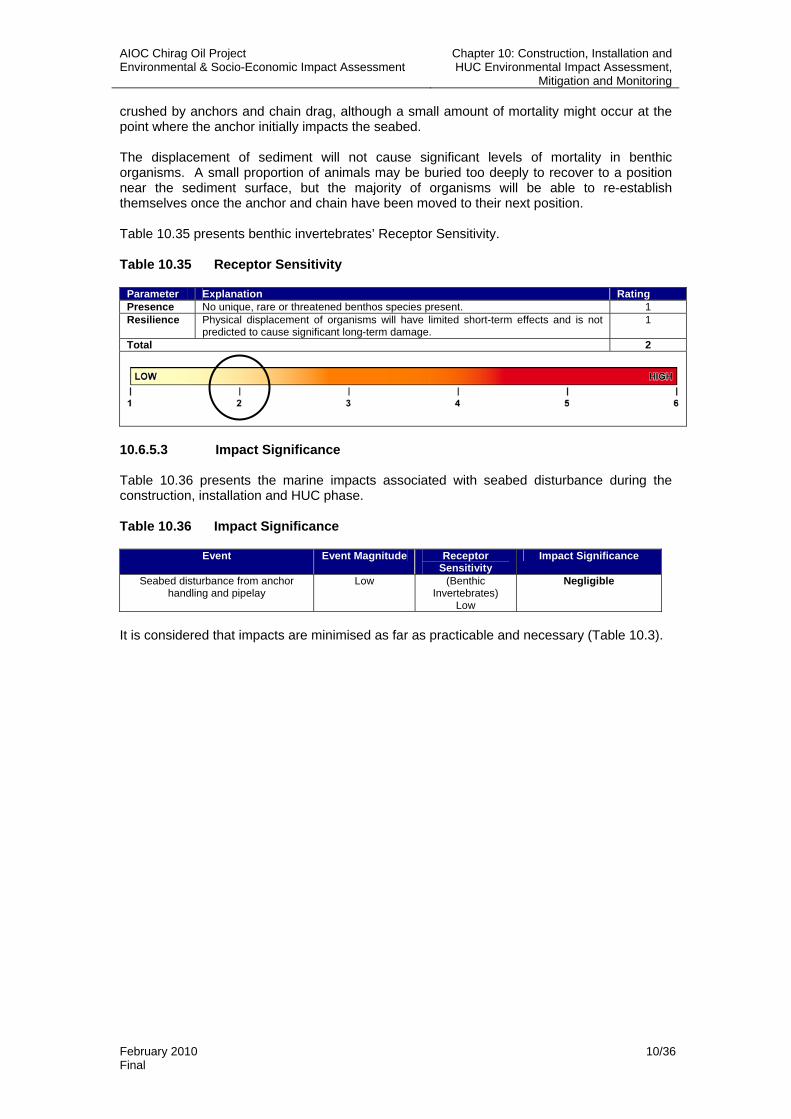
AIOC Chirag Oil Project Environmental & Socio-Economic Impact Assessment
Chapter 10: Construction, Installation and HUC Environmental Impact Assessment,
Mitigation and Monitoring
February 2010 10/36 Final
crushed by anchors and chain drag, although a small amount of mortality might occur at the point where the anchor initially impacts the seabed. The displacement of sediment will not cause significant levels of mortality in benthic organisms. A small proportion of animals may be buried too deeply to recover to a position near the sediment surface, but the majority of organisms will be able to re-establish themselves once the anchor and chain have been moved to their next position. Table 10.35 presents benthic invertebrates’ Receptor Sensitivity. Table 10.35 Receptor Sensitivity
Parameter Explanation Rating Presence No unique, rare or threatened benthos species present. 1 Resilience Physical displacement of organisms will have limited short-term effects and is not
predicted to cause significant long-term damage. 1
Total 2
10.6.5.3 Impact Significance Table 10.36 presents the marine impacts associated with seabed disturbance during the construction, installation and HUC phase. Table 10.36 Impact Significance
Event Event Magnitude Receptor Sensitivity
Impact Significance
Seabed disturbance from anchor handling and pipelay
Low (Benthic Invertebrates)
Low
Negligible
It is considered that impacts are minimised as far as practicable and necessary (Table 10.3).
AIOC Chirag Oil Project Environmental & Socio-Economic Impact Assessment
Chapter 10: Construction, Installation and HUC Environmental Impact Assessment,
Mitigation and Monitoring
February 2010 10/37 Final
10.6.6 Other Discharges
10.6.6.1 Event Magnitude Other discharges to sea will result from the operation of jacket and pipeline installation vessels (refer to Section 10.4.3. above) and pipeline installation. These will comprise: • Ballast Water – Support vessels will occasionally take up and discharge ballast water
during installation support activities.
Vessel ballast tanks are designed to ensure that ballast water does not come into contact with oil or chemicals. Uptake and discharge are not considered to present a significant environmental hazard.
• Treated Black Water – Black water will be treated in accordance with MARPOL 73/78
Annex IV (as revised in 2004) requirements and sludge will be shipped to shore. During pipelay, based on 280 POB and an expected generation rate of 0.1m3/person/day, approximately 28m3 of treated effluent will be discharged per day. The flow rate is low, so the effluent will be rapidly diluted close to the point of discharge. Total suspended solids, BOD and coliforms at the proposed treatment level do not pose any risk of environmental impact.
• Grey Water - Grey water (approximately 62m3 per day) will be discharged directly to sea. Grey water (from showers, laundry etc) will contain only dilute cleaning agents (soaps, detergents) and the impact of discharge will be minimal.
• Drainage - Drainage (including deck drainage and washdown water) will be discharged directly to sea, provided no visible sheen is observable. No contaminated water will be discharged and so no environmental impact is anticipated.
• Oil Line Wye Spool Water – approximately 65m3 of seawater containing hydrotest
chemicals will be released as the section of existing pipeline is removed to accommodate the new wye piece (refer to Chapter 5: Table 5.19). This water may contain some residual hydrocarbons at concentrations estimated not to exceed 100 mg/l. The volume of the discharge is sufficiently small that hydrocarbon concentrations would be reduced to very low levels within a few metres of the source.
Event Magnitude is summarised in Table 10.37.
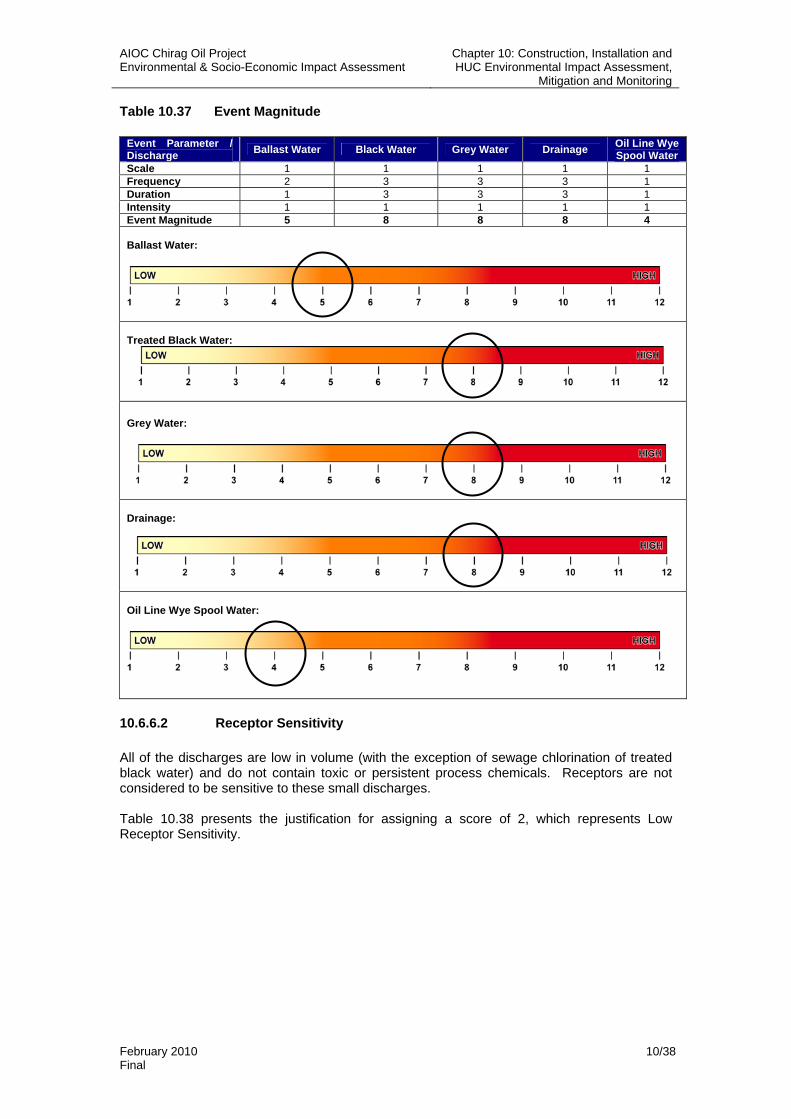
AIOC Chirag Oil Project Environmental & Socio-Economic Impact Assessment
Chapter 10: Construction, Installation and HUC Environmental Impact Assessment,
Mitigation and Monitoring
February 2010 10/38 Final
Table 10.37 Event Magnitude
10.6.6.2 Receptor Sensitivity All of the discharges are low in volume (with the exception of sewage chlorination of treated black water) and do not contain toxic or persistent process chemicals. Receptors are not considered to be sensitive to these small discharges. Table 10.38 presents the justification for assigning a score of 2, which represents Low Receptor Sensitivity.
Event Parameter / Discharge Ballast Water Black Water Grey Water Drainage Oil Line Wye
Spool Water Scale 1 1 1 1 1 Frequency 2 3 3 3 1 Duration 1 3 3 3 1 Intensity 1 1 1 1 1 Event Magnitude 5 8 8 8 4 Ballast Water:
Treated Black Water:
Grey Water:
Drainage:
Oil Line Wye Spool Water:
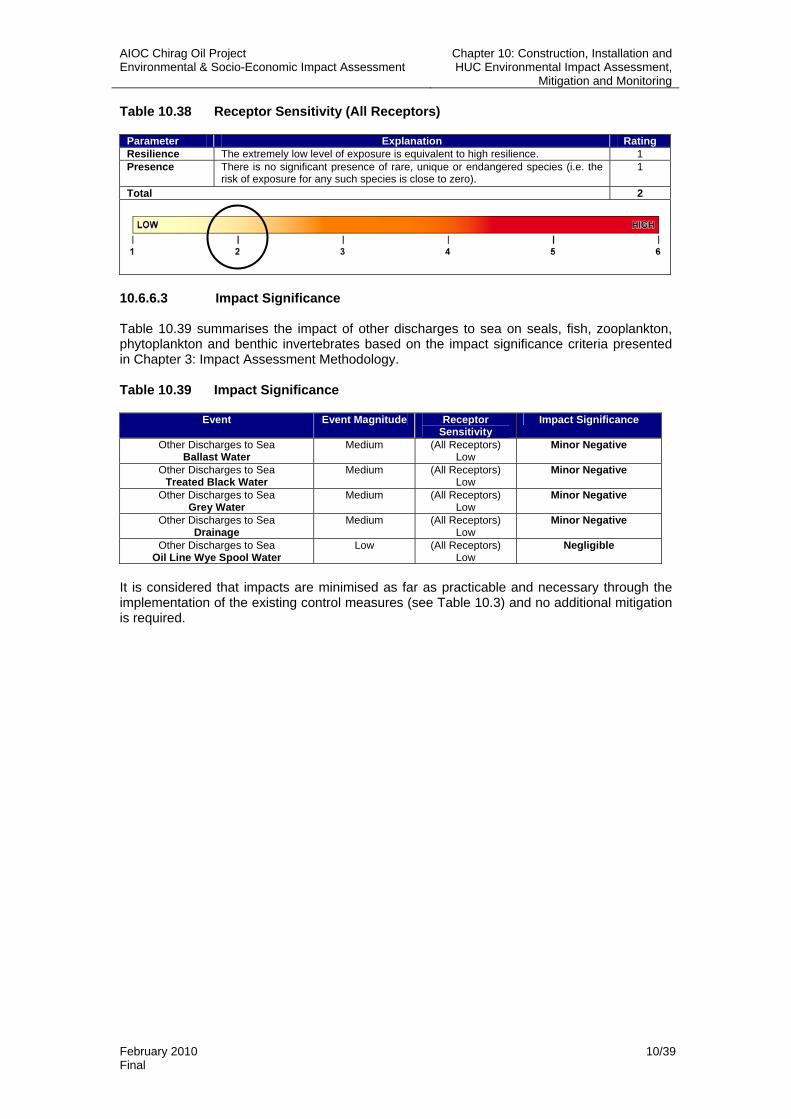
AIOC Chirag Oil Project Environmental & Socio-Economic Impact Assessment
Chapter 10: Construction, Installation and HUC Environmental Impact Assessment,
Mitigation and Monitoring
February 2010 10/39 Final
Table 10.38 Receptor Sensitivity (All Receptors)
Parameter Explanation Rating Resilience The extremely low level of exposure is equivalent to high resilience. 1 Presence There is no significant presence of rare, unique or endangered species (i.e. the
risk of exposure for any such species is close to zero). 1
Total 2
10.6.6.3 Impact Significance Table 10.39 summarises the impact of other discharges to sea on seals, fish, zooplankton, phytoplankton and benthic invertebrates based on the impact significance criteria presented in Chapter 3: Impact Assessment Methodology. Table 10.39 Impact Significance
It is considered that impacts are minimised as far as practicable and necessary through the implementation of the existing control measures (see Table 10.3) and no additional mitigation is required.
Event Event Magnitude Receptor Sensitivity
Impact Significance
Other Discharges to Sea Ballast Water
Medium (All Receptors) Low
Minor Negative
Other Discharges to Sea Treated Black Water
Medium (All Receptors) Low
Minor Negative
Other Discharges to Sea Grey Water
Medium (All Receptors) Low
Minor Negative
Other Discharges to Sea Drainage
Medium (All Receptors) Low
Minor Negative
Other Discharges to Sea Oil Line Wye Spool Water
Low (All Receptors) Low
Negligible
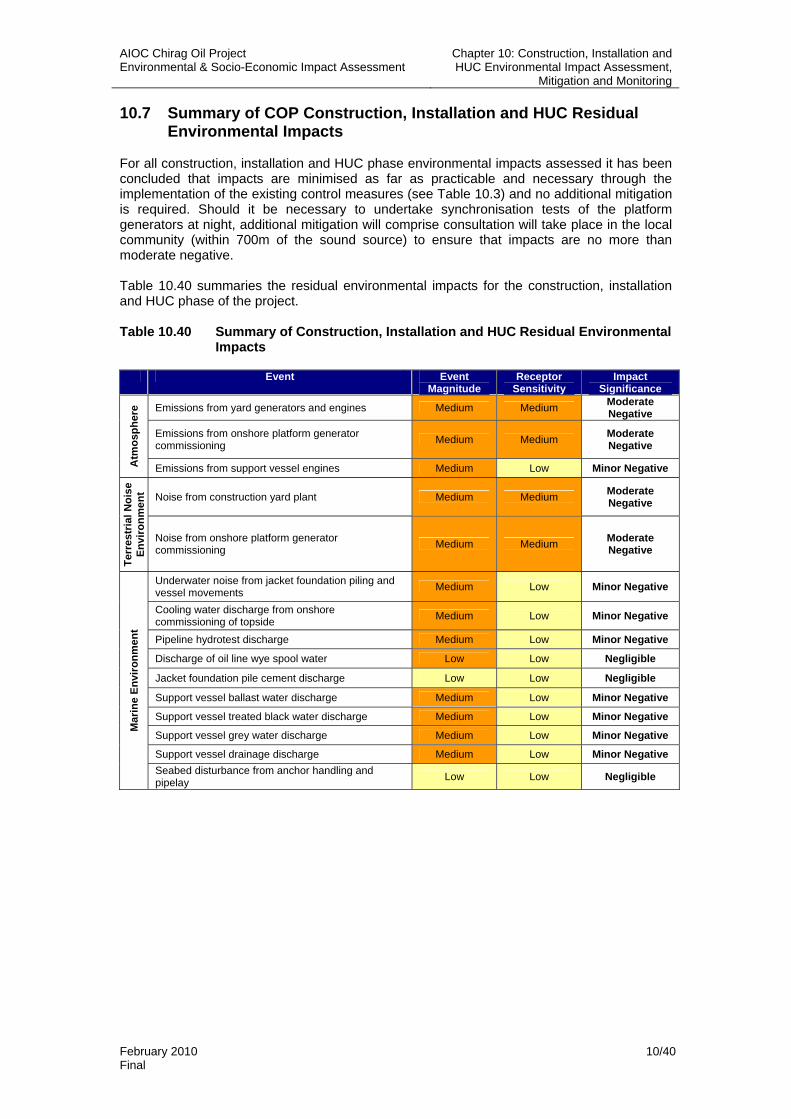
AIOC Chirag Oil Project Environmental & Socio-Economic Impact Assessment
Chapter 10: Construction, Installation and HUC Environmental Impact Assessment,
Mitigation and Monitoring
February 2010 10/40 Final
10.7 Summary of COP Construction, Installation and HUC Residual Environmental Impacts
For all construction, installation and HUC phase environmental impacts assessed it has been concluded that impacts are minimised as far as practicable and necessary through the implementation of the existing control measures (see Table 10.3) and no additional mitigation is required. Should it be necessary to undertake synchronisation tests of the platform generators at night, additional mitigation will comprise consultation will take place in the local community (within 700m of the sound source) to ensure that impacts are no more than moderate negative. Table 10.40 summaries the residual environmental impacts for the construction, installation and HUC phase of the project. Table 10.40 Summary of Construction, Installation and HUC Residual Environmental
Impacts
Event Event Magnitude
Receptor Sensitivity
Impact Significance
Emissions from yard generators and engines Medium Medium Moderate Negative
Emissions from onshore platform generator commissioning Medium Medium Moderate
Negative
Atm
osph
ere
Emissions from support vessel engines Medium Low Minor Negative
Noise from construction yard plant Medium Medium Moderate Negative
Terr
estr
ial N
oise
En
viro
nmen
t
Noise from onshore platform generator commissioning Medium Medium Moderate
Negative
Underwater noise from jacket foundation piling and vessel movements Medium Low Minor Negative
Cooling water discharge from onshore commissioning of topside Medium Low Minor Negative
Pipeline hydrotest discharge Medium Low Minor Negative
Discharge of oil line wye spool water Low Low Negligible
Jacket foundation pile cement discharge Low Low Negligible
Support vessel ballast water discharge Medium Low Minor Negative
Support vessel treated black water discharge Medium Low Minor Negative
Support vessel grey water discharge Medium Low Minor Negative
Support vessel drainage discharge Medium Low Minor Negative
Mar
ine
Envi
ronm
ent
Seabed disturbance from anchor handling and pipelay Low Low Negligible