Embed Size (px)
Citation preview
8/3/2019 HUL Result Updated
http://slidepdf.com/reader/full/hul-result-updated 1/11
Please refer to important disclosures at the end of this report 1
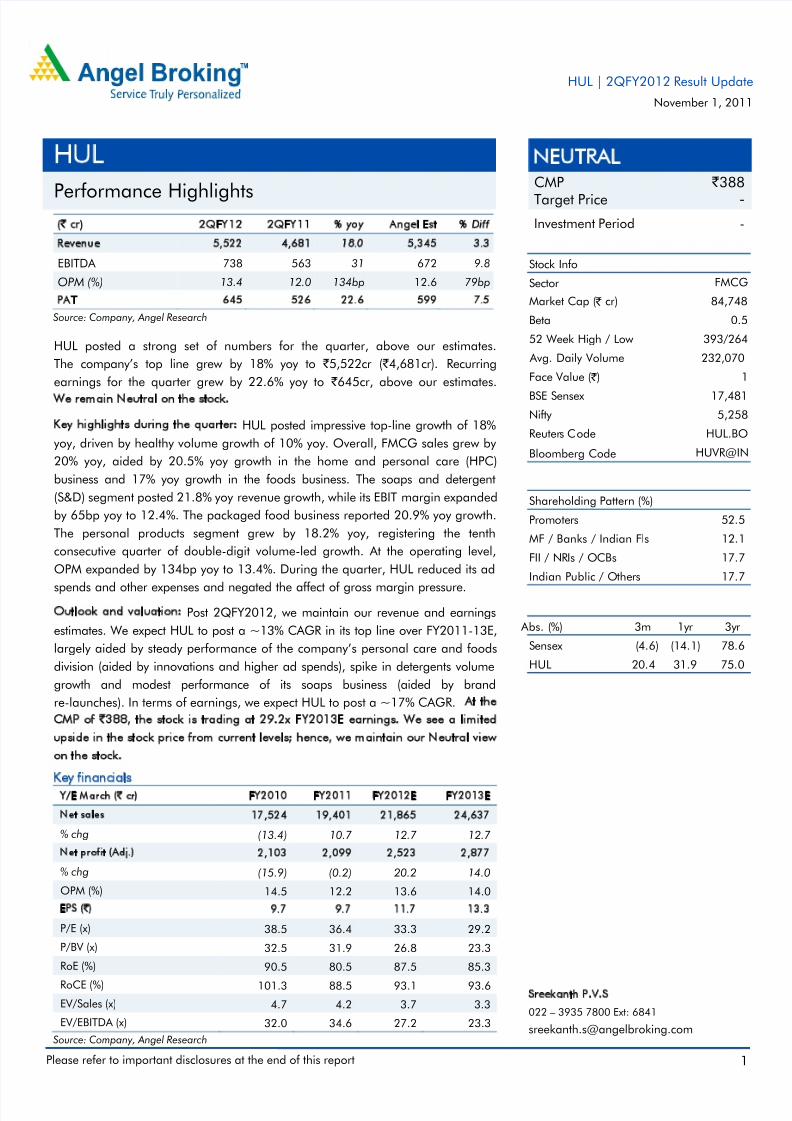
(` cr) 2QFY12 2QFY11 % yoy Angel Est % Diff
Revenue 5,522 4,681 18.0 5,345 3.3
EBITDA 738 563 31 672 9.8
OPM (%) 13.4 12.0 134bp 12.6 79bp
PAT 645 526 22.6 599 7.5
Source: Company, Angel Research
HUL posted a strong set of numbers for the quarter, above our estimates.
The company’s top line grew by 18% yoy to ` 5,522cr ( ` 4,681cr). Recurring
earnings for the quarter grew by 22.6% yoy to `
645cr, above our estimates.We remain Neutral on the stock.
Key highlights during the quarter: HUL posted impressive top-line growth of 18%
yoy, driven by healthy volume growth of 10% yoy. Overall, FMCG sales grew by
20% yoy, aided by 20.5% yoy growth in the home and personal care (HPC)
business and 17% yoy growth in the foods business. The soaps and detergent
(S&D) segment posted 21.8% yoy revenue growth, while its EBIT margin expanded
by 65bp yoy to 12.4%. The packaged food business reported 20.9% yoy growth.
The personal products segment grew by 18.2% yoy, registering the tenth
consecutive quarter of double-digit volume-led growth. At the operating level,
OPM expanded by 134bp yoy to 13.4%. During the quarter, HUL reduced its ad
spends and other expenses and negated the affect of gross margin pressure.
Outlook and valuation: Post 2QFY2012, we maintain our revenue and earnings
estimates. We expect HUL to post a ~13% CAGR in its top line over FY2011-13E,
largely aided by steady performance of the company’s personal care and foods
division (aided by innovations and higher ad spends), spike in detergents volume
growth and modest performance of its soaps business (aided by brand
re-launches). In terms of earnings, we expect HUL to post a ~17% CAGR. At the
CMP of `388, the stock is trading at 29.2x FY2013E earnings. We see a limited
upside in the stock price from current levels; hence, we maintain our Neutral view
on the stock.
Key financials Y/E March (` cr) FY2010 FY2011 FY2012E FY2013E
Net sales 17,524 19,401 21,865 24,637
% chg (13.4) 10.7 12.7 12.7
Net profit (Adj.) 2,103 2,099 2,523 2,877
% chg (15.9) (0.2) 20.2 14.0
OPM (%) 14.5 12.2 13.6 14.0
EPS (`) 9.7 9.7 11.7 13.3
P/E (x) 38.5 36.4 33.3 29.2
P/BV (x) 32.5 31.9 26.8 23.3
RoE (%) 90.5 80.5 87.5 85.3RoCE (%) 101.3 88.5 93.1 93.6
EV/Sales (x) 4.7 4.2 3.7 3.3
EV/EBITDA (x) 32.0 34.6 27.2 23.3
Source: Company, Angel Research
NEUTRALCMP ` 388
Target Price -
Investment Period -
Stock Info
Sector
Bloomberg Code
Shareholding Pattern (%)
Promoters 52.5
MF / Banks / Indian Fls 12.1
FII / NRIs / OCBs 17.7
Indian Public / Others 17.7
Abs. (%) 3m 1yr 3yr
Sensex (4.6) (14.1) 78.6
HUL 20.4 31.9 75.0
HUVR@IN
17,481
5,258
HUL.BO
232,070
BSE Sensex
Nifty
Reuters Code
Face Value ( ` )
FMCG
Avg. Daily Volume
Market Cap ( ` cr)
Beta
52 Week High / Low
84,748
0.5
1
393/264
Sreekanth P.V.S
022 – 3935 7800 Ext: 6841
HUL
Performance Highlights
HUL | 2QFY2012 Result Update
November 1, 2011

8/3/2019 HUL Result Updated
http://slidepdf.com/reader/full/hul-result-updated 2/11
HUL | 2QFY2012 Result Update
November 1, 2011 2
Exhibit 1: Quarterly performance
Y/E March (` cr) 2QFY12 2QFY11 % yoy 1HFY2012 1HFY2011 % chg
Net Sales 5,522 4,681 18.0 11,026 9,475 16.4
Consumption of RM 3,001 2,383 25.9 6,075 4,830 25.8(% of Sales) 54.3 50.9 55.1 51.0
Staff Costs 287 245 17.3 574 496 15.7
(% of Sales) 5.2 5.2 5.2 5.2
Advertising Expense 651 646 0.8 1,284 1,398 (8.1)
(% of Sales) 11.8 13.8 11.6 14.8
Other Expenses 844 843 0.1 1,676 1,590 5.4
(% of Sales) 15.3 18.0 15.2 16.8
Total Expenditure 4,784 4,118 16.2 9,609 8,313 15.6
Operating Profit 738 563 31.1 1,417 1,162 22.0
OPM (%) 13.4 12.0 12.9 12.3
Interest 1 0 671.4 1 0 273.3
Depreciation 57 55 3.1 113 109 4.1
Other Income 166 161 3.3 292 285 2.5
PBT (excl. Extr. Items) 847 668 26.7 1,595 1,338 19.3
Extr. Income/(Expense) 44 40 103 59
PBT (incl. Extr. Items) 891 709 25.7 1,699 1,397 21.6
(% of Sales) 16 15 15 15
Provision for Taxation 202 143 41.8 382 297 28.6
(% of PBT) 23.9 21.3 24.0 22.2
Recurring PAT 645 526 22.6 1,213 1,040 16.6
PATM (%) 11.7 11.2 11.0 11.0Reported PAT 689 566 21.7 1,316 1,099 19.7
Equity shares (cr) 216 218 216 218
FDEPS (`) 3.2 2.6 21.7 6.1 5.1 19.7
Source: Company, Angel Research
Revenue marginally above estimates, volume growth at 10%
HUL posted impressive top-line growth of 18% yoy, driven by healthy volume
growth of 10% yoy. Overall, FMCG sales grew by 20% yoy, aided by 20.5% yoy
growth in HPC and 17% yoy growth in foods businesses.
In HPC, the S&D segment posted growth of 21.8% yoy. The strong growth was
fuelled by price hikes. In detergents, all three brands – Rin, Surf, and Wheel –
delivered double-digit volume growth. New variants of Comfort and Lux were
launched during the quarter.
The personal products segment registered 18.2% yoy growth, the tenth consecutive
quarter of double-digit volume-led growth.
In the foods business, all segments grew well, contributing to the company’s growth
(beverages grew by 14.6% yoy and packaged foods grew by 20.9% yoy).

8/3/2019 HUL Result Updated
http://slidepdf.com/reader/full/hul-result-updated 3/11
HUL | 2QFY2012 Result Update
November 1, 2011 3
Exhibit 2: Double-digit top-line growth continues
Source: Company, Angel research
Exhibit 3: Volume growth bounces to double digits
Source: Company, Angel research
Recurring earnings up by 22.6% yoy, margin expands…
During the quarter, HUL posted a 22.6% yoy increase in its earnings to ` 645cr
( ` 526cr) on a recurring basis. Although on a reported basis, earnings grew by
21.7% yoy. Depreciation and other income remained flat, whereas tax rate
increased by 254bp yoy during the quarter.
Gross margin dips; OPM expands, offset by low ad spends
During the quarter, HUL’s OPM expanded by 134bp yoy. The company reported
gross margin contraction of 344bp yoy. During the quarter, the company reduced
its ad spend and other expenses by 202bp yoy and 273bp yoy, respectively. Staff
cost for the quarter remained flat. All this helped the company offset gross marginpressure and improve its operating margin.
Exhibit 4: Earnings growth higher than expected
Source: Company, Angel Research
Exhibit 5: Margin remains a concern
Source: Company, Angel Research
-
5.0
10.0
15.0
20.0
-
1,000
2,000
3,0004,000
5,000
6,000
2 Q 1 0
3 Q 1 0
4 Q 1 0
1 Q 1 1
2 Q 1 1
3 Q 1 1
4 Q 1 1
1 Q 1 2
2 Q 1 2
( % )
( `
c r )
Top-line (LHS) yoy growth (RHS)
1
5
11 11
1413
14
8 10
-
2
4
6
8
10
12
14
16
2 Q 1 0
3 Q 1 0
4 Q 1 0
1 Q 1 1
2 Q 1 1
3 Q 1 1
4 Q 1 1
1 Q 1 2
2 Q 1 2
( % )
(30.0)
(20.0)
(10.0)
-
10.0
20.0
30.0
40.0
10
110
210
310
410
510
610
710
2 Q 1 0
3 Q 1 0
4 Q 1 0
1 Q 1 1
2 Q 1 1
3 Q 1 1
4 Q 1 1
1 Q 1 2
2 Q 1 2
( % )
` c r )
PAT (LHS) yoy growth (RHS)
14.4 16.012.3 13.4 12.0 12.4 11.8 10.3 11.7
49.3 50.9 48.645.7
49.1 48.945.7 44.1 45.7
-
10.0
20.0
30.0
40.0
50.0
60.0
2 Q 1 0
3 Q 1 0
4 Q 1 0
1 Q 1 1
2 Q 1 1
3 Q 1 1
4 Q 1 1
1 Q 1 2
2 Q 1 2
( % )
OPM Gross margin

8/3/2019 HUL Result Updated
http://slidepdf.com/reader/full/hul-result-updated 4/11
HUL | 2QFY2012 Result Update
November 1, 2011 4
Exhibit 6: Segment-wise performance
Y/E March (` cr) 2QFY12 2QFY11 % chg 1HFY2011 1HFY2010 % chg
Soaps & Detergents 2,593 2,129 21.8 5,148 4,394 17.2
Personal Products 1,613 1,365 18.2 3,243 2,730 18.8Beverages 653 570 14.6 1,262 1,108 13.9
Packaged Foods 332 274 20.9 704 590 19.3
Exports 291 265 9.9 597 529 12.8
Others 116 153 (24.0) 223 265 (16.1)
Less: Inter Seg Rev - - - -
Total Gross Income 5,597 4,756 17.7 11,177 9,617 16.2
Soaps & Detergents 321 250 28.4 557 499 11.7
Personal Products 394 314 25.5 807 653 23.7
Beverages 88 88 0.2 163 157 3.8
Packaged Foods 16 10 34 36 (5.7)
Exports 24 19 27.0 48 42 14.6
Others (8) (18) (10) (45)
Total PBIT 836 662 81.1 1,599 1,341 19.2
Less: Interest Exp - - - -
Less: Other Unalloc Exp 77 75 116 50
PBT 912 737 23.8 1,715 1,391 23.2
PBIT Margin (%)
Soaps & Detergents 12.4 11.7 10.8 11.4
Personal Products 24.4 23.0 24.9 23.9
Beverages 13.4 15.4 12.9 14.2
Packaged Foods 5.0 3.7 4.8 6.1
Exports 8.3 7.1 8.0 7.9
Others (6.7) (12.0) (4.7) (16.9)
Source: Company, Angel Research

8/3/2019 HUL Result Updated
http://slidepdf.com/reader/full/hul-result-updated 5/11
HUL | 2QFY2012 Result Update
November 1, 2011 5
S&D posts high double-digit growth, all brands perform well
HUL’s S&D segment registered 21.8% yoy growth, with all its key brands
performing well. Competitive intensity in the category remained high as always.
On account of price hikes, the segment’s EBIT margin expanded by 65bp yoy.
The company launched new variants in Lux. Both Lux and Lifebuoy reported
double-digit growth during the quarter.
Exhibit 7: S&D continues with impressive growth
Source: Company, Angel Research
Exhibit 8: High palm oil prices impact EBIT margin
Source: Company, Angel Research
Personal products continue to post double-digit volume growth
The personal products segment registered 18.2% yoy growth, the tenth consecutive
quarter of double-digit growth. All skincare brands posted double-digit volume
growth. Hair care and oral care also performed well, with hair care witnessing
sustained double-digit volume growth. Toothpastes also performed well, with
brands such as Close up and Pepsodent showing strong growth. Hence, the
segment’s margin expanded by 143bp yoy to 24.4%.
Exhibit 9: Nine quarters of double-digit growth
Source: Company, Angel research
Exhibit 10: EBIT margin expands by 143bp yoy
Source: Company, Angel research
Packaged foods segment registers 20.9% yoy growth…
The packaged foods segment recorded 20.9% yoy growth, driven largely by strong
growth in tea, coffee and ice creams. Also, Kissan and Knorr posted double-digit
growth for the quarter.
(5.0)
-
5.0
10.0
15.0
20.0
25.0
-
500
1,000
1,500
2,000
2,500
3,000
2 Q 1 0
3 Q 1 0
4 Q 1 0
1 Q 1 1
2 Q 1 1
3 Q 1 1
4 Q 1 1
1 Q 1 2
2 Q 1 2
( % )
( `
c r )
Top-line (LHS) yoy growth (RHS)
-
2.04.0
6.0
8.0
10.0
12.0
14.0
16.0
-
50
100
150
200
250
300
350
2 Q 1 0
3 Q 1 0
4 Q 1 0
1 Q 1 1
2 Q 1 1
3 Q 1 1
4 Q 1 1
1 Q 1 2
2 Q 1 2
( % )
( ` c r )
EBIT (LHS) EBIT % (RHS)
-
2.0
4.06.0
8.0
10.0
12.0
14.0
16.0
-
50
100
150
200
250
300
350
2 Q 1 0
3 Q 1 0
4 Q 1 0
1 Q 1 1
2 Q 1 1
3 Q 1 1
4 Q 1 1
1 Q 1 2
2 Q 1 2
( % )
( ` c r )
EBIT (LHS) EBIT % (RHS)
-
5.010.0
15.0
20.0
25.0
-
500
1,000
1,500
2,000
2 Q 1 0
3 Q 1 0
4 Q 1 0
1 Q 1 1
2 Q 1 1
3 Q 1 1
4 Q 1 1
1 Q 1 2
2 Q 1 2
( % )
( ` c r )
Top-line (LHS) yoy growth (RHS)

8/3/2019 HUL Result Updated
http://slidepdf.com/reader/full/hul-result-updated 6/11
HUL | 2QFY2012 Result Update
November 1, 2011 6
Investment arguments
Increasing innovation and brand repositioning to accelerate growth: HUL has
been very actively re-launching products from its existing brands and has
increased the pace of new launches, targeting the mid/premium market
segment (re-launched Lux, Lifebuoy and Vim in the personal products and the
S&D categories, respectively). This, in our view, is positive, considering that the
company will have a better control on pricing. Moreover, constant innovations
have helped HUL stabilize its market share losses. However, we retain a slight
caution against ITC’s commitment to categories such as soaps, shampoos and
skin care, which may pose a major threat to HUL in the long run. We model in
an 8.5% and a 15.7% CAGR in the S&D and personal products segments’
revenue over FY2011-13E and expect margin to come in at ~12% and ~25%
for S&D and personal products segments, respectively.
Healthy domestic growth rates and strong balance sheet provide further
impetus: HUL, with its iconic brands, has maintained its growth, which is
impressive given the recent price hikes across categories and a strong
competitive scenario, indicating a revival in consumer demand and higher
growth in the mid/premium market segment. Moreover, HUL is a
cash-rich, zero-debt company enjoying high RoE of ~75%. We have modeled
in a recurring earnings CAGR of ~17% over FY2011-13E, though we expect
the company’s margin to be under pressure due to high input cost inflation.
Outlook and valuation
Post 2QFY2012, we maintain our revenue and earnings estimates. We expect HUL
to post a ~13% CAGR in its top line over FY2011-13E, largely aided by steady
performance of the company’s personal care and foods division (aided by
innovations and higher ad spends), spike in detergents volume growth and modest
performance of its soaps business (aided by brand re-launches). In terms of
earnings, we expect HUL to post a ~17% CAGR. At the CMP of `388, the stock is
trading at 29.2x FY2013E earnings. We see a limited upside in the stock price
from current levels; hence, we maintain our Neutral view on the stock.

8/3/2019 HUL Result Updated
http://slidepdf.com/reader/full/hul-result-updated 7/11
HUL | 2QFY2012 Result Update
November 1, 2011 7
Exhibit 11: Peer valuation
Company Reco Mcap CMP TP* Upside P/E (x) EV/Sales (x) RoE (%) CAGR #
(` cr) (`) (`) (%) FY12E FY13E FY12E FY13E FY12E FY13E Sales PAT
Asian Paints Neutral 30,055 3,133 - - 30.6 24.8 3.2 2.7 39.6 38.3 17.3 19.8
Britannia Neutral 5,670 475 - - 30.8 21.1 1.1 1.0 37.8 46.0 17.3 36.0
Colgate Neutral 14,159 1,041 - - 32.3 27.6 5.3 4.6 111.7 108.0 14.9 12.9
Dabur Buy 17,346 100 115 16 24.7 21.6 3.4 3.0 44.9 41.6 20.5 18.8
GSKCHL Neutral 9,739 2,316 - - 28.0 23.6 3.2 2.7 32.6 31.8 17.3 17.5
GCPL Accumulate 13,704 424 457 8 25.6 19.7 3.4 2.7 36.6 29.4 22.9 20.2
HUL Neutral 84,748 388 - - 33.2 29.2 3.7 3.3 87.5 85.3 12.7 17.1
ITC Accumulate 161,069 208 219 5 27.9 23.5 6.2 5.2 32.7 31.5 17.6 17.4
Marico Neutral 9,554 156 - - 30.7 24.7 2.8 2.4 30.4 28.6 15.7 27.6
Nestle Neutral 42,012 4,357 - - 43.2 36.3 5.7 5.0 91.1 72.9 16.1 18.9
Source: Company, Angel Research, Note: #denotes CAGR for FY2011-13E
Exhibit 12: Angel vs. Consensus estimates
Top-line (` cr) FY2012E FY2013E EPS (`) FY2012E FY2013E
Angel estimates 21,865 24,637 Angel estimates 11.7 13
Consensus 22,277 25,167 Consensus 11.6 13.6
Diff (%) (1.9) (2.1) Diff (%) 0.7 (2.1)
Source: Company, Angel Research
Exhibit 13: Returns–HUL vs. Sensex (Indexed to 100)
Source: Company, Angel Research
Exhibit 14: One-year forward P/E band
Source: Company, Angel Research
Exhibit 15: One-year forward P/E chart
Source: Company, Angel Research, Note: Blue line indicates 5-year average
Exhibit 16: One-year forward Prem vs. Sensex chart
Source: Company, Angel Research, Note: Blue line indicates 5-year average
60%
70%
80%
90%
100%
110%
120%
130%
140%
N o v - 1 0
D e c - 1 0
J a n - 1 1
F e b - 1 1
M a r - 1 1
A p r - 1 1
M a y - 1 1
J u n - 1 1
J u l - 1 1
A u g - 1 1
S e p - 1 1
O c t - 1 1
N o v - 1 1
Sensex HUL
-
100
200
300
400
500
A p r - 0 5
D e c - 0
5
A u g - 0
6
A p r - 0 7
D e c - 0
7
A u g - 0
8
A p r - 0 9
D e c - 0
9
A u g - 1
0
A p r - 1 1
S h a r e P r i c e ( ` )
15x 20x 25x 30x
-
5.0
10.0
15.0
20.0
25.0
30.0
35.0
O
c t - 0 6
F
e b - 0
7
J
u n - 0
7
O
c t - 0 7
F
e b - 0
8
J
u n - 0
8
O
c t - 0 8
F
e b - 0
9
J
u n - 0
9
O
c t - 0 9
F
e b - 1
0
J
u n - 1
0
O
c t - 1 0
F
e b - 1
1
J
u n - 1
1
O
c t - 1 1
-40%-20%
0%20%40%60%80%
100%120%140%160%
A p r - 0 6
A u
g - 0
6
D e c - 0
6
A p r - 0 7
A u
g - 0
7
D e c - 0
7
A p r - 0 8
A u
g - 0
8
D e c - 0
8
A p r - 0 9
A u
g - 0
9
D e c - 0
9
A p r - 1 0
A u
g - 1
0
D e c - 1
0
A p r - 1 1
A u
g - 1
1

8/3/2019 HUL Result Updated
http://slidepdf.com/reader/full/hul-result-updated 8/11
HUL | 2QFY2012 Result Update
November 1, 2011 8
Profit & Loss Statement
Y/E March ( ` cr) CY07 FY09# FY10 FY11 FY12E FY13E
Gross sales 14,715 21,650 18,220 20,306 22,895 25,852
Less: Excise duty 1,040 1,410 696 904 1,030 1,215
Net Sales 13,675 20,239 17,524 19,401 21,865 24,637
Total operating income 13,675 20,239 17,524 19,401 21,865 24,637
% chg 13.0 48.0 (13.4) 10.7 12.7 12.7
Total Expenditure 11,797 17,583 14,975 17,036 18,893 21,181
Cost of Materials 7,269 10,810 8,878 10,057 10,977 12,147
Advertising Exp 1,440 2,131 2,391 2,764 3,170 3,696
Personnel 768 1,152 936 961 1,104 1,244
Others 2,320 3,490 2,770 3,254 3,642 4,094
EBITDA 1,879 2,656 2,548 2,365 2,972 3,456
% chg 14.0 41.4 (4.1) (7.2) 25.7 16.3
(% of Net Sales) 13.7 13.1 14.5 12.2 13.6 14.0
Depreciation& Amortisation 138 195 184 221 247 273
EBIT 1,740 2,461 2,364 2,144 2,725 3,183
% chg 14.7 41.4 (3.9) (9.3) 27.1 16.8
(% of Net Sales) 12.7 12.2 13.5 11.1 12.5 12.9
Interest & other Charges 25 25 7 0 0 -
Other Income 432 590 350 586 553 577
(% of PBT) 20.1 19.5 12.9 21.5 16.9 15.4
Share in profit of Associates - - - - - -
Recurring PBT 2,146 3,025 2,707 2,730 3,277 3,760
% chg 15.3 40.9 (10.5) 0.9 20.0 14.7Extraordinary Expense/(Inc.) (182) 4 (99) (207) 0 0
PBT (reported) 2,329 3,021 2,806 2,937 3,277 3,760
Tax 403 524 604 631 754 884
(% of PBT) 18.8 17.3 22.3 23.1 23.0 23.5
PAT (reported) 1,743 2,501 2,103 2,099 2,523 2,877
Add: Share of associates - - - - - -
Less: Minority interest (MI) - - - - - -
PAT after MI (reported) 1,743 2,501 2,103 2,099 2,523 2,877
ADJ. PAT 1,925 2,496 2,202 2,306 2,523 2,877
% chg 3.8 29.7 (11.8) 4.7 9.4 14.0
(% of Net Sales) 14.1 12.3 12.6 11.9 11.5 11.7
Basic EPS (`) 8.0 11.5 9.6 9.7 11.7 13.3
Fully Diluted EPS (̀ ) 8.0 11.5 9.6 9.7 11.7 13.3
% chg 14.7 43.3 (16.0) 0.9 20.1 14.0#Note: FY2009 Results are for 15 months

8/3/2019 HUL Result Updated
http://slidepdf.com/reader/full/hul-result-updated 9/11
HUL | 2QFY2012 Result Update
November 1, 2011 9
Balance Sheet
Y/E March ( ` cr) CY07 FY09# FY10 FY11 FY12E FY13E
SOURCES OF FUNDS
Equity Share Capital 218 218 218 216 216 216
Preference Capital - - - - - -
Reserves& Surplus 1,221 1,844 2,365 2,418 2,919 3,393
Shareholders’ Funds 1,439 2,062 2,584 2,634 3,135 3,609
Minority Interest - - - - - -
Total Loans 89 422 - - - -
Deferred Tax Liability (212) (255) (249) (210) (210) (210)
Total Liabilities 1,315 2,229 2,335 2,424 2,925 3,400
APPLICATION OF FUNDS
Gross Block 2,669 2,882 3,582 3,760 4,417 4,879
Less: Acc. Depreciation 1,147 1,275 1,420 1,590 1,838 2,111
Net Block 1,523 1,607 2,162 2,169 2,579 2,768
Capital Work-in-Progress 186 472 274 299 442 488
Goodwill - - - - - -
Investments 1,441 333 1,264 1,261 1,761 2,261
Current Assets 3,277 5,601 5,368 6,095 6,362 6,952
Cash 201 1,777 1,892 1,640 2,010 2,042
Loans & Advances 680 758 624 701 809 924
Other 2,397 3,066 2,852 3,754 3,543 3,985
Current liabilities 5,111 5,784 6,733 7,400 8,218 9,068
Net Current Assets (1,834) (183) (1,365) (1,305) (1,857) (2,116)
Total Assets 1,315 2,229 2,335 2,424 2,925 3,400#Note: FY2009 Results are for 15 months
Cash Flow StatementY/E March ( ` cr) CY07 FY09# FY10 FY11 FY12E FY13E
Profit before tax 2,146 3,025 2,707 2,730 3,277 3,760
Depreciation 138 195 184 221 247 273
Change in Working Capital 122 (330) 1,375 (242) 895 281
Interest / Dividend (Net) (142) (126) (117) (190) (167) (187)
Direct taxes paid 403 524 604 631 754 884
Others (26) (19) (67) (416) 26 11
Cash Flow from Operations 1,836 2,220 3,477 1,472 3,525 3,255(Inc.)/ Dec. in Fixed Assets (289) (629) (502) (203) (800) (508)
(Inc.)/ Dec. in Investments 998 1,167 (931) 3 (500) (500)
Cash Flow from Investing 709 538 (1,434) (199) (1,300) (1,008)
Issue of Equity (633) 39 32 (73) 0 0
Inc./(Dec.) in loans 16 333 (422) 0 0 0
Dividend Paid (Incl. Tax) 2,292 1,677 1,656 1,642 2,023 2,402
Interest / Dividend (Net) (148) (122) (117) (190) (167) (187)
Cash Flow from Financing (2,762) (1,181) (1,929) (1,525) (1,855) (2,215)
Inc./(Dec.) in Cash (216) 1,576 115 (252) 370 33
Opening Cash balances 417 201 1,777 1,892 1,640 2,010
Closing Cash balances 201 1,777 1,892 1,640 2,010 2,042#Note: FY2009 Results are for 15 months

8/3/2019 HUL Result Updated
http://slidepdf.com/reader/full/hul-result-updated 10/11
HUL | 2QFY2012 Result Update
November 1, 2011 10
Key Ratios
Y/E March CY07 FY09# FY10 FY11 FY12E FY13E
Valuation Ratio (x)
P/E (on FDEPS)43.9 33.9 38.5 36.4 33.3 29.2
P/CEPS 44.6 31.1 36.7 36.2 30.3 26.6
P/BV 58.3 40.7 32.5 31.9 26.8 23.3
Dividend yield (%) 2.3 1.9 1.7 1.7 2.1 2.4
EV/Sales 6.1 4.1 4.7 4.2 3.7 3.3
EV/EBITDA 44.3 31.3 32.0 34.6 27.2 23.3
EV / Total Assets 63.2 37.3 34.9 33.8 27.7 23.7
Per Share Data (`)EPS (Basic) 8.0 11.5 9.6 9.7 11.7 13.3
EPS (fully diluted) 8.1 11.6 9.7 9.7 11.7 13.3
Cash EPS 8.7 12.5 10.6 10.7 12.8 14.6DPS 9.1 7.5 6.5 6.5 8.0 9.5
Book Value 6.7 9.5 12.0 12.2 14.5 16.7
Returns (%)
RoCE 89.5 138.9 103.6 90.1 101.9 100.7
Angel RoIC (Pre-tax) - - - - - -
RoE 83.7 142.9 90.5 80.5 87.5 85.3
Turnover ratios (x)
Asset Turnover 5.1 7.0 4.9 5.2 5.0 5.1
Inventory / Sales (days) 52 46 45 53 46 46
Receivables (days) 12 10 14 18 14 13
Payables (days) 102 77 110 114 109 106
Net Working capital (days) (54) (35) (68) (55) (65) (62)#Note: FY2009 Results are for 15 months

8/3/2019 HUL Result Updated
http://slidepdf.com/reader/full/hul-result-updated 11/11
HUL | 2QFY2012 Result Update
November 1, 2011 11
Research Team Tel: 022 - 3935 7800 E-mail: [email protected] Website: www. angelbroking.com
Disclaimer
This document is solely for the personal information of the recipient, and must not be singularly used as the basis of any investmentdecision. Nothing in this document should be construed as investment or financial advice. Each recipient of this document should makesuch investigations as they deem necessary to arrive at an independent evaluation of an investment in the securities of the companiesreferred to in this document (including the merits and risks involved), and should consult their own advisors to determine the merits andrisks of such an investment.
Angel Broking Limited, its affiliates, directors, its proprietary trading and investment businesses may, from time to time, makeinvestment decisions that are inconsistent with or contradictory to the recommendations expressed herein. The views contained in thisdocument are those of the analyst, and the company may or may not subscribe to all the views expressed within.Reports based on technical and derivative analysis center on studying charts of a stock's price movement, outstanding positions andtrading volume, as opposed to focusing on a company's fundamentals and, as such, may not match with a report on a company'sfundamentals.
The information in this document has been printed on the basis of publicly available information, internal data and other reliablesources believed to be true, but we do not represent that it is accurate or complete and it should not be relied on as such, as thisdocument is for general guidance only. Angel Broking Limited or any of its affiliates/ group companies shall not be in any way responsible for any loss or damage that may arise to any person from any inadvertent error in the information contained in this report.
Angel Broking Limited has not independently verified all the information contained within this document. Accordingly, we cannot testify,nor make any representation or warranty, express or implied, to the accuracy, contents or data contained within this document. While Angel Broking Limited endeavours to update on a reasonable basis the information discussed in this material, there may be regulatory,compliance, or other reasons that prevent us from doing so.
This document is being supplied to you solely for your information, and its contents, information or data may not be reproduced,redistributed or passed on, directly or indirectly.
Angel Broking Limited and its affiliates may seek to provide or have engaged in providing corporate finance, investment banking orother advisory services in a merger or specific transaction to the companies referred to in this report, as on the date of this report or inthe past.
Neither Angel Broking Limited, nor its directors, employees or affiliates shall be liable for any loss or damage that may arise from or inconnection with the use of this information.
Note: Please refer to the important `Stock Holding Disclosure' report on the Angel website (Research Section). Also, please refer to thelatest update on respective stocks for the disclosure status in respect of those stocks. Angel Broking Limited and its affiliates may haveinvestment positions in the stocks recommended in this report.
Disclosure of Interest Statement HUL
1. Analyst ownership of the stock No
2. Angel and its Group companies ownership of the stock No
3. Angel and its Group companies' Directors ownership of the stock No
4. Broking relationship with company covered No
Note: We have not considered any Exposure below ` 1 lakh for Angel, its Group companies and Directors.
Ratings (Returns) : Buy (> 15%) Accumulate (5% to 15%) Neutral (-5 to 5%)Reduce (-5% to 15%) Sell (< -15%)