Embed Size (px)
Citation preview
147
Nabila Asghar *
Muhammad Hassan Danish *
Hafeez ur Rehman****
Human Capital and Labour Productivity
A Case Study of District Lahore
Abstract
Human capital is an intangible asset of an organization. Firms always try
to properly utilize their workforce through comprehensive human capital
development.The main concern of an entrepreneur is not only to achieve
business goals but also achieve long term survival and sustainability.
This study is designed to investigate the role of human capital in labour
productivity in district Lahore. For analyzing this relationship, cross
sectional study is conducted and data is collected from 243 firms, which
include manufacturing, trading and service sector.The empirical analysis
reveals that all the sectors have heterogeneous effect of human capital on
labour productivity. Education appears to be significant and positively
related to labour productivity in all the sectors with greater effect in
manufacturing sector. Skills and training have also noticeable effect on
labour productivity. The descriptive analysis shows heterogeneous results
in different sectors. Moreover, variance inflated factors and correlation
matrix is also determined to detect the multicollinearity problem and
there is no correlation among variables. The results of the study suggest
that firms as well as government should invest more in human capital is
developing skills in labour force so that it can become more productive.
The study recommends that government should also provide more funds
for the promotion of technical education in these countries.
Keywords: Human Capital, Labour Productivity, Labour Force, Technical
Education
Introduction
Human capital plays a significant role both at micro and macro level. The idea of
human capital was recognized in 1960s.First of all,Schultz (1961) gave the idea of
human capital and its importance. However, this idea got more familiarity in
1990s by Romer (1990) and Mankiw et al. (1992), when proxy of human capital
was used in production function for the first time by them. In an organizational
perspective, human capital represents the value of the organization’s intellectual
* Nabila Asghar, Assistant Professor, Department of Economics, University of the Punjab,
Lahore, Pakistan. ** Muhammad Hassan Danish, MPhil Scholar, Department of Economics, University of the
Punjab, Lahore, Pakistan *** Hafeez ur Rehman, Professor / Chairman Department of Economics, School of Business
and Economics, University of Management and Technology, Lahore, Pakistan
(Corresponding Author)
JPUHS, Vol.30, No.1, January - June, 2017
148
capital (education, skills, training etc.). In any organization it is also renewable
source of creativity and innovativeness. Thushealth care, education and training
are the major sources of human capital.
According to Schultz (1961), human capital is an important element which
improves a firm’s assets and helpsemployees to increase their productivity to
sustain competitive advantage. Human capital includes education, training and
other professional initiatives that increase the level of knowledge, skills, abilities,
values, and social assets of an employee which leads to an increase not only in
employee’s satisfaction and performance but also improves the firm’s performance
(Marimutho et al., 2009).
“To build up a competitive advantage, it is very important for every firm that it
should truly influence on the workforce as a competitive weapon. Firm’s strategy
to increase the labour productivity to make it higher value for the firms has
become an important issue. Firms always try to utilize their workforce to optimize
them through comprehensive human capital development programs not only to
achieve business goals but also for a long term survival and sustainability. To
accomplish this task, firms invest their resources to make sure that employees have
at least minimum knowledge, skills, and abilities they need to work effectively in a
rapidly changing and complex environment”(Marimutho et al, 2009).
Human capital is just like an intangible asset of an organization. It includes all of
the competencies and commitments of the workforce within an organization, i.e.
skills, experience, potential and capacity. Human capital theory is based upon the
assumption that education, training and employees benefits raise the marginal
physical product of labour. Firm’s performance is greatly linked with the workers
remuneration and profit sharing which significantly improves employee’s attitude
towards work (for detail see Blanchflower, 1991). “Performance Related pay
(PRP) is the most popular instrument that increases the efficiency of workforce.
Firms with PRP scheme have higher productivity than those which do not adopt”
(Gielen et al., 2010).
The existing literature suggests that proper utilization of human capital hasits
positive impact on firm’s performance. Education of entrepreneurs is also
positively related to the growth of firms. More educated people put more efforts
and adopt new technology and hence earn more sale revenue (Abdul and Tetsuski,
2010).Recent literature has shown that investment in human capital is substantial
for sustaining and improving the economic growth over time. Educated people
adopt new techniques of production more quickly and technological change is an
increasing function of educational attainment in the long run and connection
between education and economic growth has significant implication through the
technological progress(Nelson and Phelps, 1966).
The literature indicates that training is a part of human capital which has
significant impact on raising productivity and the impact of training on blue-collar
workers productivity is higher than the white-collar (Clerks and Executives)
workers (Colombo and Stanca,2008). Previous literature also suggests that training
has positive and significant impact on productivity but its effect on wage is small
(Conti, 2005). Training has positive impact on both productivity and wages but
The Feminist Discourse
149
impact on wage is smaller and almost half of the productivity in magnitude
(Dearden et al., 2006).
Recent literatures have identified the importance of human capital in productivity
and empirical evidence has indicated that education, capital labour ratio, wages of
labour and training have higher return to productivity of both labour and firm.1
Owners and managers with higher education and experience carry out more
innovation in manufacturing industries which increases productivity(Hoang,
2014). Number of studies regarding human capital concluded that better educated
individuals earn more through more productivity (Lebedinski andVandenberghe,
2013).
The objective of this study is to investigate the role of human capital in raising
labour productivity through empirical case study in district Lahore. For this
purpose, cross sectional data of manufacturing, trading and service sector of firms
in Lahore has been used. The rest of the study is organized as follows: In section
II, a brief review of earlier studies has been presented. Section III presentsdata
source and methodology. Results and discussions are presented in section
IV.Finally, conclusion and recommendations are given in section V.
Literature Review
Nelson and Phelps (1966) carried out a research on investment in human
technological diffusion and economic growth on the agriculture sector of United
States. They suggested that manager with more education adopts new techniques
of production more quickly. Farmers with less education are prudent to delay to
invest in technology than the educated farmers. Their hypotheses predict that
technological change is an increasing function of educational attainment in the
long run. Finally, they concluded that connection between education and economic
growth has significant implications through the technological progress.
Tsang (1987) analyzed the impact of underutilization of education on productivity
in 22 US Bell companies. The author found that job satisfaction decreases with the
higher level of education and younger employees are less satisfied with their jobs
than older. The results of the study revealed that there exists negative and
significant relationship between education and firm’s output.The study pointed out
that underutilization of education increases output cost whichresults in lower
productivity.
Blanchflower (1991) investigated the effects of profit sharing in Great Britain. The
study depicts that British gas and Telecom Companies offered shares to their
employees and which have increased the numbers of employees.The study
revealed that profit sharing significantly improves employee’s attitude towards
work and employee’s view about company.The study concluded that firm’s
commercial performance is greatly linked with the workers’ remuneration.
Fafchamps and Quisumbing(1999) pointed out that numbers of studies regarding
impact of human capital on agriculture output have been conducted but these
studies did not consider the allocation of labour between farm and off-farm
1(For detail see, Delmas and Pekovic, 2013; Aggrey, 2010; Artige and Nicolin, 2006;
Colombo and Stanca, 2008).
JPUHS, Vol.30, No.1, January - June, 2017
150
activities. The authors investigated the impact of human capital on productivity
and labour allocation of rural households. The results of the study showed that
males and females with higher education have higher non-farm incomes.
Conti (2005) analyzed the effect of training on productivity and wages in Italy
using panel data from 1996-1999. Both Ordinary Least Square (OLS) and Fixed
Effect (FE) estimates showed that training and capital-labour ratio have significant
and positive impact on productivity. Research and Development (R&D) also
showed strongrelation with productivity but increase in working hour resulted in
fall in productivity. The study concluded that training has long run relationship
with productivity but the impact of training on wages is low.
Fleisher et al. (2011) investigated the role of education on worker productivity
using the data of firms in five cities of china from 1998-2000. The results of the
study indicated that marginal productivity of more educated people exceeds by
large margin than less educated workers. The estimated returns to education were
found significant and positive in two cities of china. Moreover,the study found that
marginal products were higher than wages of workers and this gap was bigger
between the highly educated workers than less educated workers.
Colombo and Stanca (2008) analyzed the impact of training on productivity and
providedcomparison between employer and employee’s returns to training. The
results of study showed that capital per worker, share of executives, patents
intensity and training were significantly and positively associated with the labour
productivity. Moreover,impact of training on blue-collar workers’ productivity
was more than the white-collar (Clerks and Executives) workers.
Hamid and Pichler (2009) analyzed the factors of growth and productivity in
manufacturing concerns over the period of 1971-72 to 2004-05. Empirical results
of their study showed that technology has significant and positive relation with
value-added growth in the manufacturing sector in Pakistan. Similarly, capital
stock, human capital and labour showed significant and positive effect on the
growth and productivity.
Aggrey (2010) investigated the impact of human capital on labour productivity in
the manufacturing industries of Sub-Sahara countries by using Generalized Least
Square (GLS) method.Data was collected through agricultural manufacturing
firms across Kenya, Tanzania and Uganda during 2002-2003. The results of the
study showed that capital-labour ratio, average education and training were
positively associated with labour productivity in Kenya and Uganda. Moreover,
foreign ownership, size, proportion of skilled workers had also positive impact on
labour productivity in Uganda. While, in Tanzania education of a manager and
proportions of skilled workers were positively associated with the productivity of
labour in the manufacturing concerns.
Delmas and Pekovic (2013) tried to analyze the impact of social and green capital
on labour productivity.The results of the study showed that financial participation,
interpersonal relations, environmental practices had significant and positive impact
on labour productivity. Moreover, average working hours of employees and
training were also positively associated with the productivity of labour but firm
size was negatively associated with productivity.
The Feminist Discourse
151
Jana and Petr (2013) discussed the impact of profit sharing on productivity,
profitability and competitiveness and found that most of the studies reported
positive effects on productivity and profitability. Weitzman (1987), Wadhwani and
Wall (1990) and Cooke (1994) found that profit sharing was significantly and
positively related to productivity. But Wadhwani and Wall (1990) failed to find
positive relationship between profit sharing and employment. The study concluded
that profit sharing increases the competitiveness of firms by increasing
cooperation between employers andemployees but it may be harmful when profit
sharing is incorrectly implemented.
Burger and Teal (2014) estimated the effect of schooling on the productivity of
workers in the industrial panel of South African countries. Pooled OLS results
indicated that productivity of workers was higher for educated workers at low
level of schooling than the high level of schooling. Moreover, capital stock and
employment level were also significantly related to productivity of workers but at
first difference level schooling affect was insignificantly related to product.
Lebedinski and Vandenberghe (2014) estimated the effect of education on
productivity at firm’s level using panel data in Belgium. Overall impact of
education on productivity was found positive and significant, i.e., two years
college and university educational workers were more productive than primary
education workers. The study concluded that better educated individuals earn more
due to more productivity.
Data and Methodology
Cross sectional study is conducted to analyze the role of human capital in labour
productivity and primary source of data is used after designing questionnaire.
There are many techniques and sources of collecting primary data.The study used
field survey technique and interviewed employers, directors and managers of the
firms and collected data of those firms and industries, which have factories, head
offices and regional offices located in Lahore.
For sampled designed first of alla list of companies is prepared, which are listed in
Lahore Stock Exchange (LSE). Only 90 companies were found registered in LSE
including all the sectors which are under consideration of the study (i.e.,
manufacturing, trading and services). In order to increase sample sizethose
companies were also approached, which were not registered in LSE but registered
in Lahore Chamber of Commerce (LCCI). In LCCI more than two thousands of
firms and shops were registered. The selection of companies in the sample was
based on proper working environment and the existence of different departments
like human resource account and which have at least ten employees on payroll.
For sample purpose we visited 400 factories, offices of different firms in Lahore
by using convenient random sampling.The data was collected from 243 firms out
of which 150were manufacturing concerns, 43 were trading concerns and 50 were
service concerns. For analyzing the impact of human capital on labour
productivity Ordinary Least Square (OLS) estimation techniques was used.
Model Specification
For examining the relationship between human capital and labour productivity the
following model is proposed.
JPUHS, Vol.30, No.1, January - June, 2017
152
Variable’s Description
LnLp = Log of labour productivity
Like previous study labour productivity is measured as firm’s gross value added
divided by the labour input.Firm’s gross value added is measured as total sale of
the firm less cost of intermediate inputs which include cost of raw material and
expenditure on electricity, water, fuel and gas. Labour input includes total number
of permanent or contractual employees during the year.
LnAGE = Log of age
Age is measured as weighted average Age of employees in a firm. Weights were
given from 1-3 for different age ranges of employees. Employees with age less
than 30 years were given weight as “1”. Employees range between the age of 30-
45 were given weight as “2” and employees who have age above 45 years were
given weight as “3”.
Ln EDU = log of education
Education is measured as weighted average education of employees in a firm.
Weights were given to average schooling years ranges from 1-5. Lower weight
was given to lower schooling and vice versa. Employees who were under metric
were given weight as “1”. Employees who were matric were given weight as “2”.
Employees who have education of intermediate were given weight as “3”.
Employees who have education of bachelor (i.e., 14 years education) were given
weight as “4” and the higher weight was given to employees who have Master’s
degree or equalant as “5”.
Ln DOT = Log of training
Training is measured as average duration of training in number of days per year of
employees inside or outside the firm.
Ln SW = Log of skilled workers
Skilled workers are the asset of any firm. “Skilled workers include technicians,
managers, engineers, scientists, foremen, supervisors, accountants and production
workers” (Aggrey, 2010). In this research proportion of skilled workers is used to
check the relation with firm’s productivity, which is computed as skilled workers
to the total number of employees in a firm.
Ln FP = Log of Financial Participation
Financial participation includes the share of firm’s profit paid to the employee.
Profit sharing significantly improves employee’s attitude towards work
(Blanchlower, 1991). Incentives are positively associated with firm’s productivity
(Black and Lynch, 2000). Profit sharing is measured as allowances given to
employees. In this context three questions were asked about allowances. (1) Does
your firm provide benefits (Food, pension and gratuity funds, house or rent
allowances etc.) to permanent employees? (2) Does your firm provide medical
allowances to permanent employees? (3) Does your firm provide Insurance facility
The Feminist Discourse
153
to permanent employees?If firm pays allowance to its employees otherwise value
was given “1” otherwise “0”.
Ln WH = Log of Working Hours
Following the previous literature (e.g., Artige and Nicolini, 2006; Dearden et al.,
2005), the study includes the average working hours of employees per week in the
model.
Ln MW= Log of Manager’s Wage
Dearden et al. (2005) found that managers are more productive and have higher
wages. To check the relationship between manager’s wage and productivity log of
monthly wage of managers is considered.
Results and Discussion
Descriptive Statistics
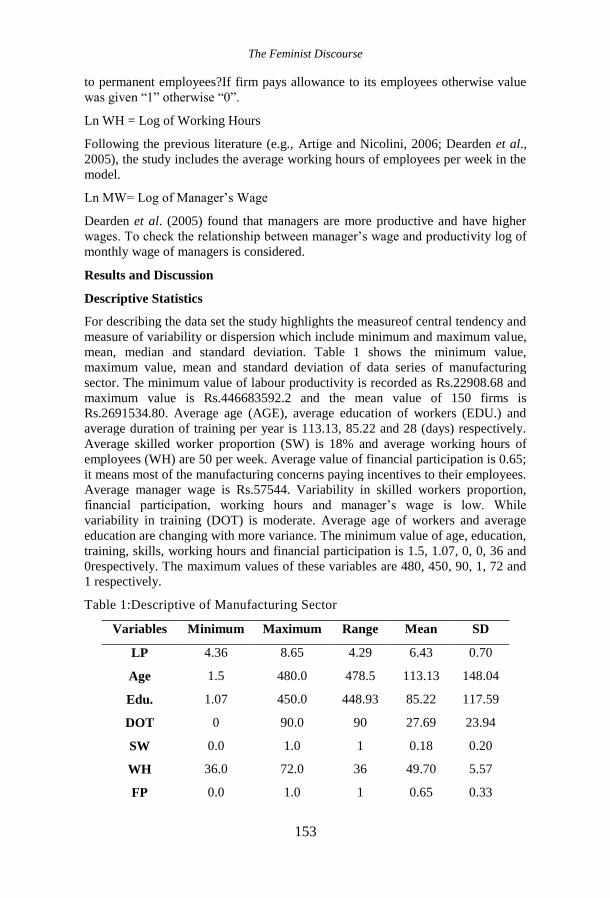
For describing the data set the study highlights the measureof central tendency and
measure of variability or dispersion which include minimum and maximum value,
mean, median and standard deviation. Table 1 shows the minimum value,
maximum value, mean and standard deviation of data series of manufacturing
sector. The minimum value of labour productivity is recorded as Rs.22908.68 and
maximum value is Rs.446683592.2 and the mean value of 150 firms is
Rs.2691534.80. Average age (AGE), average education of workers (EDU.) and
average duration of training per year is 113.13, 85.22 and 28 (days) respectively.
Average skilled worker proportion (SW) is 18% and average working hours of
employees (WH) are 50 per week. Average value of financial participation is 0.65;
it means most of the manufacturing concerns paying incentives to their employees.
Average manager wage is Rs.57544. Variability in skilled workers proportion,
financial participation, working hours and manager’s wage is low. While
variability in training (DOT) is moderate. Average age of workers and average
education are changing with more variance. The minimum value of age, education,
training, skills, working hours and financial participation is 1.5, 1.07, 0, 0, 36 and
0respectively. The maximum values of these variables are 480, 450, 90, 1, 72 and
1 respectively.
Table 1:Descriptive of Manufacturing Sector
Variables Minimum Maximum Range Mean SD
LP 4.36 8.65 4.29 6.43 0.70
Age 1.5 480.0 478.5 113.13 148.04
Edu. 1.07 450.0 448.93 85.22 117.59
DOT 0 90.0 90 27.69 23.94
SW 0.0 1.0 1 0.18 0.20
WH 36.0 72.0 36 49.70 5.57
FP 0.0 1.0 1 0.65 0.33
JPUHS, Vol.30, No.1, January - June, 2017
154
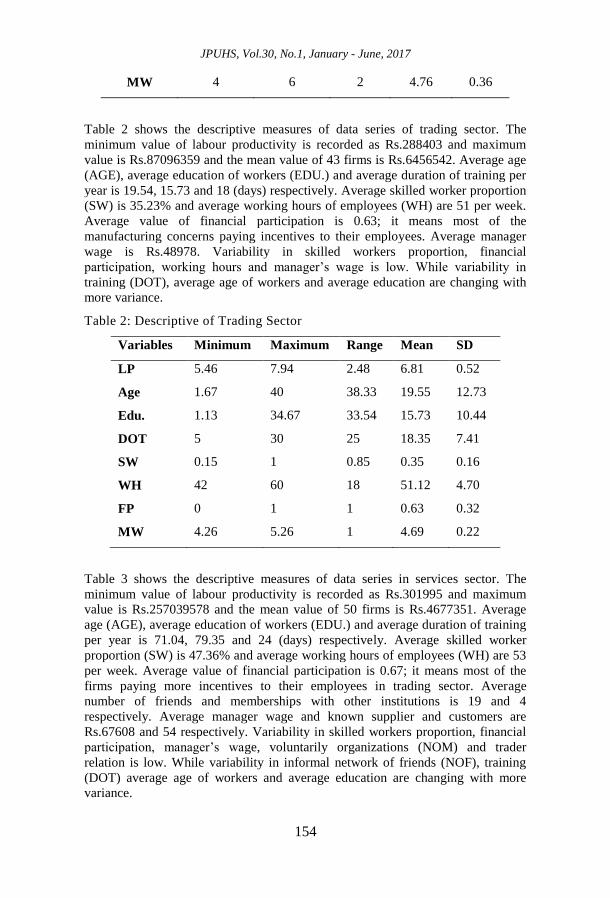
MW 4 6 2 4.76 0.36
Table 2 shows the descriptive measures of data series of trading sector. The
minimum value of labour productivity is recorded as Rs.288403 and maximum
value is Rs.87096359 and the mean value of 43 firms is Rs.6456542. Average age
(AGE), average education of workers (EDU.) and average duration of training per
year is 19.54, 15.73 and 18 (days) respectively. Average skilled worker proportion
(SW) is 35.23% and average working hours of employees (WH) are 51 per week.
Average value of financial participation is 0.63; it means most of the
manufacturing concerns paying incentives to their employees. Average manager
wage is Rs.48978. Variability in skilled workers proportion, financial
participation, working hours and manager’s wage is low. While variability in
training (DOT), average age of workers and average education are changing with
more variance.
Table 2: Descriptive of Trading Sector
Variables Minimum Maximum Range Mean SD
LP 5.46 7.94 2.48 6.81 0.52
Age 1.67 40 38.33 19.55 12.73
Edu. 1.13 34.67 33.54 15.73 10.44
DOT 5 30 25 18.35 7.41
SW 0.15 1 0.85 0.35 0.16
WH 42 60 18 51.12 4.70
FP 0 1 1 0.63 0.32
MW 4.26 5.26 1 4.69 0.22
Table 3 shows the descriptive measures of data series in services sector. The
minimum value of labour productivity is recorded as Rs.301995 and maximum
value is Rs.257039578 and the mean value of 50 firms is Rs.4677351. Average
age (AGE), average education of workers (EDU.) and average duration of training
per year is 71.04, 79.35 and 24 (days) respectively. Average skilled worker
proportion (SW) is 47.36% and average working hours of employees (WH) are 53
per week. Average value of financial participation is 0.67; it means most of the
firms paying more incentives to their employees in trading sector. Average
number of friends and memberships with other institutions is 19 and 4
respectively. Average manager wage and known supplier and customers are
Rs.67608 and 54 respectively. Variability in skilled workers proportion, financial
participation, manager’s wage, voluntarily organizations (NOM) and trader
relation is low. While variability in informal network of friends (NOF), training
(DOT) average age of workers and average education are changing with more
variance.
The Feminist Discourse
155
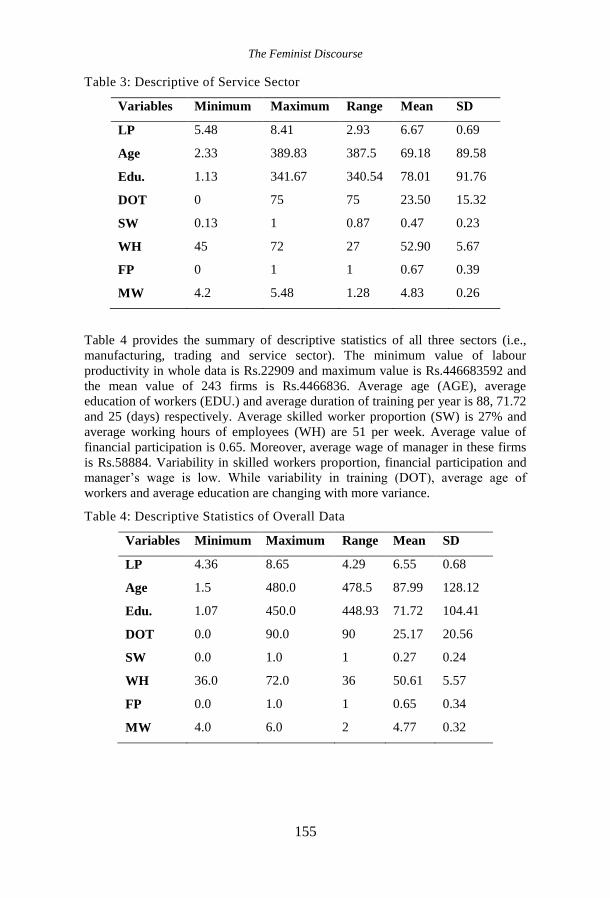
Table 3: Descriptive of Service Sector
Variables Minimum Maximum Range Mean SD
LP 5.48 8.41 2.93 6.67 0.69
Age 2.33 389.83 387.5 69.18 89.58
Edu. 1.13 341.67 340.54 78.01 91.76
DOT 0 75 75 23.50 15.32
SW 0.13 1 0.87 0.47 0.23
WH 45 72 27 52.90 5.67
FP 0 1 1 0.67 0.39
MW 4.2 5.48 1.28 4.83 0.26
Table 4 provides the summary of descriptive statistics of all three sectors (i.e.,
manufacturing, trading and service sector). The minimum value of labour
productivity in whole data is Rs.22909 and maximum value is Rs.446683592 and
the mean value of 243 firms is Rs.4466836. Average age (AGE), average
education of workers (EDU.) and average duration of training per year is 88, 71.72
and 25 (days) respectively. Average skilled worker proportion (SW) is 27% and
average working hours of employees (WH) are 51 per week. Average value of
financial participation is 0.65. Moreover, average wage of manager in these firms
is Rs.58884. Variability in skilled workers proportion, financial participation and
manager’s wage is low. While variability in training (DOT), average age of
workers and average education are changing with more variance.
Table 4: Descriptive Statistics of Overall Data
Variables Minimum Maximum Range Mean SD
LP 4.36 8.65 4.29 6.55 0.68
Age 1.5 480.0 478.5 87.99 128.12
Edu. 1.07 450.0 448.93 71.72 104.41
DOT 0.0 90.0 90 25.17 20.56
SW 0.0 1.0 1 0.27 0.24
WH 36.0 72.0 36 50.61 5.57
FP 0.0 1.0 1 0.65 0.34
MW 4.0 6.0 2 4.77 0.32
JPUHS, Vol.30, No.1, January - June, 2017
156
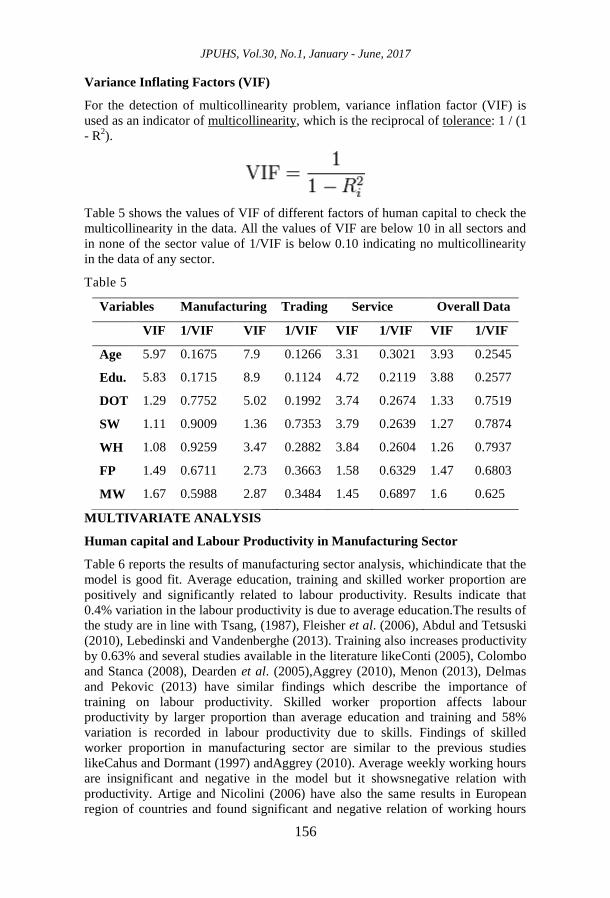
Variance Inflating Factors (VIF)
For the detection of multicollinearity problem, variance inflation factor (VIF) is
used as an indicator of multicollinearity, which is the reciprocal of tolerance: 1 / (1
- R2).
Table 5 shows the values of VIF of different factors of human capital to check the
multicollinearity in the data. All the values of VIF are below 10 in all sectors and
in none of the sector value of 1/VIF is below 0.10 indicating no multicollinearity
in the data of any sector.
Table 5
Variables Manufacturing Trading Service Overall Data
VIF 1/VIF VIF 1/VIF VIF 1/VIF VIF 1/VIF
Age 5.97 0.1675 7.9 0.1266 3.31 0.3021 3.93 0.2545
Edu. 5.83 0.1715 8.9 0.1124 4.72 0.2119 3.88 0.2577
DOT 1.29 0.7752 5.02 0.1992 3.74 0.2674 1.33 0.7519
SW 1.11 0.9009 1.36 0.7353 3.79 0.2639 1.27 0.7874
WH 1.08 0.9259 3.47 0.2882 3.84 0.2604 1.26 0.7937
FP 1.49 0.6711 2.73 0.3663 1.58 0.6329 1.47 0.6803
MW 1.67 0.5988 2.87 0.3484 1.45 0.6897 1.6 0.625
MULTIVARIATE ANALYSIS
Human capital and Labour Productivity in Manufacturing Sector
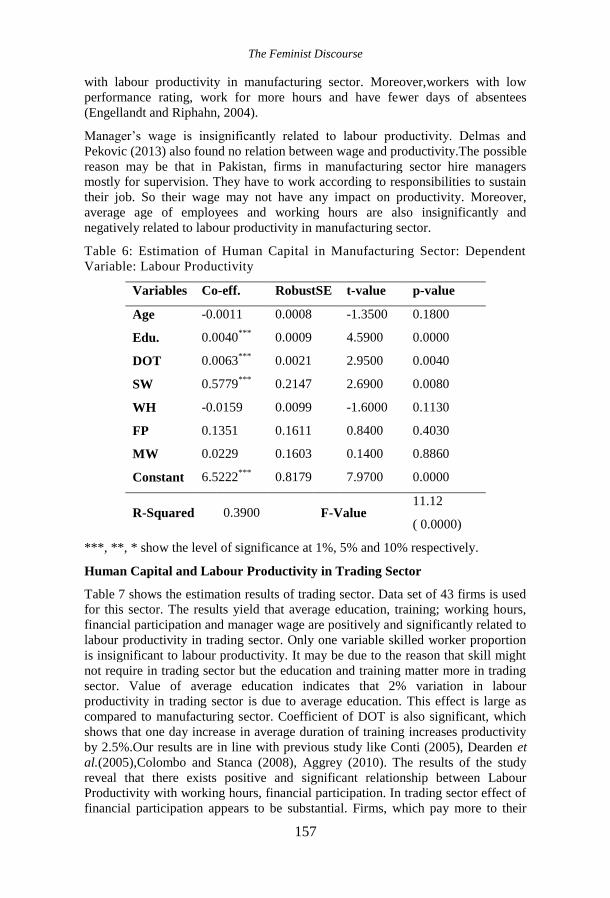
Table 6 reports the results of manufacturing sector analysis, whichindicate that the
model is good fit. Average education, training and skilled worker proportion are
positively and significantly related to labour productivity. Results indicate that
0.4% variation in the labour productivity is due to average education.The results of
the study are in line with Tsang, (1987), Fleisher et al. (2006), Abdul and Tetsuski
(2010), Lebedinski and Vandenberghe (2013). Training also increases productivity
by 0.63% and several studies available in the literature likeConti (2005), Colombo
and Stanca (2008), Dearden et al. (2005),Aggrey (2010), Menon (2013), Delmas
and Pekovic (2013) have similar findings which describe the importance of
training on labour productivity. Skilled worker proportion affects labour
productivity by larger proportion than average education and training and 58%
variation is recorded in labour productivity due to skills. Findings of skilled
worker proportion in manufacturing sector are similar to the previous studies
likeCahus and Dormant (1997) andAggrey (2010). Average weekly working hours
are insignificant and negative in the model but it showsnegative relation with
productivity. Artige and Nicolini (2006) have also the same results in European
region of countries and found significant and negative relation of working hours
The Feminist Discourse
157
with labour productivity in manufacturing sector. Moreover,workers with low
performance rating, work for more hours and have fewer days of absentees
(Engellandt and Riphahn, 2004).
Manager’s wage is insignificantly related to labour productivity. Delmas and
Pekovic (2013) also found no relation between wage and productivity.The possible
reason may be that in Pakistan, firms in manufacturing sector hire managers
mostly for supervision. They have to work according to responsibilities to sustain
their job. So their wage may not have any impact on productivity. Moreover,
average age of employees and working hours are also insignificantly and
negatively related to labour productivity in manufacturing sector.
Table 6: Estimation of Human Capital in Manufacturing Sector: Dependent
Variable: Labour Productivity
Variables Co-eff. RobustSE t-value p-value
Age -0.0011 0.0008 -1.3500 0.1800
Edu. 0.0040***
0.0009 4.5900 0.0000
DOT 0.0063***
0.0021 2.9500 0.0040
SW 0.5779***
0.2147 2.6900 0.0080
WH -0.0159 0.0099 -1.6000 0.1130
FP 0.1351 0.1611 0.8400 0.4030
MW 0.0229 0.1603 0.1400 0.8860
Constant 6.5222***
0.8179 7.9700 0.0000
R-Squared 0.3900 F-Value 11.12
( 0.0000)
***, **, * show the level of significance at 1%, 5% and 10% respectively.
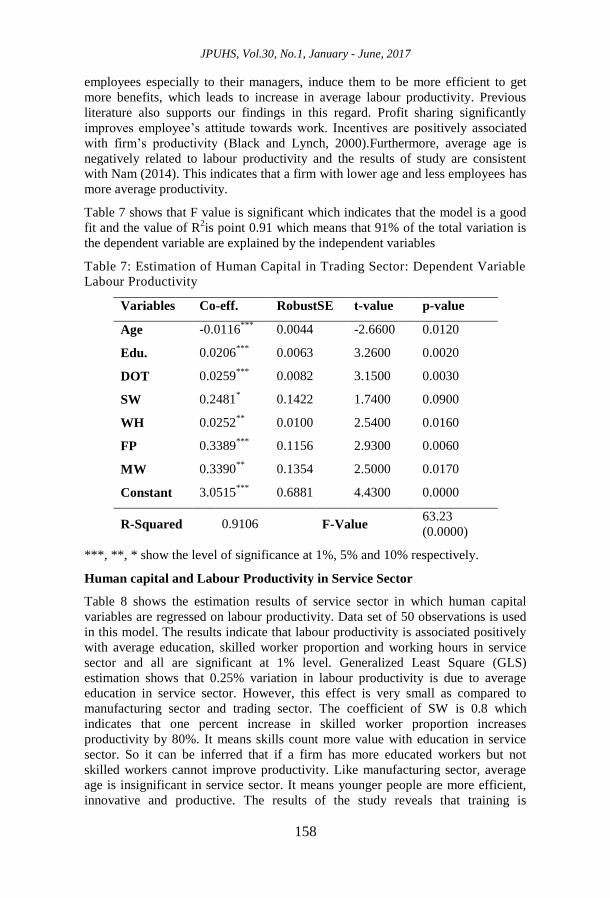
Human Capital and Labour Productivity in Trading Sector
Table 7 shows the estimation results of trading sector. Data set of 43 firms is used
for this sector. The results yield that average education, training; working hours,
financial participation and manager wage are positively and significantly related to
labour productivity in trading sector. Only one variable skilled worker proportion
is insignificant to labour productivity. It may be due to the reason that skill might
not require in trading sector but the education and training matter more in trading
sector. Value of average education indicates that 2% variation in labour
productivity in trading sector is due to average education. This effect is large as
compared to manufacturing sector. Coefficient of DOT is also significant, which
shows that one day increase in average duration of training increases productivity
by 2.5%.Our results are in line with previous study like Conti (2005), Dearden et
al.(2005),Colombo and Stanca (2008), Aggrey (2010). The results of the study
reveal that there exists positive and significant relationship between Labour
Productivity with working hours, financial participation. In trading sector effect of
financial participation appears to be substantial. Firms, which pay more to their
JPUHS, Vol.30, No.1, January - June, 2017
158
employees especially to their managers, induce them to be more efficient to get
more benefits, which leads to increase in average labour productivity. Previous
literature also supports our findings in this regard. Profit sharing significantly
improves employee’s attitude towards work. Incentives are positively associated
with firm’s productivity (Black and Lynch, 2000).Furthermore, average age is
negatively related to labour productivity and the results of study are consistent
with Nam (2014). This indicates that a firm with lower age and less employees has
more average productivity.
Table 7 shows that F value is significant which indicates that the model is a good
fit and the value of R2is point 0.91 which means that 91% of the total variation is
the dependent variable are explained by the independent variables
Table 7: Estimation of Human Capital in Trading Sector: Dependent Variable
Labour Productivity
Variables Co-eff. RobustSE t-value p-value
Age -0.0116***
0.0044 -2.6600 0.0120
Edu. 0.0206***
0.0063 3.2600 0.0020
DOT 0.0259***
0.0082 3.1500 0.0030
SW 0.2481* 0.1422 1.7400 0.0900
WH 0.0252**
0.0100 2.5400 0.0160
FP 0.3389***
0.1156 2.9300 0.0060
MW 0.3390**
0.1354 2.5000 0.0170
Constant 3.0515***
0.6881 4.4300 0.0000
R-Squared 0.9106 F-Value 63.23
(0.0000)
***, **, * show the level of significance at 1%, 5% and 10% respectively.
Human capital and Labour Productivity in Service Sector
Table 8 shows the estimation results of service sector in which human capital
variables are regressed on labour productivity. Data set of 50 observations is used
in this model. The results indicate that labour productivity is associated positively
with average education, skilled worker proportion and working hours in service
sector and all are significant at 1% level. Generalized Least Square (GLS)
estimation shows that 0.25% variation in labour productivity is due to average
education in service sector. However, this effect is very small as compared to
manufacturing sector and trading sector. The coefficient of SW is 0.8 which
indicates that one percent increase in skilled worker proportion increases
productivity by 80%. It means skills count more value with education in service
sector. So it can be inferred that if a firm has more educated workers but not
skilled workers cannot improve productivity. Like manufacturing sector, average
age is insignificant in service sector. It means younger people are more efficient,
innovative and productive. The results of the study reveals that training is
The Feminist Discourse
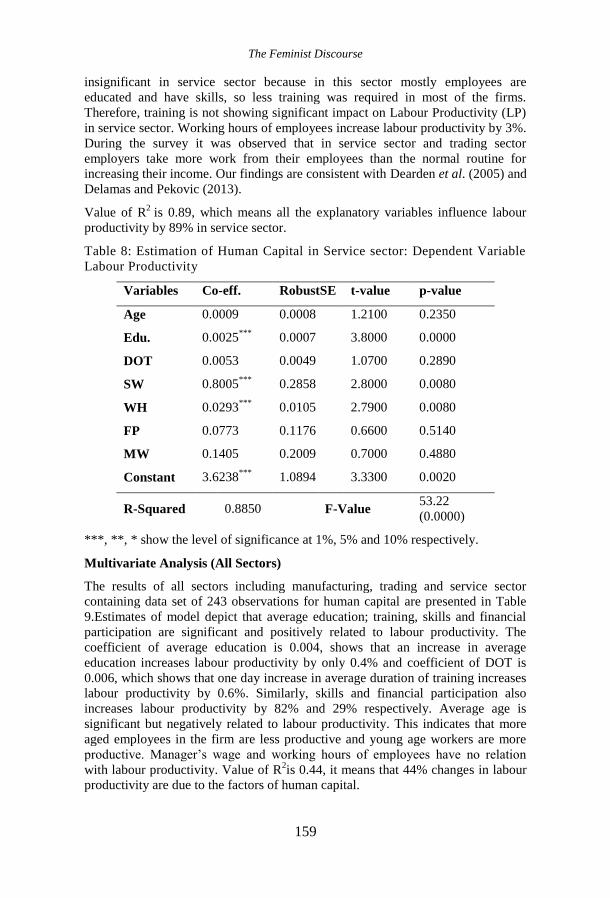
159
insignificant in service sector because in this sector mostly employees are
educated and have skills, so less training was required in most of the firms.
Therefore, training is not showing significant impact on Labour Productivity (LP)
in service sector. Working hours of employees increase labour productivity by 3%.
During the survey it was observed that in service sector and trading sector
employers take more work from their employees than the normal routine for
increasing their income. Our findings are consistent with Dearden et al. (2005) and
Delamas and Pekovic (2013).
Value of R2
is 0.89, which means all the explanatory variables influence labour
productivity by 89% in service sector.
Table 8: Estimation of Human Capital in Service sector: Dependent Variable
Labour Productivity
Variables Co-eff. RobustSE t-value p-value
Age 0.0009 0.0008 1.2100 0.2350
Edu. 0.0025***
0.0007 3.8000 0.0000
DOT 0.0053 0.0049 1.0700 0.2890
SW 0.8005***
0.2858 2.8000 0.0080
WH 0.0293***
0.0105 2.7900 0.0080
FP 0.0773 0.1176 0.6600 0.5140
MW 0.1405 0.2009 0.7000 0.4880
Constant 3.6238***
1.0894 3.3300 0.0020
R-Squared 0.8850 F-Value 53.22
(0.0000)
***, **, * show the level of significance at 1%, 5% and 10% respectively.
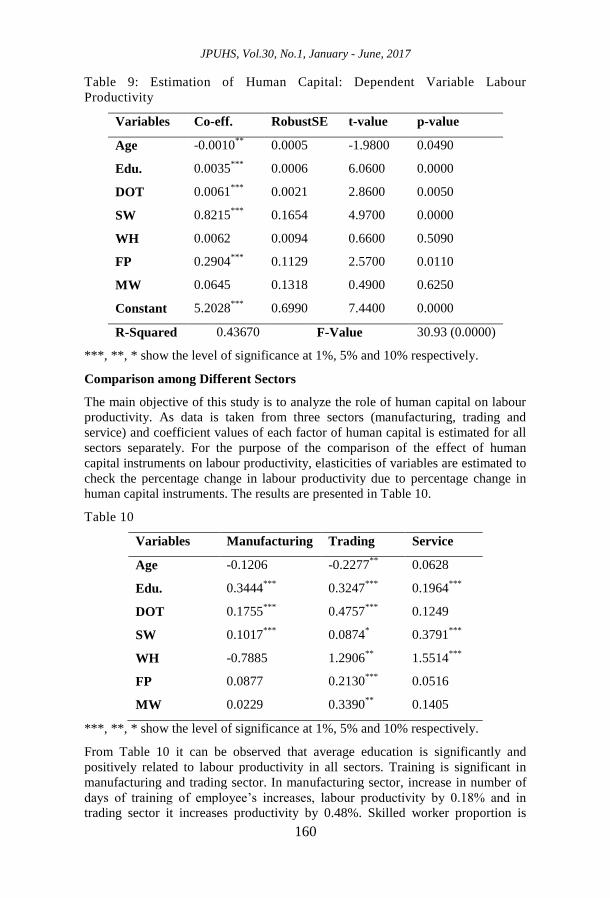
Multivariate Analysis (All Sectors)
The results of all sectors including manufacturing, trading and service sector
containing data set of 243 observations for human capital are presented in Table
9.Estimates of model depict that average education; training, skills and financial
participation are significant and positively related to labour productivity. The
coefficient of average education is 0.004, shows that an increase in average
education increases labour productivity by only 0.4% and coefficient of DOT is
0.006, which shows that one day increase in average duration of training increases
labour productivity by 0.6%. Similarly, skills and financial participation also
increases labour productivity by 82% and 29% respectively. Average age is
significant but negatively related to labour productivity. This indicates that more
aged employees in the firm are less productive and young age workers are more
productive. Manager’s wage and working hours of employees have no relation
with labour productivity. Value of R2is 0.44, it means that 44% changes in labour
productivity are due to the factors of human capital.
JPUHS, Vol.30, No.1, January - June, 2017
160
Table 9: Estimation of Human Capital: Dependent Variable Labour
Productivity
Variables Co-eff. RobustSE t-value p-value
Age -0.0010**
0.0005 -1.9800 0.0490
Edu. 0.0035***
0.0006 6.0600 0.0000
DOT 0.0061***
0.0021 2.8600 0.0050
SW 0.8215***
0.1654 4.9700 0.0000
WH 0.0062 0.0094 0.6600 0.5090
FP 0.2904***
0.1129 2.5700 0.0110
MW 0.0645 0.1318 0.4900 0.6250
Constant 5.2028***
0.6990 7.4400 0.0000
R-Squared 0.43670 F-Value 30.93 (0.0000)
***, **, * show the level of significance at 1%, 5% and 10% respectively.
Comparison among Different Sectors
The main objective of this study is to analyze the role of human capital on labour
productivity. As data is taken from three sectors (manufacturing, trading and
service) and coefficient values of each factor of human capital is estimated for all
sectors separately. For the purpose of the comparison of the effect of human
capital instruments on labour productivity, elasticities of variables are estimated to
check the percentage change in labour productivity due to percentage change in
human capital instruments. The results are presented in Table 10.
Table 10
Variables Manufacturing Trading Service
Age -0.1206 -0.2277**
0.0628
Edu. 0.3444***
0.3247***
0.1964***
DOT 0.1755***
0.4757***
0.1249
SW 0.1017***
0.0874* 0.3791
***
WH -0.7885 1.2906**
1.5514***
FP 0.0877 0.2130***
0.0516
MW 0.0229 0.3390**
0.1405
***, **, * show the level of significance at 1%, 5% and 10% respectively.
From Table 10 it can be observed that average education is significantly and
positively related to labour productivity in all sectors. Training is significant in
manufacturing and trading sector. In manufacturing sector, increase in number of
days of training of employee’s increases, labour productivity by 0.18% and in
trading sector it increases productivity by 0.48%. Skilled worker proportion is
The Feminist Discourse
161
significant and is positively related to labour productivity in manufacturing and
service sector. In manufacturing sector, if skilled worker proportion increases by
1%, then labour productivity also goes up by 0.10%. In service sector, if skilled
worker proportion increases by 1% then labour productivity goes up by 0.38%.
Working hours of employees are positively and significantly related with labour
productivity only in trading sector and service sector. Remaining two variables;
financial participation and manager wage is significantly related to labour
productivity only in trading sector.
Conclusion and Recommendations
The present study is conducted to analyze the role of human capital on labour
productivity. Descriptive analysis points out the differences in productivity level in
different sectors. Regression analyses also confirm the productivity determinants
with the statistical evidence on the source of this heterogeneity. The study shows
that in sector-wise analyses, labour productivity is heterogeneous among different
sectors. Average education is positively and significantly related to labour
productivity in all sectors, but the effect is slightly larger in manufacturing sector.
Average duration of training is also positive and significant in manufacturing and
trading sectors. Skills are related to productivity positively in manufacturing and
service sector. But in service sector, skills contribute more to productivity than in
manufacturing sector. Financial participation and manager’s wage are significant
and positively related to productivity only in trading sector. The study concludes
that human capital, especially education, training and skills are important factors
which raise the productivity.
The study recommends that firms should increase investment in the various
aspects of human capital not only to attain greater performance but also to remain
competitive for their long run survival. Furthermore, government should increase
the budget of education along with the other sector of economy and government
should allocate at least 4% of GDP for education in every circumstances. There is
a need to allocate more funding for technical and vocational institutes for
developing skills in workers. The manufacturing sector needs highly skilled and
technical workers and there is a need to provide training facilities to the workers
on priority basis so that labour productivity can be enhanced. For this purpose,
government should pay more attention for promoting the role of Technical
Education and Vocational Training Authority (TEVTA)in the province.
JPUHS, Vol.30, No.1, January - June, 2017
162
References
Artige, L., & Nicolini, R. (2006). Labor productivity in Europe: Evidence from a
sample of regions. CREPP Working Paper No. 2006/08.
Aggrey, N. (2010). Effect of Human Capital on Labor Productivity in Sub-Sahara
African Manufacturing Firms.
Black, S., Lynch, L.(1996). Human Capital Investment and Productivity.
American Economic Review 86(2), 263-267.
Black, S. E., & Lynch, L. M. (2004). What's driving the new economy? The
benefits of workplace innovation. The Economic Journal, 114(493), 97-116.
Cooke, W. N. (1994). Employee participation programs, group-based incentives,
and
company performance: A union-nonunion comparison. Industrial and Labor
Relations Review,47(4), 594-609.
Blanchflower, D. G. (1991). The economic effects of profit sharing in Great
Britain. International Journal of Manpower, 12(1), 3-9.
Colombo, E., & Stanca, L. M. (2008). The impact of training on productivity:
evidence from a large panel of firms.Working Paper No. 134, University Of Milan
– Bicocca.
Conti, G. (2005). Training, productivity and wages in Italy. Labour
economics,12(4),
557-576.
Delmas, M., & Pekovic, S. (2013). The engaged organization: Human Capital,
Social Capital, Green Capital and Labor Productivity. In Academy of Management
Proceedings (Vol. 2013, No. 1, p. 10483).
Dearden, L., Reed, H., & Van Reenen, J. (2006). The impact of training on
productivity and wages: Evidence from British panel data*. Oxford bulletin of
economics and statistics, 68(4), 397-421.
Engellandt, A., & Riphahn, R. T. (2004). Incentive effects of bonus payments:
evidence from an international company.
Fafchamps, M., & Quisumbing, A. R. (1999). Human capital, productivity, and
labor allocation in rural Pakistan. Journal of Human Resources, 34(2), 369-406.
Fleisher, B. M., et al. (2011). Economic transition, higher education and worker
productivity in China. Journal of Development Economics, 94(1), 86-94.
Gielen, A. C. et al. (2010). How performance related pay affects productivity and
employment. Journal of Population Economics, 23(1), 291-301.
Hamid, A., & Pichler, J. H. (2009). Human Capital Spillovers, Productivity and
Growth in the Manufacturing Sector of Pakistan. The Pakistan Development
Review,48(2), 125-140.
Jana, F., & Petr, P. (2013). Profit-Sharing–A Tool for Improving Productivity,
Profitability and Competitiveness of Firms? Journal of Competitiveness, 5(4), 3-
25.
The Feminist Discourse
163
Lebedinski, L., & Vandenberghe, V. (2014). Assessing education’s contribution to
productivity using firm-level evidence. International Journal of Manpower, 35(8),
1116-1139.
Marimuthu, M. et al. (2009). Human capital development and its impact on firm
performance: Evidence from developmental economics. The journal of
international social research, 2(8), 265-272.
Nam, V. Hoang (2014). The Roles of Human and Social Capital in the
Development of Manufacturing SMEs in Vietnam. Journal of Economics and
Development, 16(1), 5-12.
Nelson, R. R., & Phelps, E. S. (1966). Investment in humans, technological
diffusion, and economic growth. The American Economic Review, 56(1/2), 69-75.
Romer, P. M. (1990, May). Human capital and growth: theory and evidence. In
Carnegie- Rochester Conference Series on Public Policy (Vol. 32, pp. 251-286).
North-Holland.
Schultz, T. W. (1961). Investment in human capital. The American economic
review, 51(1), 1-17.
Tsang, M. C. (1987). The impact of underutilization of education on productivity:
A case study of the US Bell companies. Economics of Education Review, 6(3),
239-254.
Wadhwani, S., & Wall, M. (1990). The Effects of Profit Sharing on Employment,
Wages, Stock Returns and Productivity: Evidence from UK Micro Data. Economic
Journal, 100(399), 1-17.