Embed Size (px)
Citation preview

1
952659
Human Factors Evaluation of Existing SideCollision Avoidance System Driver Interfaces
Elizabeth N. MazzaeTransportation Research Center Inc.
W. Riley Garrott, Mark A. FlickNational Highway Traffic Safety Administration
ABSTRACT
This paper describes the assessment of driver interfaces of a typeof electronics-based collision avoidance systems that has beenrecently developed to assist drivers of vehicles in avoidingcertain types of collisions. The electronics-based crashavoidance systems studied were those which detect the presenceof objects located on the left and/or right sides of the vehicle,called Side Collision Avoidance Systems, or SCAS.
As many SCAS as could be obtained, including several pre-production prototypes, were acquired and tested. The testingfocused on measuring sensor performance and assessing thequalities of the driver interfaces. This paper presents only theresults of the driver interface assessments. The sensorperformance data are presented in the NHTSA report“Development of Performance Specifications for CollisionAvoidance Systems for Lane Changing, Merging, and Backing --Task 3 - Test of Existing Hardware Systems” [1].
One goal of this research was to evaluate, based upon theprinciples of human factors, how well the driver interfaces of theSCAS studied were designed. The strengths and weaknesses ofeach driver interface were determined. Overall, while none ofthe SCAS had an “ideal” interface, most had ergonomicallyacceptable interfaces. Not surprisingly, the commerciallyavailable systems tended to have better driver interfaces than didthe prototypes. Another goal of this research was to provideadvice to future designers of collision avoidance system driverinterfaces regarding ergonomically desirable or undesirablefeatures. From the evaluations performed, a preliminary set ofdriver interface performance specifications that may be of aid tofuture SCAS driver interface designers has been developed.
INTRODUCTION
This paper describes the evaluation of driver interfaces of a typeof electronics-based system that has been recently developed toassist drivers of both light (passenger cars, pickup trucks, vans,and sport utility vehicles) and heavy (straight trucks and tractor-semitrailers) vehicles in avoiding certain types of crashes. The
driver interface is defined as the displays and controls throughwhich the driver interacts with the CAS and receives collisionavoidance warning information. The type of electronics-basedCollision Avoidance Systems, or CAS, examined was that whichdetects the presence of objects located on the left and/or rightsides of the vehicle (referred to as side-looking collisionavoidance systems or SCAS). These side-looking systems areintended primarily as supplements to the existing side- and rear-view mirror systems. The SCAS assist the driver during lanechanges and merges by detecting adjacent vehicles.
This research was performed as part of a larger researchprogram, “Development of Performance Specifications forSystems Which Assist in Avoiding Collisions During LaneChanges, Merging, and Backing” sponsored by the NationalHighway Traffic Safety Administration (NHTSA). The researchwas performed by TRW’s Space and Electronics Group withassistance, during the Phase 1 testing, from NHTSA’s VehicleResearch and Test Center (VRTC) and various subcontractors.
A portion of Phase 1 (Laying the Foundation) of the researchprogram “Development of Performance Specifications forSystems Which Assist in Avoiding Collisions During LaneChanges, Merging, and Backing” was devoted to examiningexisting collision avoidance systems. As many SCAS as couldbe obtained, including several pre-production prototypes, wereacquired and tested by TRW and VRTC. The focus of testingwas on measuring the performance of the SCAS sensors andassessing the qualities of their driver interfaces. This paperdocuments the results of the evaluation of driver interfaces. Acompanion report, “Development of Performance Specificationsfor Collision Avoidance Systems for Lane Changing, Merging,and Backing -- Task 3 - Test of Existing Hardware Systems” [1],documents the examination of the SCAS sensors and the resultsof the assessment of their performance.
This paper is a summary of the NHTSA technical report “AHuman Factors Assessment of the Driver Interfaces of ExistingCollision Avoidance Systems” [2]. Readers desiring additionaldetails about this research should consult this reference.PURPOSE
2
The goals of this research to evaluate the design of existingSCAS driver interfaces were:
1. To evaluate, based upon human factors principles, howwell the driver interfaces of the SCAS studied weredesigned. This included examining such issues as theeffectiveness of the interface designs in conveyinginformation to the driver, considering the effect interfacedesigns might have on overall driver workload, anddetermining whether or not the interface designs wouldunduly distract or annoy drivers.
2. To provide preliminary advice to designers of SCASdriver interfaces regarding potentially desirable orundesirable features and qualities of the interfaces asbased upon the principles of human factors. The intentof this goal is to promote better driver interface designsby allowing designers to easily understand the strengthsand weaknesses of current designs.
3. To identify SCAS driver interface design issues thatshould be the focus of future research. While existinghuman factors literature provides recommendationsabout many aspects of man-machine interface design,several aspects important to SCAS for automobiles andtrucks are not addressed in the literature. Identificationof important design issues will encourage futureresearchers to develop the needed guidance.
4. To improve methods for evaluating SCAS driverinterface designs. The development of better,standardized methods for evaluating driver interfacedesigns for collision avoidance systems will bothimprove the quality of research on this topic and allowengineers to evaluate their own designs, resulting inmore user-friendly products.
SYSTEMS EXAMINED
For this research, the driver interfaces of seven SCAS werestudied. Of these systems, two were commercially available andfive were pre-production prototypes. The two commerciallyavailable systems constituted all of the commercially availableSCAS known to NHTSA at the time of initiation of the study.The five pre-production prototypes were all of the prototypeSCAS known to NHTSA at that time.
While the focus of this research addressed the use of SCAS forlight vehicle applications (passenger cars, pickup trucks, vans,and sport utility vehicles, all with gross vehicle weight ratingsbelow 44,500 Newtons) several of the systems evaluated wereintended primarily for use on heavy trucks. The heavy trucksystems were included in this study because:
1. There are no major functional differences between theoperation of heavy truck and light vehicle SCAS.Heavy truck and light vehicle CAS differ primarily inthe size and shape of the zones around the vehicle inwhich driver’s awareness of traffic, pedestrians, and
other obstacles needs to be improved. However, thefundamental functions of the SCAS, detecting objectsaround the vehicle (or enhancing driver vision) andconveying information to the driver are the same forboth heavy and light vehicles.
2. Examining many systems allowed for a betterunderstanding of the available and desirablecapabilities and qualities of SCAS. Examiningmultiple systems maximizes the range of systemcapabilities seen and makes it less likely that animportant capability may be overlooked. In this study,although all available SCAS intended for use in bothheavy and light vehicles were examined, there stillwere not very many systems of each type examined.
The objective of this research was to report findings related tothe CAS driver interface. However, due to the methodologyused in this study the performance of a system’s driver interfacewas, to some extent, intertwined with the performance of thatsystem’s sensors. This study examined SCAS as whole units.No attempt was made to disassociate a system’s driver interfacefrom a system’s sensors (as could be done by, for example,connecting a driver interface to an “ideal” sensor). Therefore,to allow readers to better understand each SCAS, a briefsummary of the most important characteristics of each system’ssensor performance is included below. This material was takenfrom the “Development of Performance Specifications forCollision Avoidance Systems for Lane Changing, Merging, andBacking -- Task 3 - Test of Existing Hardware Systems” [1].Readers desiring more information about the performance ofeach system’s sensors or how these data were gathered shouldconsult this reference.
Seven SCAS were examined in this study. These systems weredesignated using letters as Systems A, B, and D through H.(System C was a pre-production prototype that originally was tobe included in the study. However, due to delays in obtainingthe system, it was not included in this report.)
Table 1 summarizes general characteristics of each SCASstudied. The table shows whether or not each system was aprototype or commercially available, whether or not each systemwas originally designed for a light vehicle, whether the sensordetection zones covered only the left, only the right, or bothsides of the vehicle, and the technology of the sensors. The tworightmost columns show the time that it took for each system toreact when an object moving parallel to vehicle entered (DelayTime) or exited (Persistence Time) the sensor’s field of view.These columns are shown since they could have a substantialimpact on a driver’s perception of a warning signal provided bya SCAS. Due to problems with the sensors for System A, delaydata were not able to be collected for this system.

3
TABLE 1. Characteristics of SCAS Studied
SCAS PrototypeSystem?
For LightVehicle?
Sides Covered SensorTechnology
Delay Time Persistence Time
A No No Right Ultrasonic -- --
B Yes Yes Right Radar 0.07 s 0.51 s
D Yes No Right Radar 0.52 s 0.12 s
E Yes No Right Radar 0.62 s 1.23 s
F Yes Yes Both Infrared 0.04 s 0.92 s
G Yes Yes Right Radar 0.46 s 0.54 s
H No No Right Radar 1.03 s 1.80 s
METHODOLOGY USED TO ASSESS THE DRIVERINTERFACES OF EXISTING SCAS
The principal data collection instrument used to perform ahuman factors evaluation of existing SCAS was a “HumanFactors Checklist” titled “Descriptive Profile, Human FactorsAssessment, and Operational Judgements of the CollisionAvoidance System Driver/System Interface”. The checklist wasoriginally developed by COMSIS for NHTSA as part of theheavy truck near object detection system study described in thereport titled “A Study of Commercial Motor VehicleElectronics-Based Rear and Side Object Detection Systems”[3].The development of the Human Factors Checklist accompaniedan effort by COMSIS to define the requirements for driverinterface design for collision avoidance systems as outlined in“Preliminary Human Factors Guidelines for Crash AvoidanceWarning Devices” [4]. The checklist was modified for thisprogram by R & R Research Inc. and NHTSA’s VehicleResearch and Test Center (VRTC). A copy of the checklist usedin this study is included as an Appendix to this paper.
In an effort used to reduce the large quantity of data generatedby the Human Factors Checklist, a scoring system was used.The scoring system used was originally developed by COMSISand was modified for use in this program by VRTC.
HUMAN FACTORS CHECKLIST: GENERALCONCEPTS - The Human Factors Checklist was designed tobe used both as a research device and a screening tool. Thisdocument served as a tool for the collection of qualitative andquantitative data characterizing SCAS interfaces and theirassociated visual and auditory information displays and controls.
The checklist was based generally on accepted human factorsprinciples found in handbooks such as “Handbook of HumanFactors” [5] and “Human Factors Design Handbook” [6] as wellas on accepted automotive practices set forth in the Society ofAutomotive Engineer’s (SAE) Recommended Practices.
However, in many cases, guidelines were lacking in necessaryareas important to the design of SCAS driver interfaces. In these
cases, guidelines were extrapolated and judgements as to whatdesign features were most appropriate based on the authors’extensive experience testing collision avoidance systems.
The checklist contained three sections. Section A was adescriptive profile which addressed the operation of the systemhardware and driver displays. Section B consisted of anassessment of the extent to which the visual and auditorydisplays conform to established human factors guidelines.Section C consisted of a questionnaire used by human factorsexperts to assess the design of the driver interface after havingdriven with the systems. Overall, the checklist provided a meansby which the merits of the driver interface could be assessed.
The term “crash avoidance warning” was used during thisresearch to refer to any information which a system provides tothe driver to assist in preventing a collision. The informationcontent of the warning is dependent on the category of thesystem. Crash avoidance warnings are divided into twocategories: 1) cautionary and 2) imminent.
Cautionary crash avoidance warning information is anyinformation provided by a system which warns the driver of apotentially dangerous situation (i.e., an obstructing vehicle in anadjacent lane when considering changing lanes). The term“imminent crash avoidance warning information” refers to anyinformation which a system might provide to warn the driver ofan impending collision.
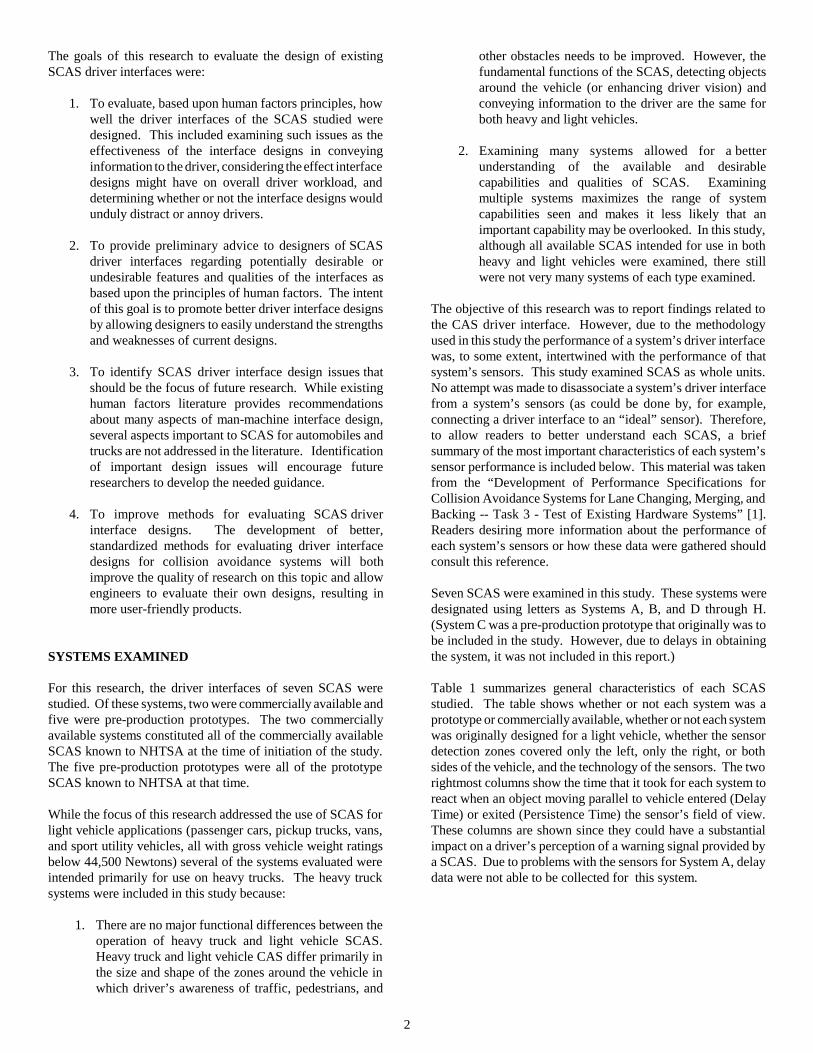
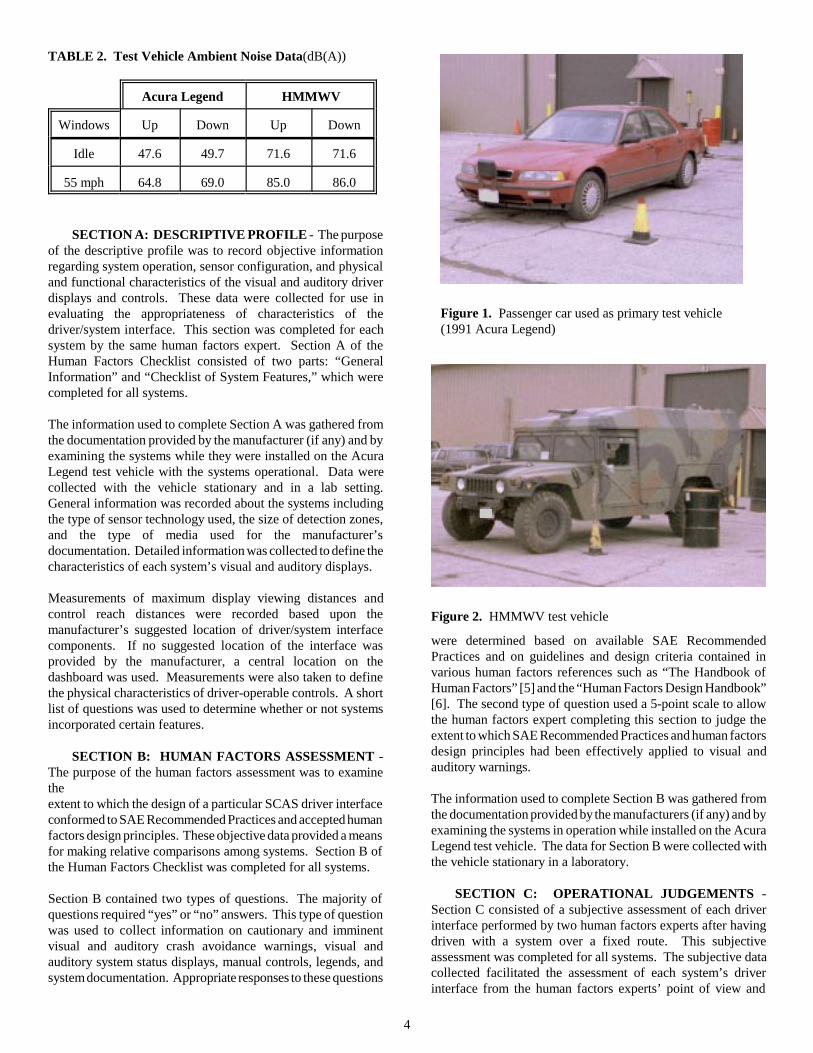
Two test vehicles were used in this study: a 1991 Acura Legendand a U.S. Army High Mobility Multi-Wheeled Vehicle(HMMWV). The passenger car, shown in Figure 1, was used tomake measurements and gather information for Sections A andB of the Human Factors Checklist for each SCAS. TheHMMWV provided for testing, shown in Figure 2, was fittedwith an ambulance body. To obtain the data needed to completeSection C of the checklist, both the HMMWV and the AcuraLegend were equipped with the SCAS and then driven by twohuman factors experts The ambient noise levels for bothvehicles were recorded at idle and while driving at a speed of 55miles per hour and with the vehicle windows up and down.Noise readings were taken at the driver ear point. These ambientnoise data are listed in Table 2.
4
Figure 1. Passenger car used as primary test vehicle (1991 Acura Legend)
Figure 2. HMMWV test vehicle
TABLE 2. Test Vehicle Ambient Noise Data(dB(A))
Acura Legend HMMWV
Windows Up Down Up Down
Idle 47.6 49.7 71.6 71.6
55 mph 64.8 69.0 85.0 86.0
SECTION A: DESCRIPTIVE PROFILE - The purposeof the descriptive profile was to record objective informationregarding system operation, sensor configuration, and physicaland functional characteristics of the visual and auditory driverdisplays and controls. These data were collected for use inevaluating the appropriateness of characteristics of thedriver/system interface. This section was completed for eachsystem by the same human factors expert. Section A of theHuman Factors Checklist consisted of two parts: “GeneralInformation” and “Checklist of System Features,” which werecompleted for all systems.
The information used to complete Section A was gathered fromthe documentation provided by the manufacturer (if any) and byexamining the systems while they were installed on the AcuraLegend test vehicle with the systems operational. Data werecollected with the vehicle stationary and in a lab setting.General information was recorded about the systems includingthe type of sensor technology used, the size of detection zones,and the type of media used for the manufacturer’sdocumentation. Detailed information was collected to define thecharacteristics of each system’s visual and auditory displays.
Measurements of maximum display viewing distances andcontrol reach distances were recorded based upon themanufacturer’s suggested location of driver/system interfacecomponents. If no suggested location of the interface wasprovided by the manufacturer, a central location on thedashboard was used. Measurements were also taken to definethe physical characteristics of driver-operable controls. A shortlist of questions was used to determine whether or not systemsincorporated certain features.
SECTION B: HUMAN FACTORS ASSESSMENT -The purpose of the human factors assessment was to examinethe extent to which the design of a particular SCAS driver interfaceconformed to SAE Recommended Practices and accepted humanfactors design principles. These objective data provided a meansfor making relative comparisons among systems. Section B ofthe Human Factors Checklist was completed for all systems.
Section B contained two types of questions. The majority ofquestions required “yes” or “no” answers. This type of questionwas used to collect information on cautionary and imminentvisual and auditory crash avoidance warnings, visual andauditory system status displays, manual controls, legends, andsystem documentation. Appropriate responses to these questions
were determined based on available SAE RecommendedPractices and on guidelines and design criteria contained invarious human factors references such as “The Handbook ofHuman Factors” [5] and the “Human Factors Design Handbook”[6]. The second type of question used a 5-point scale to allowthe human factors expert completing this section to judge theextent to which SAE Recommended Practices and human factorsdesign principles had been effectively applied to visual andauditory warnings.
The information used to complete Section B was gathered fromthe documentation provided by the manufacturers (if any) and byexamining the systems in operation while installed on the AcuraLegend test vehicle. The data for Section B were collected withthe vehicle stationary in a laboratory.
SECTION C: OPERATIONAL JUDGEMENTS -Section C consisted of a subjective assessment of each driverinterface performed by two human factors experts after havingdriven with a system over a fixed route. This subjectiveassessment was completed for all systems. The subjective datacollected facilitated the assessment of each system’s driverinterface from the human factors experts’ point of view and

5
S 100 WT
provided a means for comparison of this subjective informationwith objective data collected in other parts of the checklist.
Section C consisted of a two-part questionnaire containing astatic evaluation and a dynamic evaluation. Section C wascompleted for each system eight times according to the following2 x 2 x 2 matrix:
2 Human factors experts2 Test vehicles (1991 Acura Legend, HMMWV)2 Lighting conditions (daytime, nighttime/darkness)
Therefore, each expert completed a total of eight drivingsessions with each system.
To complete Section C of the Human Factors Checklist, theexperts first reviewed the manufacturer’s documentation (if any)and became familiar with the operation of a system throughexamination of the device with the test vehicle stationary and thesystem operational. Next, Part I of the questionnaire, whichaddressed the characteristics of the driver/system interface whichcould be observed in a static setting, was completed.
The experts then drove the defined test route with a systeminstalled in a test vehicle. The experts drove a defined route intraffic extending between and around East Liberty andColumbus, Ohio in daylight. This route took approximately twohours to traverse and contained equal amounts of driving time onarterial streets, freeways, and rural highways. The route wasrepeated at night, per the matrix listed above.
Part II of Section C was completed after the test drive had beenconducted. In Part II the experts responded to questions basedon their driving experience regarding the ease of perception ofwarning signals, distraction and annoyance experienced,effectiveness of warning presentations, and system use.Questions also were asked to ascertain whether the expertsencountered any problems while driving with the system andrequested suggestions for possible improvements to the designof the interface and the system as a whole.
PROCEDURES FOR SCORING THE HUMAN FACTORSCHECKLIST
The Human Factors Checklist responses for the SCAS testedcontain a considerable amount of data. Scoring was used in anattempt to summarize this large amount of data and assess whichdriver interfaces had more appropriate features.
Given the state of the art in human factors, the checklist cannotbe scored based solely upon information contained in humanfactors manuals and guidelines. These sources are generalguidelines for equipment design and do not provide specificdetails for SCAS design. Also, handbooks do not cover alldesign features and do not provide weighting criteria todistinguish the more important guidelines from ones of lesserimportance for a particular application. Human factorsguidelines were used here to the maximum extent possible todetermine the desirable characteristics of a driver interface.However, where there were gaps in the existing guidelines, theauthors’ judgement based upon experience with a substantial
number of these interface was used.
The scoring system only addressed the mostly objective datacontained in Section A, Descriptive Profile, and Section B,Human Factors Assessment, of the checklist. Subjective datafrom Section C, Operational Judgements, were not used.
The scoring system used had six objective categories and onesubjective one. The six objective categories were:
1. Overall Design 2. Visual Warning Display Conspicuity 3. Visual Warning Display Comprehensibility 4. Audio Warning Discriminability and Comprehensibility 5. System Status Display Conspicuity and
Comprehensibility 6. Control Ergonomics
The one subjective category was Expert Professional Judgement.
A score was calculated for each of the listed categories for eachSCAS. A different scoring system was used for each category.However, the same basic technique was used to develop thescoring systems for the individual objective categories.
First, the desirable characteristics of a SCAS driver interfacewere listed for each category. Then, each listed characteristic ofan “ideal” collision avoidance system driver interface wasranked as being either of “high” importance or of “low” or“less” importance. Since no basis is provided in the humanfactors guidelines to perform this ranking, the authors’judgement was used. Each listed desirable characteristic of asystem (e.g., the driver interface included a visual warningdisplay) was then associated with one or more Human FactorsChecklist questions. For each question, the response whichindicated that the characteristic of the system being evaluatedwas a desirable one was identified.
Weights were then assigned to each checklist question.Questions associated with desirable interface characteristics thatwere ranked as being of less importance received one-half theweight of questions associated with desirable interfacecharacteristics that were considered to be of high importance. Incases where multiple questions were associated with onedesirable interface characteristic, the weight assigned to each ofthe multiple questions was reduced. This was done so as to keepthe total weight associated with each desirable interfacecharacteristic the same.
Two sums were then calculated for each category. The first sum,Score Weights or W, was incremented by the weight assigned toa question if the answer to the question was the “good” answer.The second sum, Total Weights or T, was incremented by theweight assigned to the question unless the answer to the questionwas Not Determinable (ND) or Not Applicable (N/A). Thescore for each category, S, was then calculated by the equation:
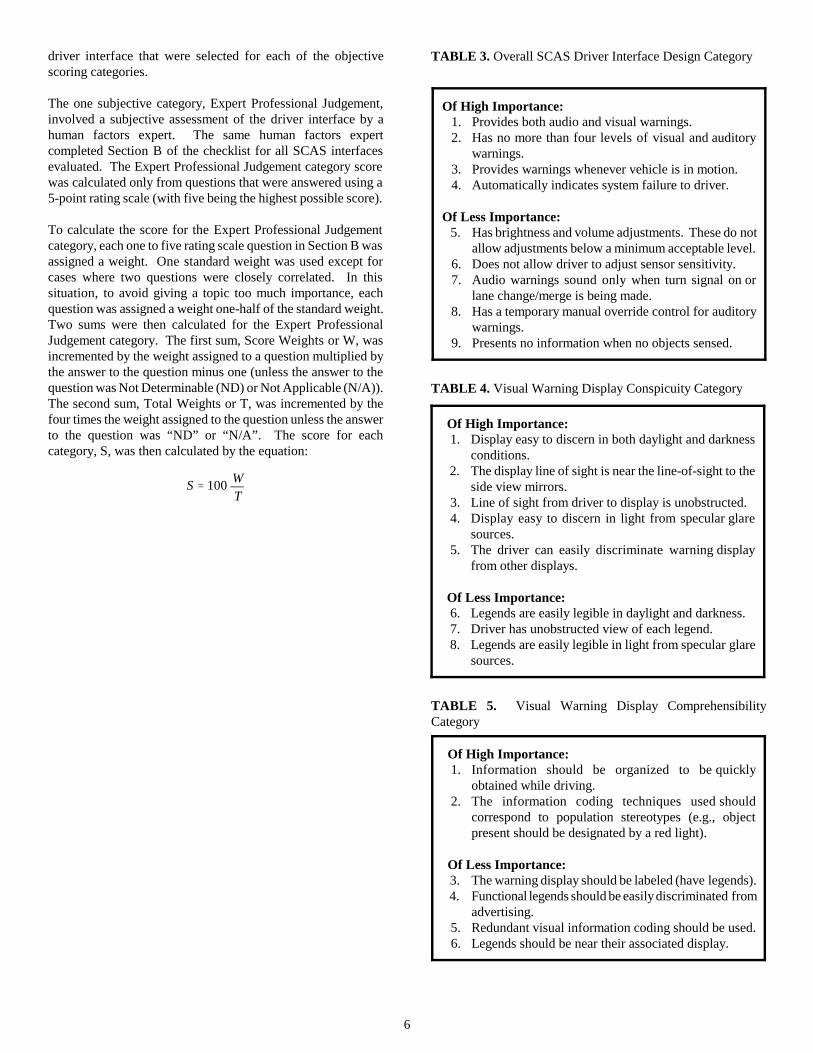
Tables 3 through 8 list the characteristics of an “ideal” SCAS
6
S 100 WT
Of High Importance: 1. Provides both audio and visual warnings. 2. Has no more than four levels of visual and auditory
warnings. 3. Provides warnings whenever vehicle is in motion. 4. Automatically indicates system failure to driver.
Of Less Importance: 5. Has brightness and volume adjustments. These do not
allow adjustments below a minimum acceptable level. 6. Does not allow driver to adjust sensor sensitivity. 7. Audio warnings sound only when turn signal on or
lane change/merge is being made. 8. Has a temporary manual override control for auditory
warnings. 9. Presents no information when no objects sensed.
Of High Importance: 1. Display easy to discern in both daylight and darkness
conditions. 2. The display line of sight is near the line-of-sight to the
side view mirrors. 3. Line of sight from driver to display is unobstructed. 4. Display easy to discern in light from specular glare
sources. 5. The driver can easily discriminate warning display
from other displays.
Of Less Importance: 6. Legends are easily legible in daylight and darkness. 7. Driver has unobstructed view of each legend. 8. Legends are easily legible in light from specular glare
sources.
Of High Importance: 1. Information should be organized to be quickly
obtained while driving. 2. The information coding techniques used should
correspond to population stereotypes (e.g., objectpresent should be designated by a red light).
Of Less Importance: 3. The warning display should be labeled (have legends). 4. Functional legends should be easily discriminated from
advertising. 5. Redundant visual information coding should be used. 6. Legends should be near their associated display.
driver interface that were selected for each of the objectivescoring categories.
The one subjective category, Expert Professional Judgement,involved a subjective assessment of the driver interface by ahuman factors expert. The same human factors expertcompleted Section B of the checklist for all SCAS interfacesevaluated. The Expert Professional Judgement category scorewas calculated only from questions that were answered using a5-point rating scale (with five being the highest possible score).
To calculate the score for the Expert Professional Judgementcategory, each one to five rating scale question in Section B wasassigned a weight. One standard weight was used except forcases where two questions were closely correlated. In thissituation, to avoid giving a topic too much importance, eachquestion was assigned a weight one-half of the standard weight.Two sums were then calculated for the Expert ProfessionalJudgement category. The first sum, Score Weights or W, wasincremented by the weight assigned to a question multiplied bythe answer to the question minus one (unless the answer to thequestion was Not Determinable (ND) or Not Applicable (N/A)).The second sum, Total Weights or T, was incremented by thefour times the weight assigned to the question unless the answerto the question was “ND” or “N/A”. The score for eachcategory, S, was then calculated by the equation:
TABLE 3. Overall SCAS Driver Interface Design Category
TABLE 4. Visual Warning Display Conspicuity Category
TABLE 5. Visual Warning Display ComprehensibilityCategory

7
Of High Importance: 1. The meaning of auditory warnings is readily apparent. 2. The information coding techniques used should
correspond to population stereotypes. 3. The dominant frequency of the tone is between 500
and 3000 Hz.
Of Less Importance: 4. The volume range is from not more than 90 to not less
than 60 dB(A). 5. The driver can easily discriminate warning display
from other sounds. 6. Complex tones are used for warnings.
Of High Importance: 1. Display easy to discern in both daylight and darkness
conditions. 2. The display is organized so that the driver can quickly
acquire system status information while driving. 3. The information coding techniques used are
appropriate for the type of information presented andcorrespond to population stereotypes.
4. System status display can be easily discriminated fromother displays.
5. Driver can easily tell from the display whether or notthe system is on.
6. Display easy to discern in light from specular glaresources.
Of Less Importance: 7. The displayed system status information should have
a legend. 8. The status display legend should be easily legible in
both daylight and darkness. 9. Driver has unobstructed view of each legend.10. Functional legends should be easily discriminated from
advertising.11. The system status display legend should be easily
legible in light from specular glare sources.12. Legends should be near their associated display.
Of High Importance: 1. Controls are easy to reach and see. 2. Type of control used is appropriate for type of function
controlled. 3. Movement of controls corresponds to population
stereotypes (e.g., upward, right, or clockwisemovements produce an increase in the value of theparameter).
4. Controls are coded for discrimination in blindoperation.
5. Use of the control provides appropriate feedback. 6. Controls are separated to prevent accidental activation.
Of Less Importance: 7. Control setting can be discerned via visual or tactile
inspection. 8. All controls have legends. 9. All control legends are legible in both day and night
lighting conditions.
TABLE 6. Auditory Display Discriminability andComprehensibility Category
TABLE 7. System Status Display Conspicuity andComprehensibility Category
TABLE 8. Control Ergonomics Category
HUMAN FACTORS CHECKLIST RESULTS BY SYSTEM
The Human Factors Checklist used in this study was modifiedfrom its original form developed specifically for use in a studyof heavy truck side and rear object detection systems. Inmodifying this checklist for use in this study, many neededimprovements were realized. However, some necessarymodifications to the checklist were not realized until the benefitof retrospect was acquired upon completion of the current study.
For this study, human factors experts made multiple test runs inmultiple test vehicles in varying conditions of ambientillumination to evaluate each system’s driver interface. Sincethere are a large number of types possible driver interfaces, it isa large and difficult task to create a tool which can be used toevaluate all CAS driver interfaces. While the current version ofthe Human Factors Checklist is significantly better than theoriginal version, the current research showed that moreimprovements are needed. Thus, some limitations are present inthe current version of the checklist. However, it is reasonable toexpect that as intelligent transportation systems become moresophisticated, so must the tool for their evaluation.
In general, the Human Factors Checklist proved to be a veryuseful tool in this application. The “open-ended” nature of thequalitative questions contained in Part III of Section C facilitatedthe receipt of interesting comments indicative of the quality ofindividual SCAS driver interfaces and of system performance.The topics of some of these comments were not addressed in thechecklist as used in this study. While the checklist was a veryuseful analysis tool in this study, the open-ended commentsprovided ideas for additional questions and topics of interestwhich should be included in future versions of the checklist.The following discussion of the strengths and weaknesses of

8
individual systems is based primarily on data from Section C ofthe Human Factors Checklist. The ideas presented were basedon responses to the checklist and a consensus of assessments ofthe human factors experts.
SYSTEM A: HUMAN FACTORS CHECKLISTRESULTS - System A was a commercially available ultrasonicSCAS. This system had a single sensor used to create adetection zone on the right side of the vehicle.
System A: Description of the Driver Interface - SystemA had two parts to its driver interface. A main display unit,shown in Figure 3, contained both visual and auditory crashavoidance warning displays and visual system status displays.The main display unit was mounted at the center of thedashboard, as shown in Figure 4. Commercial advertising labelswere omitted from the photographs. An auxiliary display unit,shown in Figure 5, was mounted at the right A-pillar to providethe driver with an additional source of crash avoidance warninginformation. The appropriate orientation in which to mount theauxiliary display was assumed since no orientation was specifiedin the manufacturer’s documentation. No controls were presentto adjust the brightness of visual crash avoidance warning andsystem status displays was constant nor the volume of theauditory crash avoidance warning.

9
Figure 3. System A driver interface: Main display unit
Figure 4. System A main display unit as mounted for testing
Figure 5. System A driver interface: Auxiliary visual warningdisplay
On the main display unit was located a crash avoidance warningvisual display which consisted of a single red LED labeled “NOTURN!”. This display was located on the far right side of theface of the display unit. This warning light would illuminatesteadily (i.e., steady burn, no blinking) whenever an obstacle waspresent in the detection zone. An additional visual crashavoidance warning display was located at the right A-pillar nearthe side view mirror. This auxiliary display consisted of apictorial representation of a roadway complete with lane markingand a red “X” located in the right lane. This red “X” wouldilluminate in coordination with the visual warning LED on themain display unit to indicate the presence of an obstacle in theright adjacent lane. The system also had an auditory warningwhich would sound a constant tone whenever an obstacle waspresent in the detection zone and the right turn signal wasactivated. System A had two system status displays located onits main display unit. A green LED labeled “READY” whichwas located at the center of the face of the unit illuminated toprovide the driver with an indication that the system wasreceiving power and operational. A red LED labeled “FAULT”which was located at the far left side of the face of the displayunit would illuminate only if the system self test detected aproblem with the system hardware.
System A: Strengths and Weaknesses of the DriverInterface - Some problems were observed with the layout of theface of the main display unit. Advertising labels covered asignificant area of the face of the display and presentedsomewhat of a distraction, especially considering the mirror-likequality of the lettering. More importantly, the red “FAULT”LED was rather close to the red warning LED creating thepotential for confusion of the driver in terms of determiningwhich display is presenting a signal. In addition, the materialcovering the face of the display was somewhat reflective causingthe potential for glare.
Problems were also encountered with the auxiliary visualwarning display mounted at the right A-pillar. The meaning ofthe symbology of this red “X ” display was not obvious to one ofthe human factors experts who did not understand what the“underscore characters under the X” meant. In addition, thisvisual display was not bright enough to be seen in all levels ofambient illumination, especially in bright sunlight.
The choice of the color red for the crash avoidance visualdisplays was appropriate and contrasted well with the greensystem “READY” LED. The auxiliary visual warning displaylocated at the right A-pillar was found to be helpful. However,there does not appear to be a significant benefit provided by theuse of two visual warning displays (i.e., one at the center of thedashboard and one at the A-pillar).
The auditory warning for System A was reported to be bothstartling and annoying. However, as with many of the systems,the volume of the auditory warning was not loud enough to beheard under all conditions when driving the HMMWV. Thepresence of a volume control with a reasonable range wouldalleviate this problem and accommodate individual differencesbetween drivers with differing perceptual capabilities.
The green “READY” LED provided drivers with an indication
10
Figure 7. System B driver interface: Crash avoidancewarning visual display
Figure 8. System B crash avoidance warning visual displayas mounted for testing
Figure 6. System B main control unit
that the system was receiving power and fully operational. Thisvisual display was perceived as being very bright at night andtherefore was found to be a source of distraction. The provisionof a brightness control for the driver would have alleviated thisproblem. The red “FAULT” LED was used to indicate systemfailures to the driver. This display was found to be suff icient,however, it may not be necessary to have separate “systempower” and “fault/failure indication”displays. A combineddisplay which would illuminate green when the system isreceiving power and operating properly and would change toyellow when a problem was detected with the system hardwaremay be more suitable. The suggestion of using the color yellowto indicate system failures stems from the desire to make thedisplays easily distinguishable from one another, and thusmaking the system failure display a different color than thevisual warning display. The choice of green for the system“READY” LED was judged to be very appropriate.
Overall Assessment of the Driver Interface for SystemA - Many problems associated with the hardware performanceof System A were observed which affected the drivers’ use, andin many cases, tolerance, of the systems. Many false alarms andmany missed vehicles were encountered with System A whichwas characterized as having extremely variable performance.The auditory warning was found to be significantly annoying,especially in the passenger car test vehicle which had a lowerlevel of ambient noise in the cab than did the HMMWV. Visualwarnings caused by false alarms at night were also found to beannoying to the human factors experts. This problem could bealleviated by designing the sensor hardware to filter outstationary objects to prevent the system from warning the driverof non-threatening objects such as light poles, trees, and guardrail. In addition, warning presentations were noticeably delayedfrom the time that an adjacent vehicle actually entered thedetection zone that the warnings were often considered by theexperts to be not useful.
Overall, the design of the display was considered to be largelyappropriate and easy to use. The information presented by thedisplays was found by the experts to be easy to understand,despite the confusion about the meaning of the symbology usedin the auxiliary visual warning display. The auditory wasdetermined to be excessively loud for the passenger vehicleapplication (The system was intended for use in heavy trucks).Some improvements could be made to make the displayedinformation more easy to perceive in all conditions, such asproviding a volume control and a brightness control orautomatically controlled brightness with appropriate range.
SYSTEM B: HUMAN FACTORS CHECKLISTRESULTS - System B was a prototype radar-based SCASintended for use on light vehicles. This system used a singlesensor to create a detection zone to the right side of the vehicle.
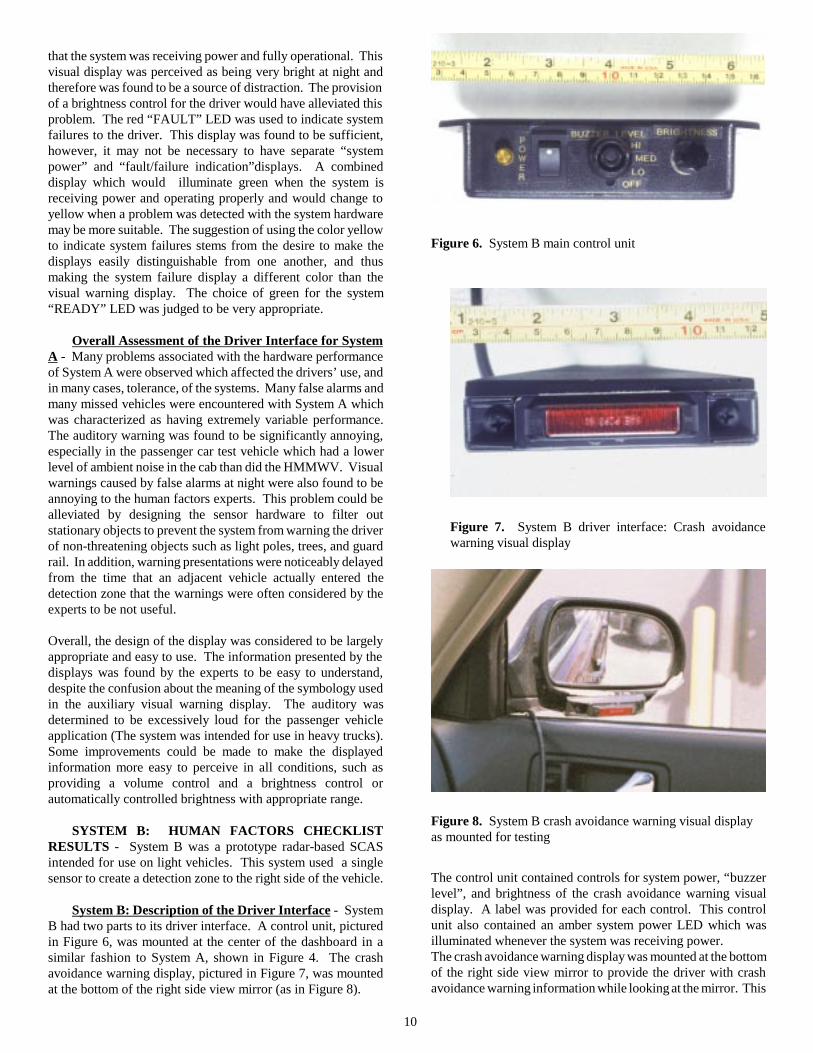
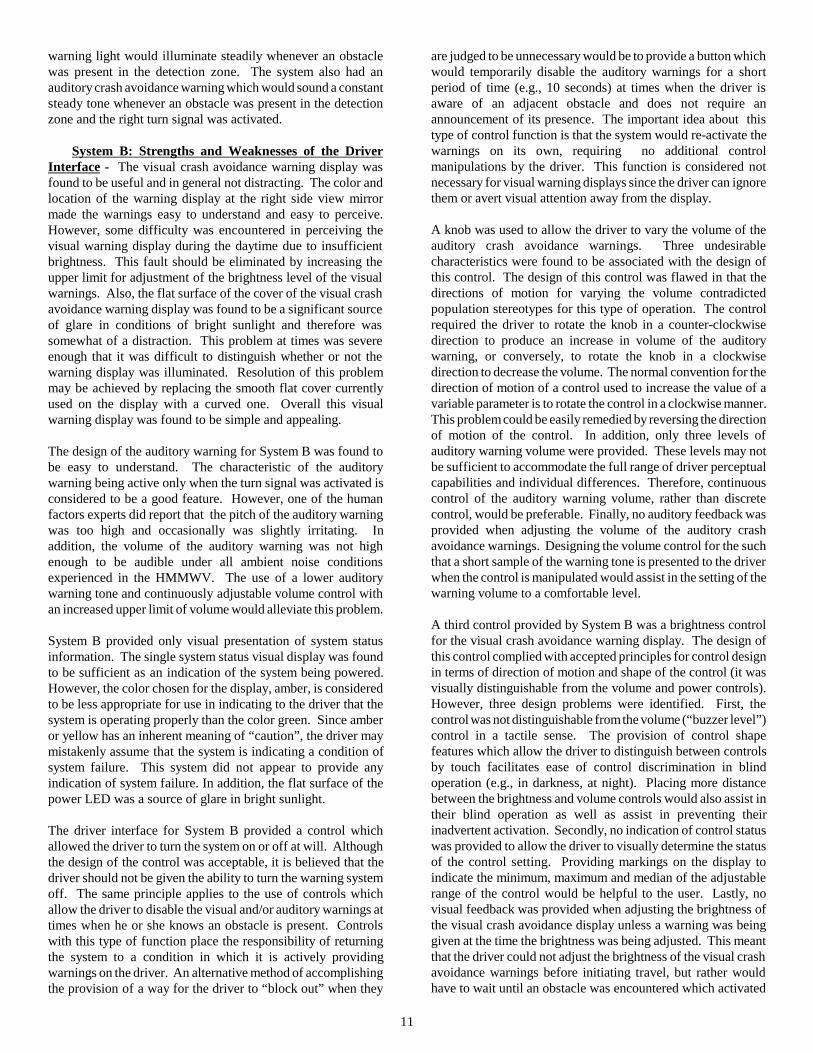
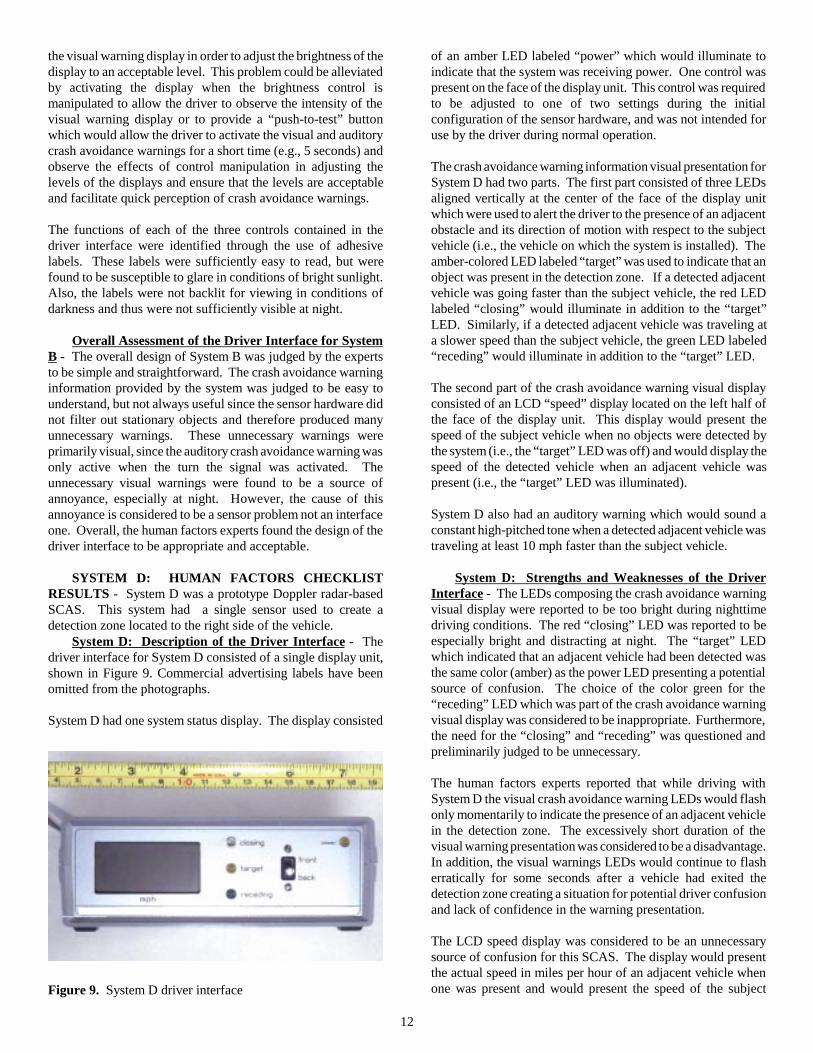
System B: Description of the Driver Interface - SystemB had two parts to its driver interface. A control unit, picturedin Figure 6, was mounted at the center of the dashboard in asimilar fashion to System A, shown in Figure 4. The crashavoidance warning display, pictured in Figure 7, was mountedat the bottom of the right side view mirror (as in Figure 8).
The control unit contained controls for system power, “buzzerlevel”, and brightness of the crash avoidance warning visualdisplay. A label was provided for each control. This controlunit also contained an amber system power LED which wasilluminated whenever the system was receiving power.The crash avoidance warning display was mounted at the bottomof the right side view mirror to provide the driver with crashavoidance warning information while looking at the mirror. This
11
warning light would illuminate steadily whenever an obstaclewas present in the detection zone. The system also had anauditory crash avoidance warning which would sound a constantsteady tone whenever an obstacle was present in the detectionzone and the right turn signal was activated.
System B: Strengths and Weaknesses of the DriverInterface - The visual crash avoidance warning display wasfound to be useful and in general not distracting. The color andlocation of the warning display at the right side view mirrormade the warnings easy to understand and easy to perceive.However, some difficulty was encountered in perceiving thevisual warning display during the daytime due to insufficientbrightness. This fault should be eliminated by increasing theupper limit for adjustment of the brightness level of the visualwarnings. Also, the flat surface of the cover of the visual crashavoidance warning display was found to be a significant sourceof glare in conditions of bright sunlight and therefore wassomewhat of a distraction. This problem at times was severeenough that it was difficult to distinguish whether or not thewarning display was illuminated. Resolution of this problemmay be achieved by replacing the smooth flat cover currentlyused on the display with a curved one. Overall this visualwarning display was found to be simple and appealing.
The design of the auditory warning for System B was found tobe easy to understand. The characteristic of the auditorywarning being active only when the turn signal was activated isconsidered to be a good feature. However, one of the humanfactors experts did report that the pitch of the auditory warningwas too high and occasionally was slightly irritating. Inaddition, the volume of the auditory warning was not highenough to be audible under all ambient noise conditionsexperienced in the HMMWV. The use of a lower auditorywarning tone and continuously adjustable volume control withan increased upper limit of volume would alleviate this problem.
System B provided only visual presentation of system statusinformation. The single system status visual display was foundto be sufficient as an indication of the system being powered.However, the color chosen for the display, amber, is consideredto be less appropriate for use in indicating to the driver that thesystem is operating properly than the color green. Since amberor yellow has an inherent meaning of “caution”, the driver maymistakenly assume that the system is indicating a condition ofsystem failure. This system did not appear to provide anyindication of system failure. In addition, the flat surface of thepower LED was a source of glare in bright sunlight.
The driver interface for System B provided a control whichallowed the driver to turn the system on or off at will. Althoughthe design of the control was acceptable, it is believed that thedriver should not be given the ability to turn the warning systemoff . The same principle applies to the use of controls whichallow the driver to disable the visual and/or auditory warnings attimes when he or she knows an obstacle is present. Controlswith this type of function place the responsibility of returningthe system to a condition in which it is actively providingwarnings on the driver. An alternative method of accomplishingthe provision of a way for the driver to “block out” when they
are judged to be unnecessary would be to provide a button whichwould temporarily disable the auditory warnings for a shortperiod of time (e.g., 10 seconds) at times when the driver isaware of an adjacent obstacle and does not require anannouncement of its presence. The important idea about thistype of control function is that the system would re-activate thewarnings on its own, requiring no additional controlmanipulations by the driver. This function is considered notnecessary for visual warning displays since the driver can ignorethem or avert visual attention away from the display.
A knob was used to allow the driver to vary the volume of theauditory crash avoidance warnings. Three undesirablecharacteristics were found to be associated with the design ofthis control. The design of this control was flawed in that thedirections of motion for varying the volume contradictedpopulation stereotypes for this type of operation. The controlrequired the driver to rotate the knob in a counter-clockwisedirection to produce an increase in volume of the auditorywarning, or conversely, to rotate the knob in a clockwisedirection to decrease the volume. The normal convention for thedirection of motion of a control used to increase the value of avariable parameter is to rotate the control in a clockwise manner.This problem could be easily remedied by reversing the directionof motion of the control. In addition, only three levels ofauditory warning volume were provided. These levels may notbe suff icient to accommodate the full range of driver perceptualcapabilities and individual differences. Therefore, continuouscontrol of the auditory warning volume, rather than discretecontrol, would be preferable. Finally, no auditory feedback wasprovided when adjusting the volume of the auditory crashavoidance warnings. Designing the volume control for the suchthat a short sample of the warning tone is presented to the driverwhen the control is manipulated would assist in the setting of thewarning volume to a comfortable level.
A third control provided by System B was a brightness controlfor the visual crash avoidance warning display. The design ofthis control complied with accepted principles for control designin terms of direction of motion and shape of the control (it wasvisually distinguishable from the volume and power controls).However, three design problems were identified. First, thecontrol was not distinguishable from the volume (“buzzer level”)control in a tactile sense. The provision of control shapefeatures which allow the driver to distinguish between controlsby touch facilitates ease of control discrimination in blindoperation (e.g., in darkness, at night). Placing more distancebetween the brightness and volume controls would also assist intheir blind operation as well as assist in preventing theirinadvertent activation. Secondly, no indication of control statuswas provided to allow the driver to visually determine the statusof the control setting. Providing markings on the display toindicate the minimum, maximum and median of the adjustablerange of the control would be helpful to the user. Lastly, novisual feedback was provided when adjusting the brightness ofthe visual crash avoidance display unless a warning was beinggiven at the time the brightness was being adjusted. This meantthat the driver could not adjust the brightness of the visual crashavoidance warnings before initiating travel, but rather wouldhave to wait until an obstacle was encountered which activated
12
Figure 9. System D driver interface
the visual warning display in order to adjust the brightness of thedisplay to an acceptable level. This problem could be alleviatedby activating the display when the brightness control ismanipulated to allow the driver to observe the intensity of thevisual warning display or to provide a “push-to-test” buttonwhich would allow the driver to activate the visual and auditorycrash avoidance warnings for a short time (e.g., 5 seconds) andobserve the effects of control manipulation in adjusting thelevels of the displays and ensure that the levels are acceptableand facilitate quick perception of crash avoidance warnings.
The functions of each of the three controls contained in thedriver interface were identified through the use of adhesivelabels. These labels were suff iciently easy to read, but werefound to be susceptible to glare in conditions of bright sunlight.Also, the labels were not backlit for viewing in conditions ofdarkness and thus were not suff iciently visible at night.
Overall Assessment of the Driver Interface for SystemB - The overall design of System B was judged by the expertsto be simple and straightforward. The crash avoidance warninginformation provided by the system was judged to be easy tounderstand, but not always useful since the sensor hardware didnot filter out stationary objects and therefore produced manyunnecessary warnings. These unnecessary warnings wereprimarily visual, since the auditory crash avoidance warning wasonly active when the turn the signal was activated. Theunnecessary visual warnings were found to be a source ofannoyance, especially at night. However, the cause of thisannoyance is considered to be a sensor problem not an interfaceone. Overall, the human factors experts found the design of thedriver interface to be appropriate and acceptable.
SYSTEM D: HUMAN FACTORS CHECKLISTRESULTS - System D was a prototype Doppler radar-basedSCAS. This system had a single sensor used to create adetection zone located to the right side of the vehicle.
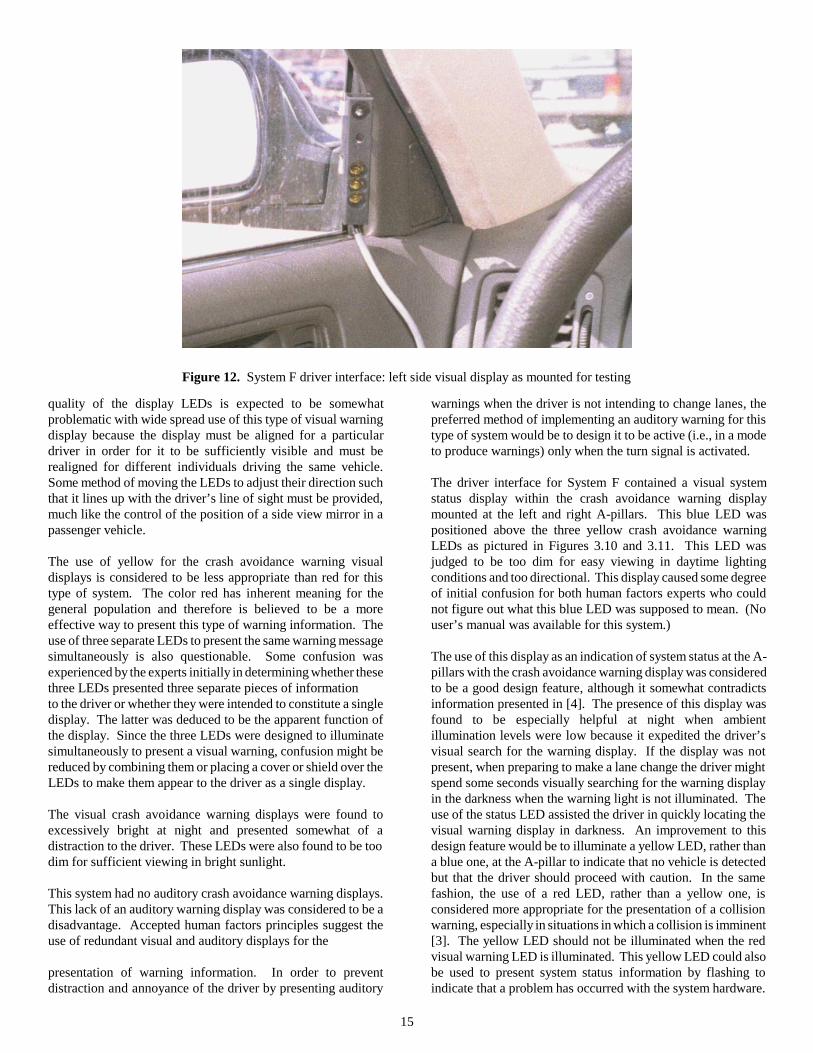
System D: Description of the Driver Interface - Thedriver interface for System D consisted of a single display unit,shown in Figure 9. Commercial advertising labels have beenomitted from the photographs.
System D had one system status display. The display consisted
of an amber LED labeled “power” which would illuminate toindicate that the system was receiving power. One control waspresent on the face of the display unit. This control was requiredto be adjusted to one of two settings during the initialconfiguration of the sensor hardware, and was not intended foruse by the driver during normal operation.
The crash avoidance warning information visual presentation forSystem D had two parts. The first part consisted of three LEDsaligned vertically at the center of the face of the display unitwhich were used to alert the driver to the presence of an adjacentobstacle and its direction of motion with respect to the subjectvehicle (i.e., the vehicle on which the system is installed). Theamber-colored LED labeled “ target” was used to indicate that anobject was present in the detection zone. If a detected adjacentvehicle was going faster than the subject vehicle, the red LEDlabeled “closing” would illuminate in addition to the “ target”LED. Similarly, if a detected adjacent vehicle was traveling ata slower speed than the subject vehicle, the green LED labeled“receding” would illuminate in addition to the “target” LED.
The second part of the crash avoidance warning visual displayconsisted of an LCD “speed” display located on the left half ofthe face of the display unit. This display would present thespeed of the subject vehicle when no objects were detected bythe system (i.e., the “ target” LED was off) and would display thespeed of the detected vehicle when an adjacent vehicle waspresent (i.e., the “target” LED was illuminated).
System D also had an auditory warning which would sound aconstant high-pitched tone when a detected adjacent vehicle wastraveling at least 10 mph faster than the subject vehicle.
System D: Strengths and Weaknesses of the DriverInterface - The LEDs composing the crash avoidance warningvisual display were reported to be too bright during nighttimedriving conditions. The red “closing” LED was reported to beespecially bright and distracting at night. The “ target” LEDwhich indicated that an adjacent vehicle had been detected wasthe same color (amber) as the power LED presenting a potentialsource of confusion. The choice of the color green for the“ receding” LED which was part of the crash avoidance warningvisual display was considered to be inappropriate. Furthermore,the need for the “closing” and “receding” was questioned andpreliminarily judged to be unnecessary.
The human factors experts reported that while driving withSystem D the visual crash avoidance warning LEDs would flashonly momentarily to indicate the presence of an adjacent vehiclein the detection zone. The excessively short duration of thevisual warning presentation was considered to be a disadvantage.In addition, the visual warnings LEDs would continue to flasherratically for some seconds after a vehicle had exited thedetection zone creating a situation for potential driver confusionand lack of confidence in the warning presentation.
The LCD speed display was considered to be an unnecessarysource of confusion for this SCAS. The display would presentthe actual speed in miles per hour of an adjacent vehicle whenone was present and would present the speed of the subject

13
vehicle when no adjacent vehicle was detected. However, it wasnot obvious when the display switched from displaying the speedof the subject vehicle to displaying the speed of an adjacentvehicle. Due to the confusion associated with this speed displayand the lack of a good reason for its presence, it was consideredunnecessary.
The auditory warning for System D consisted of a constant high-pitched tone which was presented when a detected adjacentvehicle was traveling at least 10 mph faster than the subjectvehicle. The nature of the auditory warning and the conditionswhich triggered its presentation were not obvious since nodocumentation was provided with the system. The lack ofinformation about this auditory warning which provideddifferent information than the visual crash avoidance warningdisplays caused some confusion for the human factors expertswhen driving with the system. In addition, the human factorsexperts reported that the volume of the auditory crash avoidancewarning was not high enough to be heard while driving theHMMWV which produced extremely high levels of ambientnoise in the cab ranging from 71.6 to 86 dB(A). The use of avolume control with a reasonable range would contribute toeliminating this problem.
System D had one system status display which provided thedriver with an indication that the system was receiving power.Since this display presented only an indication that the systemwas in operation and provided no indications of system failureor any other type of information, it was judged that a moreappropriate color for the display would have been green.
A single control labeled “front/back” was present on the face ofthe display unit. This control was used in the initialconfiguration of the sensor hardware and was not intended foruse by the driver. Since this control was not intended for use bythe driver, but was intended for installation purposes only, it wasnot appropriate for the control to be located on the face of thedisplay unit.
Overall Assessment of the Driver Interface for SystemD - Overall, the driver interface for System D was confusing.The information presented by the system seemed to be more thanwas necessary. The LCD speed display was judged unnecessary.In addition, the need for provision of directional informationregarding the motion of a detected vehicle was questioned. Thehuman factors experts considered the presentation of thisinformation to be confusing and unnecessary. However, adetailed analysis of the needs of the driver in terms of whatinformation is necessary for the driver to effectively avoid lanechange/merge collisions should be performed.
The area of the face of the display unit surrounding the visualdisplays was reflective and created a source of glare in brightsunlight. The exterior housing of the system also reflectedsunlight causing distraction and annoyance of the driver.
Despite the many problems associated with the driver interfacefor this system, System D did have a major advantage over othersystems. This advantage was the capability of the sensorhardware to filter out stationary objects. This capabilitysomewhat reduced the incidence of unnecessary warnings, butthe reduction was not pronounced because of other problemswith the sensor hardware. A downfall was associated with themethod used to filter out stationary objects in that inaccomplishing this function also ignored objects traveling atexactly the same speed as the subject vehicle. This methodcreates the potential for collision in the event that an adjacentvehicle that the driver is not aware of is traveling at the samespeed as the subject vehicle.
In summary, the driver interface for System D requiressignificant modifications to simplify and improve the exchangeof information with the driver.
SYSTEM E: HUMAN FACTORS CHECKLISTRESULTS - System E was a prototype radar-based SCAS.This system had a single sensor used to create a detection zonelocated to the right side of the vehicle.
System E: Description of the Driver Interface - Thedriver interface for System E consisted of a single display unitintended for use in heavy trucks, shown in Figure 10. Thedisplay unit was mounted at the center of the dashboard,similarly to that shown for System D in Figure 4. Commercialadvertising labels have been omitted from the photograph.
System E had one system status display. The display consistedof an green LED labeled “PWR” which would illuminate toindicate that the system was receiving power.
The crash avoidance warning visual displays for System E wereonly partially used since this system and its driver interface wereintended for use in heavy trucks with trailers. The red LEDlabeled “CAB” was used to indicate that an obstacle had beendetected. The LED labeled “TRLR” (trailer) was not used inthis passenger car application and was inoperable during testing.The “CAB” LED would remain illuminated as long as thepresence of an obstacle was detected.
This system also had an auditory warning which would sound aconstant high-pitched tone when an adjacent vehicle wasdetected and the right turn signal was activated. A toggle switchlabeled “BP” allowed the driver to switch between having theauditory warning operational at all times or only when the turnsignal was activated.

14
Figure 10. System E driver interface Figure 11. System F driver interface
System E: Strengths and Weaknesses of the DriverInterface - The visual crash avoidance warning display was notsufficiently conspicuous during daytime driving due toinsufficient brightness of the LED and glare. The warning LEDwas also too directional and required direct glancesperpendicular to the face of the display in order to adequatelyperceive a visual warning signal. The visual warning LED alsoremained illuminated for a significant period of time after anadjacent vehicle had left the detection zone causing someconfusion for the experts while driving with the system.
The auditory crash avoidance warning for System E wasreported by the experts to be both “painfully loud” and“piercing”. The pitch of the warning tone was considered to beexcessively high, thus causing driver discomfort and annoyance.The use of a lower tone for the auditory warning combined witha volume control would significantly improve the current design.
The use of the color green for the system status LED labeled“PWR” was considered appropriate. However, due toinsuff icient brightness, difficultly was encountered when tryingto discern whether or not the LED was illuminated in conditionsof high ambient illumination. This LED was also judged to betoo bright for nighttime operation and was a source of annoyancefor the driver. The use of a brightness control should alleviatethis problem.
The sensor selection rotary knob (used to allow selective sensoractivation in the multiple-sensor heavy truck application) wasunnecessary for this passenger car application since only onesensor was used. The meanings of the labels for this controlwere reported to be unclear.
The toggle switch labeled “BP” was allowed the driver to switchbetween having the auditory warning operational at all times oronly when the turn signal was activated. The orientation of thistoggle switch should have been vertical rather than horizontal toagree with accepted human factors principles.
Overall Assessment of the Driver Interface for SystemE - Overall, the driver interface for this prototype was judged to
need a variety of general refinements to make the interface more
effective and user-friendly. The visual crash avoidance warningdisplays required modifications to make them more perceptiblein a wide range of ambient light conditions. The tone of theauditory alarm was unnecessarily high. Some of the problemswith the auditory warning could have been solved with a volumecontrol. In general, the driver interface for System E needsmany refinements before it should be released as a commercialproduct in order to make it more effective.
SYSTEM F: HUMAN FACTORS CHECKLISTRESULTS - System F was a prototype infrared-based SCASintended for use on both light and heavy vehicles. This systemhad left and right side sensors creating detection zones on bothsides of the vehicle.
System F : Description of the Driver Interface - Thedriver interface for System F consisted of two identical crashavoidance warning visual display units like the one pictured inFigure 11. One display unit received signals from the left sidesensor and was mounted vertically at the left A-pillar as picturedin Figure 12. The other received signals from the right sidesensor and was mounted on the right A-pillar in a similarfashion. Both of the visual display units contained a blue systemstatus LED located at the top of the display. This LED wouldremain illuminated to indicate that the system was receivingpower and would turn off if the system detected an internalfailure. Visual crash avoidance warning information waspresented by three yellow LEDs located on the lower half of thedisplay unit. These LEDs illuminated simultaneously toindicate that an obstacle had been detected adjacent to thevehicle. An opening in the center of the visual display unithoused a light sensor which measured ambient illuminationlevels and automatically adjusted the intensity of the LEDsaccordingly. The system had no auditory warnings of any kind.
System F: Strengths and Weaknesses of the DriverInterface - The visual crash avoidance warnings for this systemwere considered to be well located and very visible whenpointed directly at the driver. However, this visibility wassignificantly reduced if the axes of the LEDs were not exactly
aligned with the driver’s line of sight. This “highly directional”
15
Figure 12. System F driver interface: left side visual display as mounted for testing
quality of the display LEDs is expected to be somewhatproblematic with wide spread use of this type of visual warningdisplay because the display must be aligned for a particulardriver in order for it to be sufficiently visible and must berealigned for different individuals driving the same vehicle.Some method of moving the LEDs to adjust their direction suchthat it lines up with the driver’s line of sight must be provided,much like the control of the position of a side view mirror in apassenger vehicle.
The use of yellow for the crash avoidance warning visualdisplays is considered to be less appropriate than red for thistype of system. The color red has inherent meaning for thegeneral population and therefore is believed to be a moreeffective way to present this type of warning information. Theuse of three separate LEDs to present the same warning messagesimultaneously is also questionable. Some confusion wasexperienced by the experts initially in determining whether thesethree LEDs presented three separate pieces of information to the driver or whether they were intended to constitute a singledisplay. The latter was deduced to be the apparent function ofthe display. Since the three LEDs were designed to illuminatesimultaneously to present a visual warning, confusion might bereduced by combining them or placing a cover or shield over theLEDs to make them appear to the driver as a single display.
The visual crash avoidance warning displays were found toexcessively bright at night and presented somewhat of adistraction to the driver. These LEDs were also found to be toodim for suff icient viewing in bright sunlight.
This system had no auditory crash avoidance warning displays.This lack of an auditory warning display was considered to be adisadvantage. Accepted human factors principles suggest theuse of redundant visual and auditory displays for the
presentation of warning information. In order to preventdistraction and annoyance of the driver by presenting auditory
warnings when the driver is not intending to change lanes, thepreferred method of implementing an auditory warning for thistype of system would be to design it to be active (i.e., in a modeto produce warnings) only when the turn signal is activated.
The driver interface for System F contained a visual systemstatus display within the crash avoidance warning displaymounted at the left and right A-pillars. This blue LED waspositioned above the three yellow crash avoidance warningLEDs as pictured in Figures 3.10 and 3.11. This LED wasjudged to be too dim for easy viewing in daytime lightingconditions and too directional. This display caused some degreeof initial confusion for both human factors experts who couldnot figure out what this blue LED was supposed to mean. (Nouser’s manual was available for this system.)
The use of this display as an indication of system status at the A-pillars with the crash avoidance warning display was consideredto be a good design feature, although it somewhat contradictsinformation presented in [4]. The presence of this display wasfound to be especially helpful at night when ambientillumination levels were low because it expedited the driver’svisual search for the warning display. If the display was notpresent, when preparing to make a lane change the driver mightspend some seconds visually searching for the warning displayin the darkness when the warning light is not illuminated. Theuse of the status LED assisted the driver in quickly locating thevisual warning display in darkness. An improvement to thisdesign feature would be to illuminate a yellow LED, rather thana blue one, at the A-pillar to indicate that no vehicle is detectedbut that the driver should proceed with caution. In the samefashion, the use of a red LED, rather than a yellow one, isconsidered more appropriate for the presentation of a collisionwarning, especially in situations in which a collision is imminent[3]. The yellow LED should not be illuminated when the redvisual warning LED is illuminated. This yellow LED could alsobe used to present system status information by flashing toindicate that a problem has occurred with the system hardware.

16
Figure 13. System G driver interface
The use of the color blue for a system status display wasconsidered to be less appropriate than the color green which issuggested for use in relating a “system ready” condition whichwas the intent of this display. However, the color green wouldnot be appropriate for use to present system status informationat the A-pillar as part of the warning display as this system wasconfigured. The important point is that a green light should notbe used in any way that it could be misconstrued as meaning thatthe adjacent lane is clear (e.g., the blue light as used in thissystem should not have been green).
The driver interface for System F had no controls associatedwith it. The provision of a control to allow the driver to changethe brightness of the visual displays would have been helpful.
Overall Assessment of the Driver Interface for SystemF - System F was the only system tested in this study which hadboth right and left side sensors and crash avoidance warningvisual displays for detecting and presenting information relatingto adjacent vehicles. This was considered to be a very favorablefeature for this type of system and was praised by the experts.The use of a left side sensor is also believed to be especiallyappropriate for this passenger car application based upon thenature of the lane change merge accident problem for passengercars. The use of a light which is present when no objects aresensed in the detection zones was very helpful at night.However, the color of this light (blue) and the yellow color usedfor the visual crash avoidance warning were inconsistent withpopulation stereotypes. The extremely directional quality of thedisplay LEDs was also found to be a drawback.
SYSTEM G: HUMAN FACTORS CHECKLISTRESULTS - System G was a prototype radar-based SCAS.This system had a single sensor used to create a detection zonelocated to the right side of the vehicle.
System G: Description of the Driver Interface - Thedriver interface for System G consisted of a single display unit,shown in Figure 13. The display unit was mounted at the centerof the dashboard. Commercial advertising labels have beenomitted from the photograph.
Crash avoidance warning information presentation waspresented visually using a single red LED labeled “STOP”. ThisLED would remain illuminated as long as the presence of anadjacent obstacle was detected. This system also had an auditorywarning which would sound a beeping tone when an obstaclewas present to the right side of the vehicle. A toggle switch waspresent which allowed the driver to disable the auditory warningat will. When the auditory warning was disabled, the visualdisplay continued to function normally.
System G had one system status display. The display consistedof a green LED labeled “OK” which illuminated to indicate thatthe system was receiving power. A third display (“WARN”)was inoperative due to a design change made by themanufacturer.
System G: Strengths and Weaknesses of the DriverInterface - The visual warning display for System G consisted
of a large red LED labeled “STOP”. The choice of the colorred for use in this display was considered to be most appropriate.However, this LED was highly directional and thus was difficultto discern whether or not it was illuminated unless the face ofthe display was perpendicular to the driver’s line of sight. Thesilver bezels around the LEDs were a source of glare in brightsunlight. The red warning LED was excessively bright indarkness. The provision of a brightness control for the driver toadjust the intensity of the visual displays may have alleviatedthis problem. The provision of a crash avoidance warning visualdisplay at the right mirror would have been helpful.
Labels for the visual displays were not backlit and thus weredifficult to read in conditions of low light. These labels werereflective and a source of glare in bright sunlight.
The human factors experts found the pitch of the auditorywarning tone to be too high. This tone was considered to beboth annoying and distracting, especially due to the frequentincidence of unnecessary warnings produced by the system.
The green light labeled “OK” provided the driver with a simpleindication that the system was powered and functioning.However, this LED was highly directional and thus was diff icultto discern whether or not it was illuminated unless the face ofthe display was perpendicular to the driver’s line of sight. Thisdriver interface did not appear to provide any indication ofsystem failure to the driver.
The toggle switch provided which allowed the driver to disablethe auditory warning status was too small. In addition, thedirection of motion of this control was not in accordance withpopulation stereotypes. The provision of volume and brightnesscontrols would have been beneficial.
Overall Assessment of the Driver Interface for SystemG - Although the design of this driver interface incorporated theappropriate use of color and legends, the directional quality ofdisplay LEDs and the display’s proneness to glare proved to besignificant disadvantages. The use of brightness and volumecontrols would benefit this design. This driver interface alsowas found to emit a high-pitched sound while the system waspowered which was a source of annoyance and discomfort toone of the human factors experts who participated in the testing.
17
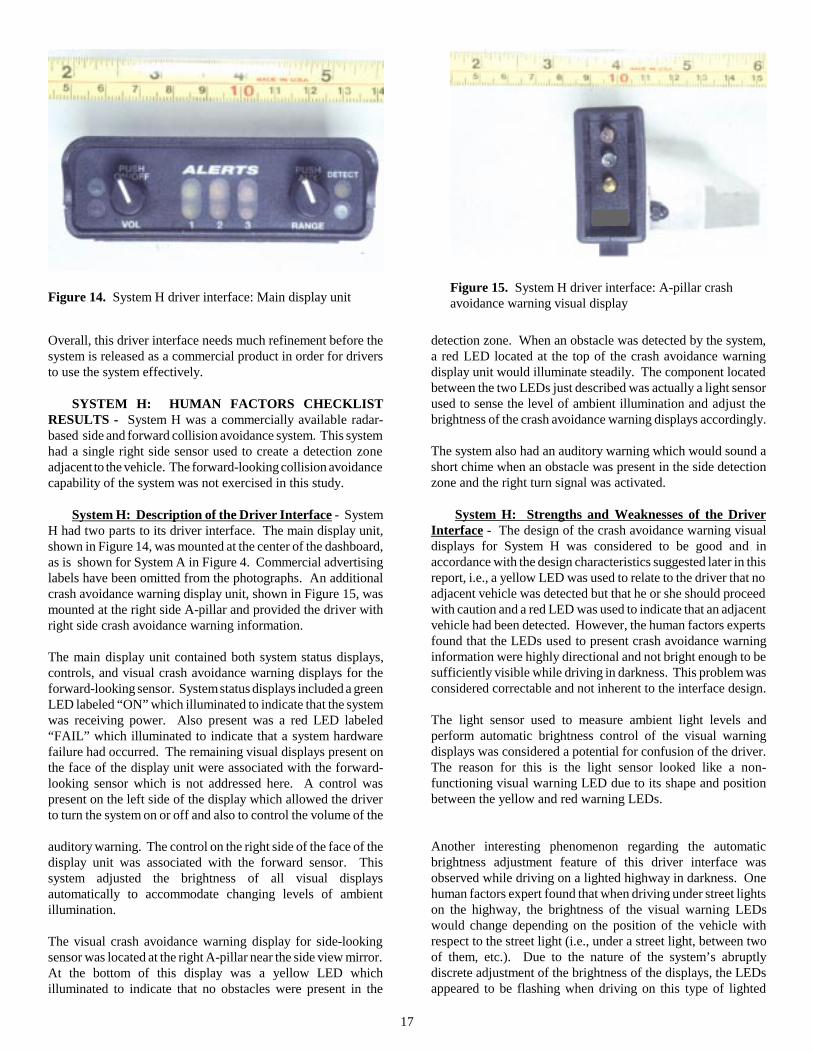
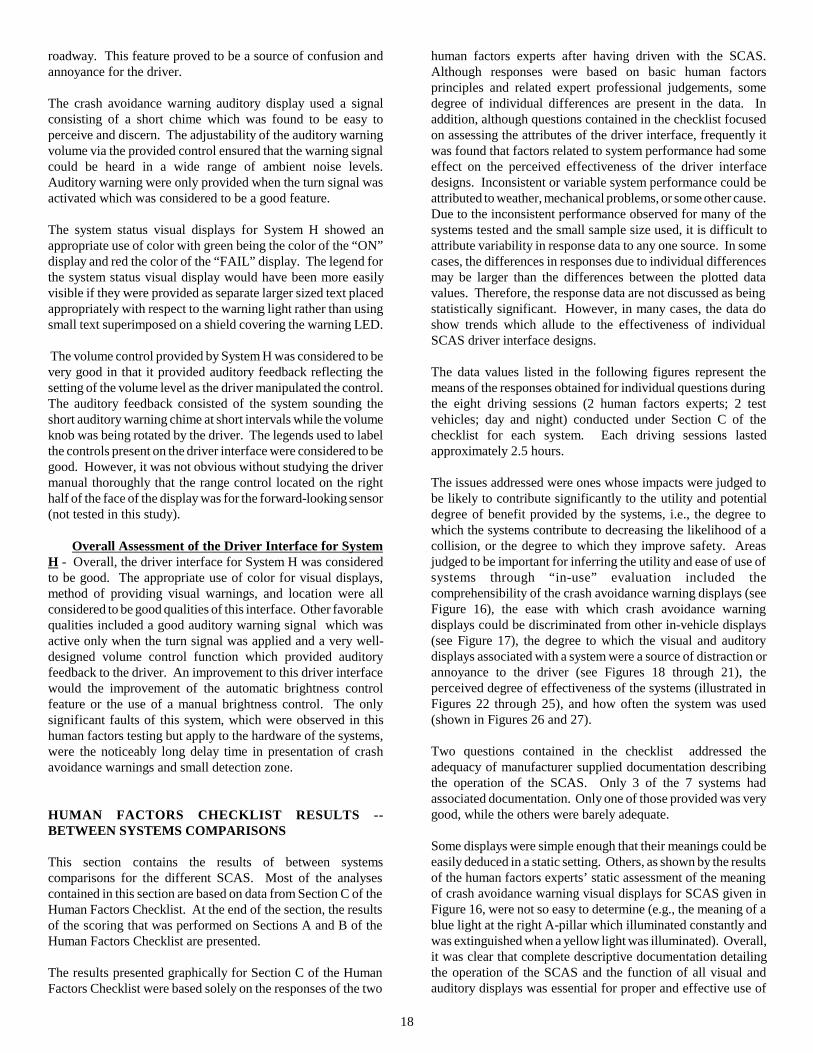
Figure 14. System H driver interface: Main display unitFigure 15. System H driver interface: A-pillar crashavoidance warning visual display
Overall, this driver interface needs much refinement before thesystem is released as a commercial product in order for driversto use the system effectively.
SYSTEM H: HUMAN FACTORS CHECKLISTRESULTS - System H was a commercially available radar-based side and forward collision avoidance system. This systemhad a single right side sensor used to create a detection zoneadjacent to the vehicle. The forward-looking collision avoidancecapability of the system was not exercised in this study.
System H: Description of the Driver Interface - SystemH had two parts to its driver interface. The main display unit,shown in Figure 14, was mounted at the center of the dashboard,as is shown for System A in Figure 4. Commercial advertisinglabels have been omitted from the photographs. An additionalcrash avoidance warning display unit, shown in Figure 15, wasmounted at the right side A-pillar and provided the driver withright side crash avoidance warning information.
The main display unit contained both system status displays,controls, and visual crash avoidance warning displays for theforward-looking sensor. System status displays included a greenLED labeled “ON” which illuminated to indicate that the systemwas receiving power. Also present was a red LED labeled“FAIL” which illuminated to indicate that a system hardwarefailure had occurred. The remaining visual displays present onthe face of the display unit were associated with the forward-looking sensor which is not addressed here. A control waspresent on the left side of the display which allowed the driverto turn the system on or off and also to control the volume of the
auditory warning. The control on the right side of the face of thedisplay unit was associated with the forward sensor. Thissystem adjusted the brightness of all visual displaysautomatically to accommodate changing levels of ambientillumination.
The visual crash avoidance warning display for side-lookingsensor was located at the right A-pillar near the side view mirror.At the bottom of this display was a yellow LED whichilluminated to indicate that no obstacles were present in the
detection zone. When an obstacle was detected by the system,a red LED located at the top of the crash avoidance warningdisplay unit would illuminate steadily. The component locatedbetween the two LEDs just described was actually a light sensorused to sense the level of ambient illumination and adjust thebrightness of the crash avoidance warning displays accordingly.
The system also had an auditory warning which would sound ashort chime when an obstacle was present in the side detectionzone and the right turn signal was activated.
System H: Strengths and Weaknesses of the DriverInterface - The design of the crash avoidance warning visualdisplays for System H was considered to be good and inaccordance with the design characteristics suggested later in thisreport, i.e., a yellow LED was used to relate to the driver that noadjacent vehicle was detected but that he or she should proceedwith caution and a red LED was used to indicate that an adjacentvehicle had been detected. However, the human factors expertsfound that the LEDs used to present crash avoidance warninginformation were highly directional and not bright enough to besuff iciently visible while driving in darkness. This problem wasconsidered correctable and not inherent to the interface design.
The light sensor used to measure ambient light levels andperform automatic brightness control of the visual warningdisplays was considered a potential for confusion of the driver.The reason for this is the light sensor looked like a non-functioning visual warning LED due to its shape and positionbetween the yellow and red warning LEDs.
Another interesting phenomenon regarding the automaticbrightness adjustment feature of this driver interface wasobserved while driving on a lighted highway in darkness. Onehuman factors expert found that when driving under street lightson the highway, the brightness of the visual warning LEDswould change depending on the position of the vehicle withrespect to the street light (i.e., under a street light, between twoof them, etc.). Due to the nature of the system’s abruptlydiscrete adjustment of the brightness of the displays, the LEDsappeared to be flashing when driving on this type of lighted
18
roadway. This feature proved to be a source of confusion andannoyance for the driver.
The crash avoidance warning auditory display used a signalconsisting of a short chime which was found to be easy toperceive and discern. The adjustability of the auditory warningvolume via the provided control ensured that the warning signalcould be heard in a wide range of ambient noise levels.Auditory warning were only provided when the turn signal wasactivated which was considered to be a good feature.
The system status visual displays for System H showed anappropriate use of color with green being the color of the “ON”display and red the color of the “FAIL” display. The legend forthe system status visual display would have been more easilyvisible if they were provided as separate larger sized text placedappropriately with respect to the warning light rather than usingsmall text superimposed on a shield covering the warning LED.
The volume control provided by System H was considered to bevery good in that it provided auditory feedback reflecting thesetting of the volume level as the driver manipulated the control.The auditory feedback consisted of the system sounding theshort auditory warning chime at short intervals while the volumeknob was being rotated by the driver. The legends used to labelthe controls present on the driver interface were considered to begood. However, it was not obvious without studying the drivermanual thoroughly that the range control located on the righthalf of the face of the display was for the forward-looking sensor(not tested in this study).
Overall Assessment of the Driver Interface for SystemH - Overall, the driver interface for System H was consideredto be good. The appropriate use of color for visual displays,method of providing visual warnings, and location were allconsidered to be good qualities of this interface. Other favorablequalities included a good auditory warning signal which wasactive only when the turn signal was applied and a very well-designed volume control function which provided auditoryfeedback to the driver. An improvement to this driver interfacewould the improvement of the automatic brightness controlfeature or the use of a manual brightness control. The onlysignificant faults of this system, which were observed in thishuman factors testing but apply to the hardware of the systems,were the noticeably long delay time in presentation of crashavoidance warnings and small detection zone.
HUMAN FACTORS CHECKLIST RESULTS --BETWEEN SYSTEMS COMPARISONS
This section contains the results of between systemscomparisons for the different SCAS. Most of the analysescontained in this section are based on data from Section C of theHuman Factors Checklist. At the end of the section, the resultsof the scoring that was performed on Sections A and B of theHuman Factors Checklist are presented.
The results presented graphically for Section C of the HumanFactors Checklist were based solely on the responses of the two
human factors experts after having driven with the SCAS.Although responses were based on basic human factorsprinciples and related expert professional judgements, somedegree of individual diff erences are present in the data. Inaddition, although questions contained in the checklist focusedon assessing the attributes of the driver interface, frequently itwas found that factors related to system performance had someeffect on the perceived effectiveness of the driver interfacedesigns. Inconsistent or variable system performance could beattributed to weather, mechanical problems, or some other cause.Due to the inconsistent performance observed for many of thesystems tested and the small sample size used, it is difficult toattribute variability in response data to any one source. In somecases, the differences in responses due to individual differencesmay be larger than the differences between the plotted datavalues. Therefore, the response data are not discussed as beingstatistically significant. However, in many cases, the data doshow trends which allude to the effectiveness of individualSCAS driver interface designs.
The data values listed in the following figures represent themeans of the responses obtained for individual questions duringthe eight driving sessions (2 human factors experts; 2 testvehicles; day and night) conducted under Section C of thechecklist for each system. Each driving sessions lastedapproximately 2.5 hours.
The issues addressed were ones whose impacts were judged tobe likely to contribute significantly to the utilit y and potentialdegree of benefit provided by the systems, i.e., the degree towhich the systems contribute to decreasing the likelihood of acollision, or the degree to which they improve safety. Areasjudged to be important for inferring the utility and ease of use ofsystems through “in-use” evaluation included thecomprehensibility of the crash avoidance warning displays (seeFigure 16), the ease with which crash avoidance warningdisplays could be discriminated from other in-vehicle displays(see Figure 17), the degree to which the visual and auditorydisplays associated with a system were a source of distraction orannoyance to the driver (see Figures 18 through 21), theperceived degree of effectiveness of the systems (illustrated inFigures 22 through 25), and how often the system was used(shown in Figures 26 and 27).
Two questions contained in the checklist addressed theadequacy of manufacturer supplied documentation describingthe operation of the SCAS. Only 3 of the 7 systems hadassociated documentation. Only one of those provided was verygood, while the others were barely adequate.
Some displays were simple enough that their meanings could beeasily deduced in a static setting. Others, as shown by the resultsof the human factors experts’ static assessment of the meaningof crash avoidance warning visual displays for SCAS given inFigure 16, were not so easy to determine (e.g., the meaning of ablue light at the right A-pillar which illuminated constantly andwas extinguished when a yellow light was illuminated). Overall,it was clear that complete descriptive documentation detailingthe operation of the SCAS and the function of all visual andauditory displays was essential for proper and effective use of

19
4.25
5
2.38
4.38
2.88
4
4.75
1
1.5
2
2.5
3
3.5
4
4.5
5
A B D E F G H
Veryeasy todiscriminate
Very difficult todiscriminate
Figure 17. Part II, Question 3: While driving, how well couldcrash avoidance warning visual displays be discriminatedfrom any other nearby displays?
4.25
5
2.38
4.38
2.88
4
4.75
1
1.5
2
2.5
3
3.5
4
4.5
5
A B D E F G H
Veryeasy
Verydifficult
Figure 16. Part I, Question 5c: How easy to understand arethe meanings of the cautionary crash avoidance warning visualdisplays?
5
4.63
4.25
5
4.13
5
4.25
1
1.5
2
2.5
3
3.5
4
4.5
5
A B D E F G H
Not at alldistracting
Verydistracting
Figure 18. Part II, Question 4a: While driving, howdistracting were the visual system status displays?
A B D E F G H
Not at alldistracting
Verydistracting
Figure 19. Part II, Question 5b: While driving, howdistracting were the auditory crash avoidance warningdisplays?
the system.
Figure 17 shows that, although the crash avoidance visualwarnings for most systems could be easily identified, the driverinterfaces for Systems D and F had designs which wereconfusing in terms of distinguishing between crash avoidancewarning visual displays and system status visual displays. Acommon problem encountered with the systems tested was theinappropriate use of color in visual warning and system statusdisplays. Overall, the system status displays for the driverinterfaces tested were not significantly distracting in most casesas shown in Figure 18. However, the visual displays used topresent system status information for some systems wereconsidered to be excessively bright for nighttime driving.
Distraction presented more of a problem for some crashavoidance warning visual displays, as illustrated in Figure 19. The data presented in this graph corresponds well with thequalitative assessments of systems characteristics obtained inPart III of Section C of the Human Factors Checklist. The driver
interface for System D, which rated a relatively low score forthis measure, was considered to be confusing by the humanfactors experts and was judged to present too much informationto the driver. The warning LEDs for this system were alsoreported to be excessively bright for nighttime drivingapplications.
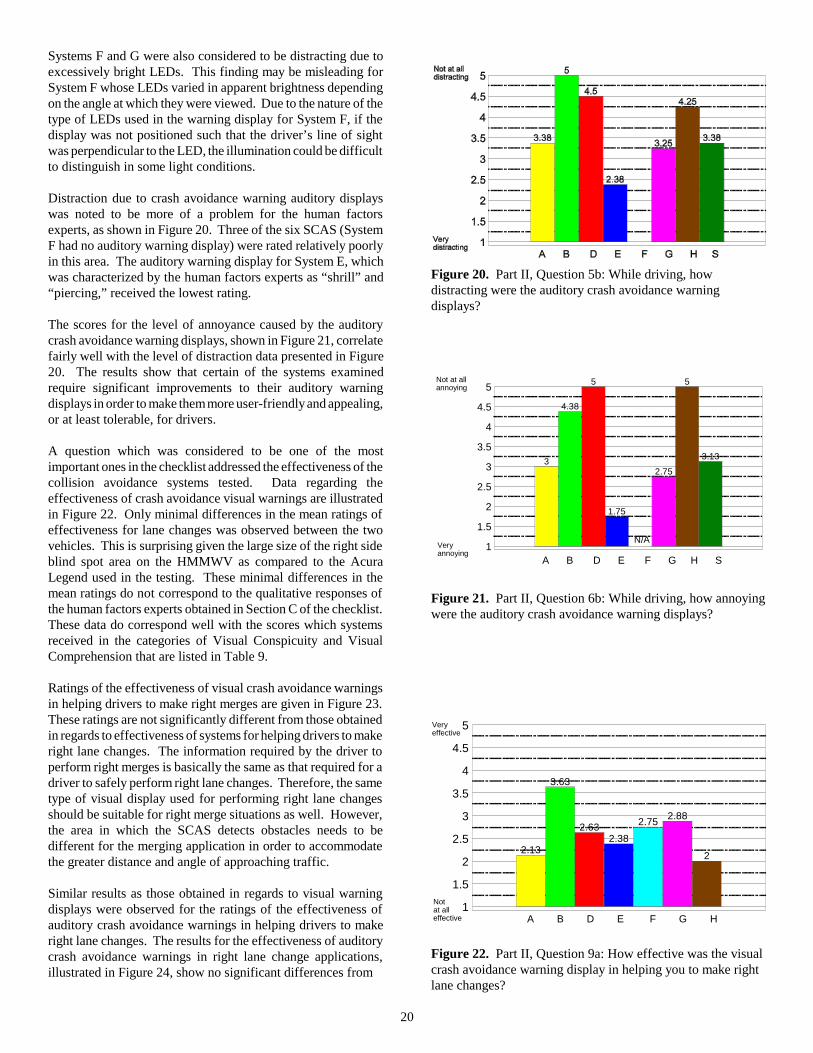
20
Figure 20. Part II, Question 5b: While driving, howdistracting were the auditory crash avoidance warningdisplays?
2.13
3.63
2.632.38
2.752.88
2
1
1.5
2
2.5
3
3.5
4
4.5
5
A B D E F G H
Veryeffective
Notat alleffective
Figure 22. Part II, Question 9a: How effective was the visualcrash avoidance warning display in helping you to make rightlane changes?
3
4.38
5
1.75
2.75
5
3.13
1
1.5
2
2.5
3
3.5
4
4.5
5
A B D E F G H S
Not at allannoying
Veryannoying
N/A
Figure 21. Part II, Question 6b: While driving, how annoyingwere the auditory crash avoidance warning displays?
Systems F and G were also considered to be distracting due toexcessively bright LEDs. This finding may be misleading forSystem F whose LEDs varied in apparent brightness dependingon the angle at which they were viewed. Due to the nature of thetype of LEDs used in the warning display for System F, if thedisplay was not positioned such that the driver’s line of sightwas perpendicular to the LED, the illumination could be difficultto distinguish in some light conditions.
Distraction due to crash avoidance warning auditory displayswas noted to be more of a problem for the human factorsexperts, as shown in Figure 20. Three of the six SCAS (SystemF had no auditory warning display) were rated relatively poorlyin this area. The auditory warning display for System E, whichwas characterized by the human factors experts as “shrill” and“piercing,” received the lowest rating.
The scores for the level of annoyance caused by the auditorycrash avoidance warning displays, shown in Figure 21, correlatefairly well with the level of distraction data presented in Figure20. The results show that certain of the systems examinedrequire significant improvements to their auditory warningdisplays in order to make them more user-friendly and appealing,or at least tolerable, for drivers.
A question which was considered to be one of the mostimportant ones in the checklist addressed the effectiveness of thecollision avoidance systems tested. Data regarding theeffectiveness of crash avoidance visual warnings are illustratedin Figure 22. Only minimal differences in the mean ratings ofeffectiveness for lane changes was observed between the twovehicles. This is surprising given the large size of the right sideblind spot area on the HMMWV as compared to the AcuraLegend used in the testing. These minimal differences in themean ratings do not correspond to the qualitative responses ofthe human factors experts obtained in Section C of the checklist.These data do correspond well with the scores which systemsreceived in the categories of Visual Conspicuity and VisualComprehension that are listed in Table 9.
Ratings of the effectiveness of visual crash avoidance warningsin helping drivers to make right merges are given in Figure 23.These ratings are not significantly different from those obtainedin regards to effectiveness of systems for helping drivers to makeright lane changes. The information required by the driver toperform right merges is basically the same as that required for adriver to safely perform right lane changes. Therefore, the sametype of visual display used for performing right lane changesshould be suitable for right merge situations as well. However,the area in which the SCAS detects obstacles needs to bedifferent for the merging application in order to accommodatethe greater distance and angle of approaching traffic.
Similar results as those obtained in regards to visual warningdisplays were observed for the ratings of the effectiveness ofauditory crash avoidance warnings in helping drivers to makeright lane changes. The results for the effectiveness of auditorycrash avoidance warnings in right lane change applications,illustrated in Figure 24, show no significant differences from
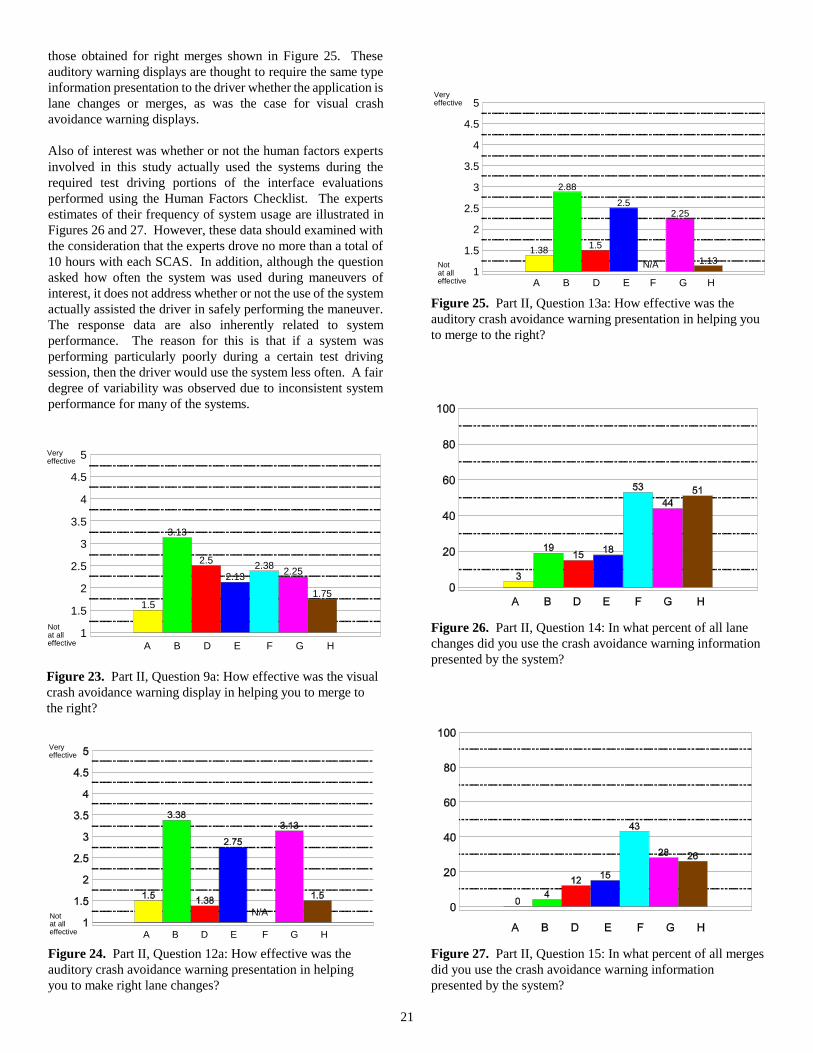
21
Figure 27. Part II, Question 15: In what percent of all mergesdid you use the crash avoidance warning informationpresented by the system?
Figure 26. Part II, Question 14: In what percent of all lanechanges did you use the crash avoidance warning informationpresented by the system?
A B D E F G H
Veryeffective
Notat alleffective
N/A
Figure 24. Part II, Question 12a: How effective was theauditory crash avoidance warning presentation in helpingyou to make right lane changes?
1.38
2.88
1.5
2.52.25
1.131
1.5
2
2.5
3
3.5
4
4.5
5
A B D E F G H
Veryeffective
Notat alleffective
N/A
Figure 25. Part II, Question 13a: How effective was theauditory crash avoidance warning presentation in helping youto merge to the right?
1.5
3.13
2.5
2.132.38
2.25
1.75
1
1.5
2
2.5
3
3.5
4
4.5
5
A B D E F G H
Veryeffective
Notat alleffective
Figure 23. Part II, Question 9a: How effective was the visualcrash avoidance warning display in helping you to merge tothe right?
those obtained for right merges shown in Figure 25. Theseauditory warning displays are thought to require the same typeinformation presentation to the driver whether the application islane changes or merges, as was the case for visual crashavoidance warning displays.
Also of interest was whether or not the human factors expertsinvolved in this study actually used the systems during therequired test driving portions of the interface evaluationsperformed using the Human Factors Checklist. The expertsestimates of their frequency of system usage are illustrated inFigures 26 and 27. However, these data should examined withthe consideration that the experts drove no more than a total of10 hours with each SCAS. In addition, although the questionasked how often the system was used during maneuvers ofinterest, it does not address whether or not the use of the systemactually assisted the driver in safely performing the maneuver.The response data are also inherently related to systemperformance. The reason for this is that if a system wasperforming particularly poorly during a certain test drivingsession, then the driver would use the system less often. A fairdegree of variability was observed due to inconsistent systemperformance for many of the systems.
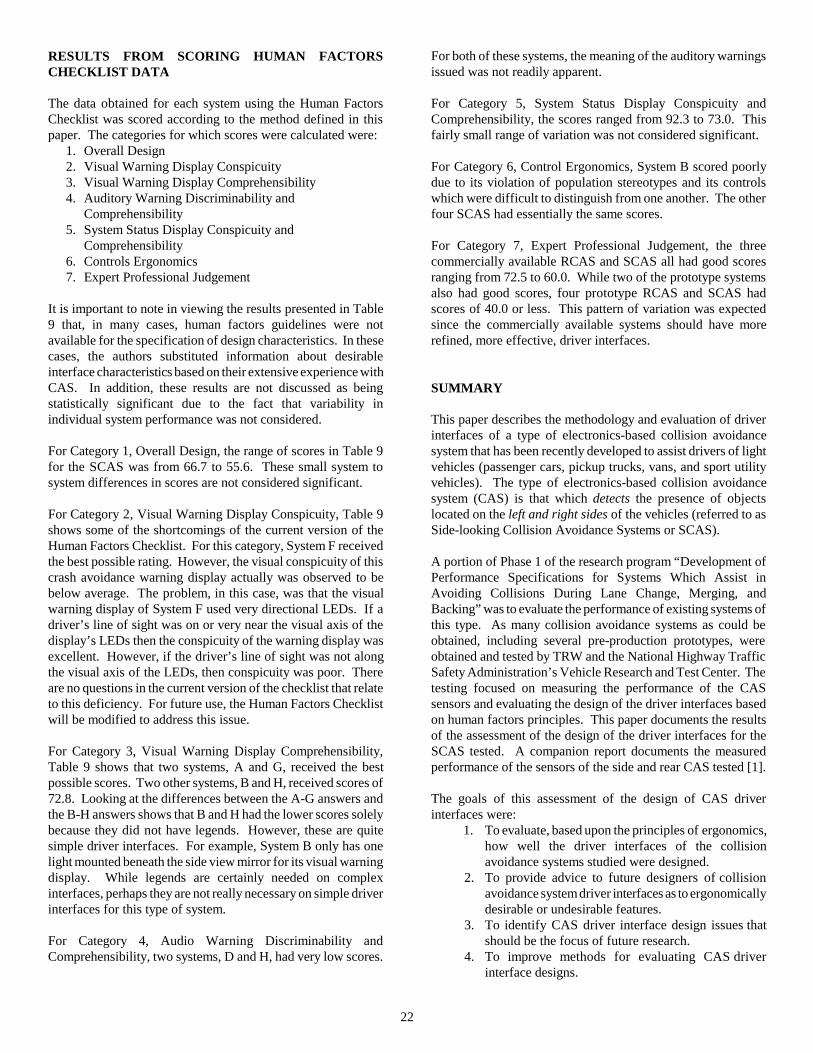
22
RESULTS FROM SCORING HUMAN FACTORSCHECKLIST DATA
The data obtained for each system using the Human FactorsChecklist was scored according to the method defined in thispaper. The categories for which scores were calculated were:
1. Overall Design2. Visual Warning Display Conspicuity3. Visual Warning Display Comprehensibility4. Auditory Warning Discriminability and
Comprehensibility5. System Status Display Conspicuity and
Comprehensibility6. Controls Ergonomics7. Expert Professional Judgement
It is important to note in viewing the results presented in Table9 that, in many cases, human factors guidelines were notavailable for the specification of design characteristics. In thesecases, the authors substituted information about desirableinterface characteristics based on their extensive experience withCAS. In addition, these results are not discussed as beingstatistically significant due to the fact that variability inindividual system performance was not considered.
For Category 1, Overall Design, the range of scores in Table 9for the SCAS was from 66.7 to 55.6. These small system tosystem differences in scores are not considered significant.
For Category 2, Visual Warning Display Conspicuity, Table 9shows some of the shortcomings of the current version of theHuman Factors Checklist. For this category, System F receivedthe best possible rating. However, the visual conspicuity of thiscrash avoidance warning display actually was observed to bebelow average. The problem, in this case, was that the visualwarning display of System F used very directional LEDs. If adriver’s line of sight was on or very near the visual axis of thedisplay’s LEDs then the conspicuity of the warning display wasexcellent. However, if the driver’s line of sight was not alongthe visual axis of the LEDs, then conspicuity was poor. Thereare no questions in the current version of the checklist that relateto this deficiency. For future use, the Human Factors Checklistwill be modified to address this issue.
For Category 3, Visual Warning Display Comprehensibility,Table 9 shows that two systems, A and G, received the bestpossible scores. Two other systems, B and H, received scores of72.8. Looking at the differences between the A-G answers andthe B-H answers shows that B and H had the lower scores solelybecause they did not have legends. However, these are quitesimple driver interfaces. For example, System B only has onelight mounted beneath the side view mirror for its visual warningdisplay. While legends are certainly needed on complexinterfaces, perhaps they are not really necessary on simple driverinterfaces for this type of system.
For Category 4, Audio Warning Discriminability andComprehensibility, two systems, D and H, had very low scores.
For both of these systems, the meaning of the auditory warningsissued was not readily apparent.
For Category 5, System Status Display Conspicuity andComprehensibility, the scores ranged from 92.3 to 73.0. Thisfairly small range of variation was not considered significant.
For Category 6, Control Ergonomics, System B scored poorlydue to its violation of population stereotypes and its controlswhich were diff icult to distinguish from one another. The otherfour SCAS had essentially the same scores.
For Category 7, Expert Professional Judgement, the threecommercially available RCAS and SCAS all had good scoresranging from 72.5 to 60.0. While two of the prototype systemsalso had good scores, four prototype RCAS and SCAS hadscores of 40.0 or less. This pattern of variation was expectedsince the commercially available systems should have morerefined, more effective, driver interfaces.
SUMMARY
This paper describes the methodology and evaluation of driverinterfaces of a type of electronics-based collision avoidancesystem that has been recently developed to assist drivers of lightvehicles (passenger cars, pickup trucks, vans, and sport utilityvehicles). The type of electronics-based collision avoidancesystem (CAS) is that which detects the presence of objectslocated on the left and right sides of the vehicles (referred to asSide-looking Collision Avoidance Systems or SCAS).
A portion of Phase 1 of the research program “Development ofPerformance Specifications for Systems Which Assist inAvoiding Collisions During Lane Change, Merging, andBacking” was to evaluate the performance of existing systems ofthis type. As many collision avoidance systems as could beobtained, including several pre-production prototypes, wereobtained and tested by TRW and the National Highway TrafficSafety Administration’s Vehicle Research and Test Center. Thetesting focused on measuring the performance of the CASsensors and evaluating the design of the driver interfaces basedon human factors principles. This paper documents the resultsof the assessment of the design of the driver interfaces for theSCAS tested. A companion report documents the measuredperformance of the sensors of the side and rear CAS tested [1].
The goals of this assessment of the design of CAS driverinterfaces were:
1. To evaluate, based upon the principles of ergonomics,how well the driver interfaces of the collisionavoidance systems studied were designed.
2. To provide advice to future designers of collisionavoidance system driver interfaces as to ergonomicallydesirable or undesirable features.
3. To identify CAS driver interface design issues thatshould be the focus of future research.
4. To improve methods for evaluating CAS driverinterface designs.

23
TABLE 9. System Ratings Based on Scoring of the Human Factors Checklist
SCAS
CATEGORY A B D E F G H
1 57.3 64.0 55.6 63.3 56.4 66.7 62.0
2 80.8 80.0 62.8 59.8 100.0 91.0 93.8
3 100.0 72.8 50.0 62.5 54.6 100.0 72.8
4 88.9 88.9 33.3 77.8 N/A 88.9 25.0
5 86.1 73.0 87.0 79.8 81.1 82.4 92.3
6 N/A 46.7 87.2 82.2 N/A 75.6 73.3
7 60.0 67.5 37.5 40.0 68.8 35.0 72.5
For this research, the driver interfaces of seven SCAS werestudied. Of these seven systems, two were sold commercially atthe time the study was initiated while five were pre-productionprototypes. These systems were designated as Systems A, B,and D through H. While the focus of this research was lightvehicles (passenger cars, pickup trucks, vans, and sport utilityvehicles, all with gross vehicle weight ratings below 44,500Newtons), several of the systems evaluated were intendedprimarily for use on heavy trucks. These systems were studiedbecause examining a large number of systems allowed for abetter understanding of the needed capabilities of collisionavoidance warning systems to be gained.
The principal data collection instrument used to perform ahuman factors assessment of existing collision avoidance systemdriver interfaces was a Human Factors Checklist titled“Descriptive Profile, Human Factors Assessment, andOperational Judgements of the Collision Avoidance SystemDriver/System Interface”. The checklist was used both as aresearch device and as a screening tool. It consisted of adocument containing qualitative and quantitative questions andtables. This document served as a tool for the collection of datacharacterizing collision avoidance system interfaces and theirassociated visual and auditory information displays and controls.
The checklist contained three sections. Section A was adescriptive profile which addressed the operation of the systemhardware and driver displays. Section B consisted of anassessment of the extent to which the visual and auditorydisplays conformed to established human factors guidelines.Section C consisted of a questionnaire used to assess theoperational performance of the driver/system interface by humanfactors experts after having driven with the systems. Overall, thechecklist provided a means by which the effectiveness of thedriver/system interface and the merits of systems could beassessed.
In addition to other analyses, the Human Factors Checklist wasscored. Scoring was used to reduce the quantity of datagenerated by the checklist so as to make more apparent theextent to which the driver interfaces incorporated desirablecharacteristics from a human factors perspective. Driverinterface features were assessed based upon human factorsguidelines gathered mainly from information presented in thereport “Preliminary Human Factors Guidelines for CrashAvoidance Warning Devices” [3] by COMSIS, SAERecommended Practices, and accepted texts of human factorsdesign principles. Where these sources lacked sufficientinformation to judge the appropriateness of certain interfacecharacteristics, the authors’ judgements based upon extensiveexperience with using and evaluating collision avoidancesystems was substituted.
The Human Factors Checklist used in this assessment wasmodified for this purpose from its original form developedspecifically for use in a study of heavy truck side and rearcollision avoidance systems. In modifying this checklist for usein this program, many needed revisions were realized. However,many necessary modifications to the checklist were not apparentuntil the benefit of retrospect was acquired upon completion ofthe study. Thus, the limitations of this checklist at this point intime are many. However, the Human Factors Checklist hasproved to be a useful resource for assessing CAS driverinterfaces. In the future, the checklist should be modified toimprove its form and extend its usefulness to encompass newand different CAS types.
Based upon analyses of the completed Human FactorsChecklists, the category-by-category scores for each system, anddiscussions with the two human factors experts, the strengthsand weaknesses of each system were identified.
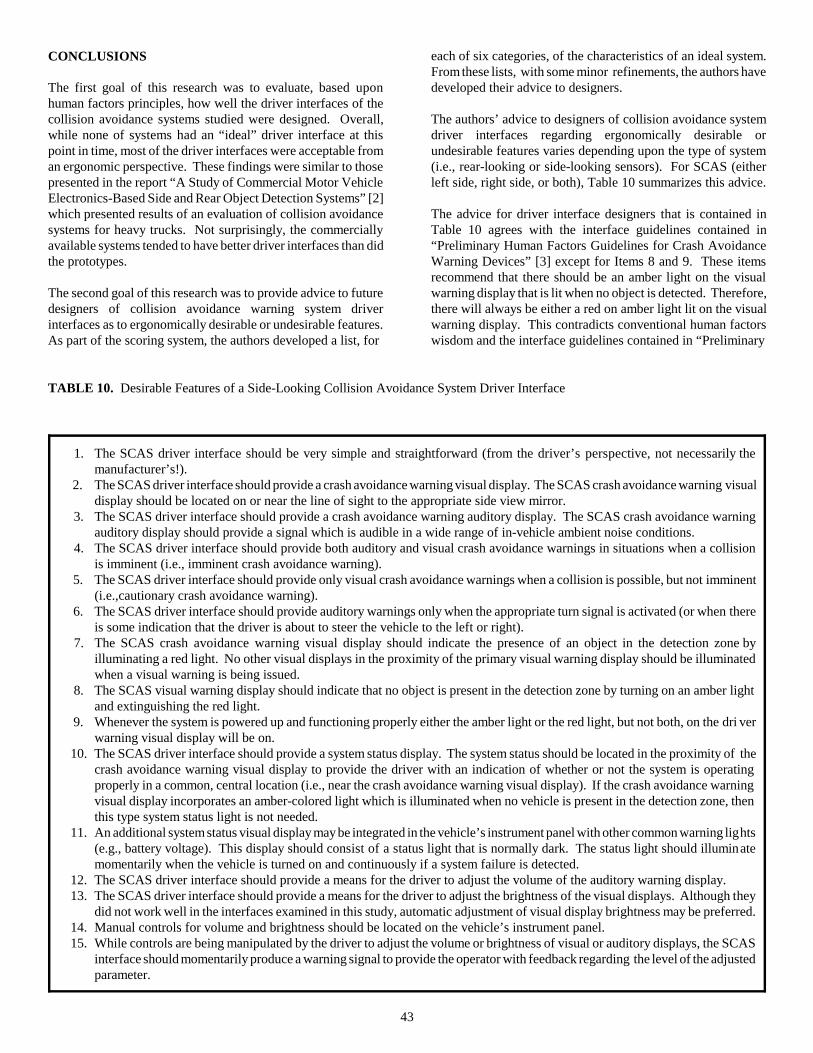
43
1. The SCAS driver interface should be very simple and straightforward (from the driver’ s perspective, not necessarily themanufacturer’s!).
2. The SCAS driver interface should provide a crash avoidance warning visual display. The SCAS crash avoidance warning visualdisplay should be located on or near the line of sight to the appropriate side view mirror.
3. The SCAS driver interface should provide a crash avoidance warning auditory display. The SCAS crash avoidance warningauditory display should provide a signal which is audible in a wide range of in-vehicle ambient noise conditions.
4. The SCAS driver interface should provide both auditory and visual crash avoidance warnings in situations when a collisionis imminent (i.e., imminent crash avoidance warning).
5. The SCAS driver interface should provide only visual crash avoidance warnings when a collision is possible, but not imminent(i.e.,cautionary crash avoidance warning).
6. The SCAS driver interface should provide auditory warnings only when the appropriate turn signal is activated (or when thereis some indication that the driver is about to steer the vehicle to the left or right).
7. The SCAS crash avoidance warning visual display should indicate the presence of an object in the detection zone byilluminating a red light. No other visual displays in the proximity of the primary visual warning display should be illuminatedwhen a visual warning is being issued.
8. The SCAS visual warning display should indicate that no object is present in the detection zone by turning on an amber lightand extinguishing the red light.
9. Whenever the system is powered up and functioning properly either the amber light or the red light, but not both, on the dri verwarning visual display will be on.
10. The SCAS driver interface should provide a system status display. The system status should be located in the proximity of thecrash avoidance warning visual display to provide the driver with an indication of whether or not the system is operatingproperly in a common, central location (i.e., near the crash avoidance warning visual display). If the crash avoidance warningvisual display incorporates an amber-colored light which is illuminated when no vehicle is present in the detection zone, thenthis type system status light is not needed.
11. An additional system status visual display may be integrated in the vehicle’s instrument panel with other common warning lights(e.g., battery voltage). This display should consist of a status light that is normally dark. The status light should illuminatemomentarily when the vehicle is turned on and continuously if a system failure is detected.
12. The SCAS driver interface should provide a means for the driver to adjust the volume of the auditory warning display.13. The SCAS driver interface should provide a means for the driver to adjust the brightness of the visual displays. Although they
did not work well in the interfaces examined in this study, automatic adjustment of visual display brightness may be preferred.14. Manual controls for volume and brightness should be located on the vehicle’s instrument panel.15. While controls are being manipulated by the driver to adjust the volume or brightness of visual or auditory displays, the SCAS
interface should momentarily produce a warning signal to provide the operator with feedback regarding the level of the adjustedparameter.
CONCLUSIONS
The first goal of this research was to evaluate, based uponhuman factors principles, how well the driver interfaces of thecollision avoidance systems studied were designed. Overall,while none of systems had an “ideal” driver interface at thispoint in time, most of the driver interfaces were acceptable froman ergonomic perspective. These findings were similar to thosepresented in the report “A Study of Commercial Motor VehicleElectronics-Based Side and Rear Object Detection Systems” [2]which presented results of an evaluation of collision avoidancesystems for heavy trucks. Not surprisingly, the commerciallyavailable systems tended to have better driver interfaces than didthe prototypes.
The second goal of this research was to provide advice to futuredesigners of collision avoidance warning system driverinterfaces as to ergonomically desirable or undesirable features.As part of the scoring system, the authors developed a list, for
each of six categories, of the characteristics of an ideal system.From these lists, with some minor refinements, the authors havedeveloped their advice to designers.
The authors’ advice to designers of collision avoidance systemdriver interfaces regarding ergonomically desirable orundesirable features varies depending upon the type of system(i.e., rear-looking or side-looking sensors). For SCAS (eitherleft side, right side, or both), Table 10 summarizes this advice.
The advice for driver interface designers that is contained inTable 10 agrees with the interface guidelines contained in“Preliminary Human Factors Guidelines for Crash AvoidanceWarning Devices” [3] except for Items 8 and 9. These itemsrecommend that there should be an amber light on the visualwarning display that is lit when no object is detected. Therefore,there will always be either a red on amber light lit on the visualwarning display. This contradicts conventional human factorswisdom and the interface guidelines contained in “Preliminary
TABLE 10. Desirable Features of a Side-Looking Collision Avoidance System Driver Interface
25
Human Factors Guidelines for Crash Avoidance WarningDevices” [4] which state that the onset of a signal is moreconspicuous than a change in an existing signal. Therefore,warnings will be more conspicuous when there is no signal inthe absence of a warning. However, some of the interfacestested had this feature consisting of a light that was illuminatedwhen no object was detected. Both of the human factors expertswho evaluated the interfaces liked this feature and found ithelpful for locating the crash avoidance warning display inconditions of low ambient illumination. Therefore, thisrecommendation is listed in Table 10 even though it contradictsconventional human factors wisdom. This issue should be thetopic of additional, future research.
All of the above advice to designers is preliminary in that it wasgenerated by the authors’ experiences in examining, and drivingwith, a substantial number of systems.
The third goal of this research was to identify CAS driverinterface design issues that should be the focus of futureresearch. A very reasonable focus of future CAS driverinterface design research would be to perform a more in-depthinvestigation of each of the items of advice for SCAS interfacedesigners contained in Table 10 as well as other relevant issues,such as the problem of designing a collision avoidance warningdisplay which is noticeable but not an unnecessary source ofdistraction. In-depth investigations of these issues could includeexperiments to determine such things as driver reaction timesusing an interface designed in accordance with the authors’advice versus reaction times for interfaces which are based ondifferent designs. However, it is important to realize that it isdiff icult to evaluate the driver interface of a CAS which has poorsensor performance. Improvements in sensor design astechnologies mature should assist this effort.
The fourth goal of this research was to improve methods forevaluating driver interface designs. While the Human FactorsChecklist used for this work was much improved over theoriginal heavy truck version, it was apparent by the end of thisproject that the revised checklist still had some shortcomings. Itis recommended that the Human Factors Checklist be revisedbased upon the findings of this study and allow the checklist toevolve as a tool, as intelligent transportation systems areevolving, for use future research of this type.
ACKNOWLEDGMENTS
The authors would like to acknowledge the contributions ofSteven M. Kiger of R & R Research Inc. in support of thisresearch.
This work was performed under the sponsorship of the NationalHighway Traff ic Safety Administration of the United StatesDepartment of Transportation. The opinions, findings, andconclusions expressed in this document are those of the authorsand not necessarily those of the Department of Transportation orthe National Highway Traff ic Safety Administration.
REFERENCES
[1] Talmadge, S., Yokoyama, K., Shreve, G., Johnston, J.(1995). Development of Performance Specifications forCollision Avoidance Systems for Lane Change, Merging,and Backing -- Task 3 - Test of Existing HardwareSystems for Lane Change, Merging, and Backing. (Inpress).
[2] Mazzae, E., Garrott, W.R., (1995). Development ofPerformance Specifications for Collision AvoidanceSystems for Lane Change, Merging, and Backing -- Task3 - Human Factors Assessment of the Driver Interfacesof Existing Collision Avoidance Systems. (In press).
[3] U.S. Department of Transportation, National HighwayTraff ic Safety Administration. (January, 1994). A Studyof Commercial Motor Vehicle Electronics-Based Rearand Side Object Detection Systems. (DOT HS 808 075).Washington, D.C.: National Highway Traffic SafetyAdministration.
[4] Lerner, N.D., Kotwal, B.M., Lyons, R.D., andGardner-Bonneau, D.J. (COMSIS Corporation).(October, 1993). Preliminary Human FactorsGuidelines For Crash Avoidance Warning Devices.(NHTSA Project No. DTNH22-91-C-07004).
[5] Salvendy, Gavriel (1987). Handbook of Human Factors.New York: John Wiley & Sons, Inc.
[6] Woodson, W.E., Till man, B., Tillman, P. (1992). Human Factors Design Handbook, 2nd edition. NewYork: McGraw-Hill, Inc

26
APPENDIX: HUMAN FACTORS CHECKLIST
DESCRIPTIVE PROFILE, HUMAN FACTORS ASSESSMENT, AND OPERATIONAL JUDGEMENTS OF THECOLLISION AVOIDANCE SYSTEM DRIVER/SYSTEM INTERFACE
Date: _____ / _____ / _____ Type of System: Lane Change / Merge (check all that apply) Backup
Product Name: _________________________________________________________
Manufacturer ________________________________________________Name and Address: ________________________________________________
________________________________________________
Test Vehicle: ________________________________________________(make, model, year)
Section A Completed by: _______________________________________________________ (Name and position)
Previous experience with this device: _________________________________________
Section B Completed by: _______________________________________________________(Name and position, if different from above)
Previous experience with this device: _________________________________________
Section C Completed by: _______________________________________________________ (Name and position, if different from above)
Previous experience with this device: _________________________________________
The purpose of this document is to serve as a tool for the collection of data regarding collision avoidance system driver/system interfaces.This document composes both a research device and screening tool by which the merits of systems may be assessed. The informationcollected includes: 1) descriptions of the operation of system hardware and displays; 2) an assessment of the extent to which the visualand auditory displays conform to established human factors guidelines; and 3) an assessment of operational performance of thedriver/system interface. This information may be used to evaluate the effectiveness of the driver/system interface.
The term, “crash avoidance warning,” used throughout this document, refers to any information which a system provides to the driver tohelp prevent an accident. The type of information this warning consists of is dependent on the category of a particular system. Crashavoidance warnings are divided into two categories here: 1) cautionary and 2) imminent. Cautionary crash avoidance warning informationis any information provided by a system which warns the driver of a potentially dangerous situation (i.e., obstructing vehicle in an adjacentlane when considering changing lanes, obstructing vehicle to the rear when backing). Imminent crash avoidance warning informationrefers to any information which a system might provide to warn the driver of an impending collision.
SECTION A: DESCRIPTIVE PROFILEThe purpose of the descriptive profile of the system is to record information regarding the system's operation, sensor configuration, andphysical characteristics of the visual and auditory driver displays. These data may be used to evaluate the appropriateness of the displaycharacteristics and the effectiveness of the driver/system interface. This section is to be completed by a human factors expert.
SECTION B: HUMAN FACTORS ASSESSMENTThe purpose of the human factors assessment is to determine the extent to which the design of a particular system's driver/system interfaceconforms to accepted human factors design principles. These data may be used as stand-alone evaluations or a means for relativecomparison among systems. This section is to be completed by one or more human factors experts.
SECTION C: OPERATIONAL JUDGEMENTS OF THE DRIVER/SYSTEM INTERFACEThis section is intended to be subjective assessment of the driver/system interface. Individuals completing this section should includeone or more human factors experts per system, if possible. Experts will review the manufacturer’s documentation and become familiarwith the operation of the system through practice with the device before completing Part I of this section. They will then operate a testvehicle over a fixed route in traff ic with an operational system installed in the vehicle. Part II should be filled out after the test drive hasbeen completed. These subjective data form an assessment of the driver/system interface from the user's point of view and provide a meansfor comparison of this subjective information with objective data collected in other stages of the system evaluation.

27
SECTION A
DESCRIPTIVE PROFILE OF SYSTEM AND DRIVER/SYSTEM INTERFACE
Instructions for Section A:
- This section is to be completed by a human factors expert.
- Measurements should be taken in a laboratory setting if possible.
- Metric units should be used.
- A detailed 20.32 X 25.4 cm (8 X 10 inch) photograph with ruler in the frame should be taken as part of this data collection effort.
- Suggested references and sources of criteria for use in assessing the appropriateness of the driver/system interface features and the overalleffectiveness of this interface include any SAE Recommended Practice. In the event that specific recommendations for some aspect ofthe interface cannot be found in any SAE recommendation, other sources of human factors design principles, such as ’Preliminary HumanFactors Guidelines for Crash Avoidance Warning Devices’ (COMSIS, 1993), the ’Human Factors Design Handbook’ (Woodson, 1992),the ’Handbook of Human Factors’ (Salvendy, 1987), MIL-STD-1472, or other preferred text, may be used. When referencing specifictexts, the evaluator should give a full reference (including page number) for the information cited.
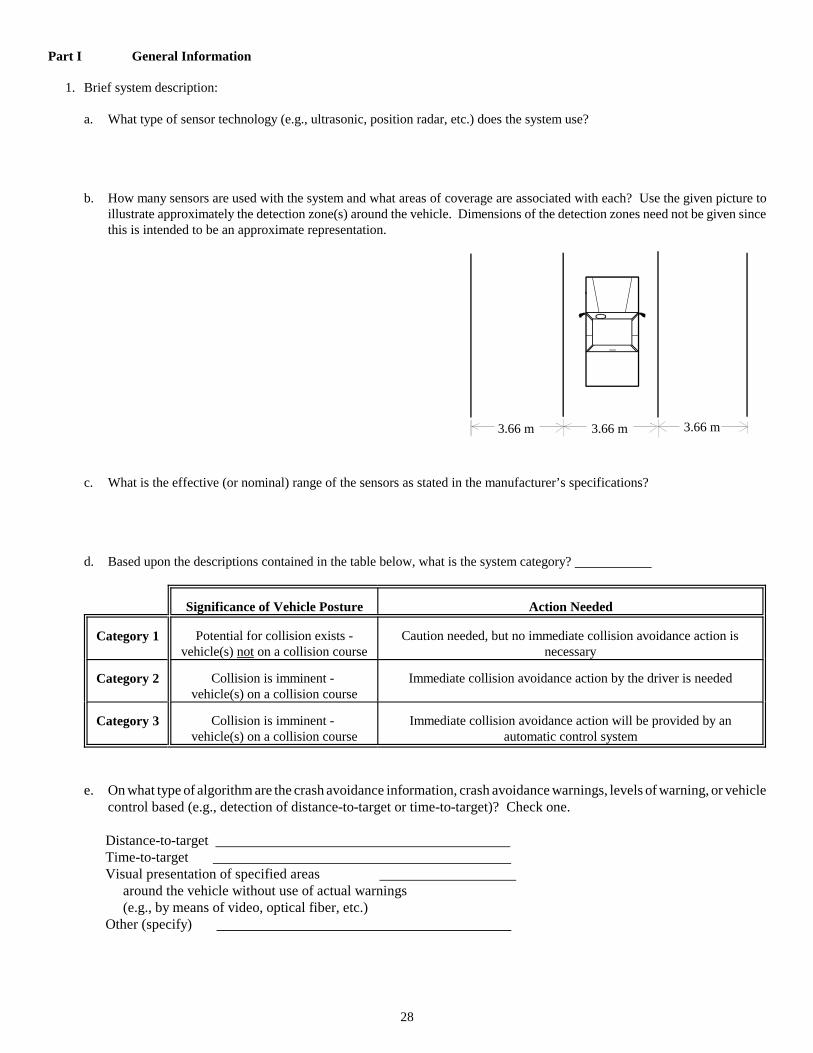
28
3.66 m 3.66 m3.66 m
Part I General Information
1. Brief system description:
a. What type of sensor technology (e.g., ultrasonic, position radar, etc.) does the system use?
b. How many sensors are used with the system and what areas of coverage are associated with each? Use the given picture toillustrate approximately the detection zone(s) around the vehicle. Dimensions of the detection zones need not be given sincethis is intended to be an approximate representation.
c. What is the effective (or nominal) range of the sensors as stated in the manufacturer’s specifications?
d. Based upon the descriptions contained in the table below, what is the system category?
Significance of Vehicle Posture Action Needed
Category 1 Potential for collision exists -vehicle(s) not on a collision course
Caution needed, but no immediate collision avoidance action isnecessary
Category 2 Collision is imminent - vehicle(s) on a collision course
Immediate collision avoidance action by the driver is needed
Category 3 Collision is imminent - vehicle(s) on a collision course
Immediate collision avoidance action will be provided by anautomatic control system
e. On what type of algorithm are the crash avoidance information, crash avoidance warnings, levels of warning, or vehiclecontrol based (e.g., detection of distance-to-target or time-to-target)? Check one.
Distance-to-target Time-to-target Visual presentation of specified areas around the vehicle without use of actual warnings (e.g., by means of video, optical fiber, etc.)Other (specify)

29
f. What type of media is used for the manufacturer’s documentation? Indicate below with an ’X’.Attach a copy of the manufacturer’s documentation to the back of Section A.
Type of media: Printed manual Audio tape Video tape Other (specify) None
2. In Table I below, list the manufacturer’s suggested mounting location for each visual display (and auditory warning unit orcontrol, if separately mounted). Write ’Not Specified’ if the manufacturer does not specify mounting locations.
3. In Table I below, list the overall dimensions (width x height x depth) of each display and control unit. Use millimeters (round to nearest millimeter).
TABLE IMounting Locations and Overall DimensionsOverall Dimensions
Display, Auditory Message Manufacturer’s Recommended (For reference)or Control Mounting Location (W x H x D)
System status display ________________________________________ __________ mm
Cautionary crash avoidance warning ________________________________________ __________ mm
Imminent crash avoidance warning ________________________________________ __________ mm
Other ________________ ________________________________________ __________ mm(specify)
Note: Although manufacturers may use a single integrated display, control and warning unit, the organization of Table I providesfor multiple units, each separately mounted in different locations in the vehicle. If a single integrated display, control andwarning unit is used, please note this in Table I.
4. In Table II below, list the maximum viewing distance to each visual display unit with the system installed in the manufacturer’srecommended location(s). Note that the maximum viewing distance for displays mounted in front of the driver is the distancefrom the seated eye position of the 95th percentile male driver to the center of the visual display. If the manufacturer does notspecify a mounting location, assume a mounting location in or on top of the instrument panel within 15 degrees horizontally andvertically of the driver’s normal straight-ahead line of sight to the road, and note that this default location is being used.
TABLE IIMaximum Display Viewing Distances
Display Viewing Distance
System status display _______________ mmCautionary crash avoidance warning display _______________ mmImminent crash avoidance warning display _______________ mmOther display _______________ mm
(specify)
5. In Table III below, list the maximum reach distance* to the control unit with the control unit installed in the manufacturer’srecommended location(s). If the manufacturer does not specify a mounting location, assume a mounting location in or on topof the instrument panel within 15 degrees horizontally and vertically of the driver’s normal straight-ahead line of sight to the roadand use of this default location should be noted. For controls located in front of the driver, the 95th percentile male driver’sseated position will determine the maximum reach distance to controls.
* The maximum reach distance is defined to be the straight line distance from the driver’s shoulder to the control. The need forreaching around obstructions, such as the steering wheel, should be noted.

30
TABLE IIIMaximum Control Reach Distances
Control Unit Reach Distance
__________________________________________ ____________ mm(Specify)(e.g., warning volume)
__________________________________________ ____________ mm(Specify)
__________________________________________ ____________ mm(Specify)
6. In Table IV, for each item of information presented by the system, enter information in the appropriate columns.
Notes for Table IV
a. Measure luminances with display removed from vehicle and in a laboratory where illumination levels can be controlled.The displays must be operational for these measurements. For this assessment, assume nighttime and daytime illuminationlevels of 0.32 lux (0.03 footcandles) and 10,760 lux (1,000 footcandles), respectively. Measure luminances with brightnessadjustment control (if present) set at the minimum and maximum settings.
b. Calculate percent contrast using the following formula:
(LD - LB) / LB x 100 where LD = luminance of the displayed information in foot-lambertsLB = luminance of the display background in foot-lamberts
c. When measuring the size of alphanumeric characters (and icons) record the height and width of the character, as well as,the stroke width of the character. For alphanumeric characters, the stroke width is the minimum detail that must beresolved by the driver.
d. Assume the maximum viewing distances, as listed in Table II. Compute the visual angle subtended (minutes of arc) usingthe following formula:
Visual Angle Subtended = (H / D) x (57.3 degrees/radian) x (60 minutes/degree) where,
H = height of viewed object (or stroke width of character) in millimetersD = viewing distance in millimeters
7. In Table V below, list the auditory messages that are presented by the system. For each message, enter the information shownat the top of the columns.
Notes for Table Va. Measure auditory characteristics of messages at the driver’s seat with ignition switch off (i.e., engine and all accessories
off) and windows up.b. Measure the loudness of messages (in dB(A)) with the volume adjustment control (if present) in the minimum and
maximum loudness settings.c. Perform an octave band analysis on messages to determine sound intensity level (Note: examine
levels by octave band, in units of dB(C); e.g., 500-1000 Hz, 1000-2000 Hz).
8. In Table VI below, for each control, enter the information listed at the top of the columns.

31
TABLE IV. Descriptive Profile – Visual Displays(If no display is present for an item listed in the leftmost column, write N/A [not applicable] in the appropriate boxes.)
NAME OFDISPLAYED
INFORMATION
TYPE OF INFORMATIONDISPLAYED
(e.g., indication of object indetection zone, distance to
adjacent vehicle)
TRIGGERING EVENT(e.g., power application
to system, vehicle indetection zone)
TYPE OFDISPLAY USED(LCD, LED, icon)
TYPE OFCOLORCODING
USED
DISPLAYLUMINANCE-DAY (Cd/m2)(min. & max.
brightnesssetting)
BACKGROUNDLUMINANCE-DAY (Cd/m2)
System on/off
Cautionary crashavoidance warning
Imminent crashavoidance warning
Systemmalfunction
Other (list)
TABLE IV. Descriptive Profile – Visual Displays (Continued)(If no display is present for an item listed in the leftmost column, write N/A [not applicable] in the appropriate boxes.)
NAME OFDISPLAYED
INFORMATION
DISPLAYLUMINANCE-
NIGHT(min. & max.
brightnesssetting)
BACKGROUNDLUMINANCE -
NIGHTCONTRAST(day & night)
DUTY CYCLE(steady burn,
flash rate)
SIZE OFDISPLAYED
INFORMATION(diameter, smallest
character height andwidth, stroke width)
VISUAL ANGLESUBTENDED
AT MAXIMUMVIEWING DISTANCE
(minutes of arc)
System on/off
Cautionary crashavoidance warning
Imminent crashavoidance warning
Systemmalfunction
Other (list)

32
TABLE V. Descriptive Profile – Auditory Warnings(If no display is present for an item listed in the leftmost column, write N/A [not applicable] in the appropriate boxes.)
TYPE OFAUDITORY
SIGNAL
TYPE OFINFORMATION
PRESENTED (e.g.,indication of objectin detection zone,
distance to adjacentvehicle)
TRIGGERINGEVENT
(e.g., powerapplication to
system, vehiclein detection
zone)
TYPE OFWARNING
(steady,warble,
intermittent)PITCH
(frequency)
LOUDNESS(record at
both min. &max.
loudnesssettings)
DURATIONOF
AUDIBLEWARNING
SIGNAL
DUTYCYCLE
(ifintermittent,
e.g., beeping)
CHANGESAFTERONSET
System on
Cautionary crashavoidance warning
Imminent crashavoidance warning
Systemmalfunction
Other (list)
TABLE VI. Descriptive Profile – Manual Controls(If no display is present for an item listed in the leftmost column, write N/A [not applicable] in the appropriate boxes.)
CONTROLFUNCTION
CONTROL TYPE(knob, toggle,
push button, etc.)
CONTROL SIZE(width X height,diameter, length,
etc.)(in mm.)
DOES THE CONTROLOBSTRUCT THE DRIVER’S
VIEW OF VISUAL WARNINGDISPLAYS
TYPE OFADJUSTMENT
(discrete orcontinuous)
DESCRIBE TYPEOF CONTROL
FEEDBACK (aural,visual, tactile)
System on/off
Volumeadjustment
Light intensity(dimming) adjustment
Sensorsensitivity
adjustment
Visual displayoverride
Audibledisplay
override
Other (list)

33
Part II. Checklist of System Features (All possible features may not be listed here. List other features at the bottom of the page.) ND= Not determinableCircle the word which best describes your response. N/A= Not Applicable
1. Does the system turn on (i.e., power up) automatically (e.g., when the ignition switch is turnedon)?
2. Does the system have a power switch which allows the driver to turn the system on or off whiledriving?
3. Is the system on and functioning (i.e., providing warnings) at all times when the vehicle is inmotion?
4. Is the standby mode of the system’s crash avoidance warning features enabled by the ignitionswitch?
5. Does the system use both visual and auditory presentations of crash avoidance warninginformation?
6. Are the visual crash avoidance warning features of the system enabled by the turn signal orsensed lateral motion (or enabled by reverse gear for backup systems)?
7. Are the auditory crash avoidance warning features of the system enabled by the turn signal orsensed lateral motion (or enabled by reverse gear for backup systems)?
8. Is there a display brightness adjustment for the visual display(s) that can be operated by thedriver while driving?
9. Is there a volume adjustment for the auditory display(s) that can be operated by the driver whiledriving?
10. Does the system adjust the brightness of the visual display(s) automatically?
11. Does the system adjust the volume of the auditory display(s) automatically?
12. Is there a temporary manual override control for the visual warning signal(s) for instances whenobjects known to the driver are encountered in the blind spot?
13. Is there a temporary manual override control for the auditory signal(s) for instances when objectsknown to the driver are encountered in the blind spot?
14. Are any visual displays present (i.e., actively presenting information) on the device when thereare NO objects sensed in the detection zone?
15. Does the system have a "self-test" feature that allows the driver to check for proper operationof visual and auditory displays and logic circuits while driving?
16. Does the system have an automatic indicator of sensor failure?
17. Does the system have an automatic indicator of visual display failure?
18. Does the system have an automatic indicator of auditory display failure?
19. Is there a sensor sensitivity adjustment control present that can be adjusted by the driver whilethe vehicle is in motion?
ND No Yes N/A
ND No Yes N/A
ND No Yes N/A
ND No Yes N/A
ND No Yes N/A
ND No Yes N/A
ND No Yes N/A
ND No Yes N/A
ND No Yes N/A
ND No Yes N/A
ND No Yes N/A
ND No Yes N/A
ND No Yes N/A
ND No Yes N/A
ND No Yes N/A
ND No Yes N/A
ND No Yes N/A
ND No Yes N/A
ND No Yes N/A

34
SECTION B:
HUMAN FACTORS ASSESSMENT OF THE DRIVER/SYSTEM INTERFACE
(In the material to follow, the term, "appropriate", means compliance with accepted SAE Recommended Practices and/orhuman factors design principles)
Instructions for Section B:- This section is to be completed by one or more human factors experts.- The individual completing this section should be familiar with the referenced SAE Recommended Practices and human factors guidelinesbefore beginning this section.- Measurements made in Section A may be used in determining the appropriateness of design characteristics.- Suggested references and sources of criteria for use in assessing the appropriateness of the driver/system interface features and the overalleffectiveness of this interface include any SAE Recommended Practice. In the event that specific recommendations for some aspect ofthe interface cannot be found in any SAE recommendation, other sources of human factors design principles, such as ’Preliminary HumanFactors Guidelines for Crash Avoidance Warning Devices’ (COMSIS, 1993), the ’Human Factors Design Handbook’ (Woodson, 1992),the ’Handbook of Human Factors’ (Salvendy, 1987), MIL-STD-1472, or other preferred text, may be used. When referencing specifictexts, the evaluator should give a full reference (including page number) for the information cited.
Part I. Crash Avoidance Warning Visual DisplaysCircle the number or word which best describes your response. ND=Not determinable
N/A=Not applicableA. General
1. Is displayed crash avoidance warning information labeled?
2. Are the information coding methods used (e.g., size, shape, brightness, color) for crashavoidance warning appropriate for the type of information presented?
3. Do the information coding techniques used for crash avoidance warnings conform to populationstereotypes (e.g., brighter or larger displayed information for traffic closer to the driver)?
4. Is crash avoidance warning information presented using appropriate redundant visual codes(e.g., simultaneous brightness and size increases as traffic gets closer)?
5. Does the organization of crash avoidance warning information facilitate quick acquisition ofinformation while driving?
B. Cautionary Crash Avoidance Warnings - Visual
ND No Yes N/A
ND No Yes N/A
ND No Yes N/A
ND No Yes N/A
ND No Yes N/A
6. Are any cautionary crash avoidance warning visual displays for this system located within 15degrees horizontally and vertically of the driver’s line of sight to the right side mirrors? (for rightside systems)
7. Are any cautionary crash avoidance warning visual displays for this system located within 15degrees horizontally and vertically of the driver’s line of sight to the left side mirrors? (for leftside systems)
8. Are any cautionary crash avoidance warning visual displays for this system located within 15degrees horizontally and vertically of the driver’s straight-ahead line of sight to the road?
9. Is the presence of any right side cautionary crash avoidance warning visual signal noticeablewhen the driver looks at the right side view mirrors?
ND No Yes N/A
ND No Yes N/A
ND No Yes N/A
ND No Yes N/A

34
10. Is the presence of any left side cautionary crash avoidance warning visual signal noticeablewhen the driver looks at the left side view mirrors?
11. Is the presence of cautionary crash avoidance warning visual signal(s) noticeable when thedriver looks at the inside rear view mirror?
12. Is the presence of any right side cautionary crash avoidance warning visual signal noticeablewhen the driver looks straight ahead?
13. Is the presence of any left side cautionary crash avoidance warning visual signal noticeablewhen the driver looks straight ahead?
14. Is the presence of any right side cautionary crash avoidance warning visual signal noticeablewhen the driver looks midway between the right side A and B pillars?
15. Is the presence of any left side cautionary crash avoidance warning visual signal noticeablewhen the driver looks midway between the left side A and B pillars?
16. Is the driver’s line of sight to all cautionary crash avoidance warning visual displaysunobstructed (e.g., by other controls, displays or vehicle components)?
17. Can the driver discriminate the cautionary crash avoidance warning from all other proximallydisplayed information (e.g., system status information)?
18. Are all cautionary crash avoidance warning displays discernible in daylight?
19. Are all cautionary crash avoidance warning displays discernible in darkness?
20. Are all cautionary crash avoidance warning displays discernible in light from specular glaresources (e.g., overhead street lights, sun)?
21. How effectively have SAE Recommended Practices and human factors design principles beenapplied to the design of the cautionary crash avoidance warning visual displays?
C. Imminent Crash Avoidance Warnings - Visual
22. Are any imminent crash avoidance warning visual displays for this system located within 15degrees horizontally and vertically of the driver’s line of sight to the right side mirrors? (for rightside systems)
23. Are any imminent crash avoidance warning visual displays for this system located within 15degrees horizontally and vertically of the driver’s line of sight to the left side mirrors? (for leftside mirrors)
24. Are any imminent crash avoidance warning visual displays for this system located within 15degrees horizontally and vertically of the driver’s straight-ahead line of sight to the road?
25. Is the presence of any right side imminent crash avoidance warning visual signal noticeablewhen the driver looks at the right side view mirrors?
26. Is the presence of any left side imminent crash avoidance warning visual signal noticeable whenthe driver looks at the left side view mirrors?
27. Is the presence of imminent crash avoidance warning visual signal(s) noticeable when the driverlooks at the inside rear view mirror?
ND No Yes N/A
ND No Yes N/A
ND No Yes N/A
ND No Yes N/A
ND No Yes N/A
ND No Yes N/A
ND No Yes N/A
ND No Yes N/A
ND No Yes N/A
ND No Yes N/A
ND No Yes N/A
Very Somewhat Very Ineffectively Effectively Effectively major some few changes changes changes needed needed needed
ND 1 2 3 4 5 N/A
ND No Yes N/A
ND No Yes N/A
ND No Yes N/A
ND No Yes N/A
ND No Yes N/A
ND No Yes N/A
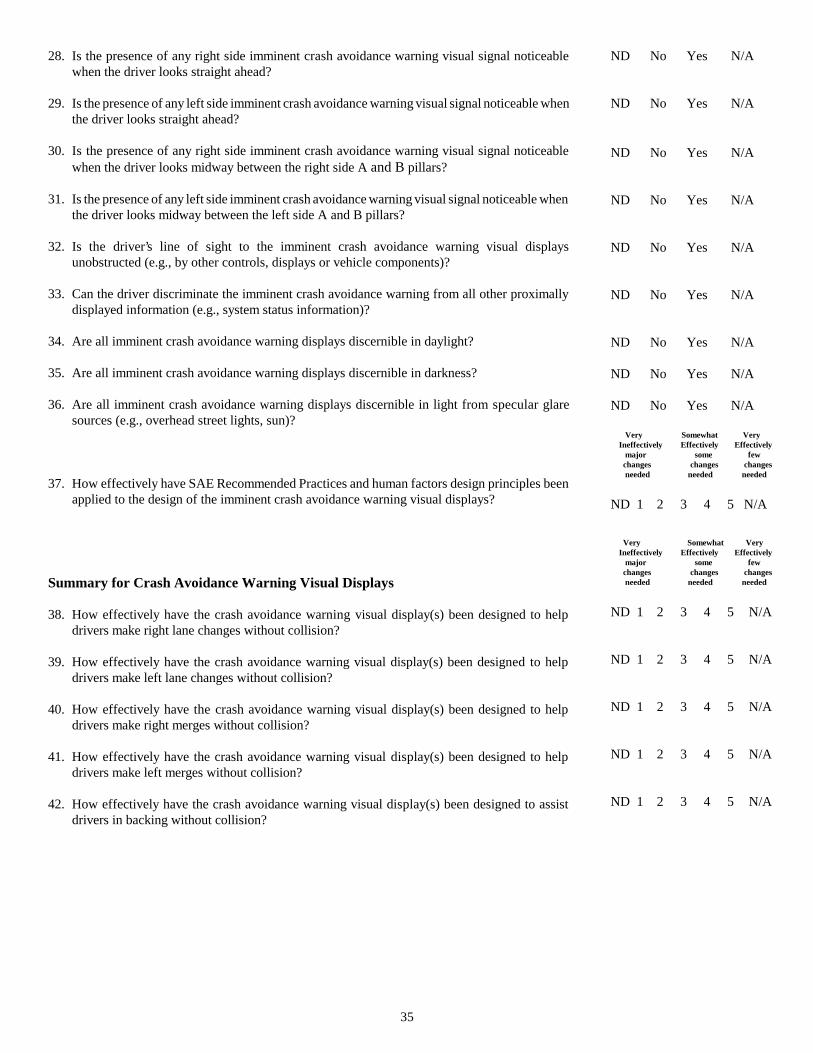
35
28. Is the presence of any right side imminent crash avoidance warning visual signal noticeablewhen the driver looks straight ahead?
29. Is the presence of any left side imminent crash avoidance warning visual signal noticeable whenthe driver looks straight ahead?
30. Is the presence of any right side imminent crash avoidance warning visual signal noticeablewhen the driver looks midway between the right side A and B pillars?
31. Is the presence of any left side imminent crash avoidance warning visual signal noticeable whenthe driver looks midway between the left side A and B pillars?
32. Is the driver’s line of sight to the imminent crash avoidance warning visual displaysunobstructed (e.g., by other controls, displays or vehicle components)?
33. Can the driver discriminate the imminent crash avoidance warning from all other proximallydisplayed information (e.g., system status information)?
34. Are all imminent crash avoidance warning displays discernible in daylight?
35. Are all imminent crash avoidance warning displays discernible in darkness?
36. Are all imminent crash avoidance warning displays discernible in light from specular glaresources (e.g., overhead street lights, sun)?
37. How effectively have SAE Recommended Practices and human factors design principles beenapplied to the design of the imminent crash avoidance warning visual displays?
Summary for Crash Avoidance Warning Visual Displays
38. How effectively have the crash avoidance warning visual display(s) been designed to helpdrivers make right lane changes without collision?
39. How effectively have the crash avoidance warning visual display(s) been designed to helpdrivers make left lane changes without collision?
40. How effectively have the crash avoidance warning visual display(s) been designed to helpdrivers make right merges without collision?
41. How effectively have the crash avoidance warning visual display(s) been designed to helpdrivers make left merges without collision?
42. How effectively have the crash avoidance warning visual display(s) been designed to assistdrivers in backing without collision?
ND No Yes N/A
ND No Yes N/A
ND No Yes N/A
ND No Yes N/A
ND No Yes N/A
ND No Yes N/A
ND No Yes N/A
ND No Yes N/A
ND No Yes N/A Very Somewhat Very Ineffectively Effectively Effectively major some few changes changes changes needed needed needed
ND 1 2 3 4 5 N/A
Very Somewhat Very Ineffectively Effectively Effectively major some few changes changes changes needed needed needed
ND 1 2 3 4 5 N/A
ND 1 2 3 4 5 N/A
ND 1 2 3 4 5 N/A
ND 1 2 3 4 5 N/A
ND 1 2 3 4 5 N/A

36
Part II. Crash Avoidance Warnings - Auditory Circle the number or word which best describes your response. ND=Not determinable
N/A=Not applicableA. General
1. Is the lowest volume setting at least 60 dBA?
2. Is the highest volume setting not more than 90 dBA?
3. Is the frequency (i.e., tone) of auditory warnings between 500 and 3000 Hz?
4. Are complex tones (vs. pure tones) used for auditory warnings?
5. Are the meanings of the auditory warnings easy for the driver to understand?
6. How many of levels of auditory crash avoidance warnings are used?
ND No Yes N/A
ND No Yes N/A
ND No Yes N/A
ND No Yes N/A
ND No Yes N/A
B. Cautionary Crash Avoidance Warnings - Auditory
7. Are the coding methods (e.g., "beep rate", tonal changes or loudness changes) appropriate forthe type of cautionary crash avoidance warning presented?
8. Do coding methods used for cautionary crash avoidance warning conform to populationstereotypes (e.g., higher pitched or faster beeping) for traffic closer to the vehicle?
9. Can the driver discriminate among the levels of coding used for the cautionary crash avoidancewarnings (e.g., not more than four discrete levels of loudness)?
10. Can the driver discriminate the cautionary crash avoidance warning from other in-vehicleauditory warnings?
11. How effectively have SAE Recommended Practices and human factors design principles beenapplied to the design of cautionary crash avoidance warning auditory displays?
C. Imminent Crash Avoidance Warnings - Auditory
12. Are the coding methods (e.g., "beep rate", tonal or loudness changes) appropriate for the type ofimminent crash avoidance warning presented?
13. Do coding methods used for imminent crash avoidance warnings conform to populationstereotypes (e.g., higher pitched or faster beeping) for traffic closer to the vehicle?
14. Can the driver discriminate the crash avoidance warning from other in-vehicle auditorywarnings?
15. How effectively have SAE Recommended Practices and human factors design principles beenapplied to the design of imminent crash avoidance warning auditory displays?
ND No Yes N/A
ND No Yes N/A
ND No Yes N/A
ND No Yes N/A
Very Somewhat Very Ineffectively Effectively Effectively major some few changes changes changes needed needed needed
ND 1 2 3 4 5 N/A
ND No Yes N/A
ND No Yes N/A
ND No Yes N/A
Very Somewhat Very Ineffectively Effectively Effectively major some few changes changes changes needed needed needed
ND 1 2 3 4 5 N/A

37
Summary for Crash Avoidance Warning Auditory Displays
16. How effectively have the auditory crash avoidance warnings been designed to help drivers makeright lane changes without collision?
17. How effectively have the auditory crash avoidance warning display(s) been designed to helpdrivers make left lane changes without collision?
18. How effectively have the auditory crash avoidance warning display(s) been designed to helpdrivers make right merges without collision?
19. How effectively have the auditory crash avoidance warning display(s) been designed to helpdrivers make left merges without collision?
20. How effectively have the auditory crash avoidance warning display(s) been designed to assistdrivers in backing without collision?
Very Somewhat Very Ineffectively Effectively Effectively major some few changes changes changes needed needed needed
ND 1 2 3 4 5 N/A
ND 1 2 3 4 5 N/A
ND 1 2 3 4 5 N/A
ND 1 2 3 4 5 N/A
ND 1 2 3 4 5 N/A
Part III. Auxiliary Information: System Status Displays
A. System Status - Visual: (e.g., power, display intensity, system failure status, sensor sensitivity)
1. Can the driver discriminate from the display whether the system is on or off (i.e., powered orunpowered)?
2. Does the display present the setting status of driver adjustable parameters (e.g., brightness, volumecontrols, alarm intensity)?
3. Is displayed system status information labeled?
4. Are the status displays discernible in daylight?
5. Are the status displays discernible in darkness?
6. Are the status displays discernible in light from specular glare sources (e.g., street lights, sun)?
7. Are the information coding methods used for system status information (e.g., green for okay)appropriate for the type of information presented (when variable levels exist)?
8. Do the information coding techniques used conform to population stereotypes (e.g., red for amalfunction indicator)?
9. Are appropriate levels of coding used to present system status information to facilitate ease ofdiscrimination among levels?
10. Does the organization of system status information facilitate quick acquisition of informationpresented while driving?
11. Can system status information be sufficiently discriminated from any other visual displays in thedevice?
ND = Not DeterminableN/A = Not Applicable
ND No Yes N/A
ND No Yes N/A
ND No Yes N/A
ND No Yes N/A
ND No Yes N/A
ND No Yes N/A
ND No Yes N/A
ND No Yes N/A
ND No Yes N/A
ND No Yes N/A
ND No Yes N/A

38
B. System Status - Auditory (If relevant.)
12. Is an auditory signal used to present system status information?
13. Are the coding methods (e.g., "beep rate", tonal changes or loudness changes) appropriate forthe type of status information presented?
14. Do coding methods for status auditory warnings conform to population stereotypes?
15. Are multiple levels of coding auditory status information used?
16. Can the driver discriminate among the levels of coding used (e.g., not more than four discretelevels of loudness)?
17. Can the driver discriminate system status information from other in vehicle auditory warnings?
Part IV. Auxiliary Information: Manual ControlsCircle the number or word which best describes your response.
1. Does the driver have an unobstructed view of the controls from the forward driving position?
2. Are all controls labeled?
3. Are controls coded (size, shape, location, activation movement) for discrimination in blindoperation?
4. Are controls separated to prevent accidental activation of controls adjacent to the one intendedby the driver?
5. Does movement of all controls conform to population stereotypes (e.g., upward, right orclockwise movement to produce an increase in the value of a parameter)?
6. Does the use of each control provide visual feedback?
7. Does the use of each control provide tactile feedback? (e.g., detents, position, displacement)
8. Does the use of each control provide auditory feedback (e.g., "clicks" or a volume change)?
9. Are control legends illuminated for viewing under nighttime driving conditions?
10. Are control legends discernible in bright sunlight?
11. Are controls located such that the driver does not have to assume an awkward posture to operatethe controls?
12. Is the appropriate control used for the type of function to be controlled? (e.g., avoiding toggleswitches for volume control)
13. Do the controls provide their setting status on visual or tactile inspection?
ND No Yes N/A
ND No Yes N/A
ND No Yes N/A
ND No Yes N/A
ND No Yes N/A
ND No Yes N/A
ND = Not DeterminableN/A = Not Applicable
ND No Yes N/A
ND No Yes N/A
ND No Yes N/A
ND No Yes N/A
ND No Yes N/A
ND No Yes N/A
ND No Yes N/A
ND No Yes N/A
ND No Yes N/A
ND No Yes N/A
ND No Yes N/A
ND No Yes N/A
ND No Yes N/A

39
Part V. Auxiliary Information: Legends Circle the number or word which best describes your response.
ND= Not DeterminableN/A= Not Applicable
1. Are legends present on the driver/system interface?
2. Does the driver have an unobstructed view of each legend?
3. Are the legends discernible in daylight?
4. Are the legends discernible in darkness?
5. Are all legends discernible in light from specular glare sources (e.g., street lights, sun)?
6. Are legends located in acceptable positions with respect to their associated control or display?
7. Are functional legends easily discriminated from advertising legends?
ND No Yes N/A
ND No Yes N/A
ND No Yes N/A
ND No Yes N/A
ND No Yes N/A
ND No Yes N/A
ND No Yes N/A
Part VI. Auxiliary Information: Documentation For purposes of this section of the evaluation, the term documentation refers to material provided by the device manufacturer that describessystem installation, calibration, operation, use and maintenance. This material could be distributed on a variety of media, including printedmanuals, video tapes, audio tapes or CD ROM.
Type of documentation (circle all that apply): Brochure Audio Tape Manual Video Tape Other _____________
General (Circle the number or word which best describes your response; ND= Not Determinable, N/A= Not Applicable)
1. Does the documentation identify the device as supplemental to normal driver visual sampling ofmirrors, etc.?
2. Does the documentation identify conditions under which system performance is degraded?
3. Does the documentation describe how to operate the system?
4. Does the documentation describe mounting locations for display(s), audible warning devices andcontrols?
5. Does the documentation describe installation procedures?
6. Does the documentation describe calibration procedures?
7. Does the documentation describe maintenance procedures?
8. Does the documentation give "trouble shooting" tips for common problems?
ND No Yes N/A
ND No Yes N/A
ND No Yes N/A
ND No Yes N/A
ND No Yes N/A
ND No Yes N/A
ND No Yes N/A
ND No Yes N/A
Part VII. Overall Summary of Driver Interface
1. Considering the control, display, warning, legend and discrimination issuespresented above, how effectively has this system been designed from a humanfactors perspective?
Very Somewhat Very Ineffectively Effectively Effectively major some few changes changes changes needed needed needed
ND 1 2 3 4 5 N/A

40
SECTION C
OPERATIONAL JUDGEMENTS OF THE COLLISION AVOIDANCE SYSTEM DRIVER/SYSTEM INTERFACE
Name: Test Vehicle:
System: Date: Day / Night ?
Amount of driving experience with this system:
This section is to be completed by one or more human factors experts. It is desirable to have multiple human factors experts completethis section to allow for comparison and consolidation of responses. The test route will contain approximately 45 minutes of each of thefollowing road types: arterial, highway, and rural highway. This route will be driven in the morning, in daylight conditions and not duringrush hour. The same (or an equivalent) route should be driven in darkness.
Instructions for Section C:
- Before beginning this section, the human factors expert should be provided with the manufacturer’s instructions for use of the systemand become familiar with the operation of the system through practice with the device.
- Part I should be completed first (before the human factors expert drives with the system). Part I is to be filled out in the test vehiclewith the engine running.
- After completing Part I, the human factors expert will operate the test vehicle with an operational system installed in the vehicle overa fixed route in traffic and traversing the Columbus, Ohio area and containing approximately equal amounts of time spent on art erial,highway, and rural highway.
- Part II is to be completed after the human factors expert has completed driving with the system over the test route. This section shouldbe completed while the subject is still seated in the test vehicle. This part of section C may be repeated after driving the route undernighttime conditions to collect data on interface effectiveness in a darkened environment.
- Part III consists of a qualitative summary in which the human factors expert records information regarding their experience with thesystem after having just driven with it. This section should be completed while the human factors expert is still in the test vehicle.
- Suggested references and sources of criteria for use in assessing the appropriateness of the driver/system interface features and theoverall effectiveness of this interface include any SAE Recommended Practice. In the event that specific recommendations for someaspect of the interface cannot be found in any SAE recommendation, other sources of human factors design principles, such as ’P reliminaryHuman Factors Guidelines for Crash Avoidance Warning Devices’ (COMSIS, 1993), the ’Human Factors Design Handbook’ (Woodson,1992), the ’Handbook of Human Factors’ (Salvendy, 1987), MIL-STD-1472, or other preferred text, may be used. When referencingspecific texts, the evaluator should give a full reference (including page number) for the information cited.
Note: For the purposes of this document, please note the following definitions:
“Crash Avoidance Warning” (CAW) - refers to any information which a system provides to the driver to help prevent an accident.The type of information this warning consists of is dependent on the category of a particular system. CAWs are dividedinto two categories: 1) cautionary and 2) imminent. CAW information is any information provided by a system whichwarns the driver of a potentially dangerous situation (i.e., obstructing vehicle in an adjacent lane when considering changinglanes, obstructing vehicle to the rear when backing). Imminent CAW information refers to any information which a systemmight provide to warn the driver of an impending collision.
Distract - (v.t.) to draw away or divert, as the mind or attention.
Annoy - (v.t.) to disturb ( a person) in a way that displeases, troubles, or slightly irritates.

41
Part I. Static EvaluationCircle the number or word which best describes your response. ND= Not Determinable
N/A= Not Applicable
1. How clearly does the documentation tell you . .
a. The purpose of the system
b. How to turn on/off the system
c. How to operate and use the system
2. Was there any information regarding the use of the system which you needed, but wasnot included in the documentation?
3. How discernible is the crash avoidance warning display?
4. How effective is the ’system test’ feature for understanding the status of:
a. The crash avoidance warning visual displays?
b. The auditory crash avoidance warnings?
5. How easy to understand are the meanings of
a. The system status information visual displays?
b. The system status auditory displays?
c. The cautionary crash avoidance warning visual displays?
d. The imminent crash avoidance warning visual displays?
e. The cautionary crash avoidance warning auditory displays?
f. The imminent crash avoidance warning auditory displays?
Not At All Very Clear Clear
ND 1 2 3 4 5 N/A
ND 1 2 3 4 5 N/A
ND 1 2 3 4 5 N/A
Not At All Very ReadableReadable
ND 1 2 3 4 5 N/A
Very Very Ineffective Effective
ND 1 2 3 4 5 N/A
ND 1 2 3 4 5 N/A
Very Very Difficult Easy
ND 1 2 3 4 5 N/A
ND 1 2 3 4 5 N/A
ND 1 2 3 4 5 N/A
ND 1 2 3 4 5 N/A
ND 1 2 3 4 5 N/A
ND 1 2 3 4 5 N/A
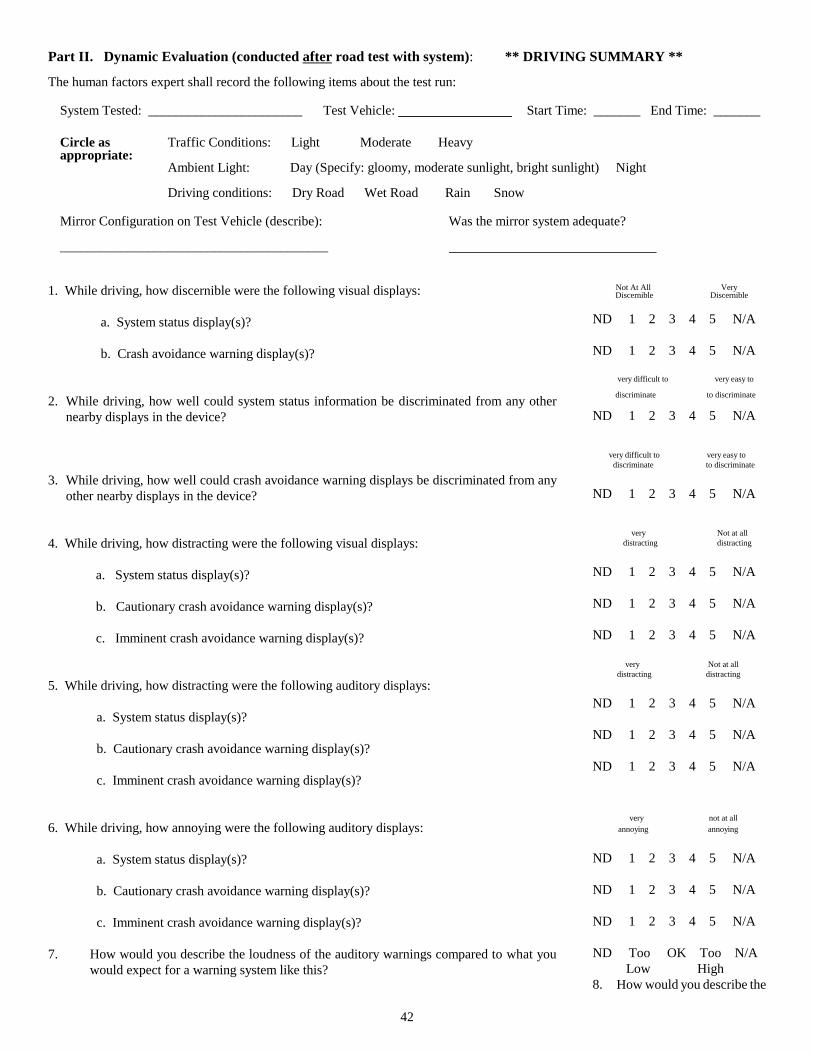
42
Part II. Dynamic Evaluation (conducted after road test with system): ** DRIVING SUMMARY **
The human factors expert shall record the following items about the test run:
System Tested: _______________________ Test Vehicle: Start Time: _______ End Time: _______
Circle as Traffic Conditions: Light Moderate Heavyappropriate:
Ambient Light: Day (Specify: gloomy, moderate sunlight, bright sunlight) Night
Driving conditions: Dry Road Wet Road Rain Snow
Mirror Configuration on Test Vehicle (describe): Was the mirror system adequate?
________________________________________
1. While driving, how discernible were the following visual displays:
a. System status display(s)?
b. Crash avoidance warning display(s)?
2. While driving, how well could system status information be discriminated from any othernearby displays in the device?
3. While driving, how well could crash avoidance warning displays be discriminated from anyother nearby displays in the device?
4. While driving, how distracting were the following visual displays:
a. System status display(s)?
b. Cautionary crash avoidance warning display(s)?
c. Imminent crash avoidance warning display(s)?
5. While driving, how distracting were the following auditory displays:
a. System status display(s)?
b. Cautionary crash avoidance warning display(s)?
c. Imminent crash avoidance warning display(s)?
6. While driving, how annoying were the following auditory displays:
a. System status display(s)?
b. Cautionary crash avoidance warning display(s)?
c. Imminent crash avoidance warning display(s)?
7. How would you describe the loudness of the auditory warnings compared to what youwould expect for a warning system like this?
Not At All Very Discernible Discernible
ND 1 2 3 4 5 N/A
ND 1 2 3 4 5 N/A
very difficult to very easy to
discriminate to discriminate
ND 1 2 3 4 5 N/A
very difficult to very easy to discriminate to discriminate
ND 1 2 3 4 5 N/A
very Not at all distracting distracting
ND 1 2 3 4 5 N/A
ND 1 2 3 4 5 N/A
ND 1 2 3 4 5 N/A
very Not at all distracting distracting
ND 1 2 3 4 5 N/A
ND 1 2 3 4 5 N/A
ND 1 2 3 4 5 N/A
very not at all annoying annoying
ND 1 2 3 4 5 N/A
ND 1 2 3 4 5 N/A
ND 1 2 3 4 5 N/A
ND Too OK Too N/A Low High8. How would you describe the

43
pitch (tone) of the auditory warnings compared to what you would expect for a warningsystem like this?
9. How effective was the visual crash avoidance warning presentation in helping you to make...a. right lane changes (for right side systems)?
b. left lane changes (for left side systems)?
10. How effective was the visual crash avoidance warning presentation in helping you to merge...a. to the right (for right side systems)?
b. to the left (for left side systems)?
11. How effective was the visual crash avoidance warning presentation in helping you performbacking maneuvers (for backing systems)?
12. How effective was the auditory crash avoidance warning presentation in helping you performbacking maneuvers (for backing systems)?
13. How effective was the auditory crash avoidance warning in helping you to make...a. right lane changes (for right side systems)?
b. left lane changes (for left side systems)?
14. How effective was the auditory crash avoidance warning presentation in helping you tomerge...
a. to the right (for right systems)?
b. to the left (for left side systems)?
15. Did you use the (side) crash avoidance warning information presented by the systemto make a decision about a lane change?
About what percent of all lane changes?
16. Did you use the crash avoidance warning information presented by the system to makea decision about merging (for side systems)? About what percent of all merges?
17. Did you use the crash avoidance warning information presented by the system to makea decision about a backing maneuver (for backing systems)?
About what percent of all backing maneuvers?
18. Before you made a lane change or merging maneuver, did the crash avoidance warninginformation presented by the system cause you to use your mirrors more, less or about thesame as you normally do?
a. Left side mirror (for left side systems)
b. Right side mirror (for right side systems)
c. Rear view mirror (for rear systems)
ND Too OK Too N/A Low High
Not At All Very Effective Effective
ND 1 2 3 4 5 N/A
ND 1 2 3 4 5 N/A
Not At All Very Effective Effective
ND 1 2 3 4 5 N/A
ND 1 2 3 4 5 N/A
Not At All Very Effective Effective
ND 1 2 3 4 5 N/A
Not At All Very Effective Effective
ND 1 2 3 4 5 N/A
Not At All Very Effective Effective
ND 1 2 3 4 5 N/A
ND 1 2 3 4 5 N/A
Not At All Very Effective Effective
ND 1 2 3 4 5 N/A
ND 1 2 3 4 5 N/A
ND No Yes N/A
N/A
ND No Yes N/A
N/A
ND No Yes N/A
N/A
ND Less Same More N/A
ND Less Same More N/A
ND Less Same More N/A

44
19. When changing lanes or merging, did the crash avoidance warning information presentedby the system cause you to look out the side windows more, less or about the same as younormally do?
a. Left side (for left side systems)
b. Right side (for right side systems)
20. Before you made a backing maneuver, did the rear crash avoidance warning informationpresented by the system cause you to use your mirrors more, less or about the same as younormally do?
a. Left side mirror
b. Right side mirror
c. Rear view mirror
21. When backing, did the rear crash avoidance warning information presented by the systemcause you to look out the windows more, less or about the same as you normally do?
a. Left side window
b. Right side window
ND Less Same More N/A
ND Less Same More N/A
ND Less Same More N/A
ND Less Same More N/A
ND Less Same More N/A
ND Less Same More N/A
ND Less Same More N/A Part III. Qualitative Driving Summary
1. How much time and effort did it take to get used to the system and become familiar with the operation of its interface?
2. What problems, if any, did you have in using the system interface? [List]
3. Of the problems identified above, which ones were the biggest problems for you and why?
4. Was the crash avoidance information presented by the system sufficiently noticeable when driving?
5. Was the crash avoidance information presented by the system easy to understand and useful?
6. Was the format in which the crash avoidance information was presented appropriate?
7. Did you experience any problems with glare (during the day due to sun, or at night) or other factor which hindered your perceptionof information presented by the system?
8. To what extent did you make (or almost make) an error of judgement when using the system? Explain.
9. To what extent was the presence of the system (driver/system interface) a distraction while driving (What aspects of the driver/systeminterface were distracting)? Why?
10. Did you find any part of the driver/system interface to be annoying while driving? What was annoying and why?
11. Did you visually sample the display when not making a lane change (for lane change/merge systems)?
12. Overall, how effectively has this system’s interface been designed to help drivers make lane changes? Merges? Backing maneuvers?
13. If you could talk to the engineer who designed this system, what changes would you recommend to improve the driver/systeminterface?
14. If you could talk to the engineer who designed this system, what changes would you recommend to improve the overall operationof the system?
15. Would you be willing to buy this system (as tested) for your vehicle (car, truck)? Why or why not?