Embed Size (px)
Citation preview

PowerMARQ™ Database
PowerMARQ Benchmarking ProgramExcerpt of Comprehensive Benchmarks Report
Human Resources Source, Recruit & Select Employees
THIS SAMPLE REPORT CONTAINS MOCK DATA CREATED FOR ILLUSTRATION ONLY
© Copyright The American Productivity and Quality Center 2004. All rights reserved.
This material is a sample excerpt of a PowerMARQ benchmarking report. The actual report will contain real data and have more detail specific to metrics and business drivers for this area.
PowerMARQ BenchmarkingExcerpt of Comprehensive Benchmarks Report
Contents
Introduction. . . . . .. . . . . . . . . . . . . . . . . . . . . . . . . . . . . . . 3Processes and Activities Profiles. . . . . . . . . . . . . . . . . . . . 4Participant Industry Profile. . . . . . . . . . . . . . . . . . . . . . . . . 5Participant Geographic Profile. . . . . . . . . . . . . . . . . . . . . . 6Participant Function Peer Groups. . . . . . . . . . . . . . . . . . . 7Key Terms. . . . . . . . . . . . . . . . . . . . . . . . . . . . . . . . . . . . . 8Potential Savings Example. . . . . . . . . . . . . . . . . . . . . . . . 10Performance Measures. . . . . . . . . . . . . . . . . . . . . . . . . . . 11Business Drivers. . . . . . . . . . . . . . . . . . . . . . . . . . . . . . . . 18Key Success Factors and Findings. . . . . . . . . . . . . . . . . . 21Appendix: Metrics Data Table. . . . . . . . . . . . . . . . . . . . . . 22
6/25/2004 Page 2 © APQC 2004

PowerMARQ BenchmarkingExcerpt of Comprehensive Benchmarks Report
Introduction
Overview
MOCK DATA CREATED FOR ILLUSTRATION ONLY
Supply chain participant profile:Total business sites: 7,244Total countries represented: 46Average revenue per financial business sitein millions of USD: $7,292
PowerMARQ™, APQC’s performance metrics database, provides commonly used measures and individual benchmarks your organization can use to assess the effectiveness of your organization’s core operational functions.
This report gives your organization an opportunity to achieve the following:- measure operational performance of your organization relative to external peer groups,- identify performance gaps and evaluate improvement opportunities,- establish performance targets using external benchmarks,- identify key business practices drivers that influence performance, and- assess operational progress of your organization over time relative to itself and external benchmarks.
This benchmarks report is a deliverable of the APQC PowerMARQ benchmarking program. Data gathered from participants is used to generate all measures provided in this report. The accuracy of this benchmarks report is dependent on the quality and accuracy of the data provided by your business site and by other participants.
6/25/2004 Page 3 © APQC 2004

PowerMARQ BenchmarkingExcerpt of Comprehensive Benchmarks Report
Processes and Activities Profiles
Procurement processes and activities included in this report follow.
6/25/2004 Page 4 © APQC 2004
PowerMARQ BenchmarkingExcerpt of Comprehensive Benchmarks Report
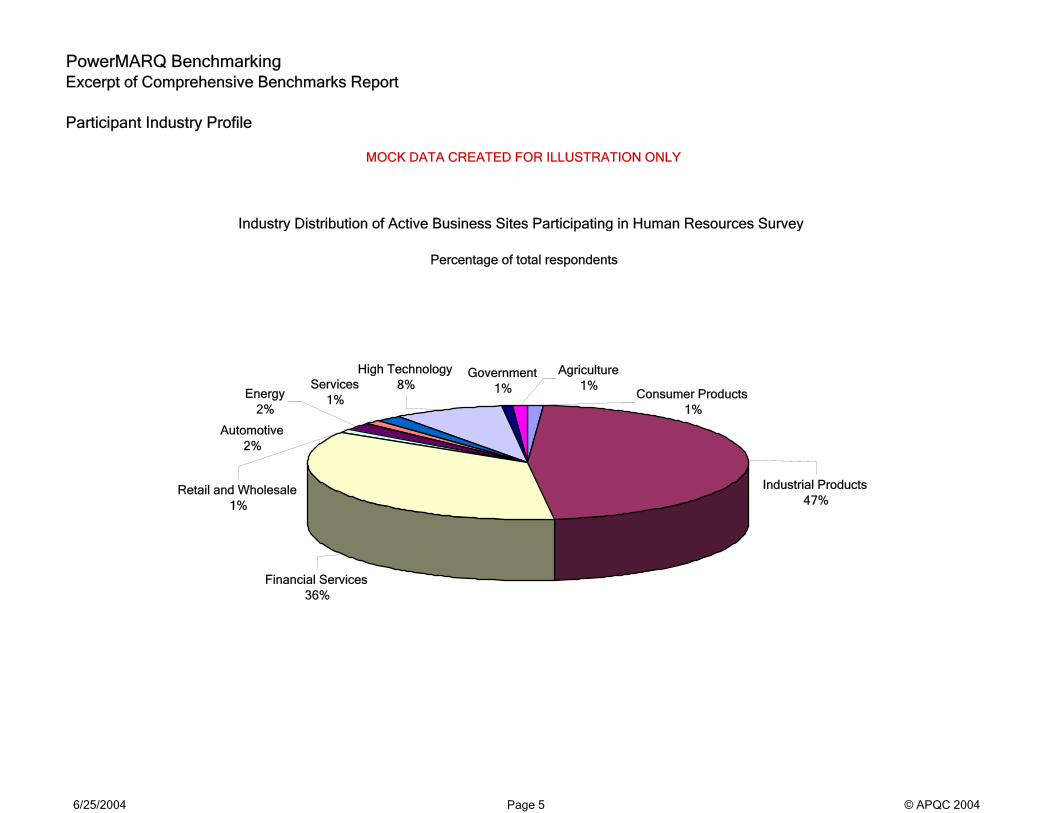
Participant Industry Profile
MOCK DATA CREATED FOR ILLUSTRATION ONLY
Industry Distribution of Active Business Sites Participating in Human Resources Survey
Percentage of total respondents
Financial Services36%
Industrial Products47%
Consumer Products1%
Agriculture1%
Retail and Wholesale1%
Automotive2%
High Technology8%Services
1%Energy2%
Government1%
6/25/2004 Page 5 © APQC 2004

PowerMARQ BenchmarkingExcerpt of Comprehensive Benchmarks Report
Participant Geographic Profile
MOCK DATA CREATED FOR ILLUSTRATION ONLY
Geographic Distribution of Business Sites Participating in Human Resources Surveys
Percentage of total respondents
Europe21%
Central and South America8%
The United Kingdom12%
Africa and the Middle East15%
United States and Canada25%
Asia Pacific and Region19%
6/25/2004 Page 6 © APQC 2004

PowerMARQ BenchmarkingExcerpt of Comprehensive Benchmarks Report
Participant Function Peer Groups
MOCK DATA CREATED FOR ILLUSTRATION ONLY
Functional Distribution of Active Business Sites Participating in Human Resources Surveys
Percentage of total respondents
Manufacturing / Operating Unit95%
World Headquarters2%
Corporate Headquarters2%
Shared Services Center1%
6/25/2004 Page 7 © APQC 2004

PowerMARQ BenchmarkingExcerpt of Comprehensive Benchmarks Report
Key Terms
Benchmark target:The value of a performance measure in the 80th percentile of the distribution.
Distribution:The distribution includes all relevant business sites which have a value for a particular performance measure. The distribution is arranged in ascending or descending order depending on the best possible value. The graphs of the distributions have been arranged such that the benchmark target always appears on the right side of the graphic.
Histogram:A graphic representation of a frequency distribution in which the horizontal axis is determined by the span of values calculated for performance measures and the vertical axis is determined by the frequency that the value occurs (i.e., the number of business sites with similar values).
Median:The value at the middle of a distribution. Typical half of the sites for that measure have a value greater than the median, and half have a value lower than the median.
Percentile:A measure of relative standing describing the percentage of business sites below a specific value within the distribution. For example, a site score in the 65th percentile would indicate that only 35 percent of the sites in the distribution scored better than the site.
Performance measure: Also see page 9 and 10A measure of performance based on analysis of standardized data collected from business sites using the PowerMARQ surveys. For example, a performance measure on the personnel cost of the source, recruit, and select process is computed by taking the total personnel cost of full-time equivalent employees performing that process, divided by revenue. The higher the cost per revenue amount, the less proficient the process.
6/25/2004 Page 8 © APQC 2004

PowerMARQ BenchmarkingExcerpt of Comprehensive Benchmarks Report
Key Terms
Summary of Performance Measures:The Summary of Performance Measures contains several pages of tabular information defining each performance measure. The key pieces of information are:
· Your Site's Score: This represents your performance. When compared to your company's median, the all companie Median, and the benchmark target 80th percentile, it provides information about potential performance gaps.
· Your sites percentile: The higher the percentile, the better your business site performed on this measure relative to all companies in the study.
· Your company median: The median performance level for all of the sites within your company. If there is only one company site, then the company median score will be the same as the sites score.
All Companies Median: the median performance level for all the sites in the database.
Top Performers:The benchmark level that reflects the 20th or 80th percentile. The benchmark shows the threshold for the top 20 percent of participants within the comparator group.
Business Drivers:Business drivers are enablers of performance improvement. For example, the number of new employees annually as a percentage of average headcount is a performance metric that can be affected by the business driver which is the average number of employees employeed.
6/25/2004 Page 9 © APQC 2004

PowerMARQ BenchmarkingExcerpt of Comprehensive Benchmarks Report
POTENTIAL SAVINGS EXAMPLE
MOCK DATA CREATED FOR ILLUSTRATION ONLY
Using This Report
Cost of SRS x Number of new hires = Your total cost to hire new employees30 $600,000
Reduce from $20,000 to top performer level of $7,500
Cost of SRS x Number of new hires = Total cost if top benchmark is achieved30 $225,000
Potential annual savings = $375,000
$20,000
$7,500
This benchmarks report can be used to determine gaps between your business site and the benchmark performance measure. The example below demonstrates how shareholder value can be impacted by improving the performance in one process area to the benchmark target level.
6/25/2004 Page 10 © APQC 2004

PowerMARQ BenchmarkingExcerpt of Comprehensive Benchmarks Report
PERFORMANCE MEASURES
MOCK DATA CREATED FOR ILLUSTRATION ONLY
Performance Measures Peer GroupsYour Score Your Percentile
Cost of SRS (USD) per <$1000> revenue $20,000 43rd
*Total number of recruits reflects cost of recruiting
A cost measure comprising total new hire cost (6.226a-e) divided by $1000 of revenue annually by your site (6.22a).
Primary Focus: Human Resources
$13,950$20,000
$7,250
Your Site Median Top Performers
All Participants
$7,500
$20,000
$14,500
$0
$5,000
$10,000
$15,000
$20,000
$25,000
Your Site Median Top Performers
Co
st
Major Industry: Industrial Products
$15,000$20,000
$7,500
Your Site Median Top Performers
5.5
Region: U.S. and Canada
$14,000$20,000
$7,500
Your Site Median Top Performers
Total Number of Recruits*:Up to 500
$14,500$20,000
$7,000
Your Site Median Top Performers
The Top Performers benchmark reflects the 20th percentile.
6/25/2004 Page 11 © APQC 2004

PowerMARQ BenchmarkingExcerpt of Comprehensive Benchmarks Report
MOCK DATA CREATED FOR ILLUSTRATION ONLY
Performance Measures Peer GroupsYour Score Your Percentile
90 80th
* Time to job requisition reflects a 18 month business cycle.
A cycle time measure comprising total time from identifying a staffing need divided by time to job requisition (6.257a).
Cycle Time in days from identification of need to hire to approval of job requisition
Primary Focus: Human Resources
6790
28
Your Site Median Top Performers
All Participants
7590
30
0
10
20
30
40
50
60
70
80
90
100
Your Site Median Top Performers
Nu
mb
er
of
Da
ys t
o J
ob
Re
qu
isiti
on
Major Industry: Industrial Products
7590
30
Your Site Median Top Performers
Region: U.S. and Canada
7890
25
Your Site Median Top Performers
Time to Job Requisition in Months: 18 months
7590
28
Your Site Median Top Performers
The Top Performers benchmark reflects the 20th percentile.
6/25/2004 Page 12 © APQC 2004

PowerMARQ BenchmarkingExcerpt of Comprehensive Benchmarks Report
MOCK DATA CREATED FOR ILLUSTRATION ONLY
Performance Measures Peer GroupsYour Score Your Percentile
100 80th
*Number of employees reflects a 18 month business cycle.
Number of employees per "Recruit, source, and select" FTE
A staff productivity measure comprising the total number of employees (2.213a) divided by the number of "recruit, source, and select" FTEs (6.227a-c).
Primary Focus: Human Resources
80100161
Your Site Median Top Performers
All Participants
82100
160
0
20
40
60
80
100
120
140
160
180
Your Site Median Top Performers
Nu
mb
er
of
FT
Es
Major Industry: Industrial Products
82100160
Your Site Median Top Performers
Region: U.S. and Canada
81100165
Your Site Median Top Performers
Number of Employees in Months: 18 months
85100162
Your Site Median Top Performers
The Top Performers benchmark reflects the 20th percentile.
6/25/2004 Page 13 © APQC 2004

PowerMARQ BenchmarkingExcerpt of Comprehensive Benchmarks Report
MOCK DATA CREATED FOR ILLUSTRATION ONLY
Performance Measures Peer GroupsYour Score Your Percentile
25% 43rd
* Transaction volume reflects purchase orders processed.
A process efficiency measure comprising the number of job offers accepted as a percentage of job offers made. (6.256d-f)
Percentage of job offers accepted for operational workers/office staff
Primary Focus: Human Resources
31%24%50%
Your Site Median Top Performers
All Participants
50%
25%30%
0%
10%
20%
30%
40%
50%
60%
Your Site Median Top Performers
Major Industry: Industrial Products
51%
25% 32%
Your Site Median Top Performers
Region: U.S. and Canada
32%26%51%
Your Site Median Top Performers
Number of Job Offers Made: Up To 200
30%26%
52%
Your Site Median Top Performers
The Top Performers benchmark reflects the 80th percentile.
6/25/2004 Page 14 © APQC 2004

PowerMARQ BenchmarkingExcerpt of Comprehensive Benchmarks Report
6.221 Which service delivery model(s) have been implemented by your site?
MOCK DATA CREATED FOR ILLUSTRATION ONLY
Percentage of total respondents
Corporate HR / Professional Support Unit
16%
Other / None2%
Outsourcing21%
Shared Servce Center61%
6/25/2004 Page 15 © APQC 2004

PowerMARQ BenchmarkingExcerpt of Comprehensive Benchmarks Report
6.222 Which of the following best describes the current structure of your organization?
MOCK DATA CREATED FOR ILLUSTRATION ONLY
Percentage of total respondents
Completely centralized40%
Mix of decentralized and centralized structure
16%
Moving towards a centralized structure
9%
Moving towards a decentralized structure
15%
Completely decentralized20%
6/25/2004 Page 16 © APQC 2004

PowerMARQ BenchmarkingExcerpt of Comprehensive Benchmarks Report
6.234 Which, if any, self service models have been implemented by your site?
MOCK DATA CREATED FOR ILLUSTRATION ONLY
Percentage of total respondents
No Self-service model implemented
14%
Sporadically/Issue-Based Reviews
35%
Focused on Price33%
6/25/2004 Page 17 © APQC 2004

PowerMARQ BenchmarkingExcerpt of Comprehensive Benchmarks ReportBusiness Drivers
MOCK DATA CREATED FOR ILLUSTRATION ONLY
6.258 Which of the following measures do you use for evaluating your recruitment and selection process?
Your site: Cycle time
All Participants
3.5%
20.0%
15.0%
19.0%
12.0%11.0%
10.0%
5.0%
0.0%
5.0%
10.0%
15.0%
20.0%
25.0%
Quality of newhires
Candidates bysource
Cycle time Voluntaryturnover of new
hires
Onlineapplication rate
Number ofcanadidates per
position
Cost per hire Other
6/25/2004 Page 18 © APQC 2004
PowerMARQ BenchmarkingExcerpt of Comprehensive Benchmarks Report
MOCK DATA CREATED FOR ILLUSTRATION ONLY
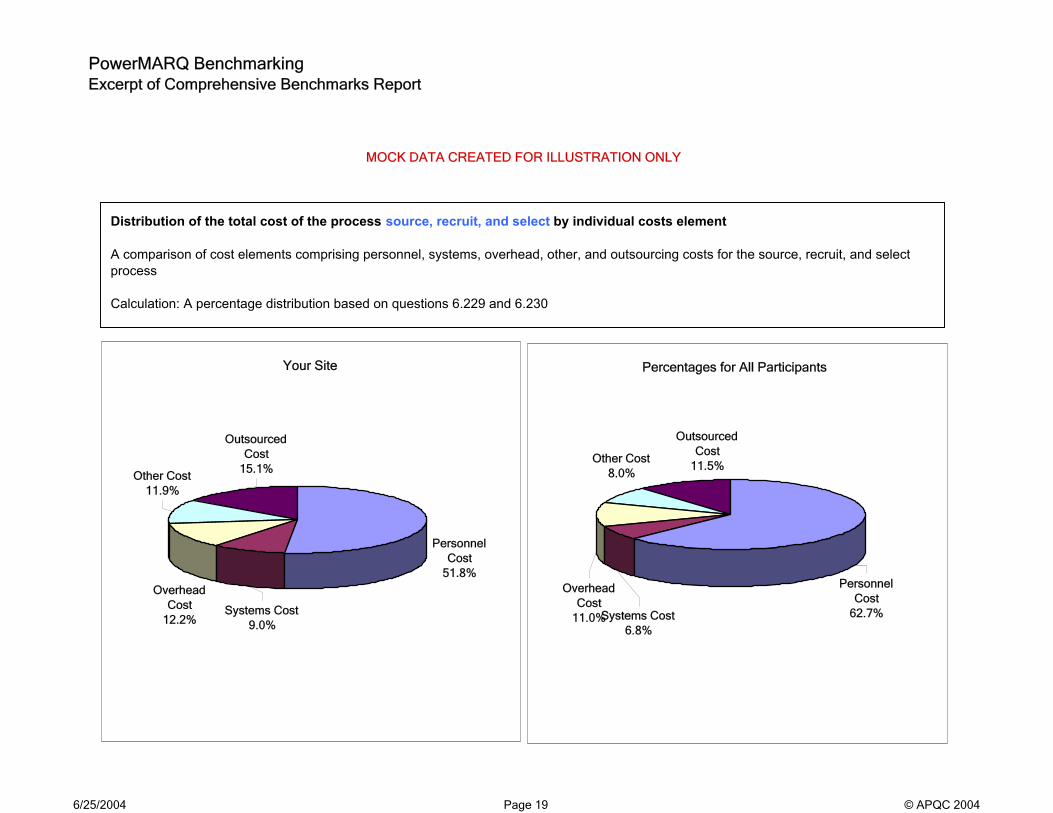
Your Site
Personnel Cost
51.8%
Overhead Cost
12.2%Systems Cost
9.0%
Other Cost11.9%
Outsourced Cost
15.1%
Percentages for All Participants
Personnel Cost
62.7%
Outsourced Cost
11.5%Other Cost
8.0%
Systems Cost6.8%
Overhead Cost
11.0%
Distribution of the total cost of the process source, recruit, and select by individual costs element
A comparison of cost elements comprising personnel, systems, overhead, other, and outsourcing costs for the source, recruit, and select process
Calculation: A percentage distribution based on questions 6.229 and 6.230
6/25/2004 Page 19 © APQC 2004

PowerMARQ BenchmarkingExcerpt of Comprehensive Benchmarks Report
MOCK DATA CREATED FOR ILLUSTRATION ONLY
Percent of total respondents
Your Site
Senior Management /
Executive20%
Office Staff30%
Middle Management /
Specialists50%
All Participants
Senior Management /
Executive25%
Middle Management/
Specialists50%
Office Staff25%
Distribution of the full time equivalents (FTEs) by employee
A comparison of full-time equivalent requirements for the processes: senior management / executive (6.227a), middle management (6.227b), office staff (6.227c)
Calculation: A percentage distribution based on question 6.227
6/25/2004 Page 20 © APQC 2004

PowerMARQ BenchmarkingExcerpt of Comprehensive Benchmarks Report
Key Success Factors and Findings
Reported Key Success Findings
Key Performance IndicatorsTotal cost of "source, recruit, and select per <$1,000> revenue $7,500 $20,000 $14,500 $28,000Number of accepted job offers as a percentage of job offers made 50.0% 25.0% 30.0% 20.0%Cycle time in days from identification of need to hire to approval of job requisition 30 90 75 110Number of employees per "source, recruit, and select" FTE 100 160 82 70
Other/NoneAll Participants
Shared Service Center
Outsourcing Corporate HR/Professional
Support Unit
MOCK DATA CREATED FOR ILLUSTRATION ONLY
Which service delivery model(s) have been implemented by your site?
Cited Key Success FactorsPeople A list of people success factors as cited by all participants will be listed here.
Process A list of process success factors as cited by all participants will be listed here.
TechnologyA list of technology success factors as cited by all participants will be listed here.
6/25/2004 Page 21 © APQC 2004

PowerMARQ BenchmarkingExcerpt of Comprehensive Benchmarks Report
Appendix: Metrics Data Table
Cost EffectivenessTotal costs of the process "Source, recruit and select" per <$1,000> revenueTotal costs of the process "Source, recruit and select" per employeeTotal internal personnel costs of the process "Source, recruit and select" per <$1,000> revenueTotal internal personnel costs of the process "Source, recruit and select" per employeeTotal costs of the process "Source, recruit and select" per new hireTotal internal systems costs of the process "Source, recruit and select" per <$1,000> revenue
Staff Productivity
Number of employees per "Source, recruit and select" FTENumber of FTEs for the process "Source, recruit and select" per <$1 billion> revenueNumber of new employees annually as a percentage of average headcount
Process Efficiency
Number of accepted job offers for senior management/executives as a percentage of job offers made for senior management/executivesNumber of accepted job offers for middle management/specialists as a percentage of job offers made for middle management/specialistsNumber of accepted job offers for operational workers/office staff as a percentage of job offers made for operational workers/office staffNumber of vacancies per site filled by internal candidates during the last calendar year for senior management/executivesNumber of vacancies per site filled by internal candidates during the last calendar year for middle management/specialistsNumber of vacancies per site filled by internal candidates during the last calendar year for operational workers/office staff
Cycle Time
Cycle time in days from identifying the need to hire a new employee to approval of the job requisitionCycle time in days from identification of need to hire to approval of job requisitionCycle time in days from job acceptance to beginning of new hire in agreed positionCycle time in days from transfer request to transfer completion
The following measures will be reported for your organization and all participants. Your organization's results will be compared to the median, 20th and 80th percentiles for the entire database. Your organization will receive a percentile ranking for each metric.
6/25/2004 Page 22 © APQC 2004