Embed Size (px)
Citation preview
Human source of contaminationMan-made particulate emissions
In the discussion on the topic of „Human source of contamination“, the following question is generally at the centre of attention: „How many particles does a human emit on average per minute?This question is of course supplemented by the particle sizes of interest in each case. In addition, this question must be supplemented with regard to the intensity of human movement, because it is easy to understand that a person standing still probably emits considerably fewer particles than a person who moves around a lot.
Carsten Moschner
On the subject of „germ contamina-tion“ released by humans, there are quite precise statements in various sources. On the subject of „How
many particles does a person generate under which conditions?“, however, very few state-ments can be found in the specialist literature and these appear – on closer inspection – to be very vague. In this context, information from P. R. Austin is often used, which was
determined around 1970 [1]. Unfortunately there are no recent studies on this topic. Nor to the also very interesting question „How do the particle numbers of an employee behave when he wears only a lab coat, for example, compared to when he wears an coverall?“
Dastex has taken this as an opportunity to carry out a major study on the subject over an extended period of time.
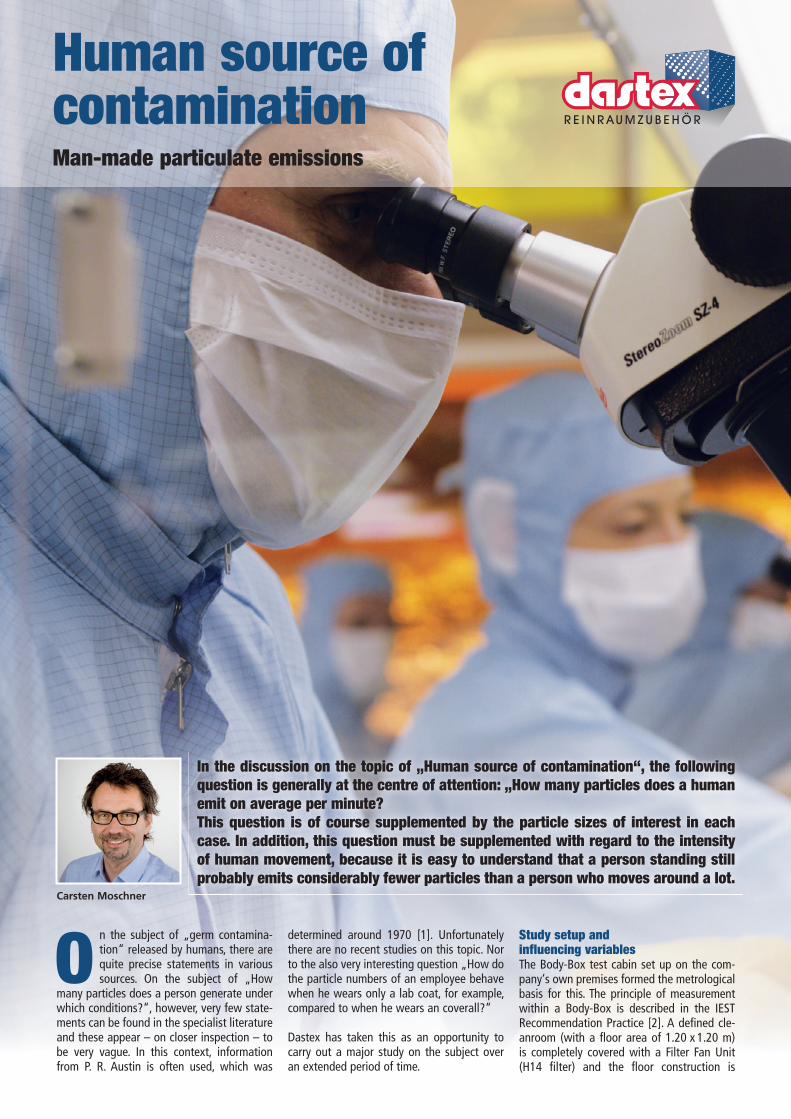
Study setup and influencing variablesThe Body-Box test cabin set up on the com-pany‘s own premises formed the metrological basis for this. The principle of measurement within a Body-Box is described in the IEST Recommendation Practice [2]. A defined cle-anroom (with a floor area of 1.20 x 1.20 m) is completely covered with a Filter Fan Unit (H14 filter) and the floor construction is
designed so that the air can be fed into the return air ventiduct with as little turbulence as possible. In the Body-Box itself there are constant conditions in terms of temperature and humidity and in relation to the air speed (air exchange) set for the respective series of measurements and the cleanliness level when in idle mode (= without the test person being in the Body-Box). When the air treat-ment is running, the air cleanliness class ISO 4 (according to ISO 14644-1) can be maintai-ned without any problems in the Body-Box when idling. If a person enters the Body-Box, almost all the measured particles are therefore deri-ving from this person and his/her clothing. Measurements in the return air ventiduct are carried out on defined measuring points and it must be taken into account that the sample volume flow must of course be set in the
correct ratio to the total volume flow. Much more clean air is supplied to the test cabin via the FFU than can be extracted again via the measuring probes placed in the return air ventiduct. This results in a multiplication factor of the measured values as a function of the air flow set in each case.
In addition, a large number of other factors must be taken into account in such measu-rements. It is easy to understand that people do not emit an even number of particles over the course of the day. Even the private „street clothes“ worn can vary greatly in their particle emission. The intensity of movement during the study has a corresponding influen-ce, etc. For comparative studies it is therefore essential to keep as many of these influencing factors as possible constant or to define them accordingly in advance. Due to our experience
of several years with this test cabin, we were able to narrow down the most important of these influencing factors accordingly. In the following, the different test series are presen-ted in more detail.
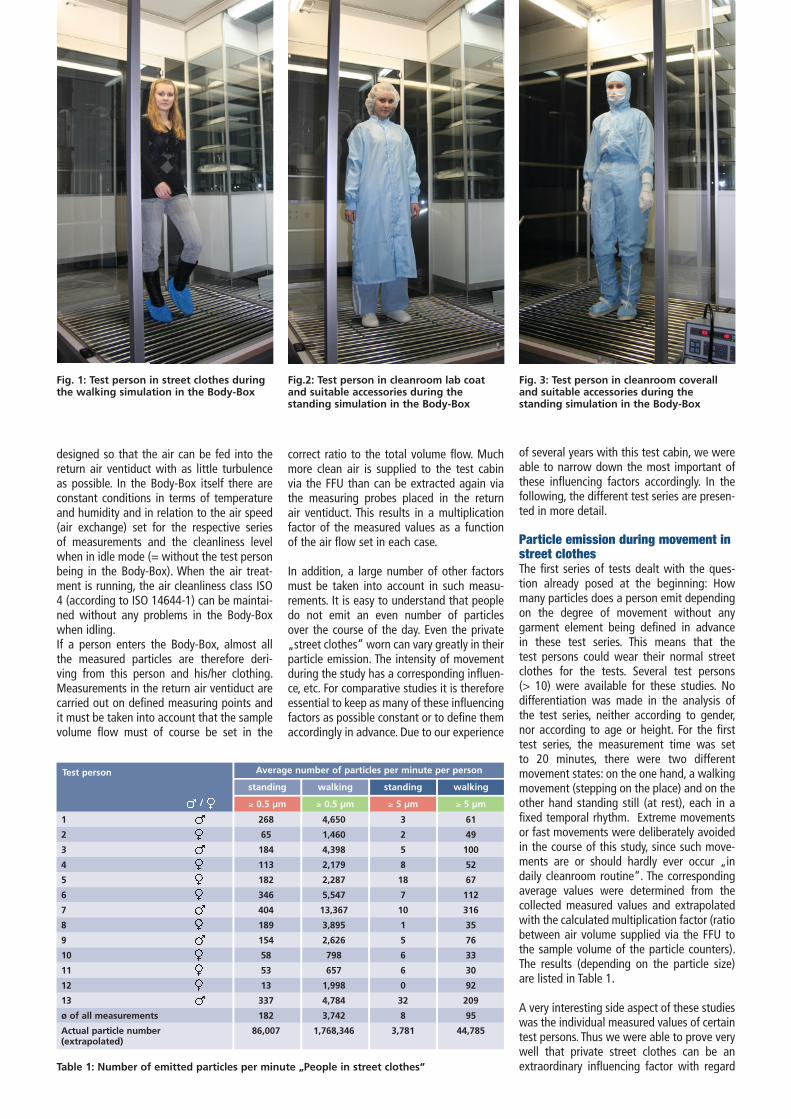
Particle emission during movement in street clothesThe first series of tests dealt with the ques-tion already posed at the beginning: How many particles does a person emit depending on the degree of movement without any garment element being defined in advance in these test series. This means that the test persons could wear their normal street clothes for the tests. Several test persons (> 10) were available for these studies. No differentiation was made in the analysis of the test series, neither according to gender, nor according to age or height. For the first test series, the measurement time was set to 20 minutes, there were two different movement states: on the one hand, a walking movement (stepping on the place) and on the other hand standing still (at rest), each in a fixed temporal rhythm. Extreme movements or fast movements were deliberately avoided in the course of this study, since such move-ments are or should hardly ever occur „in daily clean room routine“. The corresponding average values were determined from the collected measured values and extrapolated with the calculated multiplication factor (ratio between air volume supplied via the FFU to the sample volume of the particle counters). The results (depending on the particle size) are listed in Table 1.
A very interesting side aspect of these studies was the individual measured values of certain test persons. Thus we were able to prove very well that private street clothes can be an extraordinary influencing factor with regard
Fig. 1: Test person in street clothes during the walking simulation in the Body-Box
Test person Average number of particles per minute per person
standing
≥ 0.5 µm
walking
≥ 0.5 µm
standing
≥ 5 µm
walking
≥ 5 µm
1 268 4,650 3 61
2 65 1,460 2 49
3 184 4,398 5 100
4 113 2,179 8 52
5 182 2,287 18 67
6 346 5,547 7 112
7 404 13,367 10 316
8 189 3,895 1 35
9 154 2,626 5 76
10 58 798 6 33
11 53 657 6 30
12 13 1,998 0 92
13 337 4,784 32 209
ø of all measurements 182 3,742 8 95
Actual particle number 86,007 1,768,346 3,781 44,785(extrapolated)
Fig.2: Test person in cleanroom lab coat and suitable accessories during the standing simulation in the Body-Box
Fig. 3: Test person in cleanroom coverall and suitable accessories during the standing simulation in the Body-Box
Table 1: Number of emitted particles per minute „People in street clothes“
/
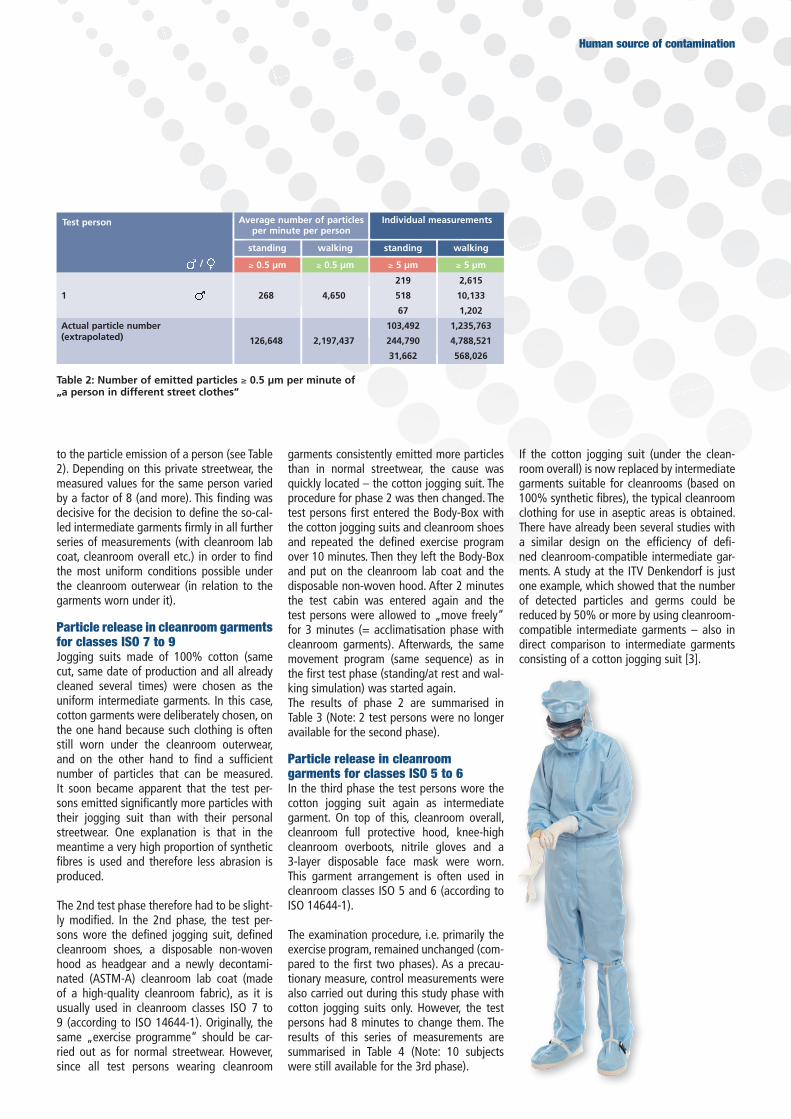
to the particle emission of a person (see Table 2). Depending on this private streetwear, the measured values for the same person varied by a factor of 8 (and more). This finding was decisive for the decision to define the so-cal-led intermediate garments firmly in all further series of measurements (with cleanroom lab coat, cleanroom overall etc.) in order to find the most uniform conditions possible under the cleanroom outerwear (in relation to the garments worn under it).
Particle release in cleanroom garments for classes ISO 7 to 9Jogging suits made of 100% cotton (same cut, same date of production and all already cleaned several times) were chosen as the uniform intermediate garments. In this case, cotton garments were deliberately chosen, on the one hand because such clothing is often still worn under the cleanroom outerwear, and on the other hand to find a sufficient number of particles that can be measured. It soon became apparent that the test per-sons emitted significantly more particles with their jogging suit than with their personal streetwear. One explanation is that in the meantime a very high proportion of synthetic fibres is used and therefore less abrasion is produced.
The 2nd test phase therefore had to be slight-ly modified. In the 2nd phase, the test per-sons wore the defined jogging suit, defined cleanroom shoes, a disposable non-woven hood as headgear and a newly decontami-nated (ASTM-A) cleanroom lab coat (made of a high-quality cleanroom fabric), as it is usually used in cleanroom classes ISO 7 to 9 (according to ISO 14644-1). Originally, the same „exercise programme“ should be car-ried out as for normal streetwear. However, since all test persons wearing cleanroom
Human source of contamination
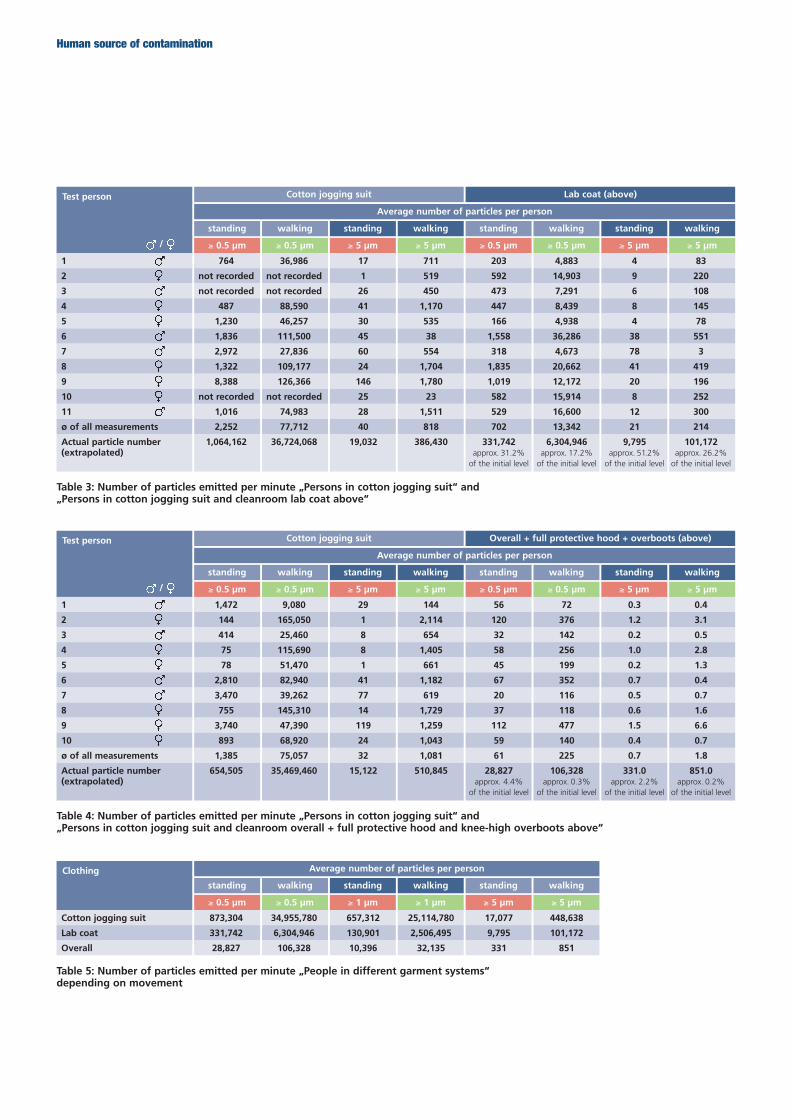
garments consistently emitted more particles than in normal streetwear, the cause was quickly located – the cotton jogging suit. The procedure for phase 2 was then changed. The test persons first entered the Body-Box with the cotton jogging suits and cleanroom shoes and repeated the defined exercise program over 10 minutes. Then they left the Body-Box and put on the cleanroom lab coat and the disposable non-woven hood. After 2 minutes the test cabin was entered again and the test persons were allowed to „move freely“ for 3 minutes (= acclimatisation phase with cleanroom garments). Afterwards, the same movement program (same sequence) as in the first test phase (standing/at rest and wal-king simulation) was started again.The results of phase 2 are summarised in Table 3 (Note: 2 test persons were no longer available for the second phase).
Particle release in cleanroom garments for classes ISO 5 to 6In the third phase the test persons wore the cotton jogging suit again as intermediate garment. On top of this, cleanroom overall, cleanroom full protective hood, knee-high cleanroom overboots, nitrile gloves and a 3-layer disposable face mask were worn. This garment arrangement is often used in cleanroom classes ISO 5 and 6 (according to ISO 14644-1).
The examination procedure, i.e. primarily the exercise program, remained unchanged (com-pared to the first two phases). As a precau-tionary measure, control measurements were also carried out during this study phase with cotton jogging suits only. However, the test persons had 8 minutes to change them. The results of this series of measurements are summarised in Table 4 (Note: 10 subjects were still available for the 3rd phase).
If the cotton jogging suit (under the clean-room overall) is now replaced by intermediate garments suitable for cleanrooms (based on 100% synthetic fibres), the typical cleanroom clothing for use in aseptic areas is obtained. There have already been several studies with a similar design on the efficiency of defi-ned cleanroom-compatible intermediate gar-ments. A study at the ITV Denkendorf is just one example, which showed that the number of detected particles and germs could be reduced by 50% or more by using cleanroom-compatible intermediate garments – also in direct comparison to intermediate garments consisting of a cotton jogging suit [3].
Test person Average number of particles per minute per person
standing
≥ 0.5 µm
walking
≥ 0.5 µm
standing
≥ 5 µm
walking
≥ 5 µm
219 2,615
1 268 4,650 518 10,133
67 1,202
Actual particle number 103,492 1,235,763(extrapolated) 126,648 2,197,437 244,790 4,788,521
31,662 568,026
/
Table 2: Number of emitted particles ≥ 0.5 µm per minute of „a person in different street clothes“
Individual measurements
Human source of contamination
Test person
Average number of particles per person
standing standing
≥ 0.5 µm ≥ 0.5 µm
walking walking
≥ 0.5 µm ≥ 0.5 µm
standing standing
≥ 5 µm ≥ 5 µm
walking walking
≥ 5 µm ≥ 5 µm
1 764 36,986 17 711 203 4,883 4 83
2 not recorded not recorded 1 519 592 14,903 9 220
3 not recorded not recorded 26 450 473 7,291 6 108
4 487 88,590 41 1,170 447 8,439 8 145
5 1,230 46,257 30 535 166 4,938 4 78
6 1,836 111,500 45 38 1,558 36,286 38 551
7 2,972 27,836 60 554 318 4,673 78 3
8 1,322 109,177 24 1,704 1,835 20,662 41 419
9 8,388 126,366 146 1,780 1,019 12,172 20 196
10 not recorded not recorded 25 23 582 15,914 8 252
11 1,016 74,983 28 1,511 529 16,600 12 300
ø of all measurements 2,252 77,712 40 818 702 13,342 21 214
Actual particle number 1,064,162 36,724,068 19,032 386,430 331,742 6,304,946 9,795 101,172(extrapolated) approx. 31.2% approx. 17.2% approx. 51.2% approx. 26.2% of the initial level of the initial level of the initial level of the initial level
Table 3: Number of particles emitted per minute „Persons in cotton jogging suit“ and „Persons in cotton jogging suit and cleanroom lab coat above“
/
Cotton jogging suit Lab coat (above)
Test person
Clothing
Average number of particles per person
Average number of particles per person
standing
standing
standing
standing
≥ 0.5 µm
≥ 0.5 µm
≥ 0.5 µm
≥ 5 µm
walking
walking
walking
walking
≥ 0.5 µm
≥ 0.5 µm
≥ 0.5 µm
≥ 5 µm
standing
standing
standing
≥ 5 µm
≥ 1 µm
≥ 5 µm
walking
walking
walking
≥ 5 µm
≥ 1 µm
≥ 5 µm
1 1,472 9,080 29 144 56 72 0.3 0.4
2 144 165,050 1 2,114 120 376 1.2 3.1
3 414 25,460 8 654 32 142 0.2 0.5
4 75 115,690 8 1,405 58 256 1.0 2.8
5 78 51,470 1 661 45 199 0.2 1.3
6 2,810 82,940 41 1,182 67 352 0.7 0.4
7 3,470 39,262 77 619 20 116 0.5 0.7
8 755 145,310 14 1,729 37 118 0.6 1.6
9 3,740 47,390 119 1,259 112 477 1.5 6.6
10 893 68,920 24 1,043 59 140 0.4 0.7
ø of all measurements 1,385 75,057 32 1,081 61 225 0.7 1.8
Actual particle number 654,505 35,469,460 15,122 510,845 28,827 106,328 331.0 851.0(extrapolated) approx. 4.4% approx. 0.3% approx. 2.2% approx. 0.2% of the initial level of the initial level of the initial level of the initial level
Cotton jogging suit 873,304 34,955,780 657,312 25,114,780 17,077 448,638
Lab coat 331,742 6,304,946 130,901 2,506,495 9,795 101,172
Overall 28,827 106,328 10,396 32,135 331 851
Table 4: Number of particles emitted per minute „Persons in cotton jogging suit“ and „Persons in cotton jogging suit and cleanroom overall + full protective hood and knee-high overboots above“
/
Cotton jogging suit Overall + full protective hood + overboots (above)
Table 5: Number of particles emitted per minute „People in different garment systems“ depending on movement
Dastex Reinraumzubehör GmbH & Co. KGDraisstr. 2376461 MuggensturmGERMANYTelephone +49 7222 9696-60Telefax +49 7222 9696-88E-mail [email protected]
www.dastex.com
AuthorCarsten Moschner
Article published (in German)ReinRaumTechnik 1/2010Revised version 6/2020
© D
aste
x
Human source of contamination
Conclusion
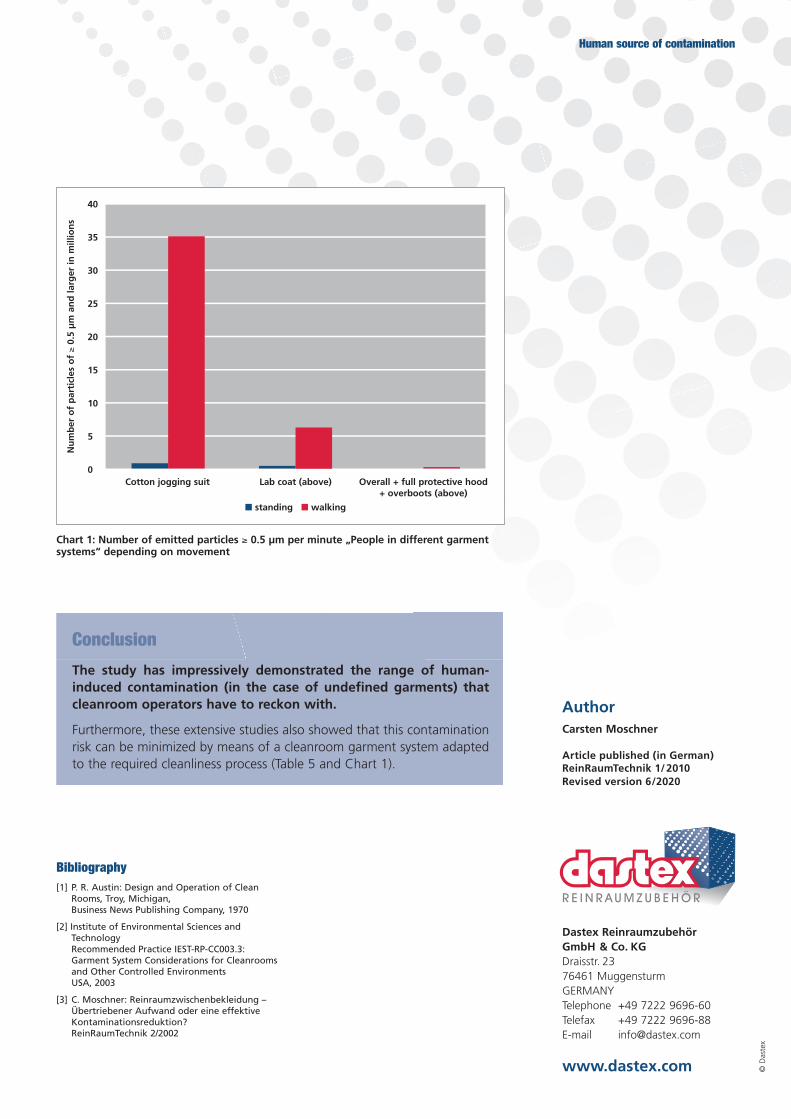
The study has impressively demonstrated the range of human-induced contamination (in the case of undefined garments) that cleanroom operators have to reckon with.
Furthermore, these extensive studies also showed that this contamination risk can be minimized by means of a cleanroom garment system adapted to the required cleanliness process (Table 5 and Chart 1).
Bibliography[1] P. R. Austin: Design and Operation of Clean
Rooms, Troy, Michigan, Business News Publishing Company, 1970
[2] Institute of Environmental Sciences and TechnologyRecommended Practice IEST-RP-CC003.3:Garment System Considerations for Cleanrooms and Other Controlled EnvironmentsUSA, 2003
[3] C. Moschner: Reinraumzwischenbekleidung – Übertriebener Aufwand oder eine effektive Kontaminationsreduktion?ReinRaumTechnik 2/2002
Chart 1: Number of emitted particles ≥ 0.5 µm per minute „People in different garment systems“ depending on movement
Nu
mb
er o
f p
arti
cles
of ≥
0.5
µm
an
d la
rger
in m
illio
ns
40
35
30
25
20
15
10
5
0Cotton jogging suit Lab coat (above) Overall + full protective hood
+ overboots (above)
■ standing ■ walking