Embed Size (px)
Citation preview

Huntsman CorporationCredit Suisse Chemicals ConferenceSeptember 19, 2006

2
Forward Looking Statements
This presentation includes “forward-looking statements” within the meaning of Section 27A of the Securities Act of 1933 and Section 21E of the Securities Exchange Act of 1934. These forward-looking statements include statements concerning our plans, objectives, goals, strategies, future events, future revenue or performance, capital expenditures, financing needs, plans or intentions relating to acquisitions, business trends and other information that is not historical information. When used in this presentation, the words “estimates,” “expects,”“anticipates,” “projects,” “plans,” “intends,” “believes,” “forecasts,” or future or conditional verbs, such as “will,” “should,” “could” or “may,”and variations of such words or similar expressions are intended to identify forward-looking statements. All forward-looking statements, including, without limitation, management’s examination of historical operating trends and data are based upon our current expectations and various assumptions. Our expectations, beliefs and projections are expressed in good faith and we believe there is a reasonable basis for them. However, there can be no assurance that management’s expectations, beliefs and projections will be achieved.
There are a number of risks and uncertainties that could cause our actual results to differ materially from the forward-looking statements contained in this presentation. Important factors that could cause our actual results to differ materially from the forward-looking statements we make in this presentation. Such risks, uncertainties and other important factors include, among others: our history of losses; our substantial leverage; limitations on flexibility in operating our business contained in our debt agreements; we are a holding company with no independent operations; cyclical demand for our products; increases in interest rates as a result of our variable rate indebtedness; pricing pressure from our customers; technological change and innovation; risks associated with our non-U.S. operations; fluctuations in currency exchange rates; high competition in the markets in which we operate; adverse changes to environmental, health and safety regulations; operating hazards in our production facilities; our auditors have reported several material weaknesses in our internal controls; inability to achieve expected cost savings; difficulties in securing the raw materials we use; our ability to realize the full value of our intangible assets; our ability to attract and retain skilled employees, particularly research scientists, technical sales professionals and engineers; our ability to protect our intellectual property rights; and the possibility that our owners’ interests will conflict with ours. There may be other factors that may cause our actual results to differ materially from the forward-looking statements.
All forward-looking statements attributable to us or persons acting on our behalf apply only as of the date of this presentation and are expressly qualified in their entirety by the cautionary statements included in this presentation. We undertake no obligation to update or revise forward-looking statements which may be made to reflect events or circumstances that arise after the date made or to reflect the occurrence of unanticipated events.

3
Ciba TEButadiene/MTBE Sale
$0
$2
$4
$6
$8
$10
$12
$14
1985 1987 1989 1991 1993 1995 1997 1999 2001 2003 2005 PF
Rev
enue
($ in
Bill
ions
)
Compounded AnnualGrowth Rate: ~24%
Compounded AnnualGrowth Rate: ~24%
Huntsman Growth Story
Huntsman has been a leader in the consolidation of the global chemical industry
Rexene
Packaging Spinoff
Nova Styrenics Sale
Shell PP
American Hoechst
MonsantoMAn/LAB
Texaco Chemical
TexacoPO/MTBE
Dow Ethyleneamines and Rhodia Surfactants
Vantico
ICI

4
Polyurethanes26%
Advanced Materials
9%
Performance Products
15%
Pigments8%
Polymers14%
Base Chemicals
28%
Huntsman Portfolio Composition
Q2 2006 LTM Revenue(1): $12.8 billion Q2 2006 LTM Adjusted EBITDA(2): $1,179 millionPF Hurricane Impact, PO/MTBE Outage: $1,378 million
Huntsman is one of the largest publicly traded chemical companies in the US
Inorganic
(1) Percentage allocations in the segment revenues chart reflect the allocation of all intersegment revenue eliminations to our Base Chemicals segment.
(2) Adjusted EBITDA excludes restructuring and plant closing costs, loss on the sale of accounts receivables, discontinued operations and other unusual items; segment allocation is before corporate and other unallocated items.
Commodity
DifferentiatedAdvanced Materials
10%
Performance Products
11%
Pigments10%
Polymers11%
Base Chemicals8%
Polyurethanes50%
5
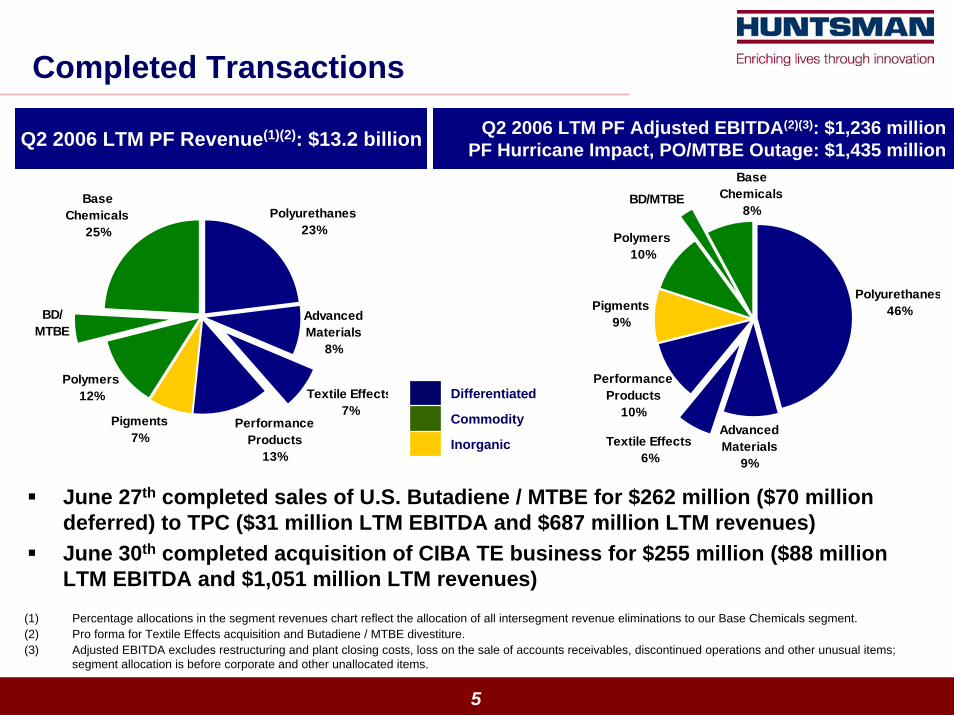
Completed Transactions
Base Chemicals
25%
Polymers12%
Pigments7%
Performance Products
13%
Textile Effects7%
Advanced Materials
8%
Polyurethanes23%
BD/MTBE
Q2 2006 LTM PF Revenue(1)(2): $13.2 billion Q2 2006 LTM PF Adjusted EBITDA(2)(3): $1,236 millionPF Hurricane Impact, PO/MTBE Outage: $1,435 million
June 27th completed sales of U.S. Butadiene / MTBE for $262 million ($70 million deferred) to TPC ($31 million LTM EBITDA and $687 million LTM revenues)June 30th completed acquisition of CIBA TE business for $255 million ($88 million
(1) Percentage allocations in the segment revenues chart reflect the allocation of all intersegment revenue eliminations to our Base Chemicals segment.(2) Pro forma for Textile Effects acquisition and Butadiene / MTBE divestiture.(3) Adjusted EBITDA excludes restructuring and plant closing costs, loss on the sale of accounts receivables, discontinued operations and other unusual items;
segment allocation is before corporate and other unallocated items.
LTM EBITDA and $1,051 million LTM revenues)
Inorganic
Commodity
Differentiated
Base Chemicals
8%
Polymers10%
Pigments9%
Performance Products
10%
Textile Effects6%
Advanced Materials
9%
Polyurethanes46%
BD/MTBE

6
Pigments12%
Performance Products
23%
Materials & Effects
26%
Polyurethanes39%
New Huntsman PortfolioQ2 2006 LTM PF Adjusted EBITDA(1)(2): $1,006 million
PF(3) : $1,164 million
(1) Pro forma for Textile Effects acquisition, Butadiene / MTBE divestiture and Base Chemicals and Polymers proposed sale / spin-off.(2) Adjusted EBITDA excludes restructuring and plant closing costs, loss on the sale of accounts receivables, discontinued operations and other
unusual items; segment allocation is before corporate and other unallocated items.(3) Further pro forma adjustments to exclude the impact of hurricanes, PO/MTBE outage, and adjusted to normalized corporate overhead of $135
million per annum.
Q2 2006 LTM PF Revenue(1): $8.6 billion
Sale and or spin-off of remaining Base Chemicals and Polymers assets in progress
Differentiated
Inorganic
Pigments11%
Performance Products
13%
Materials & Effects
19%
Polyurethanes57%

7
Pro Forma New Huntsman
(1) Adjusted for estimated impact of hurricanes and PO/MTBE outage(2) Adjusted to include Textile Effects.(3) Adjusted for estimated impact of hurricanes and PO/MTBE outage, normalized corporate overhead of $135 million per annum, and includes Textile
Effects.
in millions Current Differentiated
2005Sales 12,962 8,624 (2)
Adjusted EBITDA 1,445 1,098 (2)
Pro forma Adjusted EBITDA 1,644 (1) 1,276 (3)
% Margin 12.7% 14.8%
Capital Expenditures 339 256 (2)
2006 Q2 LTMRevenue 12,804 8,571 (2)
Adjusted EBITDA 1,179 1,006 (2)
Pro forma Adjusted EBITDA 1,378 (1) 1,164 (3)
% Margin 10.8% 13.6%
Capital Expenditures 423 266 (2)
$ $
$ $

8
Polyurethanes
Advanced MaterialsPigments
Performance Products+ Textile Effects
Mumbai
DelhiKarachi
Jakarta
Kuala Lumpur
ManilaBangkok/Mahachai
Ho ChiMinh
Taipei
Seoul Tokyo
Hong Kong
Beijing
Shanghai
Guangzhou
Qingdao
Perth
Auckland
Sydney Melbourne
Singapore
Teluk Kalung
Chennai Panyu
KobeKaoshiung
+
+
+
+
+
+
++
+ Osaka
251,045$0.4bnTextile Effects
562,100+$1.6bnTOTAL
2240$0.2bnPigments
2190$0.2bnPerformance Products
14380$0.3bnAdvanced Materials
13280$0.5bnPolyurethanes
# Sites# Assoc.RevenuesDivision
New Huntsman in Asia$1.6 Billon (19%) of Global Revenue (2005PF)
++
+ ++++
+
+
+
+
Huangzhou + FujianShenzhen
Bangalore
+CalcuttaAhmedabad+
+Ludhiana
+Chandigarh

9
Fixed Cost Reduction Program
* Fixed Currency Basis 2002; Run-Rate
$1,300
$1,500
$1,700
$1,900
$2,100
2002 June 30th
2006
$ in
Mill
ions $200
3% p.a. Inflation
Fixed CostsHeadcount
0
2,500
5,000
7,500
10,000
12,500
15,000
2000 2002 Jun-06
Hea
dcou
nt
Pigments Base Chemicals & Polymers
Performance Products Advanced Materials
Polyurethanes
28% Reduction

10
New Huntsman A Differentiated Chemical Company
More attractive growth profile
More stable cash flows
Less energy and raw material dependent
Leading technologies
Higher margins (LTM EBITDA % ~14% vs. ~11%)
Geographically diverse (~19% of 2005 revenues in APAC)
Lower capital expenditure requirements

11
PolyurethanesQ206 LTM Revenue: $3.4B; 48% Q206 LTM PF(1) Adjusted EBITDA
End Markets
Global MDI Market Share
Source: Nexant 2004
Huntsman24%
Bayer24%
Others16%
Dow16%
BASF20%
Automotive10%
Appliances9%
Adhesives & Coatings
7%Furniture
7%
Others31%
CWP7%
Construction Insulation
24%
Footwear & Elastomers
5%Global MDI Demand
0
500
1,000
1,500
2,000
2,500
3,000
3,500
1992
1993
1994
1995
1996
1997
1998
1999
2000
2001
2002
2003
2004
Thou
sand
s of
Met
ric
Tons
US W. Europe Asia ROW
CAGR = 7.4%CAGR = 7.4%
Source: Nexant 2004(1) Proforma for Textile Effects acquisition and Butadiene / MTBE divestiture

12
PolyurethanesConstruction Insulation Growing the Market
Global insulation market growing at 5% per annum(1)
Polyurethanes are only 8% of the global insulation market(1)
Polyurethane insulation growing at over 10% per annum(1)
Huntsman is global leader in polyurethane insulation market with 35%+ market share(1)
Global insulation market growing at 5% per annum(1)
Polyurethanes are only 8% of the global insulation market(1)
Polyurethane insulation growing at over 10% per annum(1)
Huntsman is global leader in polyurethane insulation market with 35%+ market share(1)
PU
MDI offers the most cost-effective solution at higher insulation requirements
EPSMW
Rock Wool &
Fiberglass
PU
EPS
XPS
Market Share
0.0
7.0
Insulation Efficiency
R-fa
ctor
Source: Freedonia 2004; Frost & Sullivan
(1) Freedonia 2004

13
PolyurethanesComposite Wood Growth Drivers
• Average home size increasing
• Substitution of Plywood by Oriented Strand Board (OSB), due to high cost, declining availability of veneer grade lumber
• OSB ~40% lower cost than traditional plywood
Source APA / Market Edge
0
100
200
300
400
500
600
700
800
900
1991
1992
1993
1994
1995
1996
1997
1998
1999
2000
2001
2002
2003
2004
2005
2006
F
mm lbs(MDI equivalent)
MDI Total binders MDI share
22%
20%22% 21%
20%21% 21%
26%27% 28%
32%34%
35%37%
38%
31%
• Substitution of phenolic resins by MDI- Lower dosage rates, faster press speeds, enhanced tolerance of moisture and mixed wood species
• Producer shift away from unprofitable commodity OSB panels, towards specialty products (siding, flooring) which require MDI performance
Total Adhesive in OSBTotal Sheathing Market
F F F F F

14
PolyurethanesOSB Binders in North Americas (MM lbs MDI Equivalent)
406
164
Phenol FormaldehydeMDI
Market 2000 (mmlbs)MDI Market Share = 29%
496
313
Phenol FormaldehydeMDI
Market 2006E (mmlbs)MDI Market Share = 39%
*Management Estimates
’00 – ’06ECAGR %
MDI 11%
Phenol Formaldehyde 3%
Total OSB Binders 6%
15
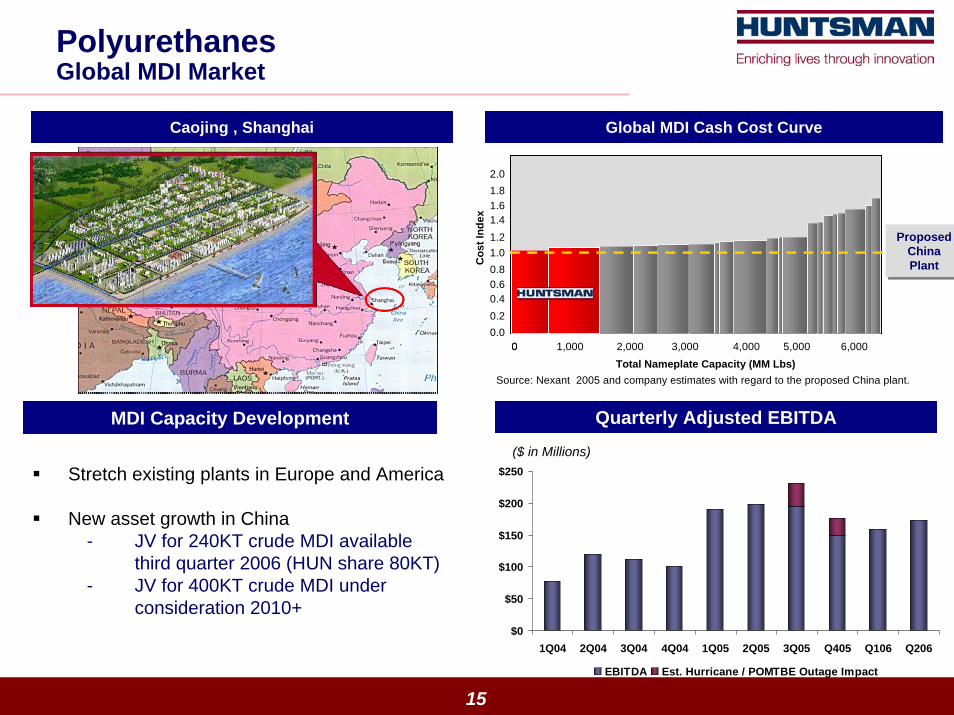
PolyurethanesGlobal MDI Market
Caojing , Shanghai Global MDI Cash Cost Curve
Source: Nexant 2005 and company estimates with regard to the proposed China plant.
Proposed China Plant
Proposed China PlantC
ost I
ndex
Total Nameplate Capacity (MM Lbs)0 1,000 2,0000 3,000 4,000 5,000 6,000
0.00.2
0.81.0
0.60.4
1.2
1.82.0
1.61.4
$0
$50
$100
$150
$200
$250
1Q04 2Q04 3Q04 4Q04 1Q05 2Q05 3Q05 Q405 Q106 Q206
EBITDA Est. Hurricane / POMTBE Outage Impact
($ in Millions)
Quarterly Adjusted EBITDA
Stretch existing plants in Europe and America
New asset growth in China- JV for 240KT crude MDI available
third quarter 2006 (HUN share 80KT)- JV for 400KT crude MDI under
consideration 2010+
MDI Capacity Development

16
$0
$25
$50
1Q04 2Q04 3Q04 4Q04 1Q05 2Q05 3Q05 Q405 Q106 Q206
EBITDA Est. Hurricane Impact
($ in Millions)
Quarterly Adjusted EBITDA
2,300 employees13 manufacturing locationsSales in more than 90 countries Over 6,000 customers10,000 SKUsThree Market focused Business Units
(1) Proforma for Textile Effects acquisition and Butadiene / MTBE divestiture
Advanced MaterialsQ206 LTM Revenue: $1.2B; 10% Q206 LTM PF(1) Adjusted EBITDA

17
Business Overview
CoatingsCoatings, Construction
and Adhesives(53% of Revenues)
CoatingsDesign and Composite
Engineering(26% of Revenues)
Power and Electronics(21% of Revenues)
ConstructionPowder coatings, auto primersMarine and maintenanceGeneral bonding, DIYLiquid Natural GasDVD
AerospaceAutomotiveGeneral industryWind energyRecreational
PowerGeneral industryAutomotiveTelecomLighting
Advanced MaterialsBusiness Overview

18
Textile EffectsQ206 LTM Revenue: $1.0B; 7% Q206 LTM PF(1) Adjusted EBITDA
Value Drivers
Textile Value Chain
Business Overview Customers
Global business supplying dyes and processchemicals to the textile industry
Revenue $1,051mm (Q2 2006 LTM)- 1H06 up 4% y /y
EBITDA $88mm (Q2 2006 LTM)Employees: ~4,000
Asia
Europe
Americas
Leverage existing Huntsman support platforms to supply business model$150mm restructuring expenses and capexthrough 2008Target 15% EBITDA compounded growth over next several yearsMid-teens EBITDA margins and $0.30 per share by 2008
(1) Proforma for Textile Effects acquisition and Butadiene / MTBE divestiture
Rapid industry migration to Asia particularly Apparel. Europe and Americas – Focus on Technical Textiles and niche Apparel opportunities

19
$1.9bn Sales2,000 Global Associates2.0 Million Metric Tonnes Annual Production15 Manufacturing Sites, 2 JV Manufacturing Locations3 R&D CentersOver 1,000 Products Sold in 100+ Countries
Performance ProductsQ206 LTM Revenue: $1.9B; 11% Q206 LTM PF(1) Adjusted EBITDA
Revenue Split by Business Units EBITDA Split by Business Units
Maleic & Licensing
35%
Performance Intermediates
37%
Performance Specialties
28%
Maleic & Licensing
7%
Performance Specialties
28%
Performance Intermediates
65%
(1) Proforma for Textile Effects acquisition and Butadiene / MTBE divestiture

20
Performance ProductsStrong Specialty Position
102030405060708090
100110
1993199419951996199719981999200020012002200320042005
Mn
Lbs
Polyetheramines Growth
Performance Specialties Competitive Landscape
CAGR = 13.1%CAGR = 13.1%
Source: Company Estimates
Quarterly Adjusted EBITDA
Amine Chemistry Huntsman BASF DOW AKZO Air
ProductsEthyleneamines
Akylalkanolamines
Polyetheramines
Sub. Propylamines
Morpholine / DGA
Alkylamines
Ethanolamines
$0
$25
$50
$75
1Q04 2Q04 3Q04 4Q04 1Q05 2Q05 3Q05 Q405 Q106 Q206
EBITDA Est. Hurricane Impact
Maleic Anhydride - 40%
Ethyleneamines – 40%
Ethylene Carbonates – 30%
Polyetheramines – 25%
Ethanolamines – 17%
Announced Capacity Expansions

21
2005 – 2006 Objectives
DeleverageDeleveragePlanned $1.4 billion IPO, proceeds to reduce indebtednessReduce debt post IPO by $2 billion by end of 2007
Completed $1.6 billion IPO on February 16th
2005; ~$4.3 billion market capitalization Excluding debt repaid by IPO proceeds, have voluntarily paid down nearly ~$700 million since December 2004 to date
Cost ReductionCost ReductionProject Coronado Exceeded goal of $200 million, ended 2005
on a run-rate of $225 million savings
Simplify organization structureSimplify organization structureReduce the number of independently financed operating subsidiaries
Merger of AdMat into HI and HLLC into HI reduced reporting entities to 2 (HC and HI) compared to 5 one year ago; all borrowings consolidated at HI
Portfolio ManagementPortfolio ManagementReshape
Textile Effects acquisitionDivestiture of Butadiene and MTBEAnnounced remaining Commodity spin/or split
Objectives Progress Update

Appendix

23
Adjusted EBITDA Reconciliation$ in millions
Q1 '04 Q2 '04 Q3 '04 Q4 '04 Q1 '05 Q2 '05 Q3 '05 Q4 '05 Q1 '06 Q2 '06
Net (loss) / income (85)$ (185)$ 44$ (1)$ (56)$ 113$ (30)$ (61)$ 69$ 263$ Interest expense - net 160 145 155 153 140 101 101 85 87 95 Income tax expense / (benefit) 5 6 (36) (3) 32 29 8 (48) 8 24 Depreciation and amortization 128 152 131 127 126 124 123 128 117 118
EBITDA 208 117 293 275 241 366 202 104 281 499 Early extinguishment of debt 2 2 (2) 24 233 2 41 46 - - Legal and contract settlement expense, net 2 15 (11) 0 - - - - - (9) Loss on sale of accounts receivable 4 3 4 5 3 2 3 2 3 5 Loss due to the Port Arthur outage - - - - - - - - - 9 Restructuring and plant closing costs 9 151 43 97 10 19 71 23 8 (0) Gain on disposition of assets - - - - - - - - - (92) Loss from discontinued operations net of tax 1 1 3 3 3 40 1 0 1 0 Extraordinary gain on the acquisition of a business, net of tax - - - - - - - - (51) Cumulative effect of changes in accounting principle - - - - - - 31 - -
Adjusted EBITDA 225$ 289$ 330$ 405$ 490$ 430$ 319$ 205$ 292$ 362$
Pro Forma(1) Pro Forma(1)
2002 2003 2004 2005 2006 LTM
Net (loss) (167)$ (426)$ (228)$ (35)$ 241$ Interest expense - net 544 578 613 427 367 Income tax (benefit) / expense (10) 32 (29) 21 (8) Depreciation and amortization 488 480 537 501 486
EBITDA 854 664 893 913 1,086 Cumulative effect of accounting change (167) - - - - Early extinguishment of debt 7 - 26 323 88 Legal and contract settlement expense, net (9) 8 7 - (9) Loss on sale of accounts receivable 6 32 16 11 13 Asset impairment, write down 56 6 - - - Loss due to the Port Arthur outage - - - - 9 Restructuring and plant closing costs 7 55 299 124 102 Reorganization costs 41 28 - - - Gain on disposition of assets - - - - (92) Loss from discontinued operations net of tax (9) 3 8 44 2 Extraordinary gain on the acquisition of a business, net of tax - - - (51) Cumulative effect of changes in accounting principle - - 31 31
Adjusted EBITDA 786$ 794$ 1,248$ 1,445$ 1,179$
(1) Pro forma as if Huntsman had acquired the remaining interest in HIH as of January 1, 2002 and 2003 and its interest in Advanced Materials as of January 1, 2002 and 2003
24
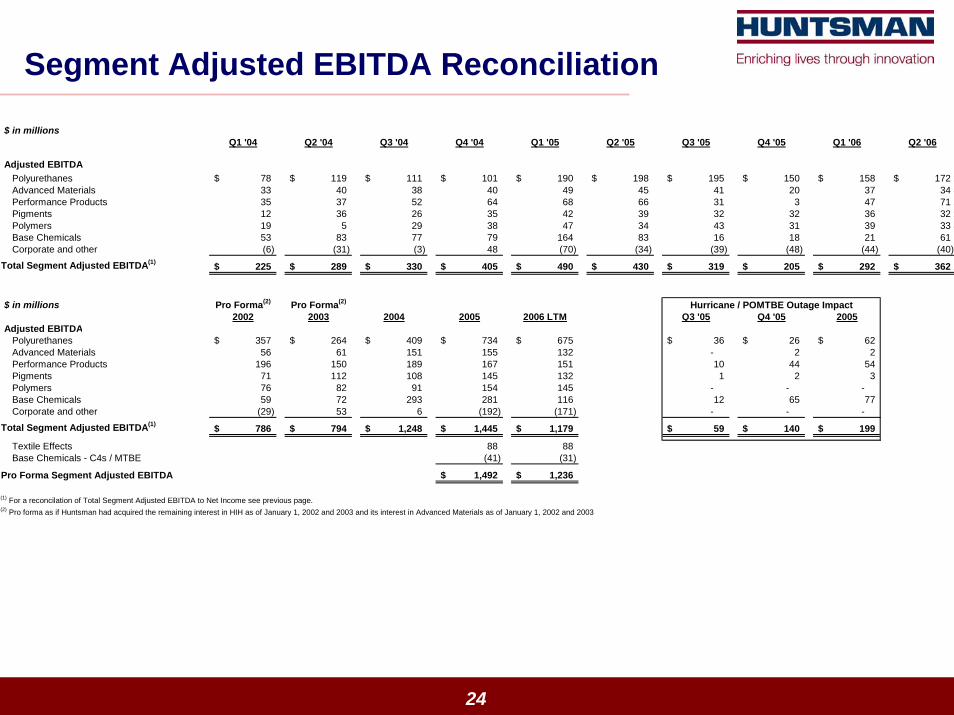
Segment Adjusted EBITDA Reconciliation
$ in millionsQ1 '04 Q2 '04 Q3 '04 Q4 '04 Q1 '05 Q2 '05 Q3 '05 Q4 '05 Q1 '06 Q2 '06
Adjusted EBITDAPolyurethanes 78$ 119$ 111$ 101$ 190$ 198$ 195$ 150$ 158$ 172$ Advanced Materials 33 40 38 40 49 45 41 20 37 34 Performance Products 35 37 52 64 68 66 31 3 47 71 Pigments 12 36 26 35 42 39 32 32 36 32 Polymers 19 5 29 38 47 34 43 31 39 33 Base Chemicals 53 83 77 79 164 83 16 18 21 61 Corporate and other (6) (31) (3) 48 (70) (34) (39) (48) (44) (40)
Total Segment Adjusted EBITDA(1) 225$ 289$ 330$ 405$ 490$ 430$ 319$ 205$ 292$ 362$
$ in millions Pro Forma(2) Pro Forma(2) Hurricane / POMTBE Outage Impact2002 2003 2004 2005 2006 LTM Q3 '05 Q4 '05 2005
Adjusted EBITDAPolyurethanes 357$ 264$ 409$ 734$ 675$ 36$ 26$ 62$ Advanced Materials 56 61 151 155 132 - 2 2 Performance Products 196 150 189 167 151 10 44 54 Pigments 71 112 108 145 132 1 2 3 Polymers 76 82 91 154 145 - - - Base Chemicals 59 72 293 281 116 12 65 77 Corporate and other (29) 53 6 (192) (171) - - -
Total Segment Adjusted EBITDA(1) 786$ 794$ 1,248$ 1,445$ 1,179$ 59$ 140$ 199$
Textile Effects 88 88 Base Chemicals - C4s / MTBE (41) (31)
Pro Forma Segment Adjusted EBITDA 1,492$ 1,236$
(1) For a reconcilation of Total Segment Adjusted EBITDA to Net Income see previous page.(2) Pro forma as if Huntsman had acquired the remaining interest in HIH as of January 1, 2002 and 2003 and its interest in Advanced Materials as of January 1, 2002 and 2003

25
Adjusted EBITDA ReconciliationTextile Effects
(in millions Swiss francs)Textile Effects LTM June June YTDAdjusted EBITDA Reconciliation 2006 2005 2006 2005, ,Net sales 1,294 1,276 661 643
Net loss (554) (568) 12 (2) Interest expense 1 1 - - Income tax (benefit) / expense 2 (2) 6 2 Depreciation and amortization 30 52 - 22
EBITDA (521) (517) 18 22 Restructuring and impairment charges 630 626 27 23
Adjusted EBITDA 109 109 45 45
USD exchange rate 1.24 1.27 1.29 USD - Net sales equivalent 1,051$ 1,029$ 520$ 498$ USD - Adjusted EBITDA equivalent 88$ 88$ 35$ 35$