Embed Size (px)
Citation preview
NATIONAL HURRICANE CENTER TROPICAL CYCLONE REPORT
HURRICANE FRED (AL062015) 30 August – 6 September 2015
John L. Beven II National Hurricane Center
20 January 2016
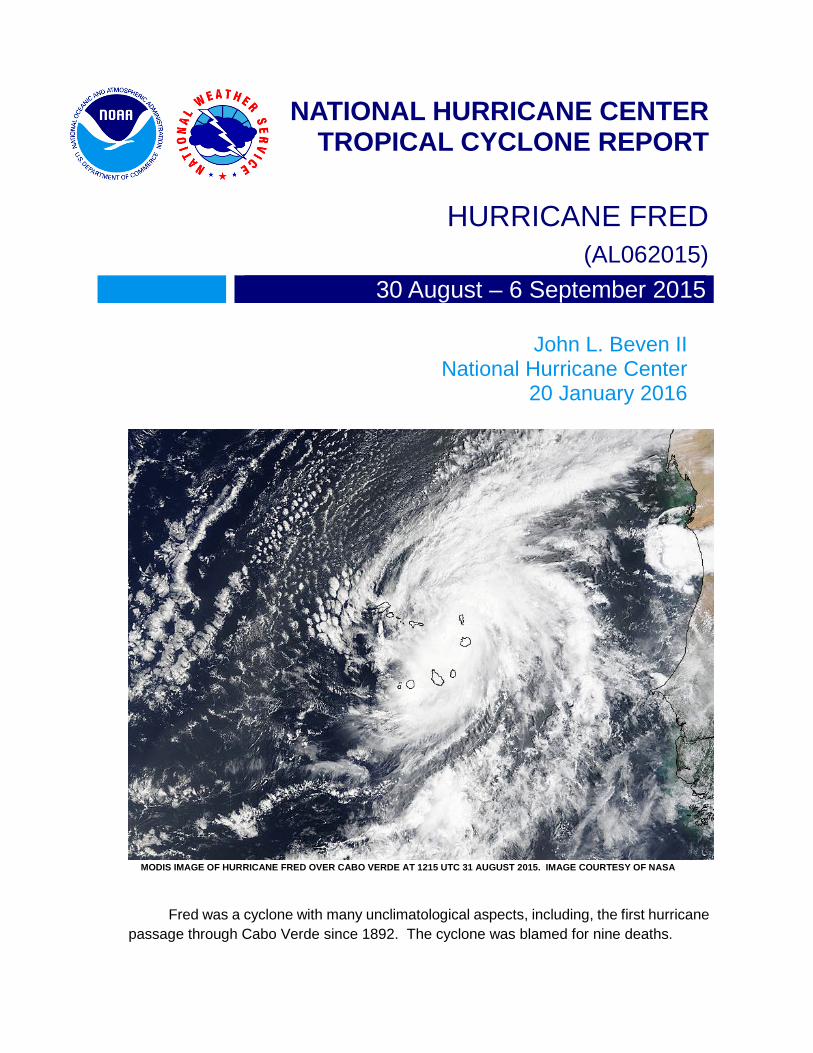
MODIS IMAGE OF HURRICANE FRED OVER CABO VERDE AT 1215 UTC 31 AUGUST 2015. IMAGE COURTESY OF NASA
Fred was a cyclone with many unclimatological aspects, including, the first hurricane
passage through Cabo Verde since 1892. The cyclone was blamed for nine deaths.
Hurricane Fred 2
Hurricane Fred 30 AUGUST – 6 SEPTEMBER 2015
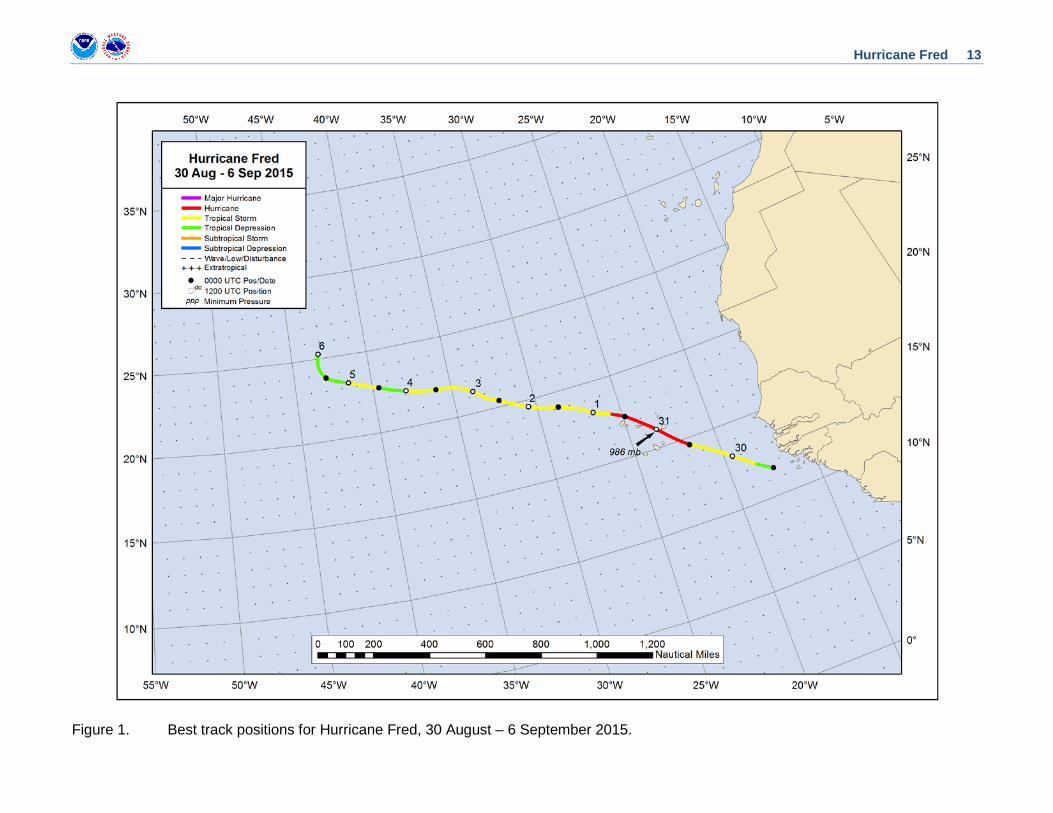
SYNOPTIC HISTORY Fred formed from a tropical wave that emerged from the west coast of Africa on 29 August. Unlike most tropical waves, Fred’s precursor began to develop almost immediately upon reaching the Atlantic, and a low pressure area formed just west of the coast of Guinea later that day. The center of the low re-formed northward late on 29 August, and it is estimated that a tropical depression developed near 0000 UTC 30 August about 260 n mi west-northwest of Conakry, Guinea. The “best track” chart of the tropical cyclone’s path is given in Fig. 1, with the wind and pressure histories shown in Figs. 2 and 3, respectively. The best track positions and intensities are listed in Table 11.
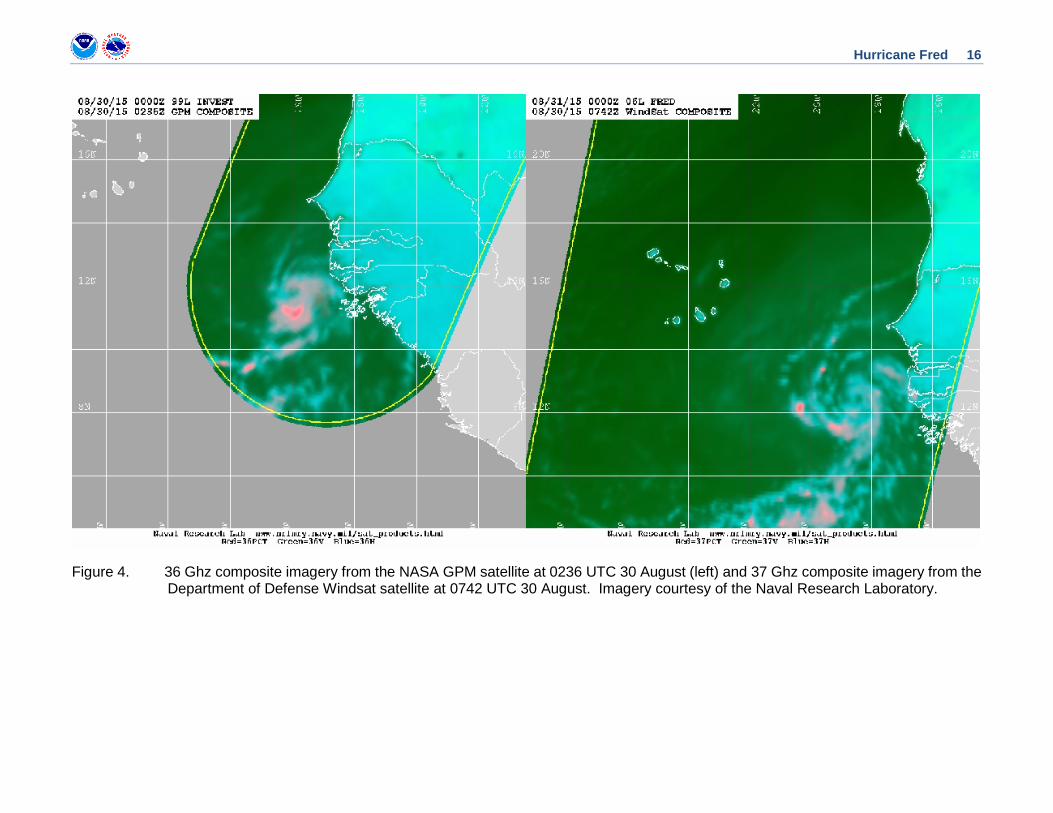
The depression moved quickly on an aclimatological northwestward track after genesis, steered by a weakness in the subtropical ridge north of Cabo Verde. Microwave data showed that the system developed a well-defined inner core during or just after genesis (Fig. 4), and this, in combination with warm sea surface temperatures and light vertical wind shear, allowed a rapid strengthening that was also not normal for this area. The cyclone reached tropical storm strength 6 h after genesis, and it became a hurricane around 0000 UTC 31 August about 145 n mi south-southeast of Sal, Cabo Verde. Fred moved through the islands later that day as it reached an estimated peak intensity of 75 kt. After that, a combination of decreasing sea surface temperatures and increasing southwesterly shear caused weakening, and Fred fell below hurricane strength early on 1 September as it moved away from Cabo Verde.
Fred turned west-northwestward later on 1 September as the subtropical ridge strengthened to the north, and this general motion would continue for the next two days. During this time, the associated convection occurred in episodic sheared bursts, with the result that Fred gradually weakened. The cyclone moved westward on 4 September while it weakened to a tropical depression. Later that day, however, a new burst of convection caused the cyclone to strengthen back to a tropical storm for about 12 h as it turned back toward the west-northwest. A deep-layer trough and associated surface frontal system caused a break in the subtropical ridge, and Fred moved northward on 6 September. The cyclone remained in a strong shear environment, which caused it to degenerate to a trough later that day about 1050 n mi southwest of the Azores. Shortly thereafter, the remnants of Fred were absorbed by the front.
1 A digital record of the complete best track, including wind radii, can be found on line at ftp://ftp.nhc.noaa.gov/atcf. Data for the current year’s storms are located in the btk directory, while previous years’ data are located in the archive directory.
Hurricane Fred 3
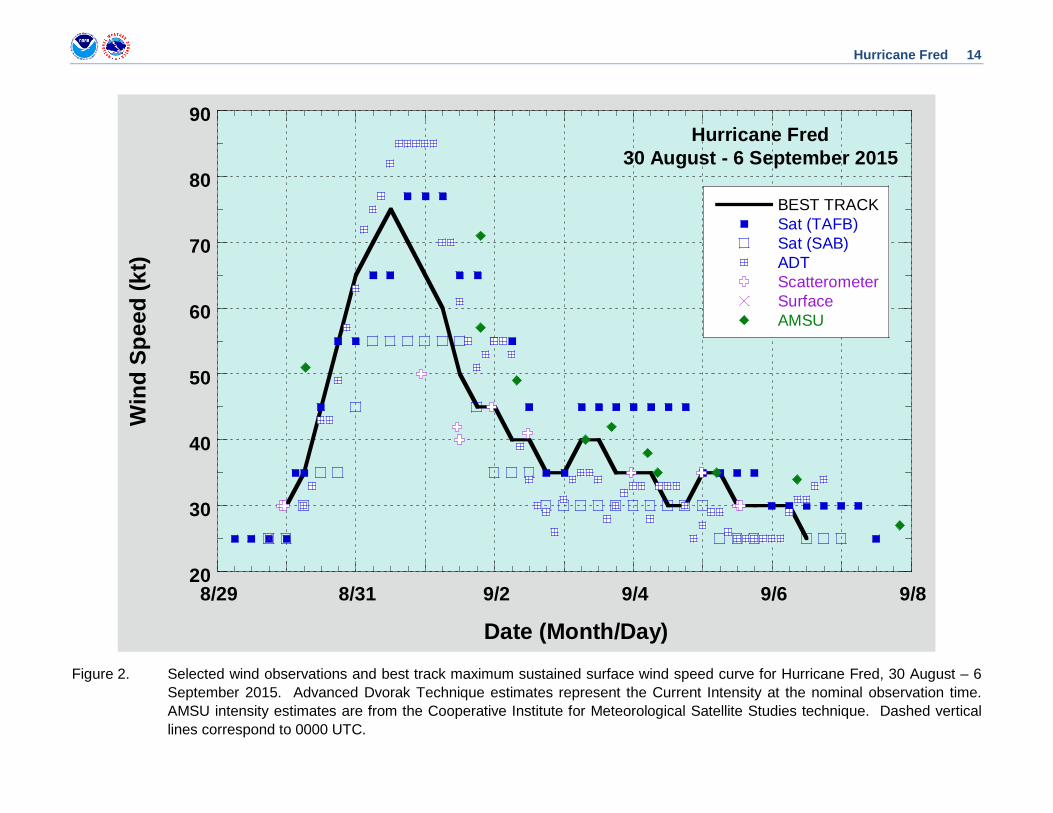
METEOROLOGICAL STATISTICS Observations in Fred (Figs. 2 and 3) include subjective satellite-based Dvorak technique intensity estimates from the Tropical Analysis and Forecast Branch (TAFB) and the Satellite Analysis Branch (SAB), and objective Advanced Dvorak Technique (ADT) estimates from the Cooperative Institute for Meteorological Satellite Studies/University of Wisconsin-Madison. Observations also include dropwindsonde observations from one flight of the NOAA Global Hawk aircraft. Data and imagery from NOAA polar-orbiting satellites including the Advanced Microwave Sounding Unit (AMSU), the NASA Global Precipitation Mission (GPM), the European Space Agency’s Advanced Scatterometer (ASCAT), and Defense Meteorological Satellite Program (DMSP) satellites, among others, were also useful in constructing the best track of Fred.
As best as can be determined, Fred is the first hurricane to move through Cabo Verde since 1892. Hurricane Debby of 1961 reached hurricane strength just after passing through the islands.
Winds and Pressure The estimated peak intensity of Fred is based on satellite imagery. While hurricane and tropical storm conditions affected several of the eastern and northern islands of Cabo Verde, there are no meteorological observations currently available from the area.
There was one marine observation of tropical-storm-force winds from Fred. The ship Laura Maersk (call sign OWKI2) reported 39-kt winds at 0000 UTC 31 August.
Storm Surge2 Media reports indicate that storm surge, accompanied by high surf, occurred in several islands of Cabo Verde. However, quantitative reports are not available. In addition, swells generated by the hurricane caused above normal tides on the western coast of Africa from Guinea-Bissau northward to Senegal.
Rainfall and Flooding
2 Several terms are used to describe water levels due to a storm. Storm surge is defined as the abnormal rise of water generated by a storm, over and above the predicted astronomical tide, and is expressed in terms of height above normal tide levels. Because storm surge represents the deviation from normal water levels, it is not referenced to a vertical datum. Storm tide is defined as the water level due to the combination of storm surge and the astronomical tide, and is expressed in terms of height above a vertical datum, i.e. the North American Vertical Datum of 1988 (NAVD88) or Mean Lower Low Water (MLLW). Inundation is the total water level that occurs on normally dry ground as a result of the storm tide, and is expressed in terms of height above ground level. At the coast, normally dry land is roughly defined as areas higher than the normal high tide line, or Mean Higher High Water (MHHW).
Hurricane Fred 4
No detailed rainfall observations are available from Cabo Verde. Media reports suggest that 6-8 inches of rain occurred on several of the islands. These rains caused some flooding, but also filled reservoirs that were low due to drought.
CASUALTY AND DAMAGE STATISTICS Media reports indicate there were nine deaths3 directly associated with Fred. The Greek-registered fishing boat Dimitrios sank off the coast of Guinea-Bissau due to the high waves generated by Fred, and 7 members of its crew of 19 were not found. In addition, two fishermen from Cabo Verde were reported missing and presumed dead when their fishing boat failed to return to the island of Boa Vista.
Media reports also indicate that Fred caused damage on several islands of Cabo Verde, with Boa Vista being the hardest hit. These reports suggest that about $1 US million of damage occurred on the islands. Additional damage from surf and above normal tides occurred along the coast of Africa, with damage to crops reported in Guinea-Bissau due to salt water inundation.
FORECAST AND WARNING CRITIQUE
The genesis of Fred was not well forecast. The system was first mentioned in the Tropical Weather Outlook 48 h before genesis occurred (Table 2). However, at that time, it was given a low chance (30% or less) for genesis within five days, with a near 0% chance shown within two days. The short-range genesis probability was increased above 0% 24 h before genesis, which is also the time that the medium-range probability was raised to a medium chance (40%-60%). Subsequently, the medium-range probability was raised to a high chance (70% or greater) 12 h before genesis, at which time the short-range genesis probability was raised to a medium chance. Finally, the short-range probability was raised to the high category 6 h before genesis. The poor genesis forecasts are partly attributable to the very aclimatological genesis location near the coast of Africa and the fact that genesis occurred less than 24 h after the wave moved offshore. In addition, the National Hurricane Center is typically conservative with its genesis forecasts for systems still over Africa.
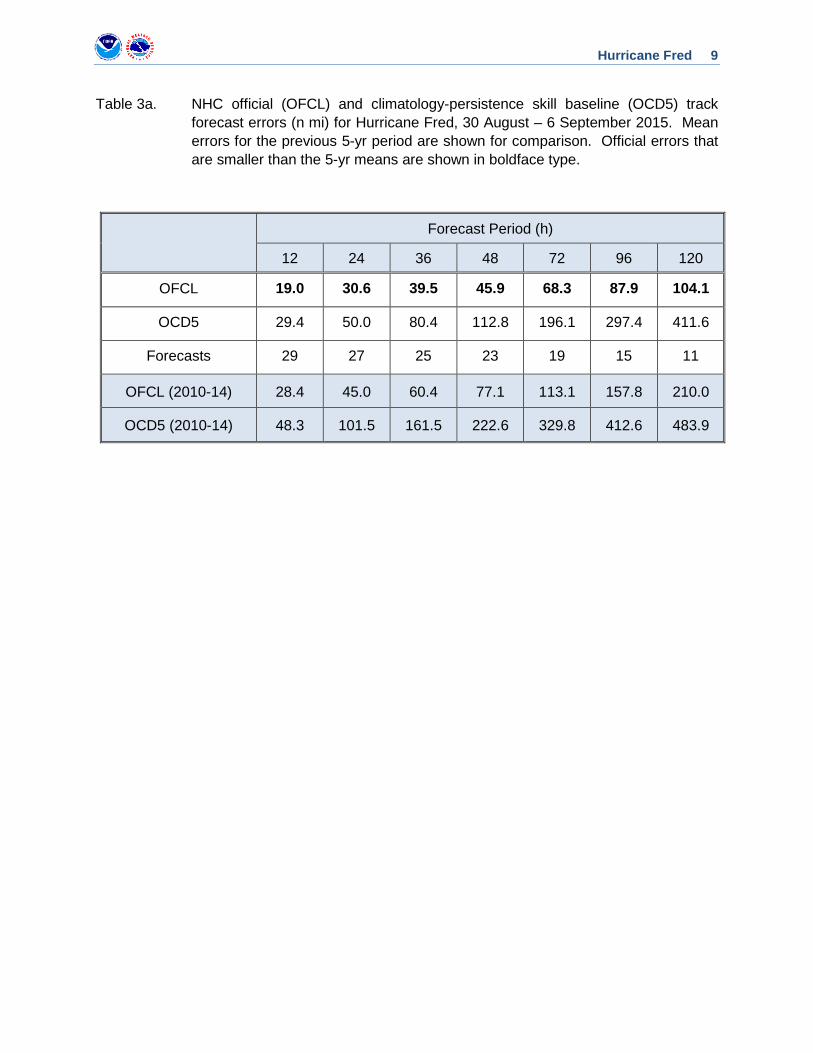
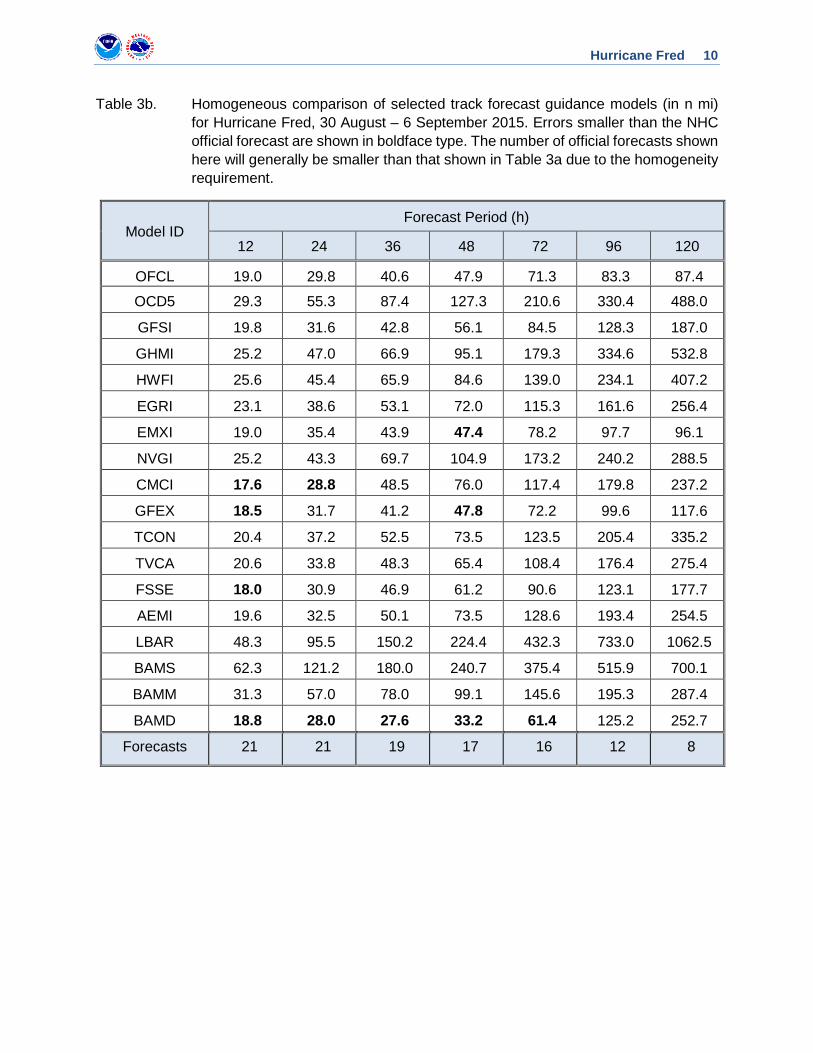
A verification of NHC official track forecasts for Fred is given in Table 3a. Official forecast track errors were significantly lower than the mean official errors for the previous 5-yr period. A homogeneous comparison of the official track errors with selected guidance models is given in Table 3b. The track guidance and the official forecasts correctly assessed the various aspects of Fred’s track, including the aclimatological northwestward track through Cabo Verde. The deep
3 Deaths occurring as a direct result of the forces of the tropical cyclone are referred to as “direct” deaths. These would include those persons who drowned in storm surge, rough seas, rip currents, and freshwater floods. Direct deaths also include casualties resulting from lightning and wind-related events (e.g., collapsing structures). Deaths occurring from such factors as heart attacks, house fires, electrocutions from downed power lines, vehicle accidents on wet roads, etc., are considered indirect” deaths.
Hurricane Fred 5
version of the Beta and Advection Model (BAMD) had the best overall performance of the track guidance with lower errors than the official forecast at 12-72 h.
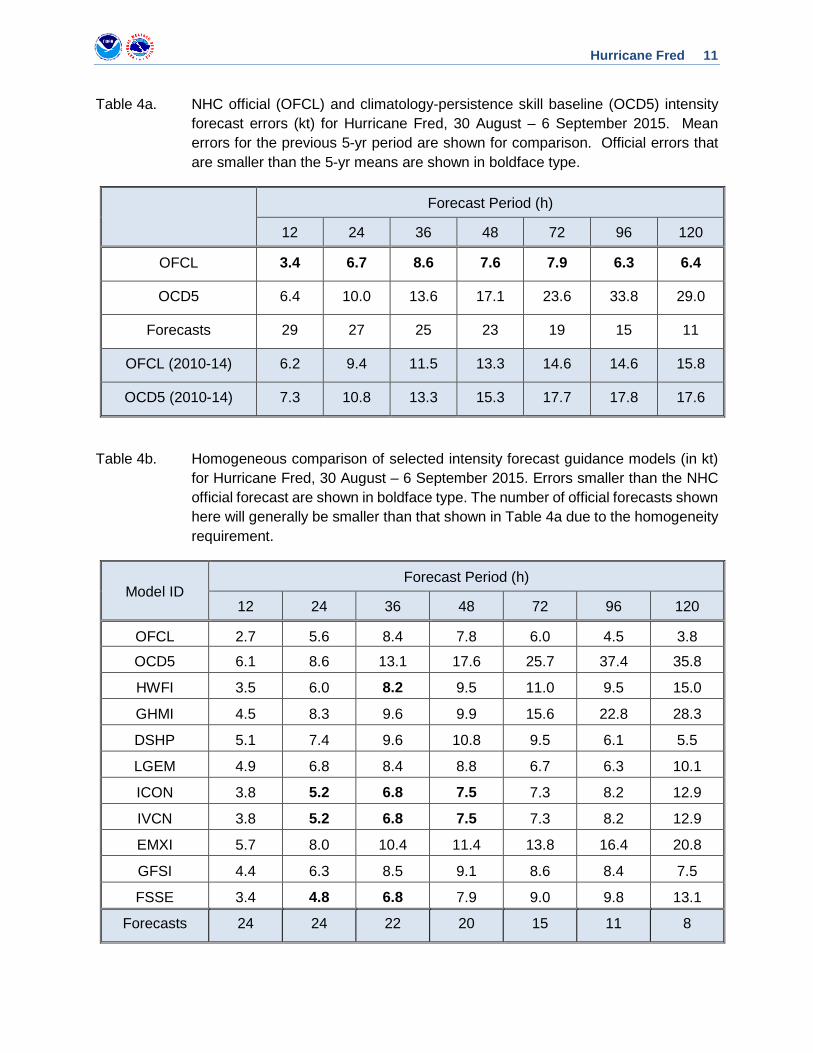
A verification of NHC official intensity forecasts for Fred is given in Table 4a. Official forecast intensity errors were lower than the mean official errors for the previous 5-yr period at all forecast times. A homogeneous comparison of the official intensity errors with selected guidance models is given in Table 4b. Generally the official forecasts were better than the intensity guidance. However, they had higher errors than the intensity consensus models ICON and IVCN at 24-48 h.
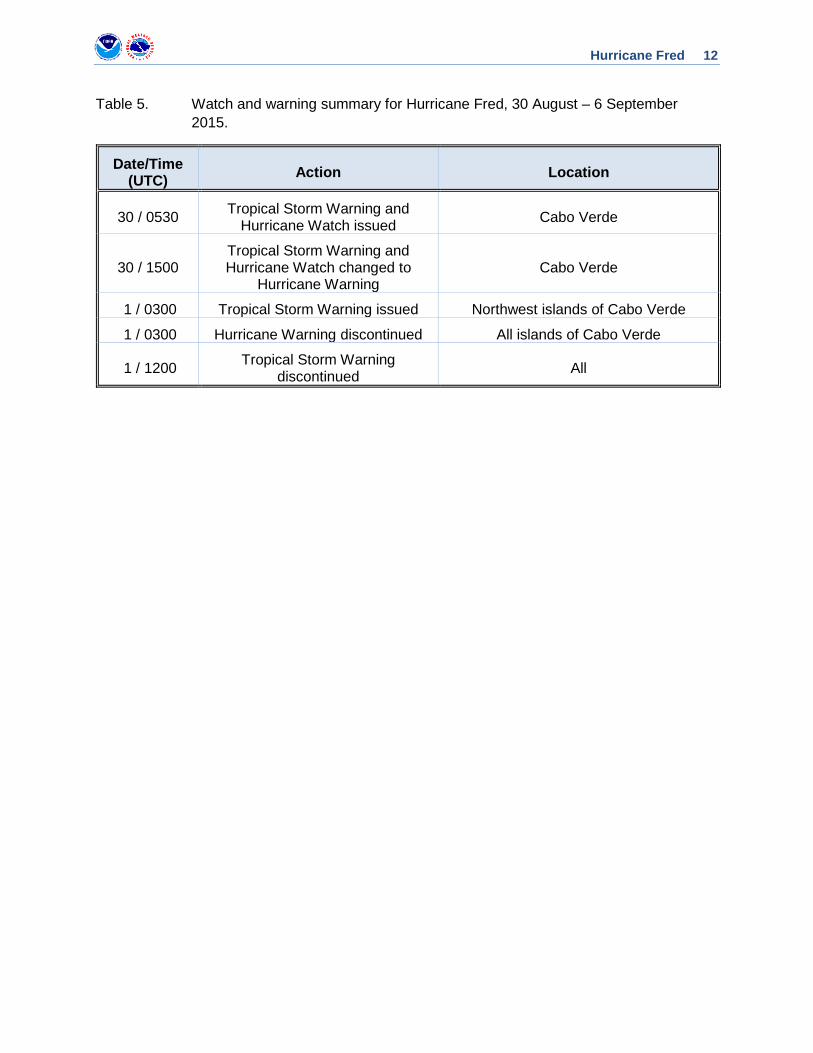
Watches and warnings associated with Fred are given in Table 5. A hurricane watch was issued for Cabo Verde on the first advisory, which was about 36 h before the center of Fred started to pass through the islands. A subsequent hurricane warning was issued about 27 h before the center reached the islands.
Hurricane Fred 6
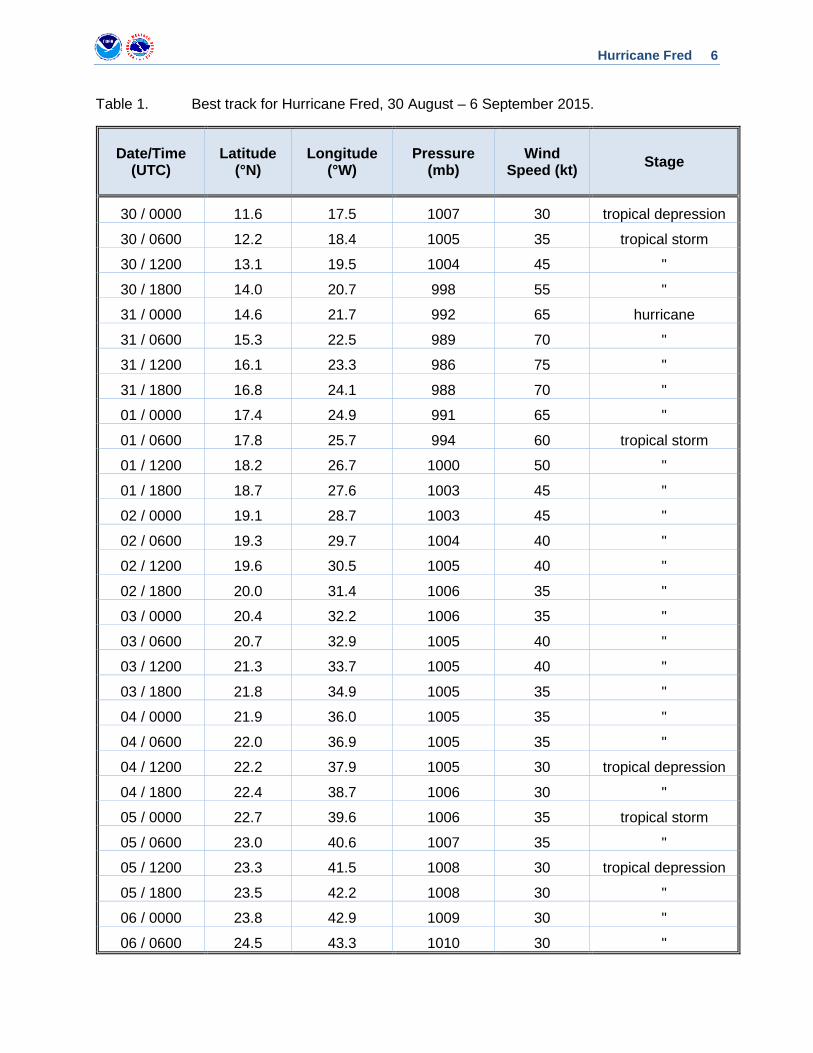
Table 1. Best track for Hurricane Fred, 30 August – 6 September 2015.
Date/Time (UTC)
Latitude (°N)
Longitude (°W)
Pressure (mb)
Wind Speed (kt) Stage
30 / 0000 11.6 17.5 1007 30 tropical depression
30 / 0600 12.2 18.4 1005 35 tropical storm
30 / 1200 13.1 19.5 1004 45 "
30 / 1800 14.0 20.7 998 55 "
31 / 0000 14.6 21.7 992 65 hurricane
31 / 0600 15.3 22.5 989 70 "
31 / 1200 16.1 23.3 986 75 "
31 / 1800 16.8 24.1 988 70 "
01 / 0000 17.4 24.9 991 65 "
01 / 0600 17.8 25.7 994 60 tropical storm
01 / 1200 18.2 26.7 1000 50 "
01 / 1800 18.7 27.6 1003 45 "
02 / 0000 19.1 28.7 1003 45 "
02 / 0600 19.3 29.7 1004 40 "
02 / 1200 19.6 30.5 1005 40 "
02 / 1800 20.0 31.4 1006 35 "
03 / 0000 20.4 32.2 1006 35 "
03 / 0600 20.7 32.9 1005 40 "
03 / 1200 21.3 33.7 1005 40 "
03 / 1800 21.8 34.9 1005 35 "
04 / 0000 21.9 36.0 1005 35 "
04 / 0600 22.0 36.9 1005 35 "
04 / 1200 22.2 37.9 1005 30 tropical depression
04 / 1800 22.4 38.7 1006 30 "
05 / 0000 22.7 39.6 1006 35 tropical storm
05 / 0600 23.0 40.6 1007 35 "
05 / 1200 23.3 41.5 1008 30 tropical depression
05 / 1800 23.5 42.2 1008 30 "
06 / 0000 23.8 42.9 1009 30 "
06 / 0600 24.5 43.3 1010 30 "

Hurricane Fred 7
06 / 1200 25.3 43.2 1010 25 "
06 / 1800 dissipated
31 / 1200 16.1 23.3 986 75 minimum pressure and maximum winds
Hurricane Fred 8
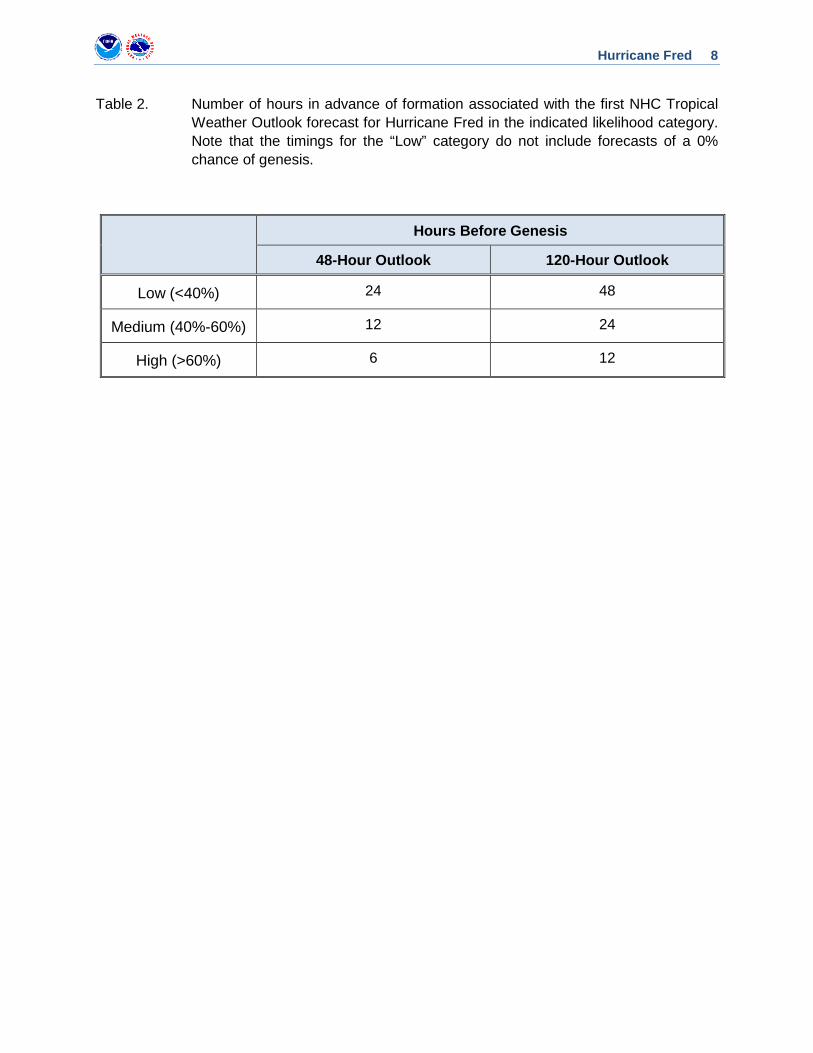
Table 2. Number of hours in advance of formation associated with the first NHC Tropical Weather Outlook forecast for Hurricane Fred in the indicated likelihood category. Note that the timings for the “Low” category do not include forecasts of a 0% chance of genesis.
Hours Before Genesis
48-Hour Outlook 120-Hour Outlook
Low (<40%) 24 48
Medium (40%-60%) 12 24
High (>60%) 6 12
Hurricane Fred 9
Table 3a. NHC official (OFCL) and climatology-persistence skill baseline (OCD5) track forecast errors (n mi) for Hurricane Fred, 30 August – 6 September 2015. Mean errors for the previous 5-yr period are shown for comparison. Official errors that are smaller than the 5-yr means are shown in boldface type.
Forecast Period (h)
12 24 36 48 72 96 120
OFCL 19.0 30.6 39.5 45.9 68.3 87.9 104.1
OCD5 29.4 50.0 80.4 112.8 196.1 297.4 411.6
Forecasts 29 27 25 23 19 15 11
OFCL (2010-14) 28.4 45.0 60.4 77.1 113.1 157.8 210.0
OCD5 (2010-14) 48.3 101.5 161.5 222.6 329.8 412.6 483.9
Hurricane Fred 10
Table 3b. Homogeneous comparison of selected track forecast guidance models (in n mi) for Hurricane Fred, 30 August – 6 September 2015. Errors smaller than the NHC official forecast are shown in boldface type. The number of official forecasts shown here will generally be smaller than that shown in Table 3a due to the homogeneity requirement.
Model ID Forecast Period (h)
12 24 36 48 72 96 120
OFCL 19.0 29.8 40.6 47.9 71.3 83.3 87.4
OCD5 29.3 55.3 87.4 127.3 210.6 330.4 488.0
GFSI 19.8 31.6 42.8 56.1 84.5 128.3 187.0
GHMI 25.2 47.0 66.9 95.1 179.3 334.6 532.8
HWFI 25.6 45.4 65.9 84.6 139.0 234.1 407.2
EGRI 23.1 38.6 53.1 72.0 115.3 161.6 256.4
EMXI 19.0 35.4 43.9 47.4 78.2 97.7 96.1
NVGI 25.2 43.3 69.7 104.9 173.2 240.2 288.5
CMCI 17.6 28.8 48.5 76.0 117.4 179.8 237.2
GFEX 18.5 31.7 41.2 47.8 72.2 99.6 117.6
TCON 20.4 37.2 52.5 73.5 123.5 205.4 335.2
TVCA 20.6 33.8 48.3 65.4 108.4 176.4 275.4
FSSE 18.0 30.9 46.9 61.2 90.6 123.1 177.7
AEMI 19.6 32.5 50.1 73.5 128.6 193.4 254.5
LBAR 48.3 95.5 150.2 224.4 432.3 733.0 1062.5
BAMS 62.3 121.2 180.0 240.7 375.4 515.9 700.1
BAMM 31.3 57.0 78.0 99.1 145.6 195.3 287.4
BAMD 18.8 28.0 27.6 33.2 61.4 125.2 252.7
Forecasts 21 21 19 17 16 12 8
Hurricane Fred 11
Table 4a. NHC official (OFCL) and climatology-persistence skill baseline (OCD5) intensity forecast errors (kt) for Hurricane Fred, 30 August – 6 September 2015. Mean errors for the previous 5-yr period are shown for comparison. Official errors that are smaller than the 5-yr means are shown in boldface type.
Forecast Period (h)
12 24 36 48 72 96 120
OFCL 3.4 6.7 8.6 7.6 7.9 6.3 6.4
OCD5 6.4 10.0 13.6 17.1 23.6 33.8 29.0
Forecasts 29 27 25 23 19 15 11
OFCL (2010-14) 6.2 9.4 11.5 13.3 14.6 14.6 15.8
OCD5 (2010-14) 7.3 10.8 13.3 15.3 17.7 17.8 17.6
Table 4b. Homogeneous comparison of selected intensity forecast guidance models (in kt) for Hurricane Fred, 30 August – 6 September 2015. Errors smaller than the NHC official forecast are shown in boldface type. The number of official forecasts shown here will generally be smaller than that shown in Table 4a due to the homogeneity requirement.
Model ID Forecast Period (h)
12 24 36 48 72 96 120
OFCL 2.7 5.6 8.4 7.8 6.0 4.5 3.8
OCD5 6.1 8.6 13.1 17.6 25.7 37.4 35.8
HWFI 3.5 6.0 8.2 9.5 11.0 9.5 15.0
GHMI 4.5 8.3 9.6 9.9 15.6 22.8 28.3
DSHP 5.1 7.4 9.6 10.8 9.5 6.1 5.5
LGEM 4.9 6.8 8.4 8.8 6.7 6.3 10.1
ICON 3.8 5.2 6.8 7.5 7.3 8.2 12.9
IVCN 3.8 5.2 6.8 7.5 7.3 8.2 12.9
EMXI 5.7 8.0 10.4 11.4 13.8 16.4 20.8
GFSI 4.4 6.3 8.5 9.1 8.6 8.4 7.5
FSSE 3.4 4.8 6.8 7.9 9.0 9.8 13.1
Forecasts 24 24 22 20 15 11 8
Hurricane Fred 12
Table 5. Watch and warning summary for Hurricane Fred, 30 August – 6 September 2015.
Date/Time (UTC) Action Location
30 / 0530 Tropical Storm Warning and Hurricane Watch issued Cabo Verde
30 / 1500 Tropical Storm Warning and Hurricane Watch changed to
Hurricane Warning Cabo Verde
1 / 0300 Tropical Storm Warning issued Northwest islands of Cabo Verde
1 / 0300 Hurricane Warning discontinued All islands of Cabo Verde
1 / 1200 Tropical Storm Warning discontinued All
Hurricane Fred 13
Figure 1. Best track positions for Hurricane Fred, 30 August – 6 September 2015.
Hurricane Fred 14
Figure 2. Selected wind observations and best track maximum sustained surface wind speed curve for Hurricane Fred, 30 August – 6 September 2015. Advanced Dvorak Technique estimates represent the Current Intensity at the nominal observation time. AMSU intensity estimates are from the Cooperative Institute for Meteorological Satellite Studies technique. Dashed vertical lines correspond to 0000 UTC.
20
30
40
50
60
70
80
90
8/29 8/31 9/2 9/4 9/6 9/8
BEST TRACKSat (TAFB)Sat (SAB)ADTScatterometerSurfaceAMSU
Win
d Sp
eed
(kt)
Date (Month/Day)
Hurricane Fred30 August - 6 September 2015
Hurricane Fred 15
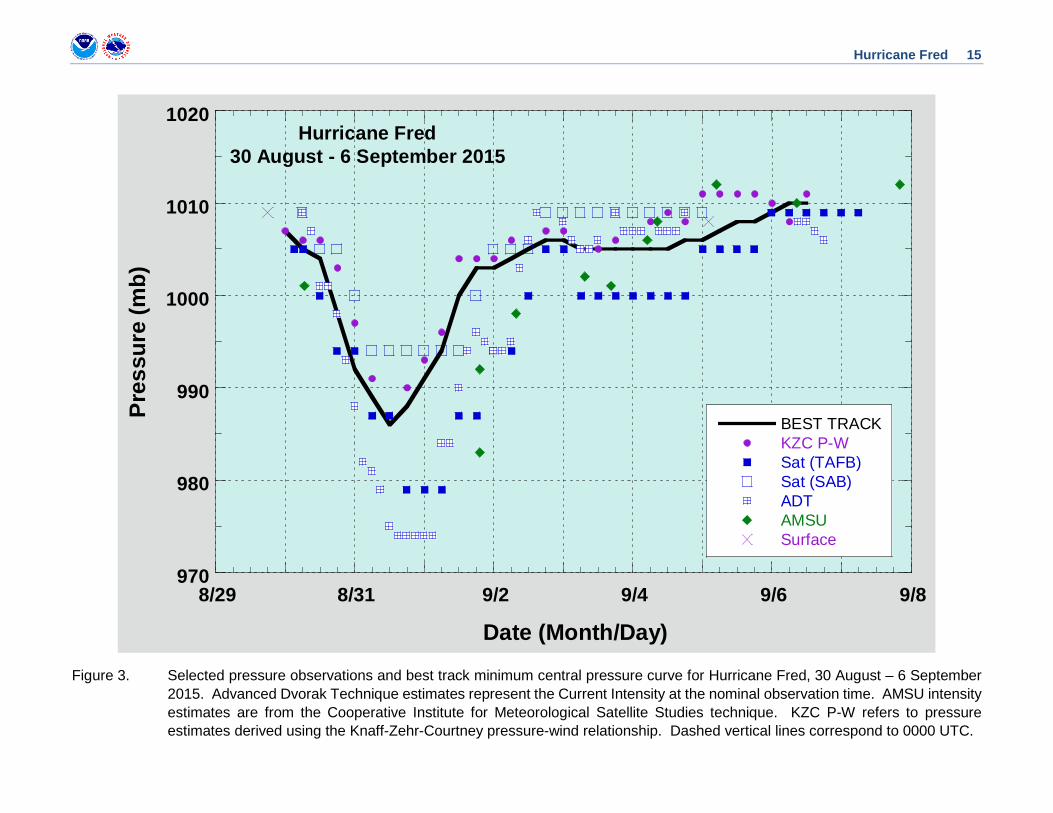
Figure 3. Selected pressure observations and best track minimum central pressure curve for Hurricane Fred, 30 August – 6 September 2015. Advanced Dvorak Technique estimates represent the Current Intensity at the nominal observation time. AMSU intensity estimates are from the Cooperative Institute for Meteorological Satellite Studies technique. KZC P-W refers to pressure estimates derived using the Knaff-Zehr-Courtney pressure-wind relationship. Dashed vertical lines correspond to 0000 UTC.
970
980
990
1000
1010
1020
8/29 8/31 9/2 9/4 9/6 9/8
BEST TRACKKZC P-WSat (TAFB)Sat (SAB)ADTAMSUSurface
Pres
sure
(mb)
Date (Month/Day)
Hurricane Fred30 August - 6 September 2015
Hurricane Fred 16
Figure 4. 36 Ghz composite imagery from the NASA GPM satellite at 0236 UTC 30 August (left) and 37 Ghz composite imagery from the Department of Defense Windsat satellite at 0742 UTC 30 August. Imagery courtesy of the Naval Research Laboratory.