Embed Size (px)
Citation preview

Prepared in cooperation with the City of Grain Valley, Missouri
Hydraulic Analyses of Sni-A-Bar Creek and Selected Tributaries at Grain Valley, Jackson County, Missouri
Scientific Investigations Report 2008–5051
U.S. Department of the InteriorU.S. Geological Survey


Hydraulic Analyses of Sni-A-Bar Creek and Selected Tributaries at Grain Valley, Jackson County, MissouriBy Paul H. Rydlund, Jr., William Otero-Benítez, and David C. Heimann
Prepared in cooperation with the City of Grain Valley, Missouri
Scientific Investigations Report 2008–5051
U.S. Department of the InteriorU.S. Geological Survey

U.S. Department of the InteriorDIRK KEMPTHORNE, Secretary
U.S. Geological SurveyMark D. Myers, Director
U.S. Geological Survey, Reston, Virginia: 2008
For product and ordering information: World Wide Web: http://www.usgs.gov/pubprod Telephone: 1-888-ASK-USGS
For more information on the USGS--the Federal source for science about the Earth, its natural and living resources, natural hazards, and the environment: World Wide Web: http://www.usgs.gov Telephone: 1-888-ASK-USGS
Any use of trade, product, or firm names is for descriptive purposes only and does not imply endorsement by the U.S. Government.
Although this report is in the public domain, permission must be secured from the individual copyright owners to reproduce any copyrighted materials contained within this report.
Suggested citation:Rydlund, P.H., Jr., Otero-Benítez, W. and Heimann, D.C., 2008, Hydraulic analyses of Sni-A-Bar Creek and selected trib-utaries at Grain Valley, Jackson County, Missouri: U.S. Geological Survey Scientific Investigations Report 2008–5051, 57 p. plus films.

iii
Contents
Abstract ..........................................................................................................................................................1Introduction.....................................................................................................................................................1
Purpose and Scope ..............................................................................................................................1Description of Study Area ...................................................................................................................4
Methods...........................................................................................................................................................4Development of One-Dimensional Models .......................................................................................4
Cross Sections and Extent of Models ......................................................................................4Cross-Section Attributes ............................................................................................................7Topographic Information ............................................................................................................7HEC-RAS Model Boundary Conditions ...................................................................................11Bridges and Culverts .................................................................................................................19
HEC-RAS Model Calibration ..............................................................................................................19Development of the Two-Dimensional Model ................................................................................20FESWMS Model Calibration .............................................................................................................23Sources of Errors in HEC-RAS and FESWMS Models ..................................................................25
Hydraulic Analyses of Sni-A-Bar Creek (HEC-RAS Results) ................................................................25Hydraulic Analyses of Sni-A-Bar Creek (FESWMS Results) ................................................................26Hydraulic Analyses of Sni-A-Bar Creek Tributaries ...............................................................................37
Hydraulic Structures Performance .........................................................................................37Flood Plain Determination ........................................................................................................37
Summary........................................................................................................................................................56References Cited..........................................................................................................................................56
Figures 1–8. Maps showing— 1. Location of Sni-A-Bar Creek Basin within Jackson County, Missouri .......................2 2. Location of Sni-A-Bar Creek main tributaries Blue Branch, Yennie Avenue
Drain, and Swiney Branch ................................................................................................3 3. Cross-section locations of a one-dimensional step-backwater model along
Sni-A-Bar Creek, Grain Valley, Missouri ..........................................................................5 4. Study area for the one-dimensional models ...................................................................6 5. Cross-section locations of the one-dimensional model along Blue Branch,
Grain Valley, Missouri .........................................................................................................8 6. Cross-section locations of the one-dimensional model along Blue Branch
Tributary, Grain Valley, Missouri .....................................................................................10 7. Cross-section locations of the one-dimensional model along Yennie Avenue
Drain, Grain Valley, Missouri ...........................................................................................12 8. Cross-section locations of the one-dimensional model above the long culvert
on Yennie Avenue Drain culvert overflow, Grain Valley, Missouri ............................14
iv
9–12. Maps showing— 9. Cross-section locations of the one-dimensional model of the reach upstream
from the long culvert (B-800) on Yennie Avenue Drain, Grain Valley, Missouri ......15 10. Cross-section locations of the one-dimensional model of Swiney Branch,
Grain Valley, Missouri .......................................................................................................16 11. Cross-section locations of the one-dimensional model of Swiney Branch
Tributary, Grain Valley, Missouri .....................................................................................18 12. Location of high-water marks from the June 3, 2005, flood along Sni-A-Bar
Creek, Grain Valley, Missouri ...........................................................................................22 13. Diagram showing the computational mesh [full model reach and focus reach
(inset)] used in the two-dimensional model of Sni-A-Bar Creek, Grain Valley, Missouri ........................................................................................................................................24
14. Graph showing simulated water-surface elevation profiles along Sni-A-Bar Creek, Grain Valley, Missouri ................................................................................................................27
15. Maps showing water-surface elevations of 10-, 50-, 100-, and 500-year recurrence interval floods along the full model reach of Sni-A-Bar Creek, Grain Valley, Missouri, simulated using a two-dimensional model .............................................................................28
16. Graphs showing water-surface elevation profiles through bridges along Sni-A-Bar Creek, Grain Valley, Missouri, for 10-, 50-, 100-, and 500-year recurrence interval floods simulated using a two-dimensional model .................................................................32
17–19. Maps showing— 17. Water depths of 10-, 50-, 100-, and 500-year recurrence interval floods along
the Sni-A-Bar Creek focus reach simulated using a two-dimensional model ........33 18. Water velocities of 10-, 50-, 100-, and 500-year recurrence interval floods
along the full model reach of Sni-A-Bar Creek, simulated using a two- dimensional model .............................................................................................................38
19. Water velocity magnitude and direction of 10-, 50-, 100-, and 500-year recurrence interval floods along the Sni-A-Bar Creek focus reach simulated using a two-dimensional model ......................................................................................42
20. Graphs showing water-surface elevation profiles of A, Blue Branch, B, Blue Branch Tributary, C, Yennie Avenue Drain, D, Swiney Branch, and E, Swiney Branch Tributary, Grain Valley, Missouri, for 10-, 50-, 100-, and 500-year recurrence interval events simulated using a one-dimensional model .............................................................................46
21–23. Maps showing— 21. Simulated flood plain for the 100-year recurrence interval flood along Blue
Branch and Blue Branch Tributary, Grain Valley, Missouri ........................................50 22. Simulated flood plain for the 100-year recurrence interval flood along Yennie
Avenue Drain, Grain Valley, Missouri .............................................................................52 23. Simulated flood plain for the 100-year recurrence interval flood along Swiney
Branch and Swiney Branch Tributary, Grain Valley, Missouri ...................................54

v
Tables 1. Length of stream and number of cross sections used in one-dimensional models
of Sni-A-Bar Creek and tributaries ............................................................................................4 2. Roughness coefficients used in the one-dimensional models of Sni-A-Bar Creek,
Blue Branch, Yennie Avenue Drain, and Swiney Branch ......................................................7 3. Downstream water-surface elevations defined for the one-dimensional models of
Sni-A-Bar Creek, Blue Branch, Yennie Avenue Drain, and Swiney Branch .....................11 5. Discharges used in Blue Branch one-dimensional model ..................................................11 4. Discharges used in the Sni-A-Bar Creek one-dimensional model ....................................11 6. Discharges used in the Blue Branch Tributary one-dimensional model ...........................14 7. Discharges used in the Yennie Avenue Drain downstream one-dimensional model .....15 8. Discharges used in the Yennie Avenue Drain culvert overflow one-dimensional
model ............................................................................................................................................19 9. Discharges used in the Yennie Avenue Drain upstream reach one-dimensional
model ............................................................................................................................................19 10. Discharges used in the Swiney Branch one-dimensional model ......................................20 11. Discharges used in the Swiney Branch Tributary model .....................................................20 12. Description of the hydraulic structures included in the Sni-A-Bar Creek and
tributary one-dimensional models ...........................................................................................21 13. Measured water-surface elevations along Sni-A-Bar Creek for the flood of
June 2005, and simulated water-surface elevations from the one-dimensional model ............................................................................................................................................23
14. Roughness and eddy viscosity coefficients used in the two-dimensional model ...........23 15. Boundary conditions used in the Sni-A-Bar Creek two-dimensional model ....................23 16. Summary statistics for simulated and observed water-surface elevations used
in the two-dimensional model calibration ..............................................................................25 17. High-water mark and simulated water-surface elevations including and excluding
contracted openings along Sni-A-Bar Creek for the flood of June 3, 2005 ......................26 18. Water-surface elevations with and without wastewater treatment plant
impoundment at the junction of Swiney Branch and Sni-A-Bar Creek .............................27 19. Summary statistics for 10-, 50-, 100-, and 500-year recurrence intervals for
Sni-A-Bar Creek simulated using the two-dimensional model ...........................................37 20. Summary of the performance of hydraulic structures in Blue Branch, Yennie
Avenue Drain, and Swiney Branch one-dimensional simulations. ....................................49

vi
FILMS 1. Flow trace of the Sni-A-Bar Creek focus reach for the simulated 10-year
recurrence interval flood 2. Flow trace of the Sni-A-Bar Creek focus reach for the simulated 50-year
recurrence interval flood 3. Flow trace of the Sni-A-Bar Creek focus reach for the simulated 100-year
recurrence interval flood 4. Flow trace of the Sni-A-Bar Creek focus reach for the simulated 500-year
recurrence interval flood 5. Flow trace of the Sni-A-Bar Creek full model reach for the simulated 10-year
recurrence interval flood 6. Flow trace of the Sni-A-Bar Creek full model reach for the simulated 50-year
recurrence interval flood 7. Flow trace of the Sni-A-Bar Creek full model reach for the simulated 100-year
recurrence interval flood 8. Flow trace of the Sni-A-Bar Creek full model reach for the simulated 500-year
recurrence interval flood

vii
Conversion Factors and Datums
Multiply By To obtain
Lengthinch (in.) 2.54 centimeter (cm)
foot (ft) 0.3048 meter (m)
mile (mi) 1.609 kilometer (km)
yard (yd) 0.9144 meter (m)
Areaacre 4,047 square meter (m2)
acre 0.4047 hectare (ha)
acre 0.004047 square kilometer (km2)
square foot (ft2) 0.09290 square meter (m2)
square mile (mi2) 259.0 hectare (ha)
square mile (mi2) 2.590 square kilometer (km2)
Volumecubic foot (ft3) 0.02832 cubic meter (m3)
acre-foot (acre-ft) 1,233 cubic meter (m3)
Flow ratefoot per second (ft/s) 0.3048 meter per second (m/s)
cubic foot per second (ft3/s) 0.02832 cubic meter per second (m3/s)
Slopefoot per mile (ft/mi) 0.18939 meter per kilometer (m/km)
Vertical coordinate information is referenced to the North American Vertical Datum of 1988 (NAVD 88).
Horizontal coordinate information is referenced to the North American Datum of 1983 (NAD 83).

viii
Hydraulic Analyses of Sni-A-Bar Creek and Selected Tributaries at Grain Valley, Jackson County, Missouri
By Paul H. Rydlund, Jr., William Otero-Benítez, and David C. Heimann
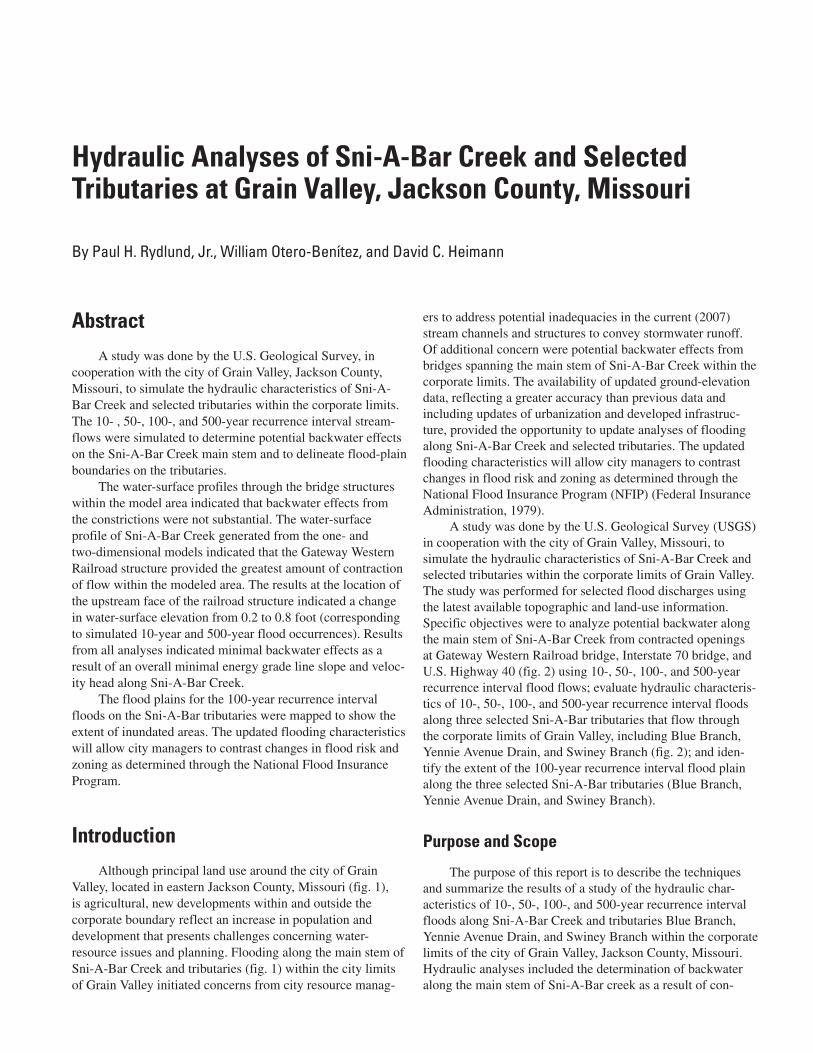
Abstract A study was done by the U.S. Geological Survey, in
cooperation with the city of Grain Valley, Jackson County, Missouri, to simulate the hydraulic characteristics of Sni-A-Bar Creek and selected tributaries within the corporate limits. The 10- , 50-, 100-, and 500-year recurrence interval stream-flows were simulated to determine potential backwater effects on the Sni-A-Bar Creek main stem and to delineate flood-plain boundaries on the tributaries.
The water-surface profiles through the bridge structures within the model area indicated that backwater effects from the constrictions were not substantial. The water-surface profile of Sni-A-Bar Creek generated from the one- and two-dimensional models indicated that the Gateway Western Railroad structure provided the greatest amount of contraction of flow within the modeled area. The results at the location of the upstream face of the railroad structure indicated a change in water-surface elevation from 0.2 to 0.8 foot (corresponding to simulated 10-year and 500-year flood occurrences). Results from all analyses indicated minimal backwater effects as a result of an overall minimal energy grade line slope and veloc-ity head along Sni-A-Bar Creek.
The flood plains for the 100-year recurrence interval floods on the Sni-A-Bar tributaries were mapped to show the extent of inundated areas. The updated flooding characteristics will allow city managers to contrast changes in flood risk and zoning as determined through the National Flood Insurance Program.
IntroductionAlthough principal land use around the city of Grain
Valley, located in eastern Jackson County, Missouri (fig. 1), is agricultural, new developments within and outside the corporate boundary reflect an increase in population and development that presents challenges concerning water-resource issues and planning. Flooding along the main stem of Sni-A-Bar Creek and tributaries (fig. 1) within the city limits of Grain Valley initiated concerns from city resource manag-
ers to address potential inadequacies in the current (2007) stream channels and structures to convey stormwater runoff. Of additional concern were potential backwater effects from bridges spanning the main stem of Sni-A-Bar Creek within the corporate limits. The availability of updated ground-elevation data, reflecting a greater accuracy than previous data and including updates of urbanization and developed infrastruc-ture, provided the opportunity to update analyses of flooding along Sni-A-Bar Creek and selected tributaries. The updated flooding characteristics will allow city managers to contrast changes in flood risk and zoning as determined through the National Flood Insurance Program (NFIP) (Federal Insurance Administration, 1979).
A study was done by the U.S. Geological Survey (USGS) in cooperation with the city of Grain Valley, Missouri, to simulate the hydraulic characteristics of Sni-A-Bar Creek and selected tributaries within the corporate limits of Grain Valley. The study was performed for selected flood discharges using the latest available topographic and land-use information. Specific objectives were to analyze potential backwater along the main stem of Sni-A-Bar Creek from contracted openings at Gateway Western Railroad bridge, Interstate 70 bridge, and U.S. Highway 40 (fig. 2) using 10-, 50-, 100-, and 500-year recurrence interval flood flows; evaluate hydraulic characteris-tics of 10-, 50-, 100-, and 500-year recurrence interval floods along three selected Sni-A-Bar tributaries that flow through the corporate limits of Grain Valley, including Blue Branch, Yennie Avenue Drain, and Swiney Branch (fig. 2); and iden-tify the extent of the 100-year recurrence interval flood plain along the three selected Sni-A-Bar tributaries (Blue Branch, Yennie Avenue Drain, and Swiney Branch).
Purpose and Scope
The purpose of this report is to describe the techniques and summarize the results of a study of the hydraulic char-acteristics of 10-, 50-, 100-, and 500-year recurrence interval floods along Sni-A-Bar Creek and tributaries Blue Branch, Yennie Avenue Drain, and Swiney Branch within the corporate limits of the city of Grain Valley, Jackson County, Missouri. Hydraulic analyses included the determination of backwater along the main stem of Sni-A-Bar creek as a result of con-

2 Hydraulic Analyses of Sni-A-Bar Creek and Selected Tributaries at Grain Valley, Jackson County, Missouri
Howell Road
94°06'94°12'94°18'
39°00'
38°54'
EXPLANATION
Sni-A-Bar Creek study basin boundary
Grain Valley city limit
0 2 4 MILES1
0 2 4 KILOMETERS1
Blue Branch
Swiney Branch
Yennie Avenue Drain
Sni-A-B
ar Creek
Base from U.S. Department of Agriculture 2006 National Agricultural Imagery Program (NAIP)Universal Transverse Mercator projection, Zone 15Horizontal coordinate information referenced to theNorth American Datum of 1983 (NAD 83)
MISSOURI
Sni-A-Bar Creek Basin
JacksonCounty
Studyarea
Figure 1. Location of Sni-A-Bar Creek Basin within Jackson County, Missouri.

Introduction 3
94°10'94°12'94°14'94°16'94°18'
39°04'
39°02'
39°00'
38°58'
0 1 2 MILES
0 1 2 KILOMETERS
EXPLANATION
Sni-A-Bar model reach
Yennie Avenue Basin
Swiney Branch Basin
Blue Branch Basin
Sni-A-Bar Creek Basin boundary
Grain Valley city limit
Base from U.S. Department of Agriculture 2006 NationalAgricultural Imagery Program (NAIP)Universal Transverse Mercator projection, Zone 15Horizontal coordinate information referenced to theNorth American Datum of 1983 (NAD 83)
Sni-A-Bar CreekStudy Basin
Sni-A-B
ar Creek
How
ell Road
Interstate-70bridge
GatewayWesternRailraodbridge
U.S. Highway40 bridge
Swiney Branch TributarySwiney
Branch
Avenue Drain
Yennie
Blue BranchTributary
Blue Branch Focus reach
Figure 2. Location of Sni-A-Bar Creek main tributaries Blue Branch, Yennie Avenue Drain, and Swiney Branch.

4 Hydraulic Analyses of Sni-A-Bar Creek and Selected Tributaries at Grain Valley, Jackson County, Missouri
tracted openings at waterway crossings. The 100-year recur-rence interval flood plain was mapped for all three Sni-A-Bar tributaries.
Description of Study Area
The study area consisted of the Sni-A-Bar Creek Basin upstream from Howell Road near Grain Valley, Missouri (figs. 1, 2). The drainage area of the basin is about 94.8 square miles (mi2) and primarily consists of agricultural land use. The Sni-A-Bar tributaries of interest within the city of Grain Valley included Blue Branch, Yennie Avenue Drain, and Swiney Branch. Blue Branch has a drainage area of 15.9 mi2 upstream from the junction with Sni-A-Bar Creek. The land use in the basin primarily is residential, but also includes agricultural and undeveloped areas (U.S. Department of Agriculture, 2006). Yennie Avenue Drain has a drainage area of 0.9 mi2 encom-passing the downtown part of the city of Grain Valley (fig. 2). The land use in this basin is a mix of residential, commercial, and industrial (U.S. Department of Agriculture, 2006; fig. 2). Swiney Branch has a contributing drainage area of 7.4 mi2 and is located on the northern boundary of the city of Grain Valley (fig. 2). Land use in this basin predominantly is agricultural with some commercial, industrial, and residential areas (U.S. Department of Agriculture, 2006). Future land-use planning information indicates that the Swiney Branch Basin will be moderately developed with single-family residential, commer-cial, and industrial areas (Burns and McDonnell Engineering Company, 2004).
MethodsMultiple hydraulic models were developed to address the
objectives of this study. The 10-, 50-, 100-, and 500-year flood discharges on the Sni-A-Bar Creek main stem were simulated using one-dimensional and two-dimensional hydraulic models. Analyses of the 10-, 50-, 100-, and 500-year recurrence inter-val floods and development of the 100-year recurrence interval flood plain on Blue Branch, Yennie Avenue Drain, and Swiney Branch were conducted using separate one-dimensional mod-els for each tributary.
Development of One-Dimensional Models
The Hydrologic Engineering Center–River Analysis System (HEC-RAS) version 3.3.1 was used for the one-dimensional analyses. HEC-RAS is a graphical user interface (GUI) used to facilitate the use of a steady, gradually varied flow model developed by the U.S. Army Corps of Engineers (USACE) Hydrologic Engineering Center (HEC; U.S. Army Corps of Engineers, 2002). The basic, steady-flow com-putational procedure is based on the solution of the one-dimensional energy equation. Energy losses were evaluated
by friction (Manning’s equation) and contraction/expansion coefficients. Products from the HEC-RAS models consisted of water–surface profiles for each of the simulated flows; for the Sni-A-Bar Creek tributary models, results also included flood-plain maps of the 100-year recurrence interval flood. The flood-plain analyses were performed using utilities within HEC-RAS.
Cross Sections and Extent of ModelsThe purpose of the one-dimensional models was to
develop an accurate representation of the hydraulic charac-teristics of the Sni-A-Bar main stem and tributaries. For this purpose, cross sections were located at primary slope breaks of the channel streambed profile and points of minimum and maximum cross-sectional area. In addition, cross sections were included in expanding reaches and bends (when pos-sible) to minimize errors. Abrupt changes in main channel and flood-plain roughness also were considered when selecting the location of the cross sections. All cross sections were located perpendicular to the flow direction. Some cross sections were described using multiple-line segments to assure each segment was perpendicular to the flow along the whole section width. The final number of cross sections used in the simulations was determined as a function of the length of the reaches, the hydraulic complexity of the area, and the level of detail desired for particular reaches.
The one-dimensional step-backwater model of the Sni-A-Bar Creek main stem was constructed with 38 cross sections and 3 bridge structures used to hydraulically simulate a 2.3-mile (mi) reach from a location upstream from Howell Road to a location immediately downstream from the junction with Blue Branch (fig. 3). The model extent and cross-section locations used to represent the Blue Branch, Yennie Avenue Drain, and Swiney Branch models are provided in table 1 and figures 4 through 11.
Table 1. Length of stream and number of cross sections used in one-dimensional models of Sni-A-Bar Creek and tributaries.
Model
Stream length (miles)
Number of cross
sectionsCorresponding
figure
Blue Branch 2.94 73 5
Blue Branch Tributary
.5 22 6
Yennie Avenue Drain 1.29 52 7
Yennie Avenue Drain Culvert overflow
.08 13 8
Yennie Avenue Drain upstream
.13 9 9
Swiney Branch 3.26 124 10
Swiney Branch Tributary
.91 35 11

Methods 5
94°10'94°10'30"94°11'94°11'30
39°02'
39°01'30"
39°01'
39°00'30"
0 1,000 2,000 3,000 4,000 FEET
0 500 1,000 METERS
Interstate Highway 70
Gateway Western Railroad
U.S. Highway 40
Howell Road
Sni-A-BarCreek
BlueBranch
Yennie AvenueDrain
SwineyBranch
Wastewater Treatment Facility
EXPLANATION
Cross-section location
Base from Center for Agricultural, Resource andEnvironmental Systems (CARES)Universal Transverse Mercator projection, Zone 15Horizontal coordinate information referenced to theNorth American Datum of 1983 (NAD 83)
Figure 3. Cross-section locations of a one-dimensional step-backwater model along Sni-A-Bar Creek, Grain Valley, Missouri.
The topographical information for the cross sections was extracted from a 2-meter (m) digital elevation model (DEM) comprised of Light Detection and Ranging (LiDAR) data. The extraction process was accomplished using a Geographic Information System (GIS) software extension, HEC-GeoRAS, developed by the Hydrologic Engineering Center of the U.S. Army Corp of Engineers (U.S. Army Corps of Engineers, 2006). HEC-GeoRAS allows for the preparation of geometric data to be imported into HEC-RAS, and facilitates the process of exporting HEC-RAS results into a graphical format.
Hydraulic structures were defined using four cross sec-tions in accordance with recommendations provided in U.S. Army Corps of Engineers (2002). These four cross sections included two upstream and two downstream from the struc-ture. The two cross sections upstream are used to model the contracting reach occurring upstream from a hydraulic struc-ture, such as a bridge or culvert. The two cross sections down-stream are intended to model the expanding reach occurring at the exit of the hydraulic structure. Additional suggestions for the one-dimensional modeling of hydraulic structures and the

6 Hydraulic Analyses of Sni-A-Bar Creek and Selected Tributaries at Grain Valley, Jackson County, Missouri
Figu
re 5
Figu
re 6
Figu
re 7
Figu
re 8
Figu
re 9
Figu
re 1
0
Figu
re 1
1
Figu
re 3
Ryan
Roa
d
Dunc
an R
oad
Rust Road
Tyer Road
Seymour Road
Tarsney RoadMain Street
Minter Road
Yenn
ie A
venu
e
Dillingham Road
Meadow Lane
Rust
ic C
ircle
Ryan
Roa
d
Seymour Road
§̈ ¦70
§̈ ¦70
§̈ ¦70
£ ¤40
£ ¤40
Sni-A-Bar Creek
Swin
ey B
ranc
h
Swin
ey
Branch Tributary
Blu
e B
ranc
hTr
ibut
ary
Blu
e B
ranc
h
Yenn
ie A
venu
e D
rain
94°1
0'94
°11'
94°1
2'94
°13'
94°1
4'94
°15'
39°0
2'
39°0
1'
39°0
0'
38°5
9'
39°0
3'
01
MIL
E0.
5
01
KILO
MET
ER0.
5
EX
PL
AN
AT
ION
Stud
y ar
ea
Bas
e fr
om U
.S. G
eolo
gica
l Sur
vey
digi
tal d
ata,
1:1
00,0
00, 1
990
Uni
vers
al T
rans
vers
e M
erca
tor
proj
ectio
nZ
one
15
Figu
re 4
. St
udy
area
for t
he o
ne-d
imen
sion
al m
odel
s.
Methods 7
correct representation of expanding and contracting reaches are provided in U.S. Army Corps of Engineers (1995).
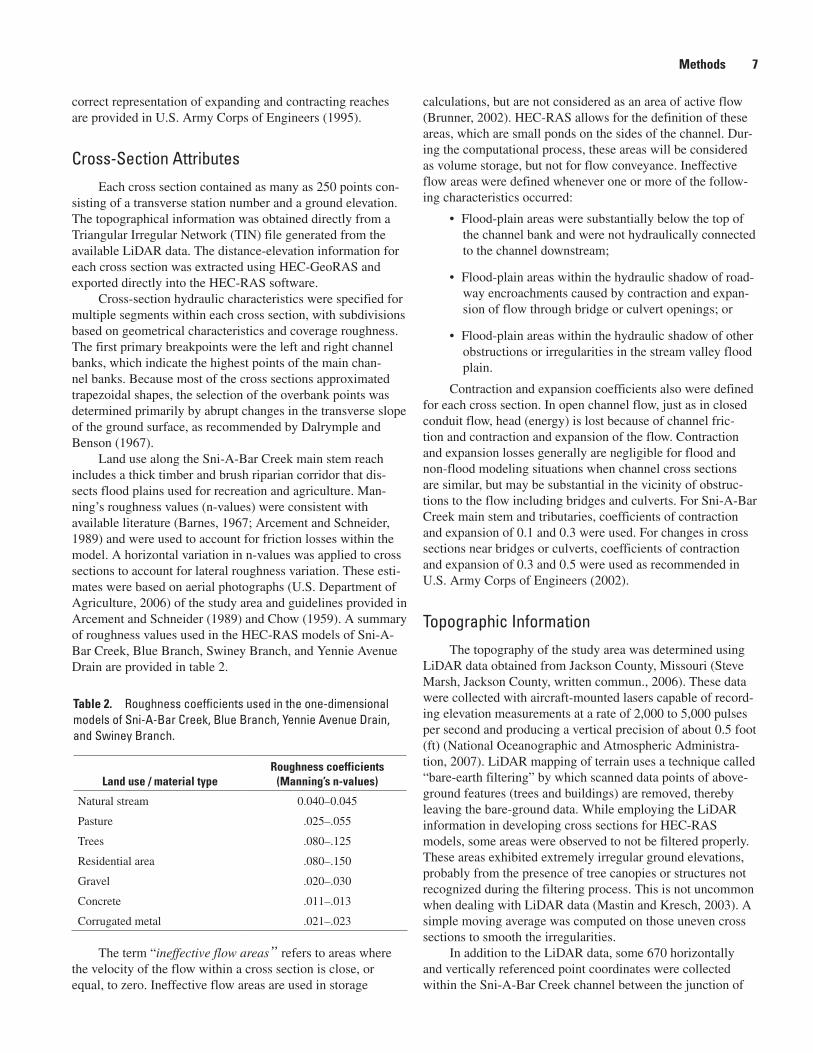
Cross-Section AttributesEach cross section contained as many as 250 points con-
sisting of a transverse station number and a ground elevation. The topographical information was obtained directly from a Triangular Irregular Network (TIN) file generated from the available LiDAR data. The distance-elevation information for each cross section was extracted using HEC-GeoRAS and exported directly into the HEC-RAS software.
Cross-section hydraulic characteristics were specified for multiple segments within each cross section, with subdivisions based on geometrical characteristics and coverage roughness. The first primary breakpoints were the left and right channel banks, which indicate the highest points of the main chan-nel banks. Because most of the cross sections approximated trapezoidal shapes, the selection of the overbank points was determined primarily by abrupt changes in the transverse slope of the ground surface, as recommended by Dalrymple and Benson (1967).
Land use along the Sni-A-Bar Creek main stem reach includes a thick timber and brush riparian corridor that dis-sects flood plains used for recreation and agriculture. Man-ning’s roughness values (n-values) were consistent with available literature (Barnes, 1967; Arcement and Schneider, 1989) and were used to account for friction losses within the model. A horizontal variation in n-values was applied to cross sections to account for lateral roughness variation. These esti-mates were based on aerial photographs (U.S. Department of Agriculture, 2006) of the study area and guidelines provided in Arcement and Schneider (1989) and Chow (1959). A summary of roughness values used in the HEC-RAS models of Sni-A-Bar Creek, Blue Branch, Swiney Branch, and Yennie Avenue Drain are provided in table 2.
Table 2. Roughness coefficients used in the one-dimensional models of Sni-A-Bar Creek, Blue Branch, Yennie Avenue Drain, and Swiney Branch.
Land use / material typeRoughness coefficients
(Manning’s n-values)
Natural stream 0.040–0.045
Pasture .025–.055
Trees .080–.125
Residential area .080–.150
Gravel .020–.030
Concrete .011–.013
Corrugated metal .021–.023
The term “ineffective flow areas” refers to areas where the velocity of the flow within a cross section is close, or equal, to zero. Ineffective flow areas are used in storage
calculations, but are not considered as an area of active flow (Brunner, 2002). HEC-RAS allows for the definition of these areas, which are small ponds on the sides of the channel. Dur-ing the computational process, these areas will be considered as volume storage, but not for flow conveyance. Ineffective flow areas were defined whenever one or more of the follow-ing characteristics occurred:
Flood-plain areas were substantially below the top of •the channel bank and were not hydraulically connected to the channel downstream;
Flood-plain areas within the hydraulic shadow of road-•way encroachments caused by contraction and expan-sion of flow through bridge or culvert openings; or
Flood-plain areas within the hydraulic shadow of other •obstructions or irregularities in the stream valley flood plain.
Contraction and expansion coefficients also were defined for each cross section. In open channel flow, just as in closed conduit flow, head (energy) is lost because of channel fric-tion and contraction and expansion of the flow. Contraction and expansion losses generally are negligible for flood and non-flood modeling situations when channel cross sections are similar, but may be substantial in the vicinity of obstruc-tions to the flow including bridges and culverts. For Sni-A-Bar Creek main stem and tributaries, coefficients of contraction and expansion of 0.1 and 0.3 were used. For changes in cross sections near bridges or culverts, coefficients of contraction and expansion of 0.3 and 0.5 were used as recommended in U.S. Army Corps of Engineers (2002).
Topographic InformationThe topography of the study area was determined using
LiDAR data obtained from Jackson County, Missouri (Steve Marsh, Jackson County, written commun., 2006). These data were collected with aircraft-mounted lasers capable of record-ing elevation measurements at a rate of 2,000 to 5,000 pulses per second and producing a vertical precision of about 0.5 foot (ft) (National Oceanographic and Atmospheric Administra-tion, 2007). LiDAR mapping of terrain uses a technique called “bare-earth filtering” by which scanned data points of above-ground features (trees and buildings) are removed, thereby leaving the bare-ground data. While employing the LiDAR information in developing cross sections for HEC-RAS models, some areas were observed to not be filtered properly. These areas exhibited extremely irregular ground elevations, probably from the presence of tree canopies or structures not recognized during the filtering process. This is not uncommon when dealing with LiDAR data (Mastin and Kresch, 2003). A simple moving average was computed on those uneven cross sections to smooth the irregularities.
In addition to the LiDAR data, some 670 horizontally and vertically referenced point coordinates were collected within the Sni-A-Bar Creek channel between the junction of

Methods 98 Hydraulic Analyses of Sni-A-Bar Creek and Selected Tributaries at Grain Valley, Jackson County, Missouri
39°00'30"
39°00'
94°11'30"94°12'94°12'30"94°13'94°13'30"94°14'
EXPLANATION
Cross-section location
Hydraulic structure
Blue Branch
Blue Branch Tributary
Base from U.S. Department of Agriculture 2006 National Agricultural Imagery Program (NAIP)Universal Transverse Mercator projection, Zone 15Horizontal coordinate information referenced to the North American Datum of 1983 (NAD 83)
0 250 500 750 1,000 METERS
0 1,000 2,000 3,000 4,000 FEET
Structure BB-100culvert
Structure BB-900bridge
Structure BB-1400culvert
Structure BB-1600culvert
U.S. Highway 40
Tars
ney
Road
Min
ter R
oad
Figure 5. Cross-section locations of the one-dimensional model along Blue Branch, Grain Valley, Missouri.

10 Hydraulic Analyses of Sni-A-Bar Creek and Selected Tributaries at Grain Valley, Jackson County, Missouri
94°13'30"94°13'40"94°13'50"94°14'
39°01'
39°00'50"
39°00'40"
39°00'30"
0 200 400 600 FEET
0 50 100 150 METERSEXPLANATION
Cross-section location
Hydraulic structure
Structure BB-500bridge
Base from U.S. Department of Agriculture 2006 National Agricultural Imagery Program (NAIP)Universal Transverse Mercator projection, Zone 15Horizontal coordinate information referenced to the North American Datum of 1983 (NAD 83)
U.S. Highway 40
Blue Branch Tributary
Blue Branch
Figure 6. Cross-section locations of the one-dimensional model along Blue Branch Tributary, Grain Valley, Missouri.
Methods 11
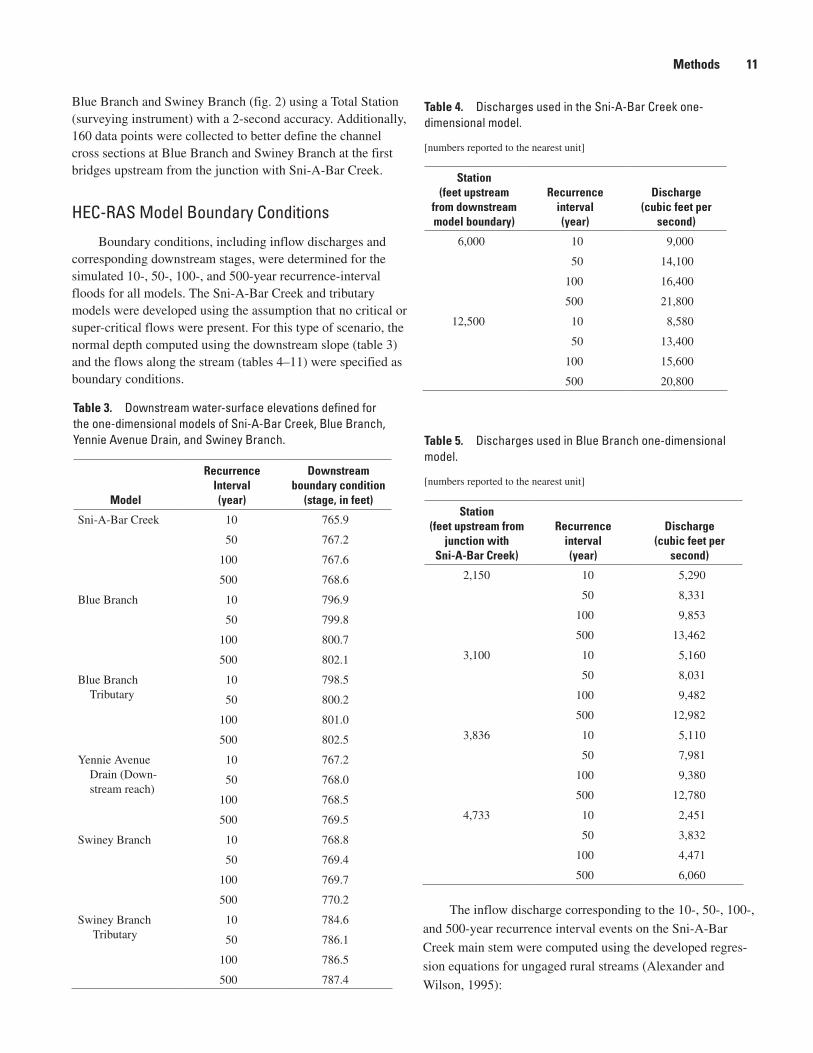
Blue Branch and Swiney Branch (fig. 2) using a Total Station (surveying instrument) with a 2-second accuracy. Additionally, 160 data points were collected to better define the channel cross sections at Blue Branch and Swiney Branch at the first bridges upstream from the junction with Sni-A-Bar Creek.
HEC-RAS Model Boundary Conditions
Boundary conditions, including inflow discharges and corresponding downstream stages, were determined for the simulated 10-, 50-, 100-, and 500-year recurrence-interval floods for all models. The Sni-A-Bar Creek and tributary models were developed using the assumption that no critical or super-critical flows were present. For this type of scenario, the normal depth computed using the downstream slope (table 3) and the flows along the stream (tables 4–11) were specified as boundary conditions.
Table 3. Downstream water-surface elevations defined for the one-dimensional models of Sni-A-Bar Creek, Blue Branch, Yennie Avenue Drain, and Swiney Branch.
Model
Recurrence Interval (year)
Downstream boundary condition
(stage, in feet)
Sni-A-Bar Creek 10 765.9
50 767.2
100 767.6
500 768.6
Blue Branch 10 796.9
50 799.8
100 800.7
500 802.1
Blue Branch Tributary
10 798.5
50 800.2
100 801.0
500 802.5
Yennie Avenue Drain (Down-stream reach)
10 767.2
50 768.0
100 768.5
500 769.5
Swiney Branch 10 768.8
50 769.4
100 769.7
500 770.2
Swiney Branch Tributary
10 784.6
50 786.1
100 786.5
500 787.4
Table 4. Discharges used in the Sni-A-Bar Creek one- dimensional model.
[numbers reported to the nearest unit]
Station (feet upstream
from downstream model boundary)
Recurrence interval (year)
Discharge (cubic feet per
second)
6,000 10 9,000
50 14,100
100 16,400
500 21,800
12,500 10 8,580
50 13,400
100 15,600
500 20,800
Table 5. Discharges used in Blue Branch one-dimensional model.
[numbers reported to the nearest unit]
Station (feet upstream from
junction with Sni-A-Bar Creek)
Recurrence interval (year)
Discharge (cubic feet per
second)
2,150 10 5,290
50 8,331
100 9,853
500 13,462
3,100 10 5,160
50 8,031
100 9,482
500 12,982
3,836 10 5,110
50 7,981
100 9,380
500 12,780
4,733 10 2,451
50 3,832
100 4,471
500 6,060
The inflow discharge corresponding to the 10-, 50-, 100-,
and 500-year recurrence interval events on the Sni-A-Bar
Creek main stem were computed using the developed regres-
sion equations for ungaged rural streams (Alexander and
Wilson, 1995):

Methods 1312 Hydraulic Analyses of Sni-A-Bar Creek and Selected Tributaries at Grain Valley, Jackson County, Missouri
94°11'94°11'15"94°11'30"94°11'45”94°12'94°12'15"
39°01'15"
39°01'
39°00'45"
Base from U.S. Department of Agriculture 2006 National Agricultural Imagery Program (NAIP)Universal Transverse Mercator projection, Zone 15Horizontal coordinate information referenced to the North American Datum of 1983 (NAD 83)
EXPLANATION
Cross-section location
Hydraulic structure
0 500 1,000 1,500 2,000 FEET
0 200 400 METERS
Interstate Highway 70
Yennie Avenue
Mai
n St
reet
U.S. Highway 40
Yennie Avenue Drain
Structure B-800Long culvert
Structure B-600culvert
Structure B-400culvert
Structure B-110culvert
Structure B-500culvert
Figure 7. Cross-section locations of the one-dimensional model along Yennie Avenue Drain, Grain Valley, Missouri.

14 Hydraulic Analyses of Sni-A-Bar Creek and Selected Tributaries at Grain Valley, Jackson County, Missouri
0 200 400 FEET
0 50 100 METERS
EXPLANATION
Cross-section location
Base from U.S. Department of Agriculture 2006 National Agricultural Imagery Program (NAIP)Universal Transverse Mercator projection, Zone 15Horizontal coordinate information referenced to the North American Datum of 1983 (NAD 83)
94°12'94°12'05"94°12'10"
39°01'05"
39°01'
Yennie Avenue
Yennie Avenue Drain
Figure 8. Cross-section locations of the one-dimensional model above the long culvert on Yennie Avenue Drain culvert overflow, Grain Valley, Missouri.
Q10
= 170 A0.680S0.378 (1) Q
50 = 305A0.660S0.356 (2)
Q100
=376A0.652S0.346 (3) Q 0.636 0.321
500=569A S (4)
with QT equal to the discharge associated with recurrence inter-
val of time T, in cubic feet per second (ft3/s); A is the drainage area, in square miles (mi2); and S is the channel slope, in feet per mile (ft/mi). The drainage area and channel slope for the Sni-A-Bar Creek upstream from Howell Road was determined using Geographic Information Systems (GIS) software.
The downstream boundary water-surface elevations used in the Sni-A-Bar Creek main stem models were determined from observed record or from normal-depth computations using HEC-RAS and the specified inflows. Flood-frequency profiles were developed from the step-backwater model by identifying a normal-depth slope [0.0026 foot/foot (ft/ft)] that would best fit the observed high-water mark profile. This slope was assumed
to represent the valley-controlled flow condition present along
Sni-A-Bar Creek and was used in conjunction with the 10-, 50-,
100-, and 500-year recurrence-interval flood discharges.
Table 6. Discharges used in the Blue Branch Tributary one-dimensional model.
[numbers are rounded to the nearest unit]
Station (feet upstream Recurrence Discharge
from junction with interval (cubic feet per Blue Branch) (year) second)
805 10 2,546
50 3,853
100 4,647
500 6,247

Methods 15
0 200 400 FEET
0 50 100 METERS
94°12'05"94°12'10"94°12'15"94°12'20"
39°01'10"
39°01'05"
39°01'
EXPLANATION
Cross-section location
Base from U.S. Department of Agriculture 2006 National Agricultural Imagery Program (NAIP)Universal Transverse Mercator projection, Zone 15Horizontal coordinate information referenced to the North American Datum of 1983 (NAD 83)
U.S. Highway 40
Yennie Avenue
Yennie Avenue Drain
Figure 9. Cross-section locations of the one-dimensional model of the reach upstream from the long culvert (B-800) on Yennie Avenue Drain, Grain Valley, Missouri.
Table 7. Discharges used in the Yennie Avenue Drain downstream one-dimensional model.
[numbers are rounded to the nearest unit]
Station (feet upstream
from junction with Sni-A-Bar Creek)
Recurrence interval (year)
Discharge (cubic feet per
second)
1,548 10 470
50 611
100 696
500 904
2,072 10 270
50 341
100 396
500 474
The drainage areas of Blue Branch, Yennie Avenue Drain, and Swiney Branch are small in comparison to the Sni-A-Bar Creek Basin, and because of this disparity in size, the timing of the simulated peak flows was not going to coincide (all the tributaries would release their peak flow long before the peak from Sni-A-Bar Creek occurred at the junction). Each tributary was, therefore, modeled without considering any backwater effect from Sni-A-Bar Creek. Normal elevations computed from the average downstream slope were used as the downstream boundary condition for all main stem models and their tributaries.
Stream basins comprise a system of sub-basins, each hav-ing particular geomorphological and hydraulic characteristics. For this reason, discharge will vary within natural channels. The hydrologic study performed by Burns and McDonnell Engineering Company (2004) quantified changes in discharge along Blue Branch, Yennie Avenue Drain, Swiney Branch, and their respective tributaries. The discharge values used in the

Methods 1716 Hydraulic Analyses of Sni-A-Bar Creek and Selected Tributaries at Grain Valley, Jackson County, Missouri
EXPLANATION
Cross-section location
Hydraulic structure
Base from U.S. Department of Agriculture 2006 National Agricultural Imagery Program (NAIP)Universal Transverse Mercator projection, Zone 15Horizontal coordinate information referenced to the North American Datum of 1983 (NAD 83)
0 1,000 2,000 3,000 4,000 FEET
0 250 500 750 1,000 METERS
39°02'
39°01'30"
94°11'94°11'30"94°12'94°12'30"94°13'
Structure SB-100culvert
Structure SB-200culvert
Structure SB-1300culvert
Structure SB-1700culvert
Structure SB-1800culvert
Structure SB-1900culvert
Swiney Branch
Swiney B
ranch Tributary
Duncan Road
Interstate Highway 70
Rust
Roa
d
Seym
our R
oad
Figure 10. Cross-section locations of the one-dimensional model of Swiney Branch, Grain Valley, Missouri.

18 Hydraulic Analyses of Sni-A-Bar Creek and Selected Tributaries at Grain Valley, Jackson County, Missouri
EXPLANATION
Cross-section location
Hydraulic structure
Base from U.S. Department of Agriculture 2006 National Agricultural Imagery Program (NAIP)Universal Transverse Mercator projection, Zone 15Horizontal coordinate information referenced to the North American Datum of 1983 (NAD 83)
0 200 400 600 FEET
0 50 100 150 METERS
39°02'20"
39°02'10"
39°02'
94°11'50"94°12'94°12'10"94°12'20"
Swin
ey B
ranc
h Tr
ibut
ary
Swiney Branch
Structure SB-300culvert
Structure SB-100culvert
Duncan Road
Rust
Roa
d
Figure 11. Cross-section locations of the one-dimensional model of Swiney Branch Tributary, Grain Valley, Missouri.
Methods 19
USGS models for Blue Branch and Swiney Branch (and their respective tributaries) were based on the information provided in this hydrologic study for the conditions existing at the time. The discharge values for Yennie Avenue Drain were obtained from a 2005 study conducted by the city of Grain Valley to evaluate the effects of constructed stormwater detention ponds (Rick Arroyo, City of Grain Valley, written commun., 2007). All flows in USGS models were assigned to the cross section nearest to the location of a discharge change as reported in Burns and MacDonnell Engineering Company (2004).
Table 8. Discharges used in the Yennie Avenue Drain culvert overflow one-dimensional model.
[numbers are rounded to the nearest unit]
Station (feet upstream from junction with Sni-
A-Bar Creek)
Recurrence interval (year)
Discharge (cubic feet per
second)
1,823 10 270
50 341
100 396
500 474
1,941 10 69
50 147
100 199
500 279
1,944 10 270
50 341
100 396
500 474
Bridges and Culverts
Most of the information regarding hydraulic structures (bridges and culverts) was lost from the LiDAR data through the filtering process. Consequently, the input data used in each HEC-RAS model for hydraulic structures were obtained from a previous hydraulic study of the area (Burns and McDonnell Engineering Company, 2004). Much of the structure informa-tion acquired was verified through onsite inspection, although a formal survey was not performed at each structure. Original plans of the hydraulic structures were not available.
Model representations of bridge structures at U.S. State Highway 40, Gateway Western Railroad, and Interstate 70 east and west bound lanes were constructed using bridge plans submitted by Jackson County, Gateway Western, and the Missouri Department of Transportation (MoDOT). East and west bound lane structures at Interstate 70 are separated by a median that is 35 ft wide, and both structures were simulated as a combined structure for flow computations. All the hydrau-
lic structures present in the tributary stream models are listed in table 12.
Table 9. Discharges used in the Yennie Avenue Drain upstream reach one-dimensional model.
[numbers are rounded to the nearest unit]
Station (feet upstream from junction with Sni-
A-Bar Creek)
Recurrence interval (year)
Discharge (cubic feet per
second)
2,243 10 270
50 341
100 396
500 474
The presence of a 400-ft underground culvert (B-800) in Yennie Avenue Drain forced the application of an alternate approach to the traditional culvert modeling in HEC-RAS (Yennie Avenue Drain culvert overflow; table 8). At culverts (or bridges) HEC-RAS assumes a straight line as the transi-tion between the water-surface elevations computed for the upstream and downstream cross sections. Although this method might be considered simplistic, it is effective for typi-cal culverts and bridges when sufficient information is avail-able to define both cross sections. In this particular case, many geomorphic features occur along the 400-ft reach upstream from the culvert; therefore, the solution was to use three sepa-rate models (M.T. Whitehead, U.S. Geological Survey, written commun., 2007). First, a model was run for the entire length of Yennie Avenue Drain. From this model, the water-surface elevation at the expansion (downstream) side of the culvert was obtained. This elevation was used as the boundary condi-tion for the second model, which was used to estimate the overland flow on the ground above the 400-ft culvert. A third model was then developed using the upstream elevation com-puted by the second model and the total flow (overland plus culvert) as the boundary conditions. The first and third models for Yennie Avenue Drain were conducted using the unaltered flow at the downstream and upstream locations. For the second model, the flow conditions were modified to account only for the fraction of the total discharge that contributed to overtop the culvert (the difference of the total discharge minus the discharge passing through the culvert).
HEC-RAS Model Calibration
On June 3, 2005, the city of Grain Valley received more than 5 inches (in.) of rainfall that contributed to a valley-con-trolled flood. A valley-controlled flood can be defined as open channel flow that has submerged the channel and is controlled downstream by topographic relief and anthropogenic struc-tures in the valley or flood plain. The profile of the June 2005 flood was developed from observed high-water marks located

20 Hydraulic Analyses of Sni-A-Bar Creek and Selected Tributaries at Grain Valley, Jackson County, Missouri
Table 10. Discharges used in the Swiney Branch one-dimensional model.
[numbers are rounded to the nearest unit]
Station (feet upstream from junction with Sni-
A-Bar Creek)
Recurrence interval (year)
Discharge (cubic feet per
second)
760 10 1,762
50 2,677
100 3,295
500 4,658
2,180 10 1,554
50 2,345
100 2,899
500 4,082
2,946 10 975
50 1,473
100 1,730
500 2,324
3,953 10 766
50 1,229
100 1,444
500 2,016
4,069 10 607
50 915
100 1,098
500 1,533
4,614 10 530
50 812
100 957
500 1,345
5,072 10 494
50 766
100 886
500 1,250
5,193 10 431
50 678
100 763
500 1,088
along the main stem of Sni-A-Bar Creek and lower reaches of the tributaries of Blue Branch, Yennie Avenue Drain, and Swiney Branch (fig. 12). High-water marks were surveyed and used in model calibration of the Sni-A-Bar Creek main stem models. Steady-state boundary conditions initially were set with a known water-surface elevation at the downstream
cross section. A peak discharge was selected based on the best fit of a simulated water surface to the observed high-water marks (table 13). Additional interpolated cross sections were added to provide an adequate transition of conveyance, and adjustments of roughness values and expansion and contrac-tion coefficients were applied to aid in refining the simulated water-surface profile. The resulting peak discharge of the June 2005 flood was 8,700 ft3/s. Once the HEC-RAS model was calibrated to the known flood, the known starting water-surface elevation was replaced with a normal depth computa-tion or energy-grade-line slope, which was used to define the downstream starting water-surface elevation that best repre-sented the simulated profile.
Table 11. Discharges used in the Swiney Branch Tributary model.
[numbers are rounded to the nearest unit]
Station (feet upstream
from junction with Swiney Branch)
Recurrence interval (year)
Discharge (cubic feet per
second)
834 10 837
50 1,264
100 1,519
500 1,967
1,370 10 823
50 1,243
100 1,494
500 1,935
1,471 10 777
50 1,169
100 1,391
500 1,801
A slope-area computation was evaluated along the main-stem study reach to provide an additional diagnostic in which to evaluate the June 2005 peak. To properly conduct this indirect method of evaluating peak discharge, the study reach should be straight, contracting, and have a minimum of 0.5 ft of fall (Dalrymple and Benson, 1967). Ultimately, no adequate channel reach could be obtained on the Sin-A-Bar main stem to properly evaluate the slope-area method because of the dif-ficulty identifying a straight contracting reach with observed fall greater than 0.5 ft within the modeled reach.
Development of the Two-Dimensional Model
The hydraulic characteristics of a 3.5-mi reach of the Sni-A-Bar Creek main stem were simulated using the numerical hydrodynamic model Finite Element Surface Water Model-ing System Flow and Sediment Transport Module (FESWMS

Methods 21
Table 12. Description of the hydraulic structures included in the Sni-A-Bar Creek and tributary one-dimensional models.
[ft, feet; dia., diameter; RCB, reinforced concrete box; CMP, corrugated metal pipe; CMPA, corrugated metal pipe arch; --, not applicable]
ModelHydraulic structures
identification
Type of
structure Dimensions Material / ShapeLength
(ft)
Sni-A-Bar Creek
Blue Branch
Blue Branch Tributary
Yennie Avenue Drain
Swiney Branch
Swiney Branch Tributary
U.S. Highway 40
Gateway Western railroad
Interstate 70
BB-100
BB-900
BB-1400
BB-1600
BB-500
B-110
B-400
B-500
B-600
B-800
SB-100
SB-200
SB-1300
SB-1700
SB-1800
SB-1900
SB-300
SB-500
Bridge
Bridge
Bridge
Culvert
Bridge
Culvert
Culvert
Bridge
Culvert
Culvert
Culvert
Culvert
Culvert
Culvert
Culvert
Culvert
Culvert
Culvert
Culvert
Culvert
Culvert
--
--
--
6 barrels–18 ft x 17½ ft
--
3 barrels–14 ft x 14 ft
3 barrels–10½ ft x 12 ft
--
3 barrels–7 ft dia.
3 barrels–8 ft x 6½ ft
1 barrel–11 ft x 6 ft
1 barrel–6 ft dia.
1 barrel–6½ ft dia.
2 barrels–12 ft x 7 ft
2 barrels–15 ft x 11 ft
1 barrel–12 ft x 8 ft
1 barrel–13 ft x 9 ft
1 barrel–8 ft x 10 ft
1 barrel–9 ft x 9 ft
1 barrel–12 ft x 8 ft
1 barrel–24 ft x 6 ft
--
--
--
RCB
--
RCB
RCB
--
CMP
RCB
RCB
CMP
CMP
RCB
RCB
RCB
CMPA
RCB
RCB
RCB
RCB
100
232
518
42
22
81
60
22
35
50
18
61
400
25
68
35
55
50
65
44
56
FST2DH) version 3.2.2 ( Froehlich, 2003) within the Surface Water Modeling System (SWMS) version 9.0. The 10-, 50-, 100-, and 500-year recurrence interval discharges were simu-lated to determine a generalized view of the inundation extent and flow characteristics of Sni-A-Bar Creek through selected bridge structures. FESWMS FST2DH is a two-dimensional depth-averaged finite-element model using the Galerkin finite-element method as a numerical procedure for solving differen-tial equations representing conservation of mass and momen-tum. SWMS is a pre- and post-processor for the FESWMS FST2DH model.
The FESWMS FST2DH model used a two-dimensional computational mesh (fig.13) to represent the modeled area, referred to as the full model reach, rather than a series of cross sections as with the one-dimensional HEC-RAS model. Detailed views of the focus reach (fig. 13) were used to better show the effects of bridge structures. Topographical informa-tion and roughness characteristics were specified for each
node in the mesh. The mesh consisted of 27,514 elements with an average element area of 3,100 square feet (ft2). The mesh was extended upstream and downstream from the city bound-ary to allow boundary conditions to stabilize within the area of interest. The mesh boundary was placed outside of the inunda-tion extent of a 500-year recurrence interval event as defined by a previous one-dimensional model application supplied by the city of Grain Valley (Rick Arroyo, written commun., 2007). Mesh elements were constructed using the quadrilateral (patch) and paving mesh generation options within SWMS. Bridge piers and box culvert web walls were incorporated into the mesh using the pier construction utility within FESWMS FST2DH. Mesh quality tools within SWMS were used to iden-tify and correct possible areas in the mesh that could affect the solution, including abrupt element area changes, minimum and maximum element angles, concave quadrilateral elements, and ambiguous element gradients.

22 Hydraulic Analyses of Sni-A-Bar Creek and Selected Tributaries at Grain Valley, Jackson County, Missouri
94°10'94°10'30"94°11'94°11'30"
39°02'
39°01'30"
39°01'
39°00'30"
0 1,000 2,000 3,000 4,000 FEET
0 500 1,000 METERS
Interstate Highway 70
Gateway Western Railroad
U.S. Highway 40
Howell Road
Sni-A-BarCreek
BlueBranch
Yennie AvenueDrain
SwineyBranch
Wastewater Treatment Facility
Based from Center for Agricultural, Resource and Environmental Systems (CARES)Universal Transverse Mercator projection, Zone 15Horizontal coordinate information referenced to theNorth American Datum of 1983 (NAD 83)
EXPLANATION
Stream
High-water mark
Figure 12. Location of high-water marks from the June 3, 2005, flood along Sni-A-Bar Creek, Grain Valley, Missouri.

Methods 23
Table 13. Measured water-surface elevations along Sni-A-Bar Creek for the flood of June 2005, and simulated water-surface elevations from the one-dimensional model.
Water-surface elevation
LocationMeasured
(feet)Simulated
(feet)
180 feet upstream from Howell Road 766.0 766.0
820 feet downstream from Interstate 70 structures
771.5 771.6
36 feet upstream from Interstate 70 structures
772.4 772.5
63 feet downstream from Gateway Western Railroad
772.8 773.0
21 feet upstream from Gateway West-ern Railroad
773.1 773.3
61 feet downstream from U.S. high-way 40 structure
774.8 774.9
30 feet upstream from U.S. highway 40 structure
775.1 775.1
Junction of Blue Branch and Sni-A-Bar Creek
775.7 775.6
Material properties for the finite element mesh were defined by delineating selected land-use types using a 2006 digital orthophotograph (U.S. Department of Agriculture, 2006) and assigning roughness and eddy viscosity coefficients to each material type (table 14). Manning’s roughness coef-ficient values were assigned using onsite observations in con-junction with guidance from Arcement and Schneider (1989) and Chow (1959).
Table 14. Roughness and eddy viscosity coefficients used in the two-dimensional model.
Land use / material type
Manning’s n rough-ness coefficient
Eddy viscosity (squared feet per
second)
Channel 0.04–0.045 5
Cropland .04 10
Forest .08–.125 5–10
Grassland .025–.055 5–10
Roads .013 5
The topography of the study area was determined from a 4-meter (m) digital elevation model (J.M. Richards, U.S. Geological Survey, written commun., 2007) derived from the 2006 Jackson County LiDAR dataset. An original 2-m DEM produced from the LiDAR information was re-sampled into a 4-m DEM as the number of data points associated with the 2-m DEM exceeded the import capabilities of the SWMS soft-ware. The channel-survey points described in the one-dimen-sional computational model development section also were
included in the topographic data set and interpolated onto the model mesh. The upstream input discharge and downstream water-surface elevation boundary conditions for the 10-, 50-, 100-, and 500-year recurrence interval events in the FESWMS FST2DH model were similar to those used in the upstream and downstream boundaries of the HEC-RAS one-dimensional simulation of the Sni-A-Bar main stem (tables 3, 4, 15).
Table 15. Boundary conditions used in the Sni-A-Bar Creek two-dimensional model.
[ft3/s, cubic feet per second; ft, feet]
Boundary condition
Model simulationUpstream
(ft3/s)Downstream
(ft)
Caibration event 1 657 758.8
Calibration event 2 8,700 765.9
10-year recurrence interval
9,000 765.9
50-year recurrence interval
14,100 767.2
100-year recurrence interval
16,400 767.6
500-year recurrence interval
21,800 768.6
The two-dimensional streamflow simulations began with an iterative process known as model “spindown” in which the water-surface elevation was incrementally lowered at the downstream boundary condition to the target stage to ensure computational stability. The initial downstream water-surface elevation was set at a stage that would ensure all elements in the mesh were “wet”, and the target simulation discharge was used as the inflow boundary condition. The downstream water-surface differences between initial spindown simulations were between 5 and 10 ft, and this increment was decreased to 1 ft or less as the simulation conditions approached the target water-surface elevation. Iterative model runs were used as “hotstarts,” providing the initial conditions for the subse-quent model runs. This process was repeated until the desired downstream water-surface elevation was achieved. Through-out the process of “spindown,” dry elements were manually disabled to prevent solution instability resulting from wetting and drying.
FESWMS Model Calibration
The FESWMS FST2DH model was calibrated to two observed floods to better ensure that the model could reason-ably represent the actual conditions in the full model reach. Streamflows for the August 2006 event were within the chan-nel banks and allowed for the isolation and adjustment of in-channel conditions (channel control) to better match observed

24 Hydraulic Analyses of Sni-A-Bar Creek and Selected Tributaries at Grain Valley, Jackson County, Missouri
0 1 MILE
Sni-A-B
ar Creek
Focus reach
EXPLANATION
Grain Valley city limit
Full model reach
Figure 13. Diagram showing the computational mesh [full model reach and focus reach (inset)] used in the two-dimensional model of Sni-A-Bar Creek, Grain Valley, Missouri.

Hydraulic Analyses of Sni-A-Bar Creek (HEC-RAS Results) 25
conditions. The June 2005 flood closely corresponded to the 10-year recurrence interval flood conditions (table 15). The root mean square error (RMSE) associated with the August 2006 in-channel calibration event was 0.53 ft (table 16). The simulation was more sensitive to minor modifications in the mesh elements than to modifications of roughness coefficients. The six-wide element configuration for the Sni-A-Bar Creek main stem channel was adequate for simulating over-bank flows, but additional refinement of the channel elements would be needed for in-channel flow applications. The RMSE for the June 2005 calibration event was 0.39 ft (table 16).
Table 16. Summary statistics for simulated and observed water-surface elevations used in the two-dimensional model calibration.
Flood
Model simulation August 06 June 05
Number of observations 3 146
Maximum differrence, in feet
.53 .78
Minimum difference, in feet
-.55 -.52
Mean difference, in feet .16 .24
Median difference, in feet
.50 .31
Root mean square error, in feet
.53 .39
Sources of Errors in HEC-RAS and FESWMS Models
The numerical hydraulic simulations are simplified representations of complex and dynamic natural systems; therefore, the simplification of this natural system through mathematical formulas, discrete nodal calculation points, channel roughness estimates, and depth-averaged approxima-tions, will result in errors. The cumulative effects of these errors for the Sni-A-Bar Creek main stem models were quantified through calibration, and are summarized in tables 13 and 16. Errors from input data result primarily from the measurement and representation of topographic and hydro-logic characteristics.
Although the collection process of LiDAR data is extremely precise, the filtering process of the original signal is not. The filtering process used to obtain the “bare-earth” topographical information is based on mathematical approxi-mations that sometimes fail to interpret the original data. The primary concern in post-processing LIDAR data is how to isolate the ground surface from objects such as vegetation or buildings (Alemseged and Rientjes, 2007). For the data used in this study, the filtering methods were not able to remove elevation information of some structures. Additionally, ground
elevations in regions of thick vegetation were reported as particularly irregular. A moving-average technique was used to “smooth” those irregularities.
Hydrologic measurements included collecting stream-flow and water-surface elevations used in the construction of elevation-discharge ratings. Errors associated with these data contributed to overall simulation errors. Streamflow measure-ments included errors associated with the measurement of water depth and velocity. Water-surface elevations were col-lected with an accuracy of about 0.06 ft (corresponding to the error of the reference benchmark) and precision of approxi-mately 0.02 ft (corresponding to the accuracy and precision of the reference gage). Discharge values used in the calibration simulations have associated errors of 8 to greater than 10 percent.
Finally, the selections of some of the calibration param-eters (for example, Manning’s n values, eddy viscosity values) for these models can be an additional source of error. Using guidelines, access to experimental reports, and modeling expe-rience help minimize the frequency of these errors; however, in reaches where calibration procedures could not be per-formed, the results were based on the physical characteristics of the channel.
Hydraulic Analyses of Sni-A-Bar Creek (HEC-RAS Results)
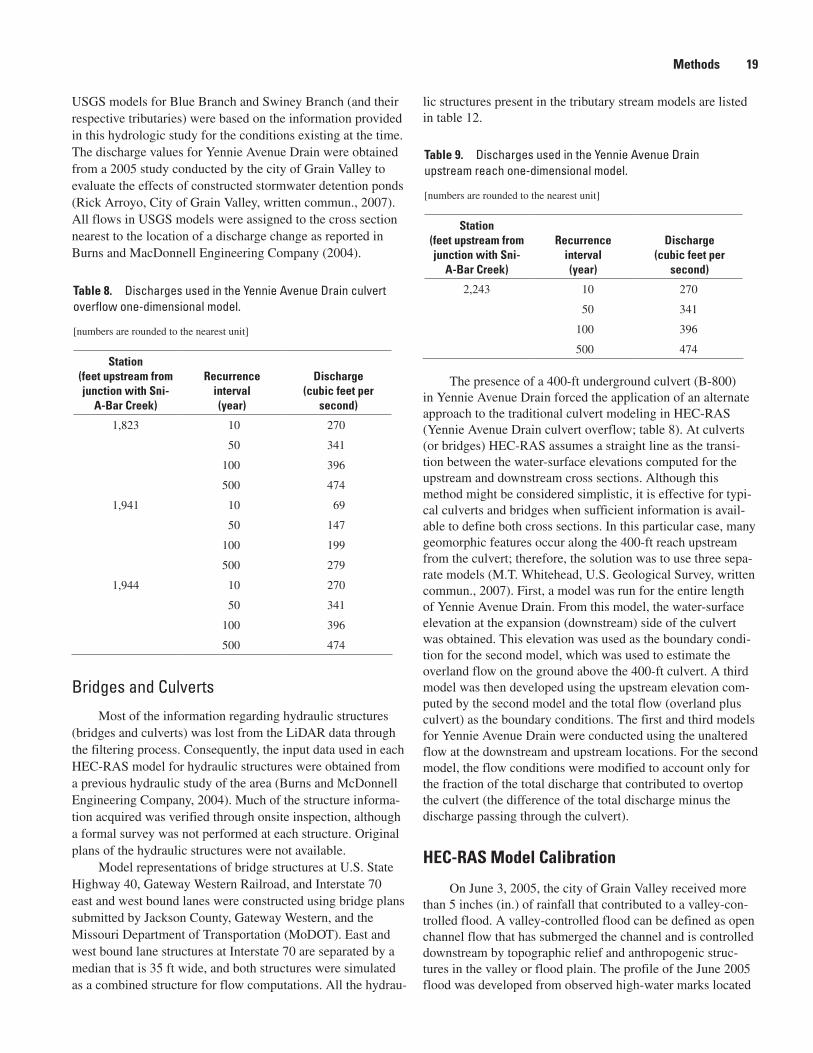
Analyses of the flood of June 3, 2005 (table 17), and the 10-, 50-, 100-, and 500-year recurrence interval flood fre-quency water-surface profiles (fig. 14) were made to distin-guish potential backwater resulting from contracted openings. Based on surveyed high-water marks, potential backwater was not a concern because no substantial deviation in water-surface elevation was noted from surveyed marks upstream and down-stream from each structure. Backwater from contracted open-ings can be considered a function of energy losses because velocity increases as water moves through the opening during sub-critical flow. As velocity increases through contracted openings, water becomes “backed up” upstream to a point where sufficient velocity head is established to accommodate the increased velocity through the respective opening. In the simulated reach, a backwater effect of 0.2 ft at the junction of Sni-A-Bar Creek with Blue Branch for the June 2005 flood was based on the inclusion of contracted openings minus the exclusion of such openings.
Results from all analyses indicated minimal backwa-ter effects as a result of an overall minimal energy-grade-line slope and velocity head along Sni-A-Bar Creek. The water-surface profile of Sni-A-Bar Creek generated from the HEC-RAS model (fig. 14) indicated that the Gateway Western Railroad bridge structure provided the greatest amount of con-traction of flow within the modeled area. The step-backwater model provided a simulation of all structures along the full model reach, and a subsequent simulation with the removal of

26 Hydraulic Analyses of Sni-A-Bar Creek and Selected Tributaries at Grain Valley, Jackson County, Missouri
Table 17. High-water mark and simulated water-surface elevations including and excluding contracted openings along Sni-A-Bar Creek for the flood of June 3, 2005.
Water-surface elevations
Location
Surveyed high-water
marks (feet)
Including contracted openings
(feet)
Excluding contracted openings
(feet)
All contracted openings
(Interstate 70 bridges excluded)
(feet)
All contracted openings (Gateway
Western Railroad bridge excluded)
(feet)
All contracted openings
(US Highway 40 bridge excluded)
(feet)
180 feet upstream from Howell Road
766.0 766.0 766.0 766.0 766.0 766.0
820 feet downstream from Interstate 70 bridges
771.5 771.6 771.6 771.6 771.6 771.6
36 feet upstream from Interstate 70 bridges
772.4 772.5 772.4 772.2 772.5 772.5
63 feet downstream from Gateway Western Railroad bridge
772.8 773.0 772.6 772.8 773.0 773.0
21 feet upstream from Gateway Western Railroad bridge
773.1 773.3 772.7 772.1 773.1 773.3
61 feet downstream from U.S. highway 40 bridge
774.8 774.9 774.8 774.9 774.9 774.9
30 feet upstream from U.S. highway 40 bridge
775.1 775.1 774.8 774.1 775.1 774.9
Junction of Blue Branch and Sni-A-Bar
775.7 775.6 775.4 775.6 775.6 775.4
the railroad structure exclusively. The results at the location at the upstream face of the railroad structure showed a water-surface elevation difference from 0.2 to 0.8 ft (corresponding to simulated 10- to 500-year flood occurrences, fig. 14). The maximum propagated backwater effects estimated with the one-dimensional model ranged from 0.5 ft to about 1.5 ft upstream from contracted openings (fig. 14). The wastewater treatment facility downstream from the three bridge cross-ings caused an estimated backwater ranging from about 0.2 to 0.4 ft at the junction of Swiney Branch with Sni-A-Bar Creek (table 18).
Hydraulic Analyses of Sni-A-Bar Creek (FESWMS Results)
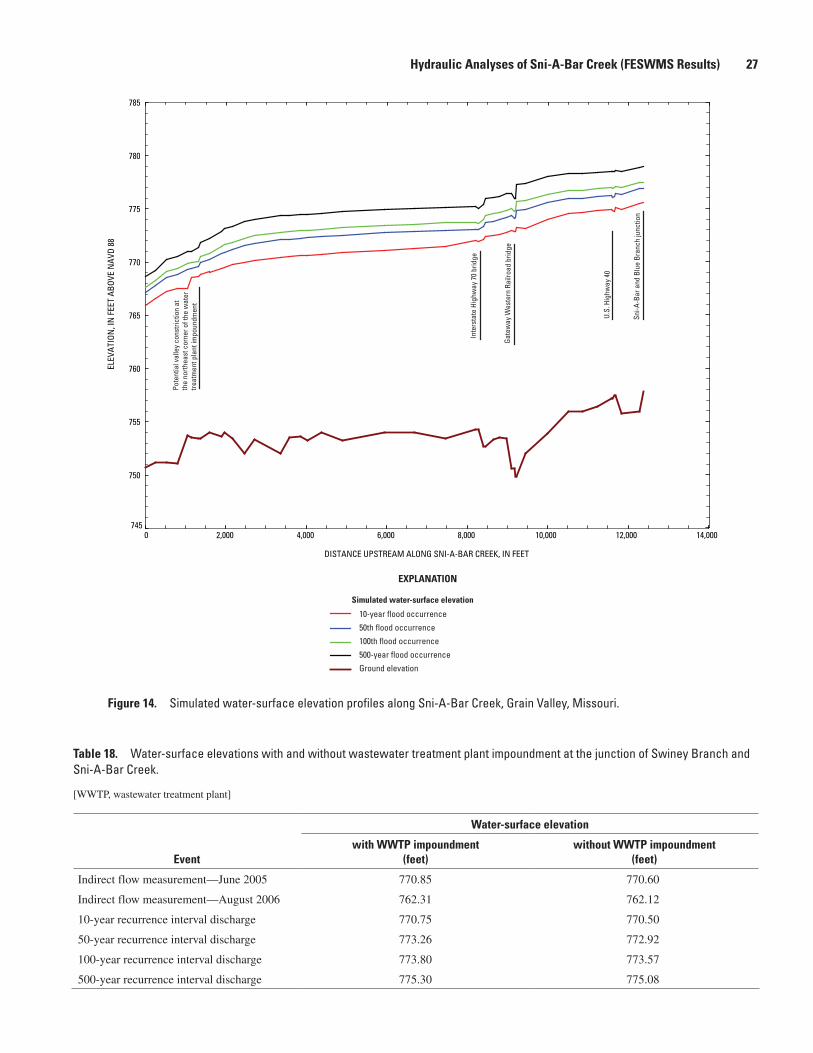
The FESWMS FST2DH output consisted of a two-dimensional depiction of water-surface elevations, inundation area, water depths, and depth-averaged velocity information for the 10-, 50-, 100-, and 500-year recurrence floods. The water-surface profiles through the bridge structures simul-sted using FESMWS (fig. 15) also indicated that backwater
effects from these constrictions were not substantial. Water-surface longitudinal profiles through the three bridges for the four floods indicated a water-surface elevation change ranging from 0.1 to 1.0 ft between the bridge openings and locations about 250 ft upstream from the openings, with the largest elevation changes occurring through the Gateway Western railroad bridge (fig. 16). Maximum water depths in the main channel were about 24 to 28 ft (table 19) with water depths in the flood plain generally 3 to 5 ft deep during the four events (fig. 17). The area of inundation increased from 994 acres for the 10-year event to 1,166 acres for the 500-year recurrence interval event (table 19).
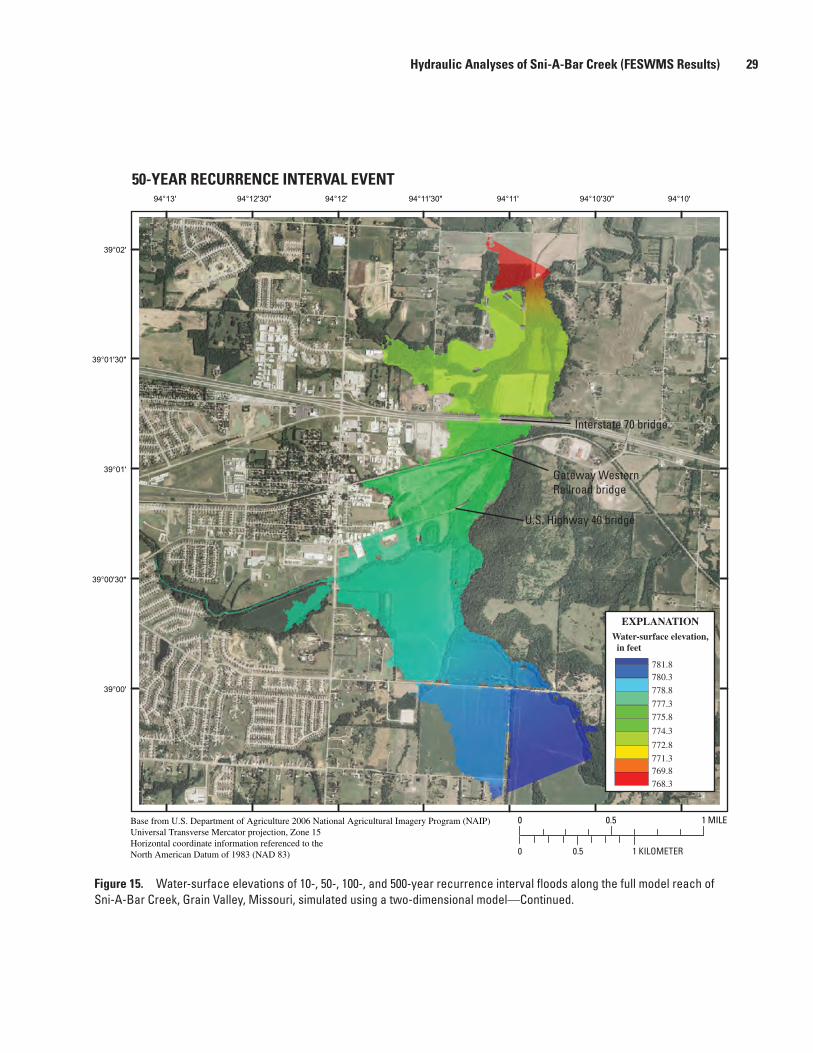
Maximum depth-averaged velocities in the study reach exceeded 10 feet per second (ft/s) in the four simulated floods, with maximum velocities through the bridge openings ranging from about 3 to 10.5 ft/s (table 19, figs. 18–19). The maximum velocity at the Gateway Western Railroad Bridge and Inter-state 70 bridge openings increased with an increase in flow (fig. 18) as all the flow was contained within the bridge open-ings. An estimate of the flow pathways for the 10-, 50-, 100-, and 500-year recurrence interval flows were generated for the focus (films 1–4) and full (films 5–8) model reaches.
Hydraulic Analyses of Sni-A-Bar Creek (FESWMS Results) 27
Inte
rsta
te H
ighw
ay 7
0 br
idge
Gate
way
Wes
tern
Rai
lroad
brid
ge
U.S.
Hig
hway
40
Pote
ntia
l val
ley
cons
trict
ion
at
the
north
east
cor
ner o
f the
wat
er
treat
men
t pla
nt im
poun
dmen
t
Sni-A
-Bar
and
Blu
e Br
anch
junc
tion
EXPLANATION
10-year flood occurrence
50th flood occurrence
100th flood occurrence
Ground elevation
500-year flood occurrence
Simulated water-surface elevation
DISTANCE UPSTREAM ALONG SNI-A-BAR CREEK, IN FEET
ELEV
ATIO
N, I
N F
EET
ABOV
E N
AVD
88
745
750
755
760
765
770
775
780
785
0 2,000 4,000 6,000 8,000 10,000 12,000 14,000
Figure 14. Simulated water-surface elevation profiles along Sni-A-Bar Creek, Grain Valley, Missouri.
Table 18. Water-surface elevations with and without wastewater treatment plant impoundment at the junction of Swiney Branch and Sni-A-Bar Creek.
[WWTP, wastewater treatment plant]
Water-surface elevation
Eventwith WWTP impoundment
(feet)without WWTP impoundment
(feet)
Indirect flow measurement—June 2005 770.85 770.60
Indirect flow measurement—August 2006 762.31 762.12
10-year recurrence interval discharge 770.75 770.50
50-year recurrence interval discharge 773.26 772.92
100-year recurrence interval discharge 773.80 773.57
500-year recurrence interval discharge 775.30 775.08

28 Hydraulic Analyses of Sni-A-Bar Creek and Selected Tributaries at Grain Valley, Jackson County, Missouri
94°10'94°10'30"94°11'94°11'30"94°12'94°12'30"94°13'
39°02'
39°01'30"
39°01'
39°00'30"
39°00'
0 0.5 1 MILE
0.50 1 KILOMETER
Base from U.S. Department of Agriculture 2006 National Agricultural Imagery Program (NAIP)Universal Transverse Mercator projection, Zone 15Horizontal coordinate information referenced to the North American Datum of 1983 (NAD 83)
10-YEAR RECURRENCE INTERVAL EVENT
767.2768.7770.2
771.7
773.2
774.7
776.2
777.7
779.2780.7
Water-surface elevation, in feet
Interstate 70 bridge
Gateway WesternRailroad bridge
U.S. Highway 40 bridge
EXPLANATION
Figure 15. Water-surface elevations of 10-, 50-, 100-, and 500-year recurrence interval floods along the full model reach of Sni-A-Bar Creek, Grain Valley, Missouri, simulated using a two-dimensional model.
Hydraulic Analyses of Sni-A-Bar Creek (FESWMS Results) 29
94°10'94°10'30"94°11'94°11'30"94°12'94°12'30"94°13'
39°02'
39°01'30"
39°01'
39°00'30"
39°00'
50-YEAR RECURRENCE INTERVAL EVENT
768.3769.8771.3
772.8
774.3
775.8
777.3
778.8
780.3781.8
Interstate 70 bridge
Gateway WesternRailroad bridge
U.S. Highway 40 bridge
Base from U.S. Department of Agriculture 2006 National Agricultural Imagery Program (NAIP)Universal Transverse Mercator projection, Zone 15Horizontal coordinate information referenced to the North American Datum of 1983 (NAD 83)
Water-surface elevation, in feet
EXPLANATION
0 0.5 1 MILE
0.50 1 KILOMETER
Figure 15. Water-surface elevations of 10-, 50-, 100-, and 500-year recurrence interval floods along the full model reach of Sni-A-Bar Creek, Grain Valley, Missouri, simulated using a two-dimensional model—Continued.

30 Hydraulic Analyses of Sni-A-Bar Creek and Selected Tributaries at Grain Valley, Jackson County, Missouri
94°10'94°10'30"94°11'94°11'30"94°12'94°12'30"94°13'
39°02'
39°01'30"
39°01'
39°00'30"
39°00'
Base from U.S. Department of Agriculture 2006 National Agricultural Imagery Program (NAIP)Universal Transverse Mercator projection, Zone 15Horizontal coordinate information referenced to the North American Datum of 1983 (NAD 83)
100-YEAR RECURRENCE INTERVAL EVENT
768.8770.3771.8
773.3
774.8
776.3
777.8
779.3
780.8782.3
Interstate 70 bridge
Gateway WesternRailroad bridge
U.S. Highway bridge
Water-surface elevation, in feet
EXPLANATION
0 0.5 1 MILE
0.50 1 KILOMETER
Figure 15. Water-surface elevations of 10-, 50-, 100-, and 500-year recurrence interval floods along the full model reach of Sni-A-Bar Creek, Grain Valley, Missouri, simulated using a two-dimensional model—Continued.

Hydraulic Analyses of Sni-A-Bar Creek (FESWMS Results) 31
94°10'94°10'30"94°11'94°11'30"94°12'94°12'30"94°13'
39°02'
39°01'30"
39°01'
39°00'30"
39°00'
Base from U.S. Department of Agriculture 2006 National Agricultural Imagery Program (NAIP)Universal Transverse Mercator projection, Zone 15Horizontal coordinate information referenced to the North American Datum of 1983 (NAD 83)
100-YEAR RECURRENCE INTERVAL EVENT
768.8770.3771.8
773.3
774.8
776.3
777.8
779.3
780.8782.3
Interstate 70 bridge
Gateway WesternRailroad bridge
U.S. Highway bridge
Water-surface elevation, in feet
EXPLANATION
0 0.5 1 MILE
0.50 1 KILOMETER
94°10'94°10'30"94°11'94°11'30"94°12'94°12'30"94°13'
39°02'
39°01'30"
39°01'
39°00'30"
39°00'
500-YEAR RECURRENCE INTERVAL EVENT
769.3770.8772.3
773.8
775.3
776.8
778.3
779.8
781.3782.8
Interstate 70 bridge
Gateway WesternRailroad bridge
U.S. Highway 40 bridge
0 0.5 1 MILE
0.50 1 KILOMETER
Base from U.S. Department of Agriculture 2006 National Agricultural Imagery Program (NAIP)Universal Transverse Mercator projection, Zone 15Horizontal coordinate information referenced to the North American Datum of 1983 (NAD 83)
Water-surface elevation, in feet
EXPLANATION
Figure 15. Water-surface elevations of 10-, 50-, 100-, and 500-year recurrence interval floods along the full model reach of Sni-A-Bar Creek, Grain Valley, Missouri, simulated using a two-dimensional model—Continued.

32 Hydraulic Analyses of Sni-A-Bar Creek and Selected Tributaries at Grain Valley, Jackson County, MissouriW
ATER
-SUR
FACE
ELE
VATI
ON, I
N F
EET
DISTANCE (RELATED TO CENTER OF STRUCTURE), IN FEET
U.S. Highway 40 bridge
Gateway WesternRailroad bridge
Interstate 70 bridge
U.S. Highway 40 bridge
Gateway WesternRailroad bridge
Interstate 70 bridge
U.S. Highway 40 bridge
Gateway WesternRailroad bridge
Interstate 70 bridge
774.0
774.5
775.0
775.5
776.0
776.5
777.0
777.5
772.0
772.5
773.0
773.5
774.0
774.5
775.0
773.5
774.0
774.5
775.0
775.5
776.0
776.5
0 50 100 150 200 250 300 350 400 450 500 550
100-year flood
774.5
775.0
775.5
776.0
776.5
777.0
777.5
778.0
778.5
779.0 U.S. Highway 40 bridge
Gateway WesternRailroad bridge
Interstate 70 bridge
0 50 100 150 200 250 300 350 400 450 500 550
500-year flood
10-year flood
50-year flood
Figure 16. Water-surface elevation profiles through bridges along Sni-A-Bar Creek, Grain Valley, Missouri, for 10-, 50-, 100-, and 500-year recurrence interval floods simulated using a two-dimensional model.

Hydraulic Analyses of Sni-A-Bar Creek (FESWMS Results) 33
94°10'30"94°11'94°11'30"94°12'
39°01'30"
39°01'
39°00'30"
10-YEAR RECURRENCE INTERVAL EVENT
0
2.75.3
8.0
10.7
13.3
16.0
18.7
21.324.0
Water depth, in feet
EXPLANATION
0 0.25 0.5 MILE
0 0.25 0.5 KILOMETER
Interstate 70 bridge
Gateway WesternRailroad bridge
U.S. Highway 40 bridge
Base from U.S. Department of Agriculture 2006 National Agricultural Imagery Program (NAIP)Universal Transverse Mercator projection, Zone 15Horizontal coordinate information referenced to the North American Datum of 1983 (NAD 83)
Figure 17. Water depths of 10-, 50-, 100-, and 500-year recurrence interval floods along the Sni-A-Bar Creek focus reach simulated using a two-dimensional model.

34 Hydraulic Analyses of Sni-A-Bar Creek and Selected Tributaries at Grain Valley, Jackson County, Missouri
94°10'30"94°11'94°11'30"94°12'
39°01'30"
39°01'
39°00'30"
Base from U.S. Department of Agriculture 2006 National Agricultural Imagery Program (NAIP)Universal Transverse Mercator projection, Zone 15Horizontal coordinate information referenced to the North American Datum of 1983 (NAD 83)
50-YEAR RECURRENCE INTERVAL EVENT
Water depth, in feet
EXPLANATION
02.95.8
8.7
11.6
14.4
17.3
20.2
23.126.0
Interstate 70 bridge
Gateway WesternRailroad bridge
U.S. Highway 40 bridge
0 0.25 0.5 MILE
0 0.25 0.5 KILOMETER
Figure 17. Water depths of 10-, 50-, 100-, and 500-year recurrence interval floods along the Sni-A-Bar Creek focus reach simulated using a two-dimensional model—Continued.

Hydraulic Analyses of Sni-A-Bar Creek (FESWMS Results) 35
94°10'30"94°11'94°11'30"94°12'
39°01'30"
39°01'
39°00'30"
100-YEAR RECURRENCE INTERVAL EVENT
02.95.8
8.7
11.6
14.4
17.3
20.2
23.126.0
Interstate 70 bridge
Gateway Western`Railroad bridge
U.S. Highway 40 bridge
Base from U.S. Department of Agriculture 2006 National Agricultural Imagery Program (NAIP)Universal Transverse Mercator projection, Zone 15Horizontal coordinate information referenced to the North American Datum of 1983 (NAD 83)
Water depth, in feet
EXPLANATION
0 0.25 0.5 MILE
0 0.25 0.5 KILOMETER
Figure 17. Water depths of 10-, 50-, 100-, and 500-year recurrence interval floods along the Sni-A-Bar Creek focus reach simulated using a two-dimensional model—Continued.

36 Hydraulic Analyses of Sni-A-Bar Creek and Selected Tributaries at Grain Valley, Jackson County, Missouri
94°10'30"94°11'94°11'30"94°12'
39°01'30"
39°01'
39°00'30"
500-YEAR RECURRENCE INTERVAL EVENT
02.95.8
8.7
11.6
14.4
17.3
20.2
23.126.0
Interstate 70 bridge
Gateway WesternRailroad bridge
U.S. Highway 40 bridge
Base from U.S. Department of Agriculture 2006 National Agricultural Imagery Program (NAIP)Universal Transverse Mercator projection, Zone 15Horizontal coordinate information referenced to the North American Datum of 1983 (NAD 83)
Water Depth, in feet
EXPLANATION
0 0.25 0.5 MILE
0 0.25 0.5 KILOMETER
Figure 17. Water depths of 10-, 50-, 100-, and 500-year recurrence interval floods along the Sni-A-Bar Creek focus reach simulated using a two-dimensional model—Continued.

Hydraulic Analyses of Sni-A-Bar Creek Tributaries 37
Table 19. Summary statistics for 10-, 50-, 100-, and 500-year recurrence intervals for Sni-A-Bar Creek simulated using the two-dimensional model.
Simulation event recurrence interval
Summary statistic 10-year 50-year 100-year 500-year
Inundated model area, in acres 994 1,100 1,130 1,170
Maximum water depth, in feet 23.8 25.4 26.4 28.0
Maximum depth-averaged velocity in model reach, in feet per second
10.4 10.9 11.0 10.6
Maximum depth-averaged velocity at U.S. Highway 40 bridge, in feet per second
4.33 3.63 3.10 2.47
Maximum depth-averaged velocity at Gateway Western Railroad bridge, in feet per second
6.45 6.79 8.56 10.5
Maximum depth-averaged velocity at Interstate 70 bridge, in feet per second
6.38 7.13 8.30 9.65
Hydraulic Analyses of Sni-A-Bar Creek Tributaries
The HEC-RAS results of the simulations of the Sni-A-Bar Creek tributaries—Blue Branch, Yennie Avenue Drain, and Swiney Branch—included generated water-surface eleva-tion profiles for the 10-, 50-, 100-, and 500-year floods, and generated flood-plain maps for the 100-year recurrence inter-val floods. Water-surface elevation profiles are provided in figure 20. The Yennie Avenue Drain water-surface profile (fig. 20c) was composed of the results of three different models, and these results were combined in one profile to show their continuity.
Hydraulic Structures Performance
Once the water-surface profiles were generated, a more specific analysis of the hydraulic structures was performed. In this analysis, each structure was checked for overtopping during each of the events being evaluated (10-, 50-, 100- and 500-year recurrence floods). The flow and overtop above each hydraulic structure are listed in table 20. Even though some structures did not indicate overflow in the graphical output of the model, based on the numerical results, the areas surround-ing the structure were submerged during certain events. These hydraulic structures were considered as overtopped for the analysis of those particular events.
Structures along Blue Branch Creek indicated a variable capacity to convey the simulated floods. Structure BB-900 had sufficient capacity to convey the flows from each event without overtopping. Structure BB-100 failed to convey the 500-year flow event, whereas structures BB-1400 and
BB-1600 had no capacity for events greater than a 10-year event without overtopping. The bridge present on Blue Branch Tributary (structure BB-500) was not overtopped in any of the modeled events.
Structure B-400, on Yennie Avenue Drain, had enough capacity to convey the flows from all events. Structure B-110 failed to carry the flow from the 100- and 500-year events. The rest of the structures present on Yennie Avenue Drain failed to convey any of the events without overtopping.
The structures present along Swiney Branch were able to convey the flows for the 10- and 50-year recurrence interval events with the exception of structures SB-1300 and SB-1700, which were overtopped during the 50-year event. None of the structures had enough capacity to convey the 100- and 500-year events without overtopping, with the exception of structure SB-1900, which was not overtopped during any of the events modeled. The Swiney Branch Tributary structures were overtopped during the 100- and 500-year events. Struc-ture SB-500 on this stream also was overtopped during the 50-year event.
Flood Plain Determination
The extent of the flood plain determined for Blue Branch, Yennie Avenue Drain, and Swiney Branch is shown in figures 21 through 23. The flood plain for each stream and its respec-tive tributaries were plotted on the same map to show conti-nuity and transition at the junctions. The updated flood-plain maps will allow the city managers to contrast changes in flood risk and zoning as determined through the National Flood Insurance Program (NFIP) (Federal Insurance Administration, 1979).

38 Hydraulic Analyses of Sni-A-Bar Creek and Selected Tributaries at Grain Valley, Jackson County, Missouri
94°10'94°10'30"94°11'94°11'30"94°12'94°12'30"94°13'
39°02'
39°01'30"
39°01'
39°00'30"
39°00'
0 0.5 1 MILE
0.50 1 KILOMETER
10-YEAR RECURRENCE INTERVAL EVENT
01.112.22
3.33
4.44
5.56
6.67
7.78
8.8910.0
Velocity, in feet per second
EXPLANATION
Interstate 70 bridge
U.S. Highway 40 bridge
Gateway Western Railroad bridge
Base from U.S. Department of Agriculture 2006 National Agricultural Imagery Program (NAIP)Universal Transverse Mercator projection, Zone 15Horizontal coordinate information referenced to the North American Datum of 1983 (NAD 83)
Figure 18. Water velocities of 10-, 50-, 100-, and 500-year recurrence interval floods along the full model reach of Sni-A-Bar Creek, simulated using a two-dimensional model.
Hydraulic Analyses of Sni-A-Bar Creek Tributaries 39
94°10'94°10'30"94°11'94°11'30"94°12'94°12'30"94°13'
39°02'
39°01'30"
39°01'
39°00'30"
39°00'
0 0.5 1 MILE
0.50 1 KILOMETER
10-YEAR RECURRENCE INTERVAL EVENT
01.112.22
3.33
4.44
5.56
6.67
7.78
8.8910.0
Velocity, in feet per second
EXPLANATION
Interstate 70 bridge
U.S. Highway 40 bridge
Gateway Western Railroad bridge
Base from U.S. Department of Agriculture 2006 National Agricultural Imagery Program (NAIP)Universal Transverse Mercator projection, Zone 15Horizontal coordinate information referenced to the North American Datum of 1983 (NAD 83)
50-YEAR RECURRENCE INTERVAL EVENT
01.112.22
3.33
4.44
5.56
6.67
7.78
8.8910.0
94°10'94°10'30"94°11'94°11'30"94°12'94°12'30"94°13'
39°02'
39°01'30"
39°01'
39°00'30"
39°00'
Interstate 70 bridge
U.S. Highway 40 bridge
Gateway Western Railroad bridge
0 0.5 1 MILE
0.50 1 KILOMETER
Base from U.S. Department of Agriculture 2006 National Agricultural Imagery Program (NAIP)Universal Transverse Mercator projection, Zone 15Horizontal coordinate information referenced to the North American Datum of 1983 (NAD 83)
Velocity, in feet per second
EXPLANATION
Figure 18. Water velocities of 10-, 50-, 100-, and 500-year recurrence interval floods along the full model reach of Sni-A-Bar Creek, simulated using a two-dimensional model—Continued.
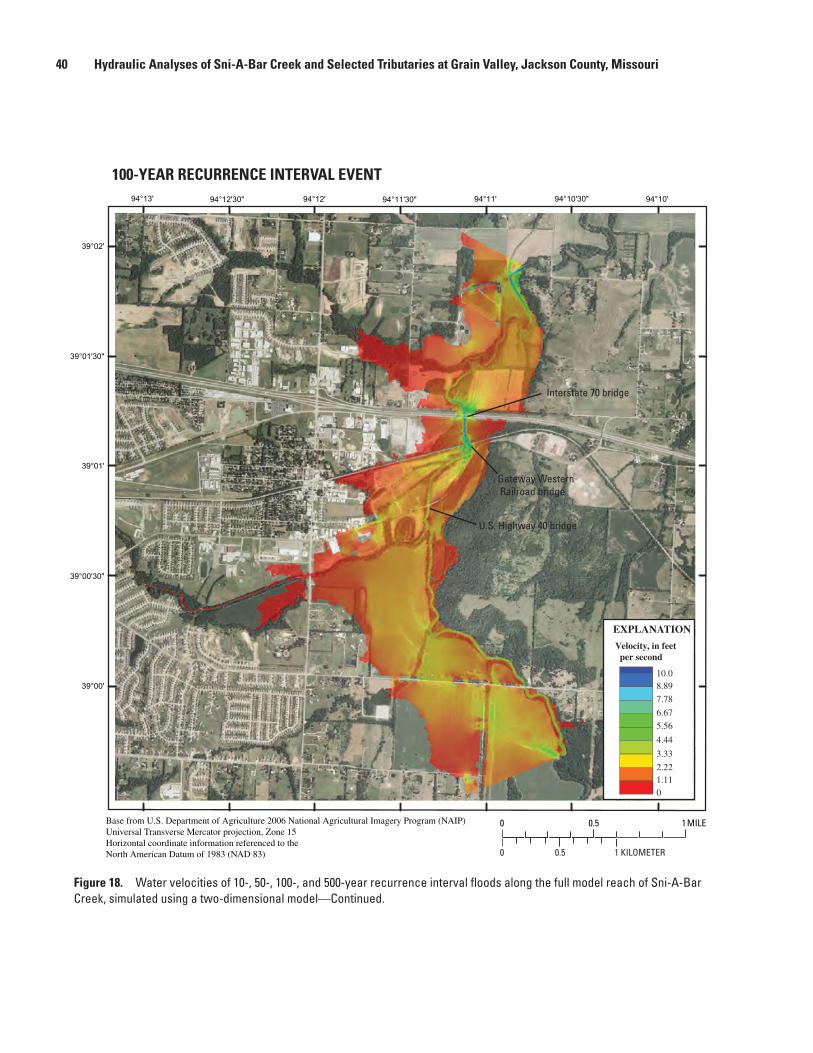
40 Hydraulic Analyses of Sni-A-Bar Creek and Selected Tributaries at Grain Valley, Jackson County, Missouri
100-YEAR RECURRENCE INTERVAL EVENT
01.112.22
3.33
4.44
5.56
6.67
7.78
8.8910.0
94°10'94°10'30"94°11'94°11'30"94°12'94°12'30"94°13'
39°02'
39°01'30"
39°01'
39°00'30"
39°00'
Interstate 70 bridge
U.S. Highway 40 bridge
Gateway Western Railroad bridge
0 0.5 1 MILE
0.50 1 KILOMETER
Base from U.S. Department of Agriculture 2006 National Agricultural Imagery Program (NAIP)Universal Transverse Mercator projection, Zone 15Horizontal coordinate information referenced to the North American Datum of 1983 (NAD 83)
Velocity, in feet per second
EXPLANATION
Figure 18. Water velocities of 10-, 50-, 100-, and 500-year recurrence interval floods along the full model reach of Sni-A-Bar Creek, simulated using a two-dimensional model—Continued.

Hydraulic Analyses of Sni-A-Bar Creek Tributaries 41
500-YEAR RECURRENCE INTERVAL EVENT
01.112.22
3.33
4.44
5.56
6.67
7.78
8.8910.0
94°10'94°10'30"94°11'94°11'30"94°12'94°12'30"94°13'
39°02'
39°01'30"
39°01'
39°00'30"
39°00'
Interstate 70 bridge
U.S. Highway 40 bridge
Gateway Western Railroad bridge
0 0.5 1 MILE
0.50 1 KILOMETER
Base from U.S. Department of Agriculture 2006 National Agricultural Imagery Program (NAIP)Universal Transverse Mercator projection, Zone 15Horizontal coordinate information referenced to the North American Datum of 1983 (NAD 83)
Velocity, in feet per second
EXPLANATION
Figure 18. Water velocities of 10-, 50-, 100-, and 500-year recurrence interval floods along the full model reach of Sni-A-Bar Creek, simulated using a two-dimensional model—Continued.
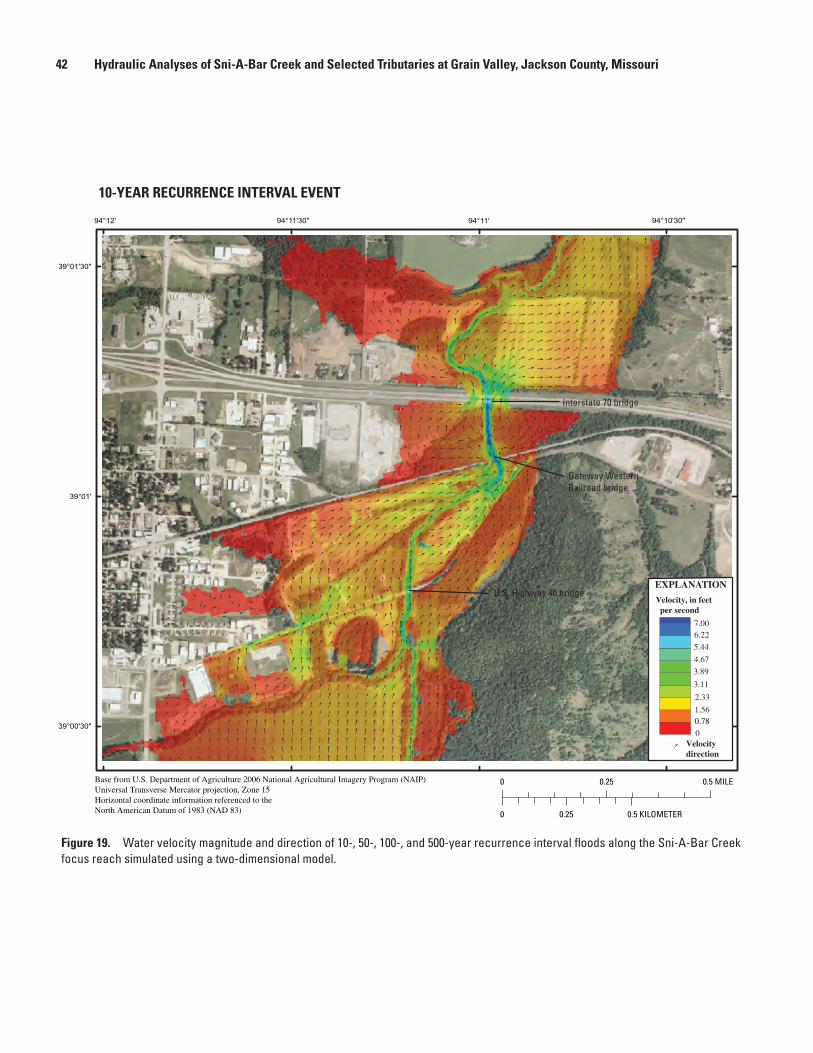
42 Hydraulic Analyses of Sni-A-Bar Creek and Selected Tributaries at Grain Valley, Jackson County, Missouri
94°10'30"94°11'94°11'30"94°12'
39°01'30"
39°01'
39°00'30"
10-YEAR RECURRENCE INTERVAL EVENT
00.781.56
2.33
3.11
3.89
4.67
5.44
6.227.00
Velocitydirection
Interstate 70 bridge
Gateway WesternRailroad bridge
U.S. Highway 40 bridge
0 0.25 0.5 MILE
0 0.25 0.5 KILOMETER
Base from U.S. Department of Agriculture 2006 National Agricultural Imagery Program (NAIP)Universal Transverse Mercator projection, Zone 15Horizontal coordinate information referenced to the North American Datum of 1983 (NAD 83)
Velocity, in feet per second
EXPLANATION
Figure 19. Water velocity magnitude and direction of 10-, 50-, 100-, and 500-year recurrence interval floods along the Sni-A-Bar Creek focus reach simulated using a two-dimensional model.

Hydraulic Analyses of Sni-A-Bar Creek Tributaries 43
94°10'30"94°11'94°11'30"94°12'
39°01'30"
39°01'
39°00'30"
50-YEAR RECURRENCE INTERVAL EVENT
00.891.78
2.67
3.56
4.44
5.33
6.22
7.118.00
Interstate 70 bridge
Gateway WesternRailroad bridge
U.S. Highway 40 bridge
0 0.25 0.5 MILE
0 0.25 0.5 KILOMETER
Base from U.S. Department of Agriculture 2006 National Agricultural Imagery Program (NAIP)Universal Transverse Mercator projection, Zone 15Horizontal coordinate information referenced to the North American Datum of 1983 (NAD 83)
Velocitydirection
Velocity, in feet per second
EXPLANATION
Figure 19. Water velocity magnitude and direction of 10-, 50-, 100-, and 500-year recurrence interval floods along the Sni-A-Bar Creek focus reach simulated using a two-dimensional model.—Continued

44 Hydraulic Analyses of Sni-A-Bar Creek and Selected Tributaries at Grain Valley, Jackson County, Missouri
94°10'30"94°11'94°11'30"94°12'
39°01'30"
39°01'
39°00'30"
100-YEAR RECURRENCE INTERVAL EVENT
01.112.22
3.33
4.44
5.56
6.67
7.78
8.8910.0
Interstate 70 bridge
Gateway WesternRailroad bridge
U.S. Highway bridge
0 0.25 0.5 MILE
0 0.25 0.5 KILOMETER
Base from U.S. Department of Agriculture 2006 National Agricultural Imagery Program (NAIP)Universal Transverse Mercator projection, Zone 15Horizontal coordinate information referenced to the North American Datum of 1983 (NAD 83)
Velocitydirection
Velocity, in feet per second
EXPLANATION
Figure 19. Water velocity magnitude and direction of 10-, 50-, 100-, and 500-year recurrence interval floods along the Sni-A-Bar Creek focus reach simulated using a two-dimensional model.—Continued

Hydraulic Analyses of Sni-A-Bar Creek Tributaries 45
94°10'30"94°11'94°11'30"94°12'
39°01'30"
39°01'
39°00'30"
500-YEAR RECURRENCE INTERVAL EVENT
01.22.4
3.7
4.9
6.17.3
8.6
9.811.0
Interstate 70 bridge
Gateway WesternRailroad bridge
U.S. Highway 40 bridge
0 0.25 0.5 MILE
0 0.25 0.5 KILOMETER
Base from U.S. Department of Agriculture 2006 National Agricultural Imagery Program (NAIP)Universal Transverse Mercator projection, Zone 15Horizontal coordinate information referenced to the North American Datum of 1983 (NAD 83)
Velocitydirection
Velocity, in feet per second
EXPLANATION
Figure 19. Water velocity magnitude and direction of 10-, 50-, 100-, and 500-year recurrence interval floods along the Sni-A-Bar Creek focus reach simulated using a two-dimensional model.—Continued

46 Hydraulic Analyses of Sni-A-Bar Creek and Selected Tributaries at Grain Valley, Jackson County, Missouri
ELEV
ATIO
N, I
N F
EET
ABOV
E N
AVD
88
DISTANCE UPSTREAM ALONG BLUE BRANCH FROM JUNCTION AT SNI-A-BAR CREEK, IN FEET
BB-100culvert
BB-900bridge
BB-1400culvert
BB-1600culvert
760
770
780
790
800
810
2,000 4,000 6,000 8,000 10,000 12,000 14,000 16,000
A) Blue Branch
BB-500bridge
DISTANCE UPSTREAM ALONG BLUE BRANCH TRIBUTARY FROM JUNCTION AT BLUE BRANCH CREEK, IN FEET
780
785
790
795
800
805
810
815
5000 1,000 1,500 2,000 2,500 3,000
B) Blue Branch Tributary
Ground elevation
1050100500
Flood profile, in years (recurrence interval)
Ground elevation
1050100500
Flood profile, in years (recurrence interval)
Figure 20. Water-surface elevation profiles of A, Blue Branch, B, Blue Branch Tributary, C, Yennie Avenue Drain, D, Swiney Branch, and E, Swiney Branch Tributary, Grain Valley, Missouri, for 10-, 50-, 100-, and 500-year recurrence interval events simulated using a one-dimensional model.

Hydraulic Analyses of Sni-A-Bar Creek Tributaries 47
DISTANCE UPSTREAM ALONG YENNIE AVENUE DRAIN FROM JUNCTION AT SNI-A-BAR CREEK, IN FEET
760
770
780
790
800
810
820
1,0000 2,000 3,000 4,000 5,000 6,000 7,000 8,000
B-110culvert
B-400culvert
B-500culvert
B-600culvert
B-800culvert
B-800 Overtop Flow Profile
780
785
790
795
5,900 6,000 6,100 6,200 6,300 6,400
C) Yennie Avenue Drain
DISTANCE UPSTREAM ALONG SWINEY BRANCH FROM JUNCTION AT SNI-A-BAR CREEK, IN FEET
ELEV
ATIO
N, I
N F
EET
ABOV
E N
AVD
88
2,500 4,500 6,500 8,500 10,500 12,500 14,500 16,500750
760
770
780
790
800
810
820
830
840
500
SB-100culvert
SB-200culvert
SB-1300culvert
SB-1700culvert
SB-1800culvert
SB-1900culvertD) Swiney Branch
Ground elevation
1050100500
Flood profile, in years (recurrence interval)
Ground elevation
1050100500
Flood profile, in years (recurrence interval)
Figure 20. Water-surface elevation profiles of A, Blue Branch, B, Blue Branch Tributary, C, Yennie Avenue Drain, D, Swiney Branch, and E, Swiney Branch Tributary, Grain Valley, Missouri, for 10-, 50-, 100-, and 500-year recurrence interval events simulated using a one-dimensional model.—Continued

48 Hydraulic Analyses of Sni-A-Bar Creek and Selected Tributaries at Grain Valley, Jackson County, Missouri
Ground elevation
1050100500
Flood profile, in years (recurrence interval)
E) Swiney Branch Tributary
SB-300culvert
SB-500culvert
DISTANCE UPSTREAM ALONG SWINEY BRANCH NORTH TRIBUTARY FROM JUNCTION AT SWINEY BRANCH, IN FEET
ELEV
ATIO
N, I
N F
EET
ABOV
E N
AVD
88
770
780
790
800
810
5000 1,000 1,500 2,000 2,500 3,000 3,500 4,000 4,500 5,000
Figure 20. Water-surface elevation profiles of A, Blue Branch, B, Blue Branch Tributary, C, Yennie Avenue Drain, D, Swiney Branch, and E, Swiney Branch Tributary, Grain Valley, Missouri, for 10-, 50-, 100-, and 500-year recurrence interval events simulated using a one-dimensional model.—Continued

Hydraulic Analyses of Sni-A-Bar Creek Tributaries 49
Tabl
e 20
. Su
mm
ary
of th
e pe
rform
ance
of h
ydra
ulic
stru
ctur
es in
Blu
e Br
anch
, Yen
nie
Aven
ue D
rain
, and
Sw
iney
Bra
nch
one-
dim
ensi
onal
si
mul
atio
ns.
[ft3 /
s, c
ubic
fee
t per
sec
ond;
in.,
inch
es; -
-, n
o ov
erto
p; s
.o.m
., se
para
te o
verf
low
mod
el]
Hyd
raul
ic
stru
ctur
es
iden
tific
atio
na
Type
of
st
ruct
ure
10-y
r 50
-yr
100-
yr
500-
yr
Mod
elD
isch
arge
(ft
3 /s)
Ove
rtop
(in
.)D
isch
arge
(ft
3 /s)
Ove
rtop
(in
.)D
isch
arge
(ft
3 /s)
Ove
rtop
(in
.)D
isch
arge
(ft
3 /s)
Ove
rtop
(in
.)
Blu
e B
ranc
hB
B-1
00C
ulve
rt
5,29
0--
8,33
1--
9,85
3--
13,4
629.
24
BB
-900
Bri
dge
5,11
0--
7,98
1--
9,38
0--
12,7
80--
BB
-140
0C
ulve
rt
5,11
0--
7,98
16.
249,
380
16.9
212
,780
32.6
BB
-160
0C
ulve
rt
2,45
0--
3,83
26.
244,
471
13.8
06,
060
26.0
Blu
e B
ranc
h T
ribu
tary
B
B-5
00B
ridg
e2,
546
--3,
853
--4,
647
--6,
247
--
Yen
nie
Ave
nue
Dra
in
B-1
10C
ulve
rt
470
--61
1--
696
2.88
904
4.44
B-4
00C
ulve
rt
270
--34
1--
396
--47
4--
B-5
00C
ulve
rt
270
3.96
341
6.84
396
7.92
474
9.12
B-6
00C
ulve
rt
270
8.76
341
12.7
239
615
.00
474
16.6
8
B-8
00C
ulve
rt
270
s.o.
m34
1s.
o.m
396
s.o.
m47
4s.
o.m
Swin
ey B
ranc
hSB
-100
Cul
vert
1,
762
--2,
677
--3,
295
.48
4,65
86.
72
SB-2
00C
ulve
rt
1,55
4--
2,34
5--
2,89
97.
084,
082
18.0
SB-1
300
Cul
vert
97
5--
1,47
38.
881,
730
11.6
42,
324
17.5
2
SB-1
700
Cul
vert
60
7--
915
.72
1,09
87.
561,
533
15.2
4
SB-1
800
Cul
vert
53
0--
812
--95
7.8
41,
345
9.48
SB-1
900
Cul
vert
43
1--
678
--76
3--
1,08
8--
Swin
ey B
ranc
h T
ribu
tary
SB-3
00C
ulve
rt
837
--1,
264
7.80
1,51
95.
161,
967
9.60
SB-5
00C
ulve
rt
823
--1,
243
--1,
494
6.24
1,93
516
.32
a Loc
atio
n of
the
hydr
aulic
str
uctu
res
indi
cate
d in
fig
ures
5–1
1.

Hydraulic Analyses of Sni-A-Bar Creek Tributaries 5150 Hydraulic Analyses of Sni-A-Bar Creek and Selected Tributaries at Grain Valley, Jackson County, Missouri
Min
ter R
oad
U.S. Highway 40
Tars
ney
Road
Base from U.S. Department of Agriculture 2006 National Agricultural Imagery Program (NAIP)Universal Transverse Mercator projection, Zone 15Horizontal coordinate information referenced to the North American Datum of 1983 (NAD 83)
94°11'30"94°11'45"94°12'94°12'15"94°12'30"94°12'45"94°13'94°13'15"94°13'30"94°13'45"94°14'
39°01'
39°00'45"
39°00'30"
39°00'15"
39°00'
EXPLANATION
Floodplain
Stream
0 500 1,000 1,500 2,000 FEET
0 200 400 600 METERS
Blue Branch
Blue Branch tributary
Figure 21. Simulated flood plain for the 100-year recurrence interval flood along Blue Branch and Blue Branch Tributary, Grain Valley, Missouri.
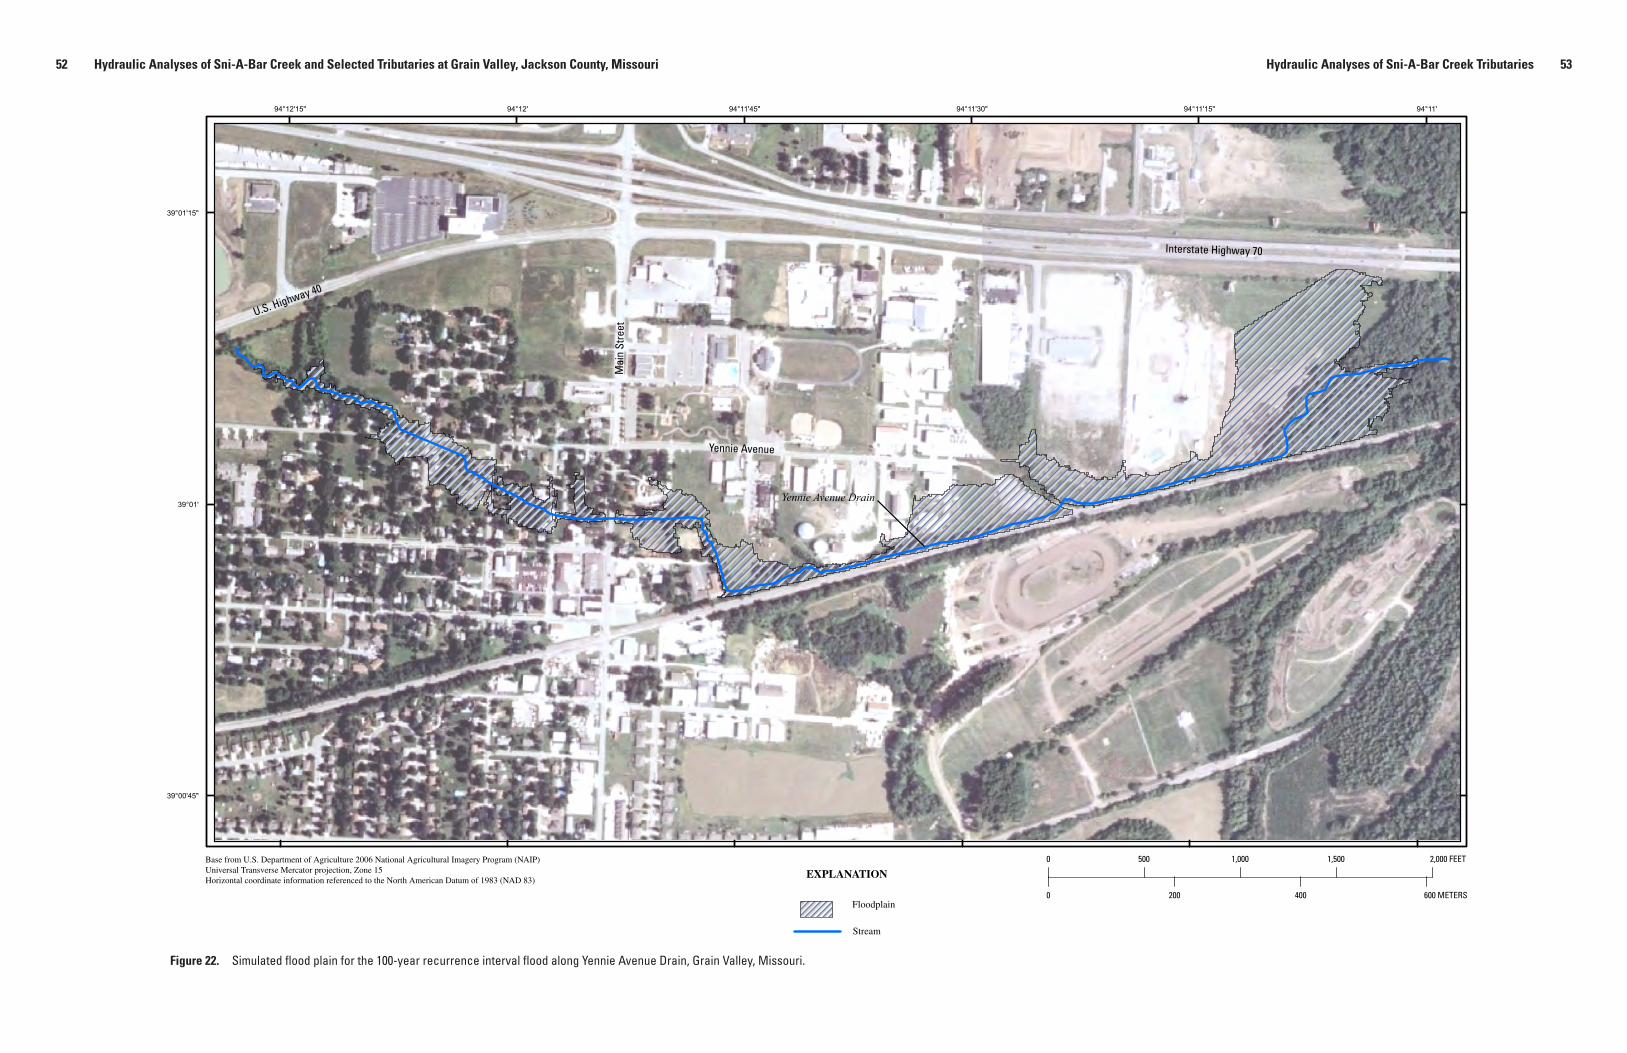
Hydraulic Analyses of Sni-A-Bar Creek Tributaries 5352 Hydraulic Analyses of Sni-A-Bar Creek and Selected Tributaries at Grain Valley, Jackson County, Missouri
Base from U.S. Department of Agriculture 2006 National Agricultural Imagery Program (NAIP)Universal Transverse Mercator projection, Zone 15Horizontal coordinate information referenced to the North American Datum of 1983 (NAD 83)
EXPLANATION
Floodplain
Stream
94°11'94°11'15"94°11'30"94°11'45"94°12'94°12'15"
39°01'15"
39°01'
39°00'45"
0 500 1,000 1,500 2,000 FEET
0 200 400 600 METERS
Mai
n St
reet
Yennie Avenue
Interstate Highway 70
U.S. Highway 40
Yennie Avenue Drain
Figure 22. Simulated flood plain for the 100-year recurrence interval flood along Yennie Avenue Drain, Grain Valley, Missouri.

Hydraulic Analyses of Sni-A-Bar Creek Tributaries 5554 Hydraulic Analyses of Sni-A-Bar Creek and Selected Tributaries at Grain Valley, Jackson County, Missouri
Interstate Highway 70
Duncan Road
Rust
Roa
d
Seym
our R
oad
Base from U.S. Department of Agriculture 2006 National Agricultural Imagery Program (NAIP)Universal Transverse Mercator projection, Zone 15Horizontal coordinate information referenced to the North American Datum of 1983 (NAD 83)
94°10'45"94°11'94°11'15"94°11'30"94°11'45"94°12'94°12'15"94°12'30"94°12'45"94°13'94°13'15"
39°02'15"
39°02'
39°01'45"
39°01'30"
39°01'15"
EXPLANATION
Floodplain
0 500 1,000 1,500 2,000 FEET
0 200 400 600 METERS
Swiney Branch
Swiney Branch tributary
Stream
Figure 23. Simulated flood plain for the 100-year recurrence interval flood along Swiney Branch and Swiney Branch Tributary, Grain Valley, Missouri.

56 Hydraulic Analyses of Sni-A-Bar Creek and Selected Tributaries at Grain Valley, Jackson County, Missouri
Summary
A study was done by the U.S. Geological Survey, in cooperation with the city of Grain Valley, Jackson County, Missouri, to simulate the hydraulic characteristics of Sni-A-Bar Creek and selected tributaries within the corporate limits. The 10- , 50-, 100-, and 500-year recurrence interval stream-flows were simulated to determine potential backwater effects on the Sni-A-Bar Creek main stem and to delineate the flood-plain boundaries on the tributaries.
Results using one-dimensional simulations illustrated potential backwater ranging from 0.5 ft to 1.5 feet upstream from contracted openings. As backwater propagated upstream to the junction of Sni-A-Bar creek and Blue Branch, the reach simulated with structures and the reach simulated without structures resulted in a water-surface elevation difference from 0.2 to 0.5 feet (corresponding to simulated 10-year and 500-year flood occurrences).
The water-surface profiles through the bridge structures within the model area indicated that backwater effects from the constrictions were not substantial. The water-surface profile of Sni-A-Bar Creek generated from the one- and two-dimensional models indicated that the Gateway Western railroad structure provided the greatest amount of contraction of flow within the modeled area. The results at the upstream face of the railroad structure indicated a water-surface eleva-tion difference from 0.2 to 0.8 feet (corresponding to simu-lated 10-year and 500-year flood occurrences). Results from all analyses indicated minimal backwater effects as a result of an overall minimal energy grade line slope and velocity head along Sni-A-Bar Creek.
Analyses were conducted on the overtopping of hydrau-lic structures along three Sni-A-Bar Creek tributaries—Blue Branch, Yennie Avenue Drain, and Swiney Branch. The results indicated that on Blue Branch, two of the four structures (BB-1400 and BB-1600), fail to convey flows greater than a 10-yr event. On Yennie Avenue Drain, three of the five (B-500, B-600, and B-800) structures were overtopped for all the mod-eled events. Most of the structures along Swiney Branch per-formed well under the 10- and 50-year events. Swiney Branch Tributary structures performed as expected, overtopping only for the 100- and 500-year recurrence interval events, with the exception of structure SB-300, which experienced overtopping during the 50-year event.
The flood plain for the 100-year recurrence interval floods on the Sni-A-Bar tributaries were mapped to show the extent of the inundated area. This effort will assist city manag-ers in recognizing changes in flood risk and zoning as deter-mined through the National Flood Insurance Program.
References Cited
Alemseged, T.H., and Rientjes, T.H.M., 2007, Uncertainty issues in hydrodynamic flood modeling, in Spatial Data Quality 2007 5th International Symposium Proceedings, Enschede, Netherlands, 2007, 6 p.
Alexander, T.W., and Wilson, G.L., 1995, Techniques for esti-mating the 2- to 500-year flood discharges on unregulated streams in rural Missouri: U.S. Geological Survey Water-Resources Investigations Report 95–4231, 33 p.
Arcement, G.J., Jr. and Schneider, V.R., 1989, Guide for selecting Manning’s roughness coefficients for natural chan-nels and flood plains: U.S. Geological Survey Water-Supply Paper 2339, 38 p.
Barnes, H.H., Jr., 1967, Roughness characteristics on natu-ral channels: U.S. Geological Survey Water-Supply Paper 1849, 213 p.
Brunner, G.W., 2002, HEC-RAS, river analysis system hydraulic reference manual: U.S. Army Corps of Engineers Hydrologic Engineering Center CPD-69, Davis, Calif., 350 p.
Burns and McDonnell Engineering Company, 2004, Storm-water master plan for the city of Grain Valley, Missouri: Kansas City, Mo., Project 34130, 52 p.
Chow, V.T., 1959, Open channel hydraulics: New York, McGraw Hill, Inc., 680 p.
Dalrymple, Tate, and Benson, M.A., 1967, Measurement of peak discharge by slope-area method: U.S. Geological Survey Techniques of Water-Resources Investigations, book 3, chap. A2, 12 p.
Federal Insurance Administration, 1979, Flood insurance study, city of Grain Valley, Jackson County Missouri: Federal Insurance Administration, Flood Insurance Study Report, Washington, D.C.
Froehlich, D.C., 2003, User’s manual for FESWMS FST2DH—Two dimensional depth-averaged flow and sedi-ment transport model, release 3: Federal Highway Adminis-tration, Publication Number FHWA–RD–03–053, 178 p.
Mastin, M.C., and Kresch, D.L., 2003, Application of LIDAR terrain mapping to flood-hazard mapping, in Symposium on the Hydrogeology of Washington State, 4th, Tacoma, Wash., 2003.
National Oceanic and Atmospheric Administration, 2007, About LiDAR data, accessed September 12, 2007, at http://www.csc.noaa.gov/products/sccoasts/html/tutlid.htm.

References Cited 57
U.S. Army Corps of Engineers, 1995, RD-42 Flow transitions in bridge backwater analysis: U.S. Army Corps of Engi-neers Institute for Water Resources, Hydrologic Engineer-ing Center, Davis, Calif., 81 p.
U.S. Army Corps of Engineers, 2002, HEC-RAS River Analysis System User’s Manual, v. 3.1: U.S. Army Corps of Engineers Institute for Water Resources, Hydrologic Engi-neering Center, Davis, Calif., 408 p.
U.S. Army Corps of Engineers, 2006, HEC-GeoRAS, accessed November 15, 2006, at http://www.hec.usace.army.mil/software/hec-ras/hec-georas.html.
U.S. Department of Agriculture, 2006, National agriculture imagery program, accessed August 18, 2006, at http://www.msdis.missouri.edu/data/naip2006/index.htm.

Publishing support provided by: Rolla Publishing Service Center
For more information concerning this publication, contact:Director, USGS Missouri Water Science Center1400 Independence RoadRolla, MO 65401(573) 308–3667
Or visit the Missouri Water Science Center Web site at:
http://mo.water.usgs.gov


Rydlund and others—H
ydraulic Analyses of Sni-A
-Bar Creek at G
rain Valley, Jackson County, Missouri—
Scientific Investigations Report 2008–5051
Printed on recycled paper