Embed Size (px)
Citation preview
Hydrogen rich product gas from air-steamgasi�cation of Indian biomasses with waste engineoil as binderPrashant Sharma
Jabalpur Engineering College https://orcid.org/0000-0003-3843-099XBhupendra Gupta ( [email protected] )
Jabalpur Engineering College https://orcid.org/0000-0001-9559-9578Mukesh Pandey
RGPV: Rajiv Gandhi Proudyogiki Vishwavidyalaya
Research Article
Keywords: Downdraft biomass gasi�er, Product gas, Kasai saw dust, Lemon grass, Wheat straw, PigeonPea seed coat, Steam to Biomass (S/B) ratio, Equivalence ratio, Waste engine oil
Posted Date: September 16th, 2021
DOI: https://doi.org/10.21203/rs.3.rs-794017/v1
License: This work is licensed under a Creative Commons Attribution 4.0 International License. Read Full License
“Hydrogen rich product gas from air-steam gasification of Indian
biomasses with waste engine oil as binder”
Abstract
Present study concerns with the production of H2 rich product gas by thermochemical energy conversion
having biomass gasification as a route for the four biomasses i.e., Kasai Saw Dust, Lemon Grass, Wheat
Straw and Pigeon Pea Seed Coat. The biomasses are from the family of woody biomass, grasses,
agricultural waste and food process industry wastes. Waste engine oil as an additive is used, which also
acts as a binder. Air gasification and Air-steam gasification is applied and compared for product gas
composition, hydrogen yield and other performance parameters like lower heating value, energy yield.
Product gas constituents, hydrogen production is examined with different steam to biomass ratio (S/B
ratio) and equivalence ratio. The equivalence ratio varies from 0.20-0.40 and the steam to biomass ratio
varies between 0-4. The waster engine oil is mixed with the biomasses with different percentage of 5
and 10 wt%. For enhancement of feedstock quality palletization process is applied. The H2 yield is
greatly affected by the equivalence ratio. Results show maximum H2 production and higher calorific
value of product gas at an air to fuel of 0.26 for all the biomass pallets. Also, the S/B ratio observed as
important aspect for hydrogen enrichment. Hydrogen yield is maximum at 2.4 steam to biomass ratio.
This study considers the rarely studied Indian biomasses with waste engine oil as an additive for
hydrogen-rich product gas production and will be beneficial for small scale hydrogen-rich syngas
production considering the central Indian region originated biomasses.
Statement of Novelty (SON): Research work belongs to eco-friendly use of rarely studied Indian
biomass pallets. Equivalence air to fuel ratio (E/R ratio), steam to biomass ratio (S/B ratio) and waste
engine oil as additive have been considered to upgrade H2 content and Calorific Value (CV) of the
product gas. Novelty of work include use of waste engine oil as additive to make biomass pallets.
Keywords: Downdraft biomass gasifier, Product gas, Kasai saw dust, Lemon grass, Wheat straw,
Pigeon Pea seed coat, Steam to Biomass (S/B) ratio, Equivalence ratio, Waste engine oil.
1. Introduction
Energy from biomass can be considered an environmentally friendly and renewable energy sources [1].
Biomass energy has a huge potential to come out with the world's energy demand while without
increasing the environmental problems. The biomasses can be utilized using the various routes of
thermochemical conversion process like combustion, pyrolysis, gasification and liquefaction [2]. The
conversion method opted are depends on the key decision factors like category and amount of biomass,
required configuration of output fuel, fuel transportation, end-user applications and infrastructure
availability. For developing and agriculture-based economy like India with the increasing energy
demand creates huge pressure on energy resources. India is an agricultural country with more than half
of the total land as farms [3] which is approximately 2 Mkm2 (60.49% of land area) [4]. The availability
of agricultural wastes, wastes after food processing industry is in huge amount and this should be
utilized as much as possible to cope up with energy demand without depending on fossil fuel. In the
year 2015, it is estimated in another study around 5×10⁹ metric tons annually by A Kumar et al, 2015
[5].
The basic problem of utilization of biomass is the infrastructure availability, as it required immense
investment. Rather than applying huge biomass plants, small scale gasification plants can be the best
solution. Various researchers have carried out their work considering either small scale or pilot scale
gasification systems [5]–[9]. The end application selected by most of the researchers are the internal
combustion engine set [10]. Having the higher energy per gram (i.e., 142 kJ/g), better transportation
ability, environmentally supportive as it doesn’t release hydrocarbon, oxides of carbons and nitrogen, Hydrogen proves its importance in the energy field [11]. Clean hydrogen energy can be generated via
the thermochemical conversion route, usually by gasification of biomasses having high organic content.
Various researchers emphasise H2 rich producer gas production [12]–[18].
For hydrogen-rich gasification product, steam gasification is one of the best options. Various
researchers suggest steam as a gasifying medium for advanced creation of H2 or H2 abundant product
gas. Steam is used as a gasification agent as well as a heat carrier [13]. Trabelsi et al., 2007 applied pre-
treatment of feedstock prior to gasification [14]. Air, O2 and steam are the common mediums for
gasification. Compare through air gasification, steam gasification having some limitations like more
energy consumption, LHV of the product, external heat source etc. Some researchers carried out their
research for hydrogen-rich gasification product considering steam gasification. Lv et al., 2007 applied
the air and O2/H2O(vapour) as gasifying agent in downdraft gasifier and observed that steam gasification
is more favourable for H2 rich gas production [15]. Adefeso et al., 2015 integrated the H2 rich gas with
fuel cell based structure [16]. S. Valizadeh et al., 2021 applied steam and air gasification [17]. Rakesh
& Dasappa, 2018 utilized O2/H2O(vapour) as the gasification medium for downdraft gasifier and
analyse the tar collected [19].
Different species have different composition of Syngas after gasification. There are different types of
Indian biomass like Bamboo, Gulmohur, Dimaru, Shisham/Sesame, Neem wood [20]-[21] Babul wood
[22], Mango Wood, Tung shells [23] Bagasse, Jatropha shells [24], Pongamia residue [25], garden
waste [26] are considered for study by the researchers. Still a lot of agricultural by-products, forest and
processing industry wastes are required to examine.
Inclusion of additives are favourable for improvement of quality and composition of syn-gas, some
additives also worked as binders. Gonzalez et al 2019, used glycerol (varying between 0-5% wt.) as a
binder for fallen leaves biomass and observed increment of CH4 by 25% and H2 by 20% compare to
biomass without a binder[27]. Shone & Jothi, 2016 considered the leaves of Teak and Rubber tree
having tapioca starch as a binder at different biomass to binder ratio[28]. Nobre et al., 2020 used Refuse
derived fuel char with 0, 5 and 10% incorporation as additive with Pine waste biomass for
gasification[29].
Most of the gasifier working in India are downdraft gasifiers and considered mostly for woody biomass
[30]. Given the above context, in the present analysis, four different central Indian based biomasses
Kasai (Pometia pinnata) sawdust, as woody biomass waste, lemongrass as grasses, wheat straw as
wastes left on the agricultural land, pigeon pea (Cajanus cajan) seed coat as the food processing industry
wastes are considered. Apart from all of this waste automotive engine oil is utilized as additives which
also acts as binders and reduced the friction during the palletization process. There is rare information
even not for some biomasses are available in the literature. The waste engine oil as the additive is also
not available in the literature, best of our knowledge.
The aim of the current analysis is concentrated on the production of H2 rich product gas based on air
and air-steam gasification of Kasai Sawdust, Lemon-Grass, Wheat Straw and Pigeon Pea Seed Coat
biomasses with waste automotive engine oil as additive or binder for downdraft gasification system.
For the analysis, Down-draft fixed bed gasifier is considered due to its advantages of low tar generation,
compatibility with pallets, accessible gasification temperature.
2. Process Modelling
The thermochemical conversion for different required products has different aspects or parameters like
temperature, ER etc. of reaction stages and named gasification, pyrolysis and torrefaction. For the
gasification process, pyrolysis is one of the stages which contains the vary little or absence of oxygen
and products partially removed carbon without the addition of hydrogen. In complete gasification,
oxidising agents like steam, air are used to produce the chemical bonds that can release energy after
oxidization[31]–[33].
It is a renowned reality that in biomass gasification four regions i.e., drying, pyrolysis, combustion, and
gasification are established [34]. Drying of biomass for reduction of moisture content up to 5% is taken
place in the drying zone. In second region, i.e., pyrolysis, the disintegration of biomass takes place
without oxygen. The pyrolysis process that taken place in the pyrolysis zone produces a mixture of CO,
H2, CO2, hydrocarbons and solid char. During the pyrolysis, the combustion process also continues
simultaneously. Both processes create a pyro-oxidation zone. In the last process, i.e., in the gasification
zone, numerous reactions take place. Following reactions are prime considerations for gasification:
Boudouard reaction C + CO2 ↔ 2CO (R-1)
Primary water–gas reaction C + H2O ↔ CO + H2 (R-2) C + 2H2 → CH4 (R-3)
Water–gas shift reaction CO + H2O ↔ CO2 + H2 (R-4)
Steam methane reforming reaction CH4 + H2O ↔ CO + 3H2 (R-5)
Numerous researchers provide various methods for modelling biomass materials [35]–[40]. In a
downdraft gasifier, the gasification process follows drying, flaming pyrolysis (combustion & pyrolysis)
and finally the product gasified. For the process modelling, the equilibrium approach has been
considered for combustion and pyrolysis while for the gasification kinetic modelling approach
considered. The chemical formulae for each biomass are given in table 3
(a) Pyrolysis-oxidation Zone
The comprehensive gasification reaction is as [35], [36] CHpOq + rH2O + mO2 + 3.76mN2 → aH2 + bCO + cCO2 + dH2O + eCH4 + 3.76mN2 (R-6)
The values of quantity of water per kmol of biomass (r) can be calculated as: r = Moisture Content(100−MC)×(100−Ash) × MfuelMH2O (1)
M stands for molar mass. By considering the mass balance equations for hydrogen, carbon, and oxygen 1 = b + c + e, based on C balance (2) 2r + 1.44 = 2a + 2d + 4e, based on H balance (3) r + 0.66 + 2m = b + 2c + d, based on O balance (4)
Equation (R-2) shows the methane formation while (R-3) shows the shift reaction. The equilibrium
constants are as
K1 = PCH4(PH2)2 = ea2 (5)
K2 = PCO2PH2PCOPH2O = a×cb×d (6)
The heat balance equation for the process dHbiomass + rdHH2O(l) = a dHH2 + b dHCO + c dHCO2 + d dHH2O(vap) + e dHCH4 + 3.76mdHN2 (7)
The equilibrium constant K can be given as [36] −RTln K = ∆G0 (8)
Here ∆G0 is the standard Gibbs function of formation. The relation between Heat of formation ΔH0,
Standard Gibb’s function ∆𝐺0 is
d(∆G0RT )dT = −∆HoRT2 (9)
and ∆H0R = VR + (∆W)T + ∆X2 T2 + ∆Y2 T3 − ∆ZT (10)
From equation (9) and (10) ln K = −VRT + (∆W)lnT + ∆X2 T + ∆Y6 T2 + ∆Z2T2 + U (11)
And standard Gibb’s function ∆𝐺0 can be given as ∆G0 = V − RT ((∆W)lnT + ∆X2 T + ∆Y6 T2 + ∆Z2T2 + U) (12)
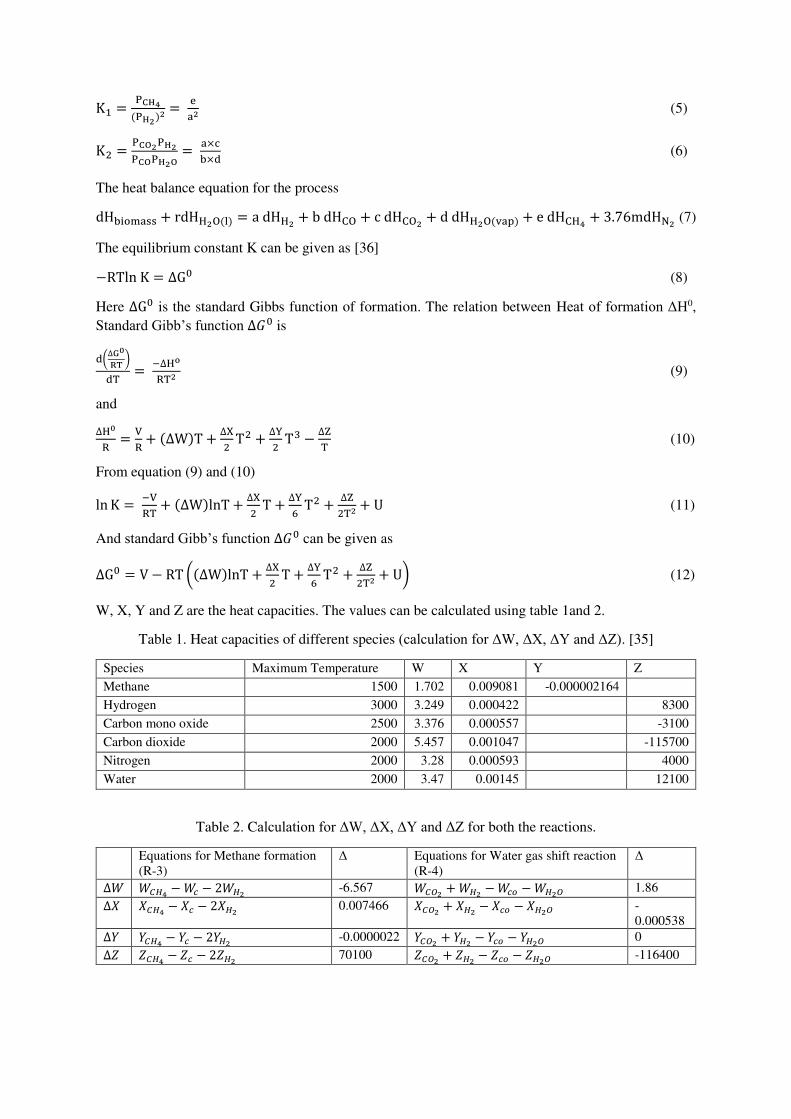
W, X, Y and Z are the heat capacities. The values can be calculated using table 1and 2.
Table 1. Heat capacities of different species (calculation for ΔW, ΔX, ΔY and ΔZ). [35]
Species Maximum Temperature W X Y Z
Methane 1500 1.702 0.009081 -0.000002164
Hydrogen 3000 3.249 0.000422
8300
Carbon mono oxide 2500 3.376 0.000557
-3100
Carbon dioxide 2000 5.457 0.001047
-115700
Nitrogen 2000 3.28 0.000593
4000
Water 2000 3.47 0.00145
12100
Table 2. Calculation for ΔW, ΔX, ΔY and ΔZ for both the reactions.
Equations for Methane formation
(R-3)
Δ Equations for Water gas shift reaction
(R-4)
Δ ∆𝑊 𝑊𝐶𝐻4 − 𝑊𝑐 − 2𝑊𝐻2 -6.567 𝑊𝐶𝑂2 + 𝑊𝐻2 − 𝑊𝑐𝑜 − 𝑊𝐻2𝑂 1.86 ∆𝑋 𝑋𝐶𝐻4 − 𝑋𝑐 − 2𝑋𝐻2 0.007466 𝑋𝐶𝑂2 + 𝑋𝐻2 − 𝑋𝑐𝑜 − 𝑋𝐻2𝑂 -
0.000538 ∆𝑌 𝑌𝐶𝐻4 − 𝑌𝑐 − 2𝑌𝐻2 -0.0000022 𝑌𝐶𝑂2 + 𝑌𝐻2 − 𝑌𝑐𝑜 − 𝑌𝐻2𝑂 0 ∆𝑍 𝑍𝐶𝐻4 − 𝑍𝑐 − 2𝑍𝐻2 70100 𝑍𝐶𝑂2 + 𝑍𝐻2 − 𝑍𝑐𝑜 − 𝑍𝐻2𝑂 -116400
The set of equations (2)-(7) can be solved to find out the value of a, b, c, d and e. For finding out the
value of constants K1 and K2, equation (11) at specific temperature of reactions can be utilized. The
thermodynamic properties can be obtained from [35].
The exit value of species amounts and thermal properties of present region are considered as input
parameter to the next region. Reactions R-1,2,3 and 5 are considered for reduction zone. The reaction
rates for these reduction zones are as [41] :
KR−1 = CRFAR1 exp (−ER1RmT ) [(nCO2ntot ) − (nCO2ntot )2exp[−2GT,COo −GT,CO20RmT ]] (13)
KR−2 = CRFAR2 exp (−ER2RmT ) [(nH2Ontot ) − (nH2ntot)(nCOntot)exp[−GT,COo +GT,H20 −GT,H2O0RmT ]] (14)
KR−3 = CRFAR3 exp (−ER3RmT ) [(nH2ntot)2 − (nCH4ntot )exp[−GT,CH4o −2GT,H20RmT ]] (15)
KR−5 = CRFAR5 exp (−ER5RmT ) [(nH2Ontot ) (nCH4ntot ) − (nCOntot)(nH2ntot)3exp[−GT,COo +3GT,H20 −GT,CH4o −GT,H2O0RmT ]] (16)
ni number of species in mole
and ntot total number of all species in product gas in moles
CRF represents the char reactivity factor, the kinetic constants of the constraints can be obtained from
table 3.
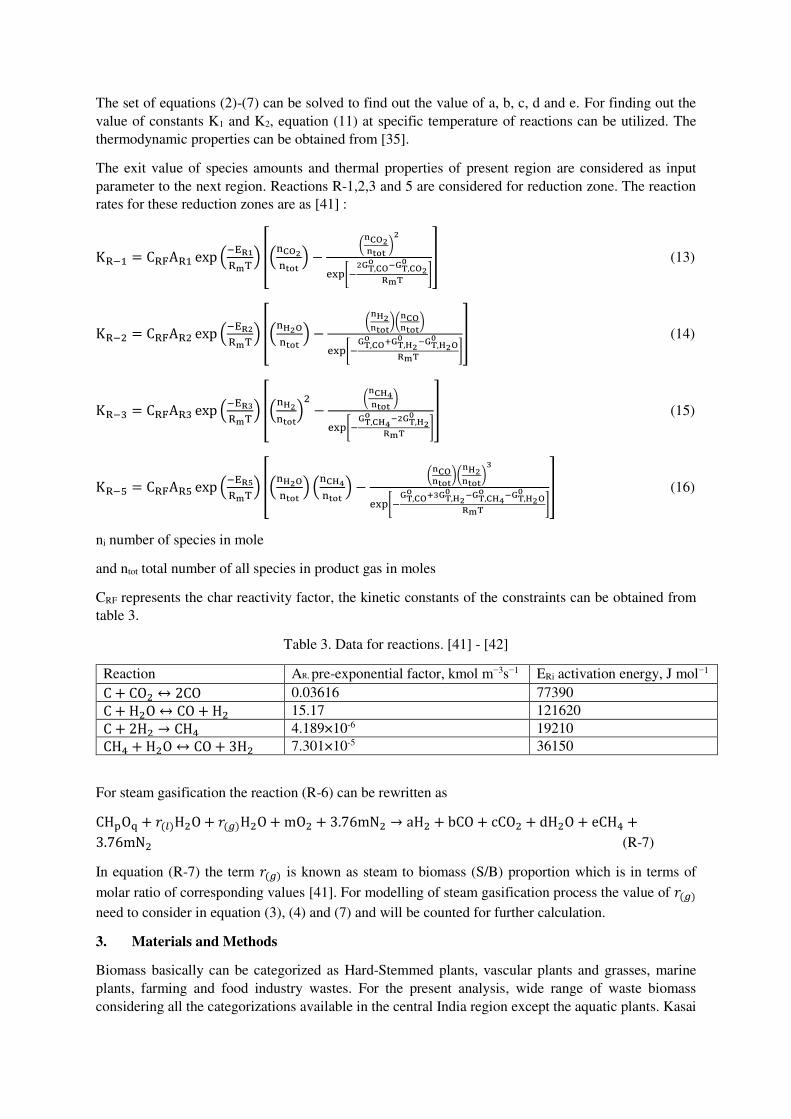
Table 3. Data for reactions. [41] - [42]
Reaction AR, pre-exponential factor, kmol m−3s−1 ERi activation energy, J mol−1 C + CO2 ↔ 2CO 0.03616 77390 C + H2O ↔ CO + H2 15.17 121620 C + 2H2 → CH4 4.189×10⁻⁶ 19210 CH4 + H2O ↔ CO + 3H2 7.301×10⁻⁵ 36150
For steam gasification the reaction (R-6) can be rewritten as CHpOq + 𝑟(𝑙)H2O + 𝑟(𝑔)H2O + mO2 + 3.76mN2 → aH2 + bCO + cCO2 + dH2O + eCH4 +3.76mN2 (R-7)
In equation (R-7) the term 𝑟(𝑔) is known as steam to biomass (S/B) proportion which is in terms of
molar ratio of corresponding values [41]. For modelling of steam gasification process the value of 𝑟(𝑔) need to consider in equation (3), (4) and (7) and will be counted for further calculation.
3. Materials and Methods
Biomass basically can be categorized as Hard-Stemmed plants, vascular plants and grasses, marine
plants, farming and food industry wastes. For the present analysis, wide range of waste biomass
considering all the categorizations available in the central India region except the aquatic plants. Kasai
(Pometia Pinnata) sawdust is considered as woody biomass waste, Lemon Grass is considered as
Grasses and Wheat straw as the agricultural wastes and pigeon pea (Cajanus cajan) seed coat as food
industry waste are considered. Apart from all of this waste automotive engine oil is utilized as additives
or binders. The Kasai sawdust is obtained from the shiv wood timber cutting plant, Jabalpur M.P.
(India). The Lemon Grass, Wheat straw are collected from the farms near Jabalpur. The lemon grass
wastes are the residue after oil removal while the wheat straw is the wastes obtained after processing.
Pigeon pea also called Arhar seed coats are obtained from the local mill used by farmers. The waste
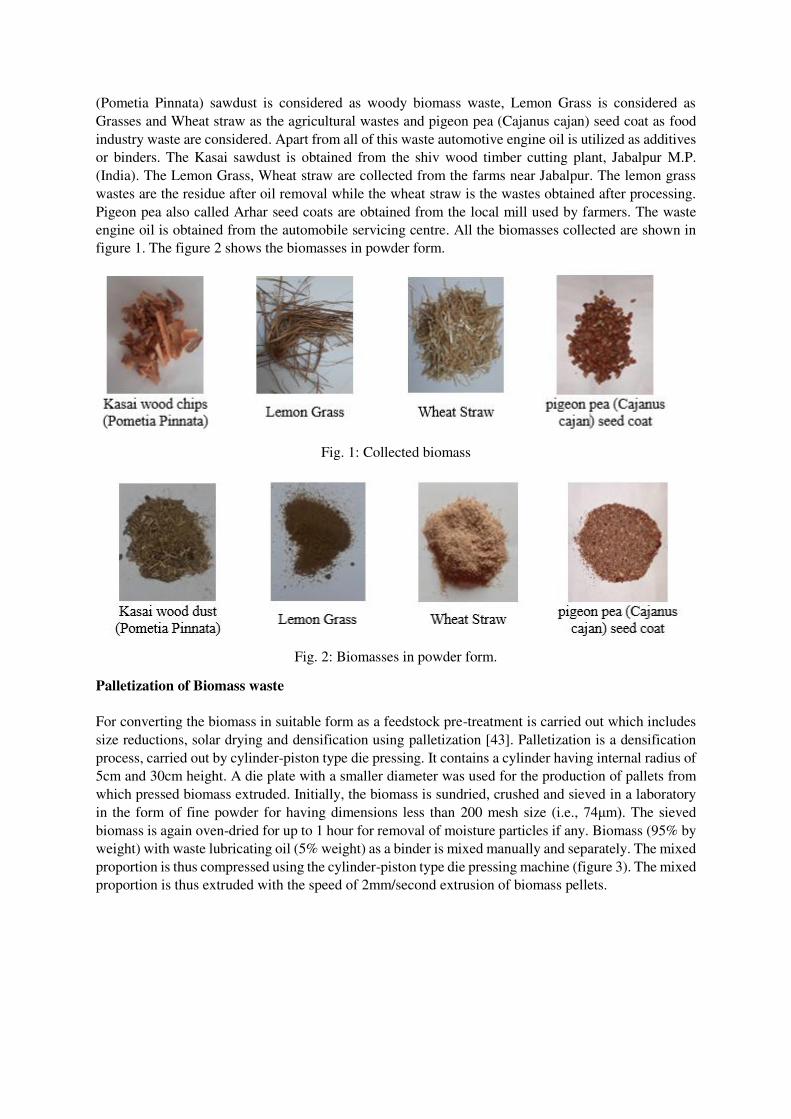
engine oil is obtained from the automobile servicing centre. All the biomasses collected are shown in
figure 1. The figure 2 shows the biomasses in powder form.
Fig. 1: Collected biomass
Fig. 2: Biomasses in powder form.
Palletization of Biomass waste
For converting the biomass in suitable form as a feedstock pre-treatment is carried out which includes
size reductions, solar drying and densification using palletization [43]. Palletization is a densification
process, carried out by cylinder-piston type die pressing. It contains a cylinder having internal radius of
5cm and 30cm height. A die plate with a smaller diameter was used for the production of pallets from
which pressed biomass extruded. Initially, the biomass is sundried, crushed and sieved in a laboratory
in the form of fine powder for having dimensions less than 200 mesh size (i.e., 74μm). The sieved
biomass is again oven-dried for up to 1 hour for removal of moisture particles if any. Biomass (95% by
weight) with waste lubricating oil (5% weight) as a binder is mixed manually and separately. The mixed
proportion is thus compressed using the cylinder-piston type die pressing machine (figure 3). The mixed
proportion is thus extruded with the speed of 2mm/second extrusion of biomass pellets.
Fig. 3: Biomass palletizing arrangement (a) piston cylinder (b) Die.
Characterization of biomass
The characterization of biomass is carried out with the help of proximate and ultimate investigation of
the biomass with and without the binder. The proximate analysis is carried out for estimation of FC,
Moisture, VM and Ash while the ultimate analysis is carried out for C, H, N, S and O content in the
biomass. The ratio of feedstock to binder is considered as 0-0.1 wt.%. The proximate and ultimate
analysis is carried out by adopting the IS:1360 (P-1) and (P-4, section 1 & 2) Indian standards[44], [45].
Table 4 shows both the proximate and ultimate analysis for all the feedstock separately. The lower
heating value, higher heating value calculated using equation (17-18)
Table 4. Ultimate and proximate analysis of the biomasses.
Biomass C H N S O FC VM Ash MC Chemical Formulae Molecular
weight
gm m̸ol
Calorific
Value
Kasai wood
dust (Pometia
Pinnata)
50.3 6.24 0.12 0.02 43.2 13.8 70.1 1.1 15 CH1.47O0.64N0.002 34.12 17.207
Lemon Grass 41 6.1 1.54 0.01 51.3 24.8 60 7.21 8.02 CH1.77O0.94N0.032 44.32 13.858
Wheat Straw 48 5.5 0.44 0.16 45.9 10.5 72.5 6.93 10 CH1.36O0.71N0.008 36.46 16.246
Pigeon Pea
(Cajanus cajan)
Seed Coat
45.6 7.53 0.82 0.12 45.8 17 71 4.82 7.2 CH1.96O0.75N0.015 38.3 15.749
LHVbiomass = HHVbiomass − hfg(9H + M) (17)
The higher heating value can be estimated using [46], [47] HHV (MJkg) = 0.3383C + 1.443 (H − (O8)) + 0.0942 S (18)
Though numerous relationships are existing for biomasses, Vargas-Moreno et al. [47] proposed a
relation that is appropriate for inclusive diversity of plant types: HHV (MJkg) = 0.3491C + 1.1783H − 0.1034O + 0.1005S − 0.0151N − 0.0211Ash (19)
4. Experimental Analysis
A detailed experimental analysis considering 4 biomasses with different percentage of binders have
been carried out. The experimental system comprises downdraft biomass gasifier of inside diameter of
665 mm, 0.25mm thickness and height if about 2110mm. The throat diameter is about 200mm. Air
blower with the specification of 220-240V, 500W, 0-16000 RPM and 6 different speed characterization
is employed for induction forces and creation of negative pressure inside the chamber for air supply.
The total number of 6 nozzles of 1cm inside and 0.5 mm outside diameter are employed radially in the
chamber and supply tubes are touching the gasifier combustion zone provides the air preheating effect.
For measurement of air velocity, an air anemometer with the threshold of 0.3 and accuracy of ±3% ±
0.1 is installed. Total 5 S-type thermocouples with the range of 200°C-1600°C, accuracy up to 0.25%
are installed in each zone. The thermocouples are installed at 2000, 1135, 710, 470, 150 mm height
from the bottom. A multichannel digital temperature indicator with accuracy ±0.1°C is installed in
connection with thermocouples. A proper arrangement is made that the unused heat of product gas is
used for moisture removal of pallets during feeding. For starting of biomass gasifier, initial temperature
is required which is attend by combustion of pulverized coal. As the combustion occur the temperature
inside the gasifier cylinder which can be measured using a thermocouple installed is elevated gradually.
When the temperature is sufficiently high (almost 1180K), weighed pallets gasifying agents are started
to supply. For commercialized biomass gasifier another medium of initial heat source can be adopted.
After 10-15 minutes the sample of gas generated is collected from the nozzle and tested by the gas
analyser. This arrangement of the experiment is repeated for each sample. Collection of ash, feeding of
biomass pallets are carried out using grate and hopper respectively. An electric coil heating device is
also installed with a pipe supply for steam generation and transportation at temperature up to 1100K
and pressure up to 0.4 MPa.
The equivalence ratio (ER) is the prime considered parameter as it greatly affects the outcome of the
gasification processes. Some researchers have taken it in the range of (0.08-0.8)[48], while some varied
it is only a small range (0.12-0.4) [12], [16]. For the present study, the ER is changes from 0.2 to 0.4.
The ER is controlled using a flow valve and anemometer. The air flow rate variation is given in Table
5. As various researchers found this range as optimum range, the range of steam to biomass ratio (SBR)
is considered from 0-3, with the value of 0,0.8,1.6,2.4 and 3 [15], [19], [49]. A flow meter is employed
to quantify the steam movement. While varying the steam supply, the air supply is kept constant.
After 15-20 minutes, a bluish-green colour flame is generated which shows the good quality of product
gas. Throughout the experimentation procedure, the values obtained were repeated three times, and the
average data was used for analysis.
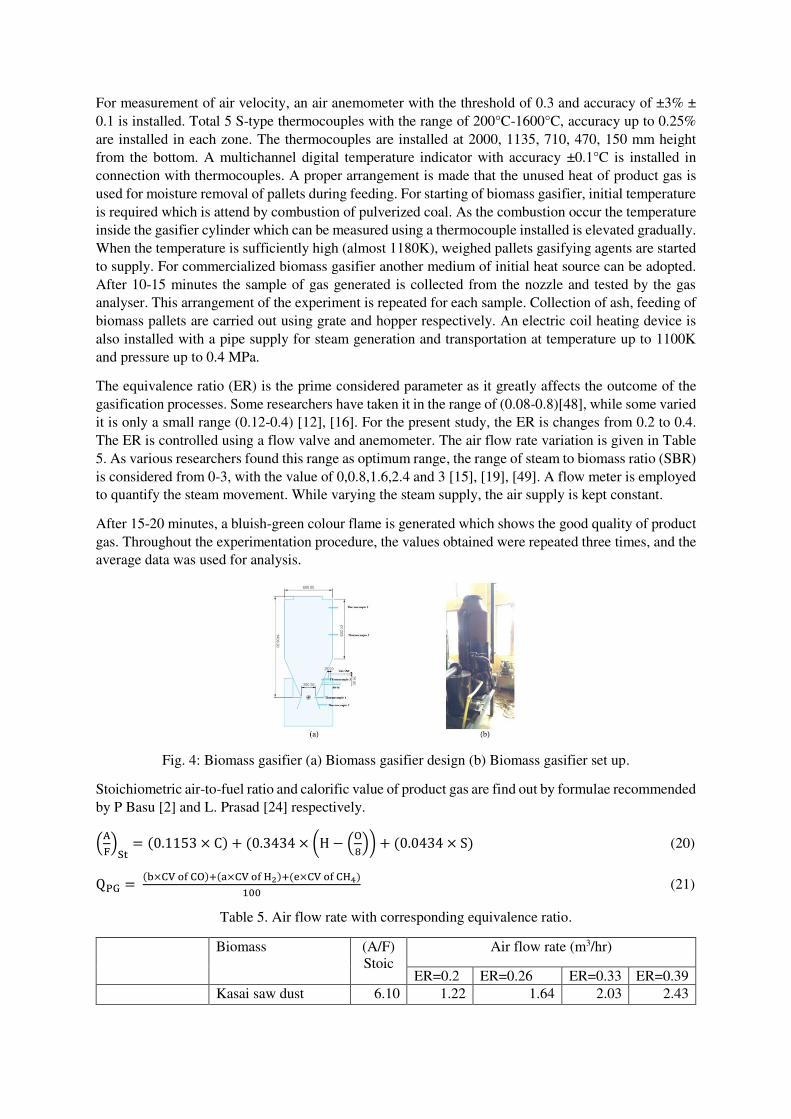
Fig. 4: Biomass gasifier (a) Biomass gasifier design (b) Biomass gasifier set up.
Stoichiometric air-to-fuel ratio and calorific value of product gas are find out by formulae recommended
by P Basu [2] and L. Prasad [24] respectively. (AF)St = (0.1153 × C) + (0.3434 × (H − (O8)) + (0.0434 × S) (20)
QPG = (b×CV of CO)+(a×CV of H2)+(e×CV of CH4)100 (21)
Table 5. Air flow rate with corresponding equivalence ratio.
Biomass (A/F)
Stoic
Air flow rate (m3/hr)
ER=0.2 ER=0.26 ER=0.33 ER=0.39
Kasai saw dust 6.10 1.22 1.64 2.03 2.43
Without Binder
(WEO)
Lemon Grass 4.62 0.85 1.14 1.41 1.69
Wheat Straw 5.46 1.09 1.47 1.82 2.17
Pigeon pea seed coat 5.89 1.18 1.58 1.96 2.34
With 5%
Binder (WEO)
Kasai saw dust 6.52 1.30 1.75 2.17 2.59
Lemon Grass 4.74 0.95 1.27 1.58 1.89
Wheat Straw 5.83 1.17 1.57 1.94 2.32
Pigeon pea seed coat 6.08 1.22 1.63 2.03 2.42
With 10%
Binder (WEO)
Kasai saw dust 6.69 1.34 1.80 2.23 2.66
Lemon Grass 5.42 1.08 1.46 1.81 2.16
Wheat Straw 6.22 1.24 1.67 2.07 2.47
Pigeon pea seed coat 6.52 1.30 1.75 2.17 2.60
5. Results and Discussion
The experimentation has been performed in two stages in which the air and steam gasification both are
performed for the same biomass and the results are compared based on Syngas composition, hydrogen
yield and other performance parameters considering the ER and S/B ratio as the prime considerations.
5.1 Temperature distribution in the gasifier
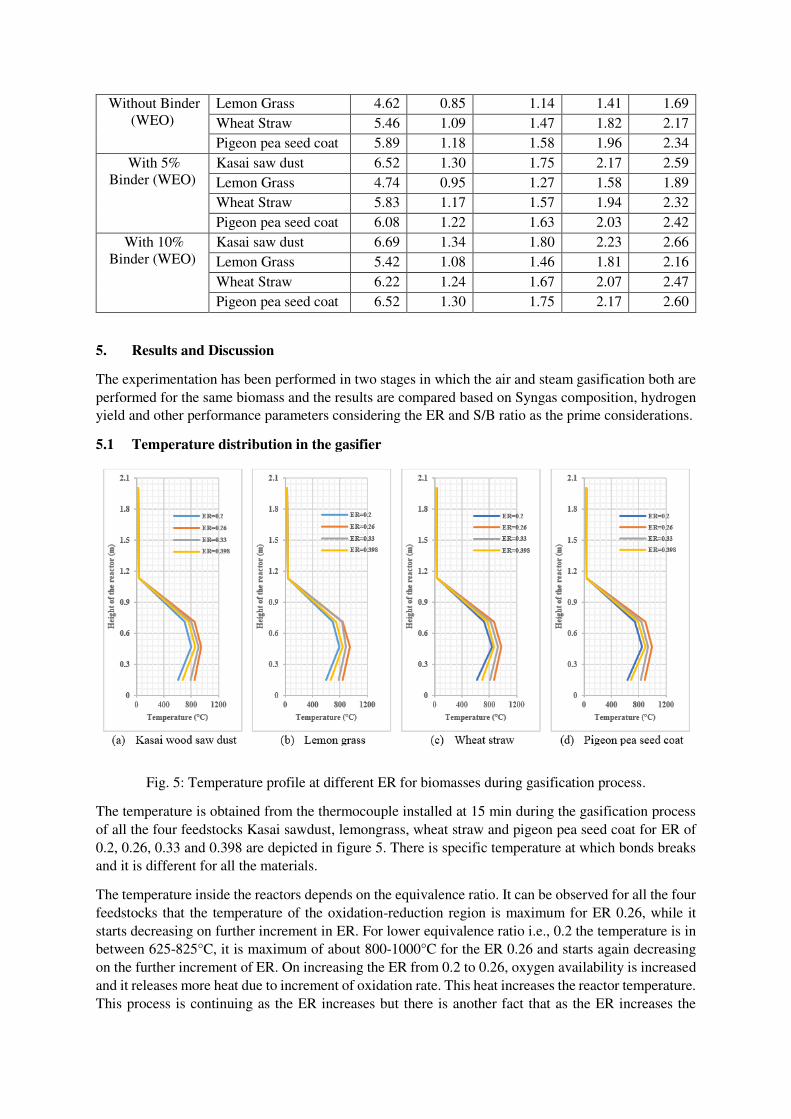
Fig. 5: Temperature profile at different ER for biomasses during gasification process.
The temperature is obtained from the thermocouple installed at 15 min during the gasification process
of all the four feedstocks Kasai sawdust, lemongrass, wheat straw and pigeon pea seed coat for ER of
0.2, 0.26, 0.33 and 0.398 are depicted in figure 5. There is specific temperature at which bonds breaks
and it is different for all the materials.
The temperature inside the reactors depends on the equivalence ratio. It can be observed for all the four
feedstocks that the temperature of the oxidation-reduction region is maximum for ER 0.26, while it
starts decreasing on further increment in ER. For lower equivalence ratio i.e., 0.2 the temperature is in
between 625-825°C, it is maximum of about 800-1000°C for the ER 0.26 and starts again decreasing
on the further increment of ER. On increasing the ER from 0.2 to 0.26, oxygen availability is increased
and it releases more heat due to increment of oxidation rate. This heat increases the reactor temperature.
This process is continuing as the ER increases but there is another fact that as the ER increases the
supply of N2 also increases. More N2 behaves as heat transfer medium and diminishes the temperature
inside the reactor on further increment of air supply, thus lower temperature found inside the reactor on
higher ER. [8], [21], [50], [51]
The different temperature profile is obtained for the different feedstock as it based on the composition,
density of pallets etc. The higher temperature of reduction zone is obtained for pigeon pea seed coat
and it lowers for wheat straw, Kasai and lemongrass in order but all the feedstock shows the same trends
only temperature changes. The density of pallets which depends on biomass particle size itself plays a
vital role as it regulates the air contact with feedstock particles. Good contacts show better efficiency
of the process and higher gasification temperature.
5.2 Effect of ER on Syngas composition, hydrogen yield and other performance parameters
The equivalence ratio is kept between 0.2-0.4. If the value kept below the range pyrolysis is governing
while having more than this combustion is governing. Most of the gasifiers with medium and large size
are employed with a feed controlling system. For the present work, a small-scale gasifier is used in
which a controlling system over the fuel feeding is not installed but only air supply can control. The
fuel feeding is kept constant at 1 kg/hr and the corresponding air supply is changed through the
controlling valve. It results in different air flow rate and thus, constant ER i.e., 0.2, 0.2686, 0.333 and
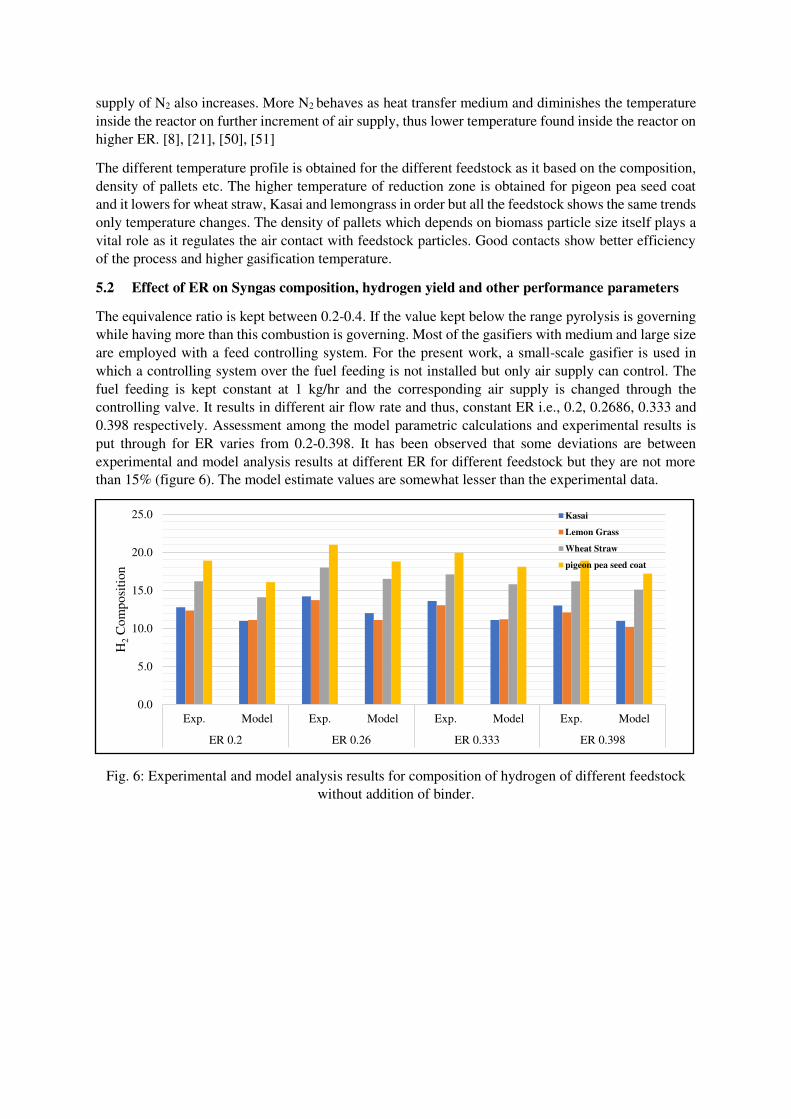
0.398 respectively. Assessment among the model parametric calculations and experimental results is
put through for ER varies from 0.2-0.398. It has been observed that some deviations are between
experimental and model analysis results at different ER for different feedstock but they are not more
than 15% (figure 6). The model estimate values are somewhat lesser than the experimental data.
Fig. 6: Experimental and model analysis results for composition of hydrogen of different feedstock
without addition of binder.
0.0
5.0
10.0
15.0
20.0
25.0
Exp. Model Exp. Model Exp. Model Exp. Model
ER 0.2 ER 0.26 ER 0.333 ER 0.398
H2
Co
mp
osi
tio
n
Kasai
Lemon Grass
Wheat Straw
pigeon pea seed coat
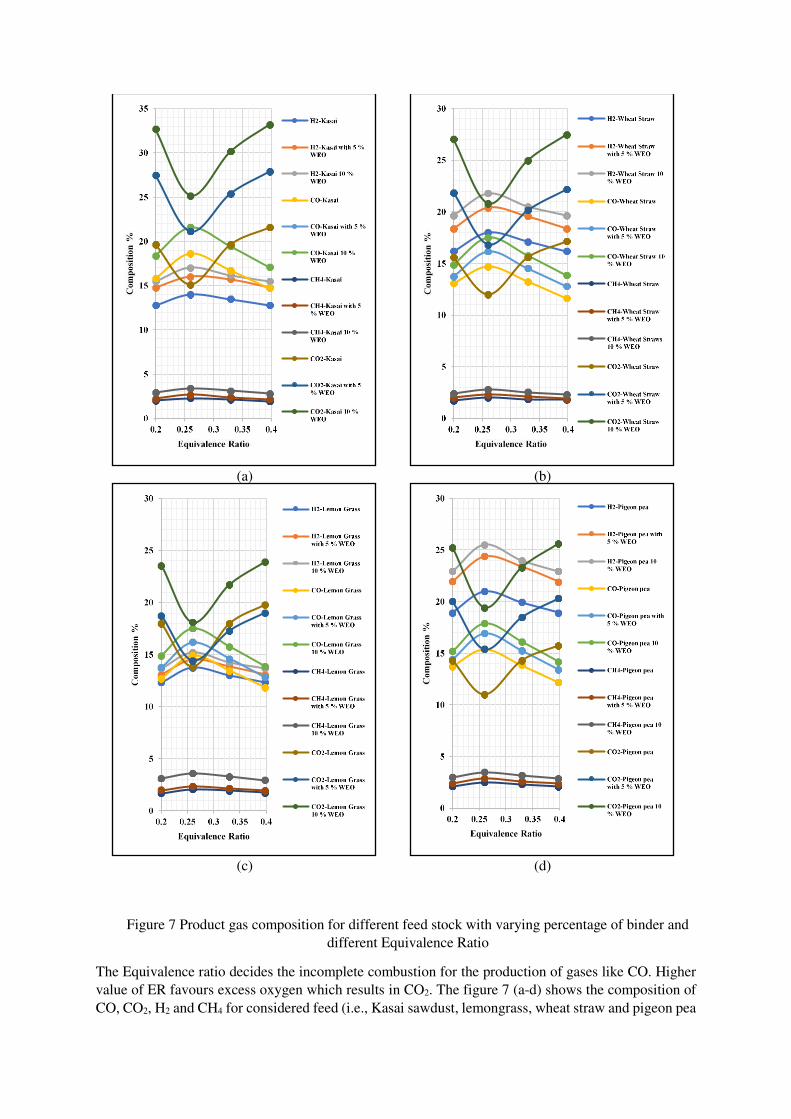
Figure 7 Product gas composition for different feed stock with varying percentage of binder and
different Equivalence Ratio
The Equivalence ratio decides the incomplete combustion for the production of gases like CO. Higher
value of ER favours excess oxygen which results in CO2. The figure 7 (a-d) shows the composition of
CO, CO2, H2 and CH4 for considered feed (i.e., Kasai sawdust, lemongrass, wheat straw and pigeon pea
(a) (b)
(c) (d)
seed coat) stock with varying percentage of the binder at different Equivalence Ratio. It can be observed
that the composition of CO up to 18.6% for ER 0.26 when only Kasai wood dust pallet is used. It
increases up to the value of 20.46 and 21.6% respectively with 5% and 10% addition of waste engine
oil as the binder. For all the set of biomasses it can be observed that the maximum CO can be obtained
at 0.26ER, while increasing the ER the curve starts lowering and CO2 increases which shows the
conversion of CO into CO2. At the maximum value of CO, the CO2 composition shows minimum value.
It can be observed that the percentage composition of CH4 also increases up to the ER 0.26 and
thereafter starts decreasing. It is maximum at 0.26ER for all set of biomasses. The binder increment
also shows the increment in CH4 composition. A similar trend is observed for H2 composition.
Advanced H2 and CH4 composition values were obtained corresponding to all the biomasses without
and with binders at the equivalence ratio of 0.26. For Kasai it is 2.3%, 2.6% and 3.4% for without, 5%
and 10% binder addition biomasses. Similarly, for Lemon Grass it is 1.7%, 2.1% and 3.1%, for Wheat
Straw it is 1.7%, 1.95% and 2.4%, and for pigeon pea seed coat, it is 2.1%, 2.4% and 3%, respectively
for without, 5% and 10% binder addition.
The composition of CO, CO2, H2 and CH4 are greatly affected by ER. At the lower value of ER, the
oxygen supply is not sufficient that initial reactions generate sufficient heats for further processing. The
increment in ER also increases the supply of O2, which enhances the exothermic combustion reaction,
which helps the increment of bed temperature. The higher temperature intern supports the endothermic
reactions. Reactions R-1, R-4 and R-3 enhance the H2 and CO compositions in the cost of CO2
composition. For the higher value of ER, complete combustion of residues enhances which generates
CO2 instead of CO, which intern decreases the net calorific value of product gas. Thus, it is required to
have ER in optimum value, which changes with each material as different materials have different
compositions[52]–[54].
If energy released per kg of biomass is considered, pigeon pea seed coat produces maximum energy
among the set of biomasses when using without binders. Pigeon pea seed coat released 10.94MJ/kg of
biomass energy. While in addition with 5% and 10% binders it released 12.03 and 13 MJ/kg of biomass
energy respectively. Kasai sawdust without and with 5% and 10% waste engine oil releases 10.7, 11.9
and 13.11 MJ/kg of biomass energy. 9.81, 10.4, 11.95 MJ/kg of biomass and 10.23, 11.32, 12.42 MJ/kg
of biomass are the values of energy released by the lemongrass and wheat straw without and with 5%
and 10% waste engine oil respectively.
The highest average calorific value of product gas is gotten from gasification of pigeon pea seed coat
with 10% waste engine oil as a binder is 6.256 MJ/Nm3 with an ER of 0.26. It perhaps analysed that the
increment of waste engine oil also increases the calorific value of product gas.
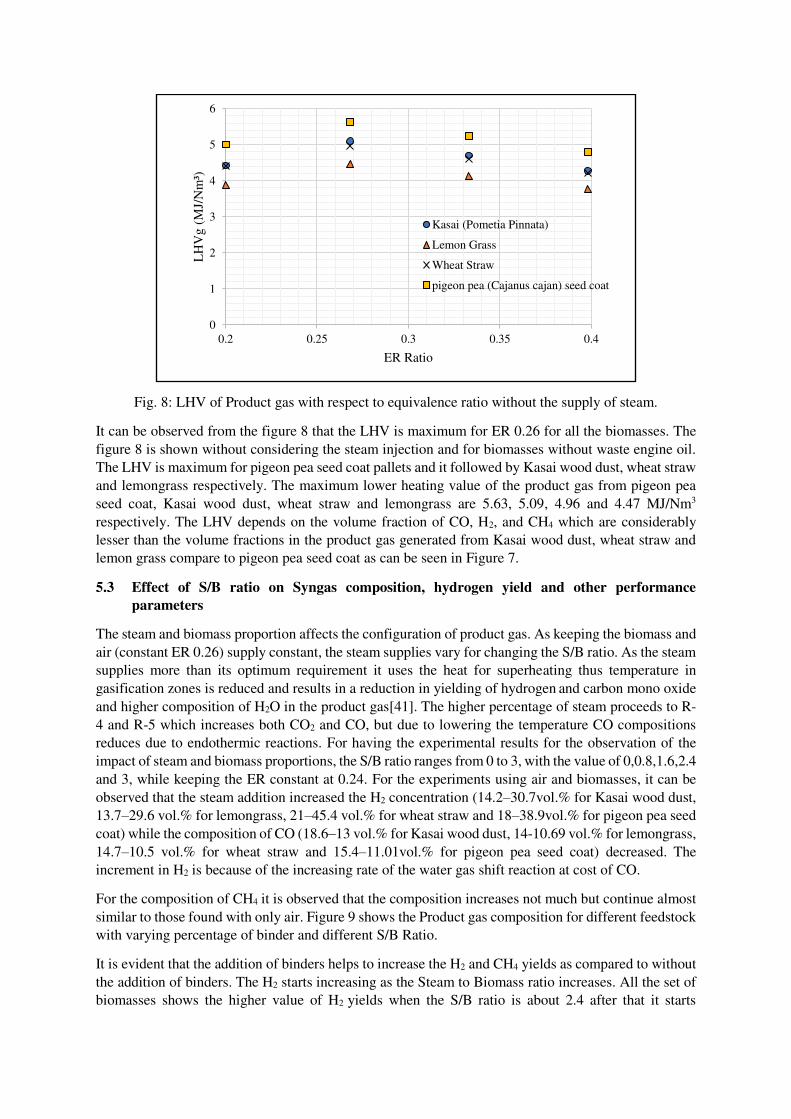
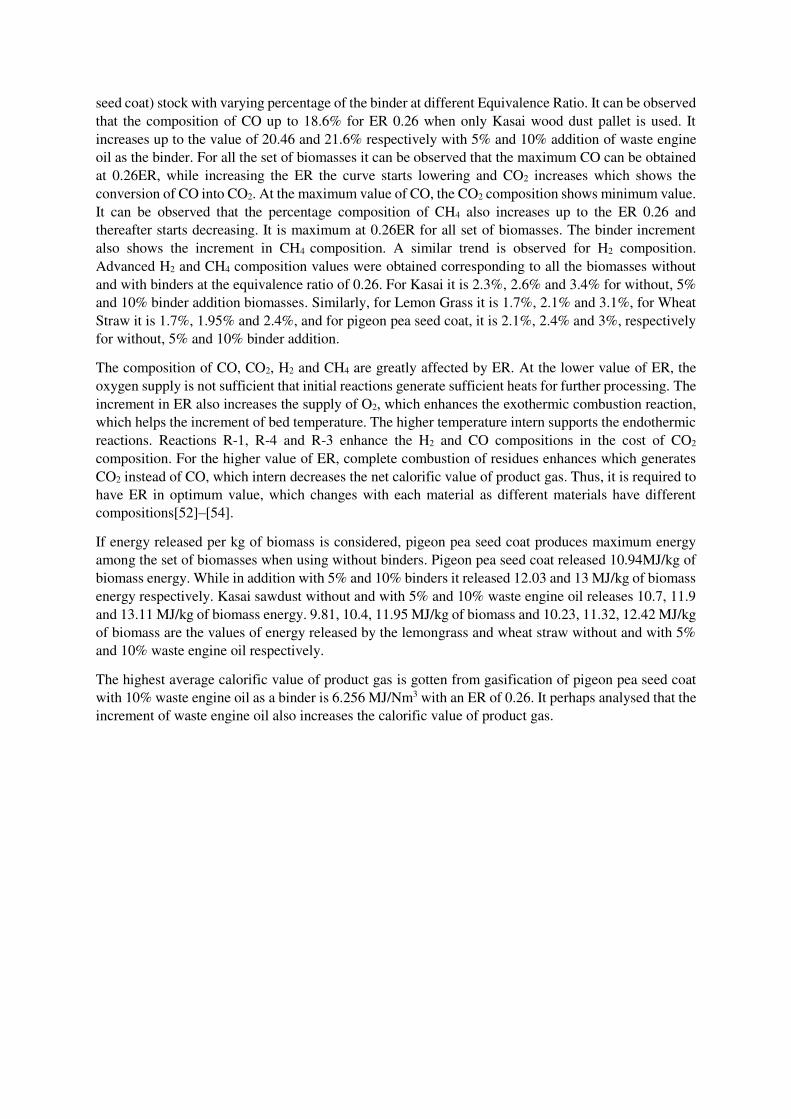
Fig. 8: LHV of Product gas with respect to equivalence ratio without the supply of steam.
It can be observed from the figure 8 that the LHV is maximum for ER 0.26 for all the biomasses. The
figure 8 is shown without considering the steam injection and for biomasses without waste engine oil.
The LHV is maximum for pigeon pea seed coat pallets and it followed by Kasai wood dust, wheat straw
and lemongrass respectively. The maximum lower heating value of the product gas from pigeon pea
seed coat, Kasai wood dust, wheat straw and lemongrass are 5.63, 5.09, 4.96 and 4.47 MJ/Nm3
respectively. The LHV depends on the volume fraction of CO, H2, and CH4 which are considerably
lesser than the volume fractions in the product gas generated from Kasai wood dust, wheat straw and
lemon grass compare to pigeon pea seed coat as can be seen in Figure 7.
5.3 Effect of S/B ratio on Syngas composition, hydrogen yield and other performance
parameters
The steam and biomass proportion affects the configuration of product gas. As keeping the biomass and
air (constant ER 0.26) supply constant, the steam supplies vary for changing the S/B ratio. As the steam
supplies more than its optimum requirement it uses the heat for superheating thus temperature in
gasification zones is reduced and results in a reduction in yielding of hydrogen and carbon mono oxide
and higher composition of H2O in the product gas[41]. The higher percentage of steam proceeds to R-
4 and R-5 which increases both CO2 and CO, but due to lowering the temperature CO compositions
reduces due to endothermic reactions. For having the experimental results for the observation of the
impact of steam and biomass proportions, the S/B ratio ranges from 0 to 3, with the value of 0,0.8,1.6,2.4
and 3, while keeping the ER constant at 0.24. For the experiments using air and biomasses, it can be
observed that the steam addition increased the H2 concentration (14.2–30.7vol.% for Kasai wood dust,
13.7–29.6 vol.% for lemongrass, 21–45.4 vol.% for wheat straw and 18–38.9vol.% for pigeon pea seed
coat) while the composition of CO (18.6–13 vol.% for Kasai wood dust, 14-10.69 vol.% for lemongrass,
14.7–10.5 vol.% for wheat straw and 15.4–11.01vol.% for pigeon pea seed coat) decreased. The
increment in H2 is because of the increasing rate of the water gas shift reaction at cost of CO.
For the composition of CH4 it is observed that the composition increases not much but continue almost
similar to those found with only air. Figure 9 shows the Product gas composition for different feedstock
with varying percentage of binder and different S/B Ratio.
It is evident that the addition of binders helps to increase the H2 and CH4 yields as compared to without
the addition of binders. The H2 starts increasing as the Steam to Biomass ratio increases. All the set of
biomasses shows the higher value of H2 yields when the S/B ratio is about 2.4 after that it starts
0
1
2
3
4
5
6
0.2 0.25 0.3 0.35 0.4
LH
Vg (
MJ/
Nm
³)
ER Ratio
Kasai (Pometia Pinnata)
Lemon Grass
Wheat Straw
pigeon pea (Cajanus cajan) seed coat
declining. For the set of biomasses with the addition of 5% waste engine oil, H2 yields increase up to
32.5% for Kasai wood dust, 47.6% for pigeon pea seed coat, 31.1% for lemongrass and 40.8% for wheat
straw at 2.4 S/B ratio. Similarly, with the addition of 10% waste engine oil, H2 yields increases up to
Kasai wood dust 33.5%, 49.5% for pigeon pea seed coat, 32.4% for lemon grass and 42.5% for wheat
straw at 2.4 S/B ratio.
(a) (b)
(c) (d)
Fig. 9: Product gas composition for different feed stock with varying percentage of binder and
different Steam to Biomass Ratio.
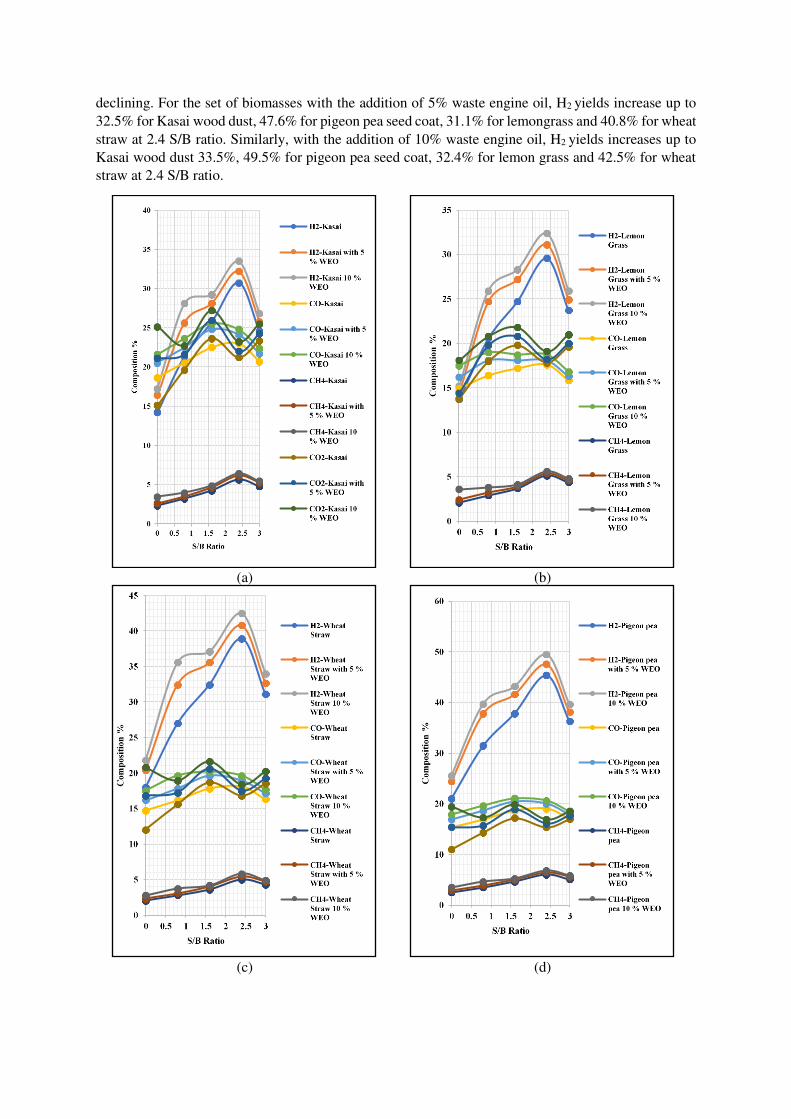
Fig. 10: LHV of Produced gas with respect to Steam to biomass ratio at constant ER 0.24.
It can be observed that for constant ER the value of LHV is increasing after a small amount of decrement
while increasing the S/B ratio. It is maximum at 2.4 thereafter it starts again decreasing depends on
important fraction of CO, H2 and CH4. This conclusion also observed in the experimental work carried
out by P. Lv et al (2007)[15]. The figure 10 considered the values for biomasses without binders. Based
on experimental data, it can be finding out that the biomasses with an increased amount of waste engine
oil shows the same trends but with more LHV corresponding to the same biomass without binder. It is
evident that at an S/B ratio 0.8, the calorific value is the least (i.e., 5.09, 5.75 and 6.29 MJ/Nm3 for
Kasai wood dust, 4.47, 4.85 and 5.59 MJ/Nm3 for lemon grass, 4.96, 5.57 and 6.12 MJ/Nm3 for wheat
straw and 5.63, 6.41 and 6.93 MJ/Nm3 for pigeon pea seed coat with 0, 5 and 10% WEO respectively).
With the increment in the S/B ratio at 2.4, the LHV reaches to a maximum of (i.e., 6.97, 7.46 and 8.14
MJ/Nm3 for Kasai wood dust, 6.28, 6.77 and 7.66 MJ/Nm3 for lemongrass, 7.42, 7.98 and 8.53 MJ/Nm3
for wheat straw and 8.53, 9.17 and 9.77 MJ/Nm3 for pigeon pea seed coat with 0, 5 and 10% WEO
respectively) and then follows the decreasing trend. The growing and declining tendency of LHV
difference is closely that of CO and H2 difference with S/B ratio.
6. Conclusion
In the present analysis work, an experimental study along with validation of parametric results has been
carried out for four different biomasses i.e., Kasai wood dust, Lemongrass, Wheat Straw and Pigeon
Pea Seed Coat with and without the waste engine oil as binder/additive. The thermochemical conversion
process has been considered with downdraft gasifier as the reactor. The following conclusions have
been drawn:
Hydrogen yield by volume has been enhanced is air-steam gasification as compare to air
gasification through thermochemical energy conversion gasification process.
The H2 concentration is increases as 14.2–30.7 vol. % for Kasai wood dust, 13.7–29.6 vol. %
for lemongrass, 21–45.4 vol.% for wheat straw and 18–38.9vol.% for pigeon pea seed coat by
injection of steam.
With the increment of S/B proportion, the heating value also increases. The increment of LHV
is about 19.9% for Kasai sawdust and it is a maximum of about 24.9% for pigeon pea seed coat.
At the current working situations, the H2 generation just doubles at S/B ratio of 2.4, compared
0.00
1.00
2.00
3.00
4.00
5.00
6.00
7.00
8.00
9.00
0 0.5 1 1.5 2 2.5 3
LH
Vg (
MJ/
Nm
³)
S/B Ratio
Kasai (Pometia Pinnata)
Lemon Grass
Wheat Straw
pigeon pea (Cajanus cajan) seed coat
to without injection of steam. Without binder condition, it is maximum i.e., 45.4 vol% for
pigeon pea seed coat and minimum for lemongrass about 29.6 vol%.
The affecting behaviour of equivalence ratio on experimental results indicates that an optimum
value of 0.26, the hydrogen yield is maximum for all the biomass sets. The lower heating value
is also maximum at 0.26 equivalence ratio.
The results obtained are compatible with parametric results and results obtained from other
studies.
The effect of waste engine oil addition with the biomasses is favourable. The hydrogen yields
and LHV of the product gas are found additional compare to the biomasses without the addition
of the waste engine oil.
Nomenclature
A Air
a,b,c,d and e Coefficients of elements of the product.
AR, Pre-exponential factor, k.mol m−3s−1
C Carbon
Ch4 Methane
CO Carbon Mono Oxide
CRF Char reactivity factor
ER Equivalence ratio
ERi Activation energy, J mol−1
F Fuel
FC Fixed carbon
H Hydrogen hfg Enthalpy difference between gas and fluid
HCV Higher calorific value
HHV Higher heating value
K Equilibrium constants
LCV Lower calorific value
LHV Lower heating value
ln Natural logarithm
m Quantity of oxygen per k.mol of biomass.
M molar mass
MC moisture content
ni Number of species in mole
ntot Total number of all species in product gas in moles
O Oxygen QPG Calorific value of product gas
r Quantity of water per k.mol of biomass
R Gas constant
S Sulphur
S/B Steam to biomass ratio
T Temperature
U Constant of integration
V Constant
VM Volatile matter
W, X, Y, Z Heat capacities
WEO Waste engine oil ∆G0 Standard Gibbs function of formation.
ΔH0 Heat of formation
Data availability statement
All data generated or analyzed during this study are included in this published article [and its
supplementary information files]. If reader still need certain data which are not included in manuscript,
are available from the corresponding author on reasonable request.
References
[1] M. Trninić, D. Stojiljković, N. Manić, Ø. Skreiberg, L. Wang, and A. Jovović, “A
mathematical model of biomass downdraft gasification with an integrated pyrolysis
model,” Fuel, vol. 265, no. June 2019, p. 116867, 2020, doi:
10.1016/j.fuel.2019.116867.
[2] P. Basu, Biomass Gasification and Pyrolysis: Practical Design and Theory - Prabir
Basu - Google Books. 2013.
[3] R. Hinz et al., “Agricultural Development and Land Use Change in India: A Scenario Analysis of Trade-Offs Between UN Sustainable Development Goals (SDGs),” Earth’s Futur., vol. 8, no. 2, pp. 0–3, 2020, doi: 10.1029/2019EF001287.
[4] D. Cardoen, P. Joshi, L. Diels, P. M. Sarma, and D. Pant, “Agriculture biomass in India: Part 1. Estimation and characterization,” Resour. Conserv. Recycl., vol. 102, pp. 39–48,
2015, doi: 10.1016/j.resconrec.2015.06.003.
[5] H. Abd El-Sattar, S. Kamel, M. A. Tawfik, D. Vera, and F. Jurado, “Modeling and Simulation of Corn Stover Gasifier and Micro-turbine for Power Generation,” Waste
and Biomass Valorization, vol. 10, no. 10, pp. 3101–3114, 2019, doi: 10.1007/s12649-
018-0284-z.
[6] J. V. Littlejohns, J. Butler, L. Luque, M. Kannangara, and S. Totolo, “Analysis of the performance of an integrated small-scale biomass gasification system in a Canadian
context,” Biomass Convers. Biorefinery, vol. 10, no. 2, pp. 311–323, 2020, doi:
10.1007/s13399-019-00442-0.
[7] F. Patuzzi et al., “State-of-the-art of small-scale biomass gasification systems: An
extensive and unique monitoring review,” Energy, vol. 223, p. 120039, 2021, doi:
10.1016/j.energy.2021.120039.
[8] A. A. P. Susastriawan, H. Saptoadi, and Purnomo, “Small-scale downdraft gasifiers for
biomass gasification: A review,” Renew. Sustain. Energy Rev., vol. 76, no. February,
pp. 989–1003, 2017, doi: 10.1016/j.rser.2017.03.112.
[9] A. J. Keche, A. P. R. Gaddale, and R. G. Tated, “Simulation of biomass gasification in downdraft gasifier for different biomass fuels using ASPEN PLUS,” Clean Technol.
Environ. Policy, vol. 17, no. 2, pp. 465–473, 2015, doi: 10.1007/s10098-014-0804-x.
[10] L. I. Chaves et al., “Small-scale power generation analysis: Downdraft gasifier coupled
to engine generator set,” Renew. Sustain. Energy Rev., vol. 58, pp. 491–498, 2016, doi:
10.1016/j.rser.2015.12.033.
[11] G. Kumar et al., “Thermochemical conversion routes of hydrogen production from
organic biomass: processes, challenges and limitations,” Biomass Convers. Biorefinery,
2020, doi: 10.1007/s13399-020-01127-9.
[12] V. Skoulou, G. Koufodimos, Z. Samaras, and A. Zabaniotou, “Low temperature gasification of olive kernels in a 5-kW fluidized bed reactor for H2-rich producer gas,” Int. J. Hydrogen Energy, vol. 33, no. 22, pp. 6515–6524, 2008, doi:
10.1016/j.ijhydene.2008.07.074.
[13] Y. Pang, S. Shen, and Y. Chen, “High Temperature Steam Gasification of Corn Straw
Pellets in Downdraft Gasifier: Preparation of Hydrogen-Rich Gas,” Waste and Biomass
Valorization, vol. 10, no. 5, pp. 1333–1341, 2019, doi: 10.1007/s12649-017-0143-3.
[14] A. B. H. Trabelsi et al., “Hydrogen-Rich Syngas Production from Gasification and
Pyrolysis of Solar Dried Sewage Sludge: Experimental and Modeling Investigations,”
Biomed Res. Int., vol. 2017, 2017, doi: 10.1155/2017/7831470.
[15] P. Lv, Z. Yuan, L. Ma, C. Wu, Y. Chen, and J. Zhu, “Hydrogen-rich gas production
from biomass air and oxygen/steam gasification in a downdraft gasifier,” Renew.
Energy, vol. 32, no. 13, pp. 2173–2185, 2007, doi: 10.1016/j.renene.2006.11.010.
[16] I. B. Adefeso, A. M. Rabiu, and D. I. Ikhu-Omoregbe, “Refuse-derived Fuel Gasification
for Hydrogen Production in High Temperature Proton Exchange Membrane Fuel Cell
Base CHP System,” Waste and Biomass Valorization, vol. 6, no. 6, pp. 967–974, 2015,
doi: 10.1007/s12649-015-9415-y.
[17] S. Valizadeh et al., “Biohydrogen production from catalytic conversion of food waste
via steam and air gasification using eggshell- and homo-type Ni/Al2O3 catalysts,” Bioresour. Technol., vol. 320, p. 124313, 2021, doi: 10.1016/j.biortech.2020.124313.
[18] S. M. Atnaw, S. A. Sulaiman, and S. Yusup, “Syngas production from downdraft gasification of oil palm fronds,” Energy, vol. 61, pp. 491–501, 2013, doi:
10.1016/j.energy.2013.09.039.
[19] N. Rakesh and S. Dasappa, “Analysis of tar obtained from hydrogen-rich syngas
generated from a fixed bed downdraft biomass gasification system,” Energy Convers.
Manag., vol. 167, no. April, pp. 134–146, 2018, doi: 10.1016/j.enconman.2018.04.092.
[20] P. P. Dutta, V. Pandey, A. R. Das, S. Sen, and D. C. Baruah, “Down draft gasification modelling and experimentation of some indigenous biomass for thermal applications,” Energy Procedia, vol. 54, no. 03712, pp. 21–34, 2014, doi:
10.1016/j.egypro.2014.07.246.
[21] P. N. Sheth and B. V. Babu, “Experimental studies on producer gas generation from wood waste in a downdraft biomass gasifier,” Bioresour. Technol., vol. 100, no. 12, pp.
3127–3133, 2009, doi: 10.1016/j.biortech.2009.01.024.
[22] A. J. R. Keche and G. Amba Prasad Rao, “Experimental evaluation of a 35 kVA downdraft gasifier,” Front. Energy, vol. 7, no. 3, pp. 300–306, 2013, doi:
10.1007/s11708-013-0247-9.
[23] L. Prasad, B. L. Salvi, and V. Kumar, “Thermal degradation and gasification characteristics of Tung Shells as an open top downdraft wood gasifier feedstock,” Clean
Technol. Environ. Policy, vol. 17, no. 6, pp. 1699–1706, 2015, doi: 10.1007/s10098-
014-0891-8.
[24] L. Prasad, “Experimental Study on Gasification of Jatropha Shells in a Downdraft Open
Top Gasifier,” Waste and Biomass Valorization, vol. 6, no. 1, pp. 117–122, 2015, doi:
10.1007/s12649-014-9321-8.
[25] L. Prasad, P. M. V. Subbarao, and J. P. Subrahmanyam, “An Experimental Investigation on Gasification Characteristic of Pongamia Residue (Shell and De-Oiled Cake) as a
Source of Energy for Rural Areas,” Waste and Biomass Valorization, vol. 8, no. 3, pp.
987–997, 2017, doi: 10.1007/s12649-016-9631-0.
[26] H. Siddiqui, S. K. Thengane, S. Sharma, and S. M. Mahajani, “Revamping downdraft gasifier to minimize clinker formation for high-ash garden waste as feedstock,” Bioresour. Technol., vol. 266, no. June, pp. 220–231, 2018, doi:
10.1016/j.biortech.2018.06.086.
[27] W. A. González, F. Zimmermann, and J. F. Pérez, “Thermodynamic assessment of the
fixed-bed downdraft gasification process of fallen leaves pelletized with glycerol as
binder,” Case Stud. Therm. Eng., vol. 14, no. April, p. 100480, 2019, doi:
10.1016/j.csite.2019.100480.
[28] C. M. Shone and T. J. S. Jothi, “Preparation of gasification feedstock from leafy
biomass,” Environ. Sci. Pollut. Res., vol. 23, no. 10, pp. 9364–9372, 2016, doi:
10.1007/s11356-015-5167-2.
[29] C. Nobre, A. Longo, C. Vilarinho, and M. Gonçalves, “Gasification of pellets produced from blends of biomass wastes and refuse derived fuel chars,” Renew. Energy, vol. 154,
pp. 1294–1303, 2020, doi: 10.1016/j.renene.2020.03.077.
[30] N. L. Panwar, N. S. Rathore, and A. K. Kurchania, “Experimental investigation of open core downdraft biomass gasifier for food processing industry,” Mitig. Adapt. Strateg.
Glob. Chang., vol. 14, no. 6, pp. 547–556, 2009, doi: 10.1007/s11027-009-9173-x.
[31] E. G. Pereira and M. A. Martins, Gasification Technologies, vol. 4. Elsevier, 2017.
[32] T. B. Reed, “Principles and Technology of Biomass Gasification.,” Adv Sol Energy, An
Annu Rev Res Dev, vol. 2, pp. 125–174, 1985, doi: 10.1007/978-1-4613-9951-3_3.
[33] C. C. Xu et al., “Biomass Energy,” Compr. Energy Syst., vol. 1–5, pp. 770–794, 2018,
doi: 10.1016/B978-0-12-809597-3.00121-8.
[34] B. Fortunato, G. Brunetti, S. M. Camporeale, M. Torresi, and F. Fornarelli,
“Thermodynamic model of a downdraft gasifier,” Energy Convers. Manag., vol. 140,
pp. 281–294, 2017, doi: 10.1016/j.enconman.2017.02.061.
[35] Z. A. Zainal, R. Ali, C. H. Lean, and K. N. Seetharamu, “Prediction of performance of a downdraft gasifier using equilibrium modeling for different biomass materials,” Energy Convers. Manag., vol. 42, no. 12, pp. 1499–1515, 2001, doi: 10.1016/S0196-
8904(00)00078-9.
[36] M. Fani, M. Haddadzadeh Niri, and F. Joda, “A Simplified Dynamic Thermokinetic-
Based Model of Wood Gasification Process,” Process Integr. Optim. Sustain., vol. 2,
no. 3, pp. 269–279, 2018, doi: 10.1007/s41660-018-0042-5.
[37] H. J. Huang and S. Ramaswamy, “Modeling biomass gasification using thermodynamic equilibrium approach,” Appl. Biochem. Biotechnol., vol. 154, no. 1–3, pp. 193–204,
2009, doi: 10.1007/s12010-008-8483-x.
[38] A. Z. Mendiburu, J. A. Carvalho, and C. J. R. Coronado, “Thermochemical equilibrium
modeling of biomass downdraft gasifier: Stoichiometric models,” Energy, vol. 66, pp.
189–201, 2014, doi: 10.1016/j.energy.2013.11.022.
[39] C. Godinez, F. J. Hernández-Fernández, A. P. de los Ríos, L. J. Lozano, and D. Illán,
“Hydrogen generation in a downdraft moving bed gasifier coupled to a molten carbonate fuel cell,” Chem. Eng. Res. Des., vol. 90, no. 5, pp. 690–695, 2012, doi:
10.1016/j.cherd.2011.09.012.
[40] K. Verma, Z. R. Gajera, and A. N. Sawarkar, “Kinetics of Gasification and Co-
gasification of Petcoke and Coal,” J. Inst. Eng. Ser. E, 2020, doi: 10.1007/s40034-020-
00178-x.
[41] J. Jia, L. Xu, A. Abudula, and B. Sun, “Effects of operating parameters on performance
of a downdraft gasifier in steady and transient state,” Energy Convers. Manag., vol. 155,
no. July 2017, pp. 138–146, 2018, doi: 10.1016/j.enconman.2017.10.072.
[42] S. Hameed, N. Ramzan, Z. U. Rahman, M. Zafar, and S. Riaz, “Kinetic modeling of reduction zone in biomass gasification,” Energy Convers. Manag., vol. 78, pp. 367–373,
2014, doi: 10.1016/j.enconman.2013.10.049.
[43] E. R. Widjaya, G. Chen, L. Bowtell, and C. Hills, “Gasification of non-woody biomass:
A literature review,” Renew. Sustain. Energy Rev., vol. 89, no. September 2016, pp.
184–193, 2018, doi: 10.1016/j.rser.2018.03.023.
[44] BIS, “IS : 1360 (Part IV/Set 1) - 1974,” 1974.
[45] IS:1350, “Indian Standard - Methods of Test for Coal and Coke,” Bur. Indian Stand.,
no. IS:1350, p. 28, 1984.
[46] S. A. Channiwala and P. P. Parikh, “A unified correlation for estimating HHV of solid, liquid and gaseous fuels,” Fuel, vol. 81, no. 8, pp. 1051–1063, 2002, doi:
10.1016/S0016-2361(01)00131-4.
[47] J. M. Vargas-Moreno, A. J. Callejón-Ferre, J. Pérez-Alonso, and B. Velázquez-Martí,
“A review of the mathematical models for predicting the heating value of biomass materials,” Renew. Sustain. Energy Rev., vol. 16, no. 5, pp. 3065–3083, 2012, doi:
10.1016/j.rser.2012.02.054.
[48] C. Chen, Y. Q. Jin, J. H. Yan, and Y. Chi, “Simulation of municipal solid waste gasification in two different types of fixed bed reactors,” Fuel, vol. 103, pp. 58–63, 2013,
doi: 10.1016/j.fuel.2011.06.075.
[49] K. Sandeep and S. Dasappa, “Oxy–steam gasification of biomass for hydrogen rich
syngas production using downdraft reactor configuration,” Int. J. ENERGY Res., vol.
38, no. Int. J. Energy Res. 2014;, pp. 174–188, 2014, doi: 10.1002/er.3019.
[50] A. A. P. Susastriawan, H. Saptoadi, and Purnomo, “Comparison of the gasification
performance in the downdraft fixed-bed gasifier fed by different feedstocks: Rice husk,
sawdust, and their mixture,” Sustain. Energy Technol. Assessments, vol. 34, no. October
2018, pp. 27–34, 2019, doi: 10.1016/j.seta.2019.04.008.
[51] J. D. Martínez, E. E. Silva Lora, R. V. Andrade, and R. L. Jaén, “Experimental study on biomass gasification in a double air stage downdraft reactor,” Biomass and Bioenergy,
vol. 35, no. 8, pp. 3465–3480, 2011, doi: 10.1016/j.biombioe.2011.04.049.
[52] J. K. Ratnadhariya and S. A. Channiwala, “Three zone equilibrium and kinetic free modeling of biomass gasifier - a novel approach,” Renew. Energy, vol. 34, no. 4, pp.
1050–1058, 2009, doi: 10.1016/j.renene.2008.08.001.
[53] G. Chen, X. Guo, Z. Cheng, B. Yan, Z. Dan, and W. Ma, “Air gasification of biogas-
derived digestate in a downdraft fixed bed gasifier,” Waste Manag., vol. 69, pp. 162–169, 2017, doi: 10.1016/j.wasman.2017.08.001.
[54] T. Phuphuakrat, N. Nipattummakul, T. Namioka, S. Kerdsuwan, and K. Yoshikawa,
“Characterization of tar content in the syngas produced in a downdraft type fixed bed gasification system from dried sewage sludge,” Fuel, vol. 89, no. 9, pp. 2278–2284,
2010, doi: 10.1016/j.fuel.2010.01.015.


![Calcium-Dependent Hydrogen Peroxide Mediates Hydrogen-Rich … · Calcium-Dependent Hydrogen Peroxide Mediates Hydrogen-Rich Water-Reduced Cadmium Uptake in Plant Roots1[OPEN] Qi](https://img.pdfslide.net/doc/110x75/5f58dd1443c1f452644636dc/calcium-dependent-hydrogen-peroxide-mediates-hydrogen-rich-calcium-dependent-hydrogen.jpg)