Embed Size (px)
Citation preview

1
HYDROGENICS CORPORATE OVERVIEW
March, 2017
Version: 02.17

2
Safe Harbor Statement
Certain statements in the Business Update and Order Backlog sections contain forward-looking statements within the meaning of the “safe harbor” provisions of the U.S. Private
Securities Litigation Reform Act of 1995, and under applicable Canadian securities laws. These statements are based on management’s current expectations and actual results may
differ from these forward-looking statements due to numerous factors, including: our inability to increase our revenues or raise additional funding to continue operations, execute our
business plan, or to grow our business; our inability to address a slow return to economic growth, and its impact on our business, results of operations and consolidated financial
condition; our limited operating history; inability to implement our business strategy; fluctuations in our quarterly results; failure to maintain our customer base that generates the majority
of our revenues; currency fluctuations; failure to maintain sufficient insurance coverage; changes in value of goodwill; failure of a significant market to develop for our products; failure of
hydrogen being readily available on a cost-effective basis; changes in government policies and regulations; failure of uniform codes and standards for hydrogen fuelled vehicles and
related infrastructure to develop; liability for environmental damages resulting from our research, development or manufacturing operations; failure to compete with other developers
and manufacturers of products in our industry; failure to compete with developers and manufacturers of traditional and alternative technologies; failure to develop partnerships with
original equipment manufacturers, governments, systems integrators and other third parties; inability to obtain sufficient materials and components for our products from suppliers;
failure to manage expansion of our operations; failure to manage foreign sales and operations; failure to recruit, train and retain key management personnel; inability to integrate
acquisitions; failure to develop adequate manufacturing processes and capabilities; failure to complete the development of commercially viable products; failure to produce cost-
competitive products; failure or delay in field testing of our products; failure to produce products free of defects or errors; inability to adapt to technological advances or new codes and
standards; failure to protect our intellectual property; our involvement in intellectual property litigation; exposure to product liability claims; failure to meet rules regarding passive foreign
investment companies; actions of our significant and principal shareholders; dilution as a result of significant issuances of our common shares and preferred shares; inability of US
investors to enforce US civil liability judgments against us; volatility of our common share price; dilution as a result of the exercise of options; and failure to meet continued listing
requirements of Nasdaq. Readers should not place undue reliance on Hydrogenics’ forward-looking statements. Investors are encouraged to review the section captioned “Risk Factors”
in our regulatory filings with the Canadian securities regulatory authorities and the US Securities and Exchange Commission for a more complete discussion of factors that could affect
our future performance. Furthermore, the forward-looking statements contained herein are made as of the date of this presentation, and we undertake no obligation to revise or update
any forward-looking statements in order to reflect events or circumstances that may arise after the date of this presentation, unless otherwise required by law. The forward-looking
statements contained in this presentation are expressly qualified by this.

3
Shifting Power to Renewable Hydrogen
Today, hydrogen production relies heavily on oil, gas and coal, which are highly CO2 emitting
Hydrogen produced from renewable power using electrolysis is CO2-free.
Hydrogenics delivers the technology to enable business to shift power to a zero-emission energy economy

4
HYDROGENICS OVERVIEW
Mississauga, Canada Gladbeck, Germany Oevel, Belgium
Mississauga, Canada Gladbeck, Germany Oevel, Belgium

5
Global Leader in Hydrogen Technology

6
An Established Leader with Established Technology
Alstom, Germany
•World’s first commercial
contract for hydrogen
fuel cell trains
•10-year agreement,
contract value of €50M
Kolon, S. Korea
•Providing MW power
using excess hydrogen
•Multi-MW fuel cells
running 24/7
Uniper, Germany
•MW-scale Power-to-Gas
facility in Germany
•Wind power and
Hydrogenics electrolysis
equipment to transform
water into hydrogen
Fuel Cell Buses, China
•Multiple agreements for
thousands of fuel cell
buses throughout China
in the next 2-4 years

7
HYDROGEN MOBILITY
Salzgitter, Germany Stuttgart, Germany
Toronto, CanadaBasel, SwitzerlandWinnipeg, Canada & Scottsdale, Arizona
California, USA

8
Hydrogen Mobility Solutions
Hydrogenics HyPM™ power modules provide a robust and flexible
platform for zero-emission mobility applications.
• Proven track record for superior performance, durability and reliability
• Simple electrical and mechanical interfaces for easy integration with electric
vehicles
• Robust stack architecture with no humidifier, low pressure and dry/dry
features
• High durability components for demanding conditions
• Greatest range of kW systems
The ultimate OEM
friendly solution for
light and heavy
mobility applications

9
China Update
• Certified Integrator Program (CIP) on track, with additional
partners under review
• Moving through scale-up process of 1-10-100-1000 unit
development
– Cumulative orders already exceed 300 fuel cell units
– More than 80 units will be in service by end of March
• Growing number of bus and vehicle OEMs under contract
with Hydrogenics’ CIPs
• Potential partners for energy storage, fueling, and grid-
related projects now in discussion
Continued expansion into the Chinese fuel cell market Beijing, China:
First prototype with
40,000 km road
service

10
CRITICAL POWER
Daesan, South Korea
Daesan, South KoreaPort of Honolulu, Hawaii, USAIstanbul, Turkey
Surrey, United Kingdom Nuuk, Greenland Brisbane, Australia

11
Critical Power Solutions
Hydrogenics HyPM™ power modules set the technology
benchmark for meeting intermittent and continuous power needs.
• Designed for superior performance
• Fully integrated stack with power range flexibility from 3kW to 50 MW
• Best footprint with scalable design solutions to meet runtime needs
• 10,000+ hour stack lifetime with unlimited stop and start cycles
• Greatest range of kW systemsThe ultimate solution
for reliable backup,
standby and
continuous power
applications

12
HYDROGEN FUELING
Hamburg, Germany Barcelona, SpainAberdeen, Scotland
Oslo, NorwayStuttgart, GermanyHalle, Belgium
13
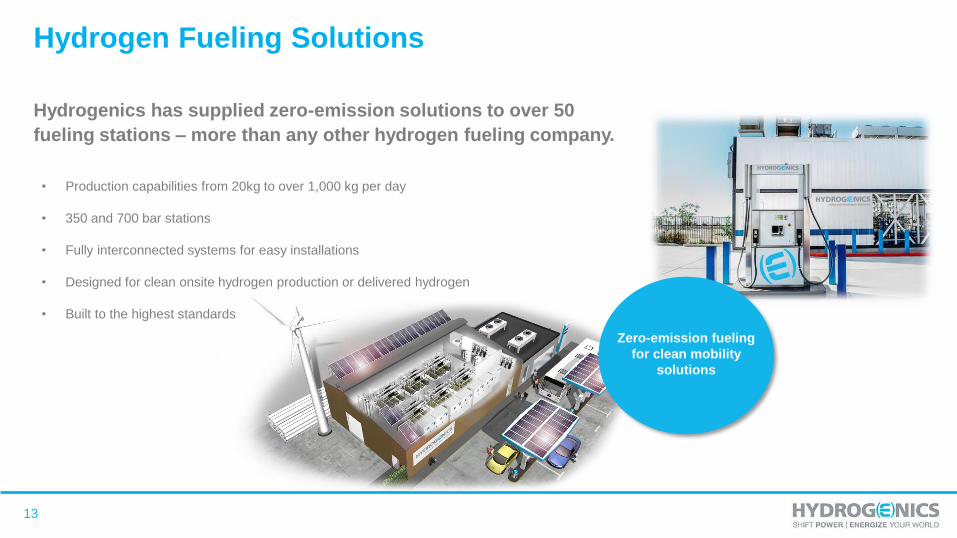
Hydrogen Fueling Solutions
Hydrogenics has supplied zero-emission solutions to over 50
fueling stations – more than any other hydrogen fueling company.
• Production capabilities from 20kg to over 1,000 kg per day
• 350 and 700 bar stations
• Fully interconnected systems for easy installations
• Designed for clean onsite hydrogen production or delivered hydrogen
• Built to the highest standards
Zero-emission fueling
for clean mobility
solutions

14
RENEWABLE HYDROGEN & GRID
BALANCING
Avedøre, Denmark
Falkenhagen, Germany
Falkenhagen, Germany Katinnik, Quebec
Hamburg, Germany Grapzow, Germany

15
Renewable Hydrogen Solutions
Hydrogen produced from renewable power via water electrolysis
enables the transition to a cleaner future across all energy sectors
and applications.
• Power-to Gas: Injecting hydrogen or synthetic natural gas into the gas grid
• Power-to-Mobility: Hydrogen refueling for fuel cell electric vehicles
• Power-to-Industry: Using hydrogen as a feedstock for industrial facilities
• Power-to-Fuel: Using hydrogen as a feedstock for traditional fuel production
• Power-to-Power: Repowering hydrogen through a fuel cell
Offering hydrogen
solutions for a
renewable based
energy system

16
Grid Balancing Solutions
As more renewable wind and solar power is added into the energy
generation mix, Hydrogenics provides grid balancing solutions.
• Dynamic and flexible to meet the response needs of the Independent Supply
Operator (ISO)
• Most compact and dense PEM electrolyzers for utility-scale projects
• Highly efficient – can be dispatched hour after hour with no impact on
performance
Hydrogenics’
Electrolyzer
provides flexible
Regulation
Services

17
INDUSTRIAL HYDROGEN
Elemash, Russia
Kirovgrad, Russia
Saint Gobain, Colombia
Nyagan, Russia
Bushan, India
Camao, Brazil

18
Industrial Hydrogen Solutions
Hydrogenics’ HySTAT™ and HyLYZER™ electrolyzers generate
pure hydrogen for zero-emission solutions.
• On-site and on-demand hydrogen generation
• Designed for automatic and continuous operation
• Customizable and easy to integrate for industrial and utility industries
• PEM and alkaline units, built to the highest safety standards
Clean and renewable
hydrogen generation:
on-site and on-
demand
19
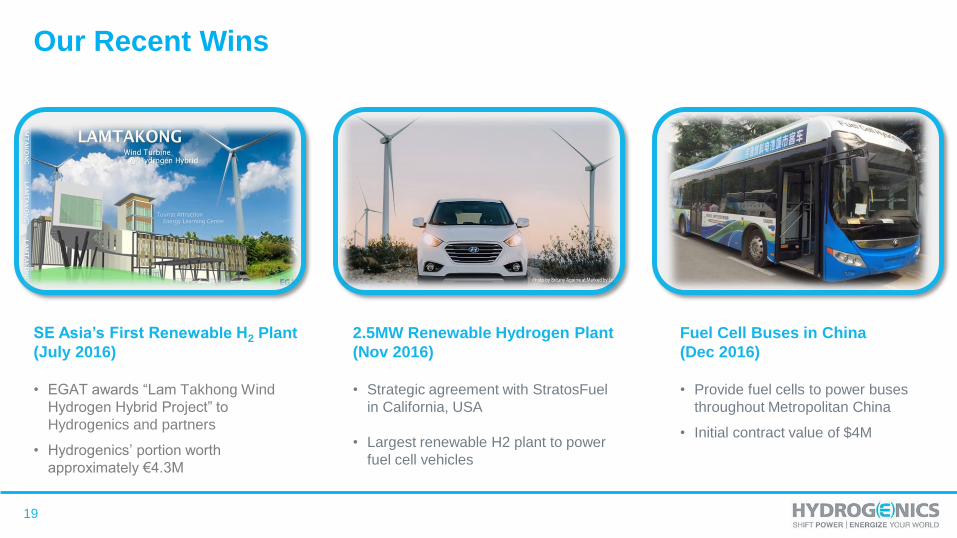
Our Recent Wins
SE Asia’s First Renewable H2 Plant
(July 2016)
• EGAT awards “Lam Takhong Wind
Hydrogen Hybrid Project” to
Hydrogenics and partners
• Hydrogenics’ portion worth
approximately €4.3M
Fuel Cell Buses in China
(Dec 2016)
• Provide fuel cells to power buses
throughout Metropolitan China
• Initial contract value of $4M
2.5MW Renewable Hydrogen Plant
(Nov 2016)
• Strategic agreement with StratosFuel
in California, USA
• Largest renewable H2 plant to power
fuel cell vehicles

20
Major Program Progress
Program Area Lead Customer Status Value
Stationary MW Power Kolon 1MW pilot ran to year-end 2016 as planned
Three 5MW sites under review
>$20M
Potential
Hydrogen Rail Alstom Transport Program on schedule, with on-rail testing underway
Pre-series complete; Series production order is pending
>$50M
Booked
Detritiation Kurion Awaiting next step direction in Japan
Won a further detritiation pilot unit in March
Propulsion Confidential First commercial product builds underway
Total program valued at $90M won in 2012
$30M Firm
(70% complete)
$60M not in Backlog
Power-to-Gas E.ON
Enbridge
First Canadian facility in operation Q2
Additional wins (California 2.5MW & Germany 2.5MW)
$20M in delivery
$70M Potential
Fueling Various Good progress in California and Canada More to come
Mobility 4 Certified Integrator
Partners (CIP) China
1-10-100 progressing toward 1000 unit orders >$50M Potential
Automotive & Rail 4 Confidential New early-stage technology development support and vehicle
integration
TBD

21
Building & Delivering Value
• Global technology leadership demonstrated in competitive
markets with Alstom, E.ON, Enbridge, and Chinese CIPs
• Multiple pathways to scale serves as a hedge against the
uncertainty of any one application
• Business opportunities across geographies yield significant
intrinsic value as applications scale independently
• Strong cost discipline to yield significant operating leverage
when scaling
• Backlog remains at record levels supporting significant growth
in revenue for 2017
Southeast Asia’s
First 1MW
Renewable
Hydrogen Plant

22Financial Results…

23
Sep. 1/16
Backlog
Orders
Received
FX Orders
Delivered
Dec. 31/16
Backlog
OnSite Generation $ 17.1 $ 8.1 $ (0.6) $ 3.8 $ 20.8
Power Systems 89.1 5.3 (3.7) 4.9 85.8
Total $ 106.2 $ 13.4 $ (4.3) $ 8.7 $ 106.6
As of December 31, 2016
($M)
Order Backlog
Of the above backlog of $106.6 million, the Company expects to recognize $38.1 million of revenue within the following twelve months. In
addition, revenue for the year ending December 31, 2017 will include orders received and delivered in 2017.

24
Three months ended Dec. 31 Change
2016 2015 $ %
Revenue $ 8.7 $ 11.3 (2.6) (23)%
Gross Profit 2.0 1.7 0.3 (17)%
Gross Margin % 22.5% 14.8%
Operating Expenses
Selling, general and administrative
(excluding stock-based compensation, amortization and depreciation) 3.0 2.5 0.5 20%
Research and product development 0.7 1.0 (0.3) 30%
Adjusted EBITDA $ (1.7) $ (1.8) $ (0.1) (5)%
Notes
• Adjusted EBITDA is defined as net loss excluding: cash settled long term compensation indexed to share price, share settled stock-based
compensation expense, net finance income and expenses, depreciation and amortization. Adjusted EBITDA is a non-IFRS measure and
may not be comparable to similar measures used by other companies.
• Management uses Adjusted EBITDA as a useful measure of ongoing operational results.
(in $ millions)Q4 Results

25
Twelve months ended Dec. 31 Change
2016 2015 $ %
Revenue $ 29.0 $ 35.9 (6.9) (19)%
Gross Profit 6.0 6.0 - -%
Gross Margin % 20.7% 16.6%
Operating Expenses
Selling, general and administrative
(excluding stock-based compensation, amortization and depreciation) 10.0 9.8 0.2 2%
Research and product development 3.6 4.1 (0.5) (12)%
Adjusted EBITDA $ (7.6) $ (7.9) $ (0.3) (4)%
Notes
• Adjusted EBITDA is defined as net loss excluding: cash settled long term compensation indexed to share price, share settled stock-based
compensation expense, net finance income and expenses, depreciation and amortization. Adjusted EBITDA is a non-IFRS measure and
may not be comparable to similar measures used by other companies.
• Management uses Adjusted EBITDA as a useful measure of ongoing operational results.
(in $ millions)YTD Results

26
Cash and cash equivalents
and restricted cash
$ 11.3 $ 24.9 (13.6) (55)%
Trade, other and grants receivable 9.8 10.4 (0.6) (6)%
Inventories 17.2 14.3 2.9 20%
Operating borrowings 2.1 1.1 1.0 (91)%
Trade and other payables 7.2 7.8 (0.6) (8)%
Financial liabilities 3.9 9.0 (5.1) (57)%
Dec. 31,
2015 $ %
($M)
ChangeDec. 31,
2016
Consolidated Balance Sheet Highlights

27
Three months ended
December 31, 2016
Three months ended
December 31, 2015
Net loss (income) $ 2.5 $ 2.1
Finance (income) loss, net (0.6) (0.3)
Amortization and depreciation (0.3) (0.2)
Compensation indexed to share price 0.2 (0.2)
Stock-based compensation expense (0.1) 0.4
Adjusted EBITDA loss (income) $ 1.7 $ 1.8
($M)
Q4 Reconciliation of Non-IFRS Measures – Adj. EBITDA
* Note certain figures have been adjusted for rounding

28
Twelve months ended
December 31, 2016
Twelve months ended
December 31, 2015
Net loss (income) $ 9.9 $ 11.4
Finance (income) loss, net (1.5) (3.1)
Amortization and depreciation (0.7) (0.6)
Compensation indexed to share price 0.3 0.2
Stock-based compensation expense (0.4) -
Adjusted EBITDA loss (income) $ 7.6 $ 7.9
($M)
YTD Reconciliation of Non-IFRS Measures – Adj. EBITDA
* Note certain figures have been adjusted for rounding

29