Embed Size (px)
Citation preview

Hydrogeological Assessment of the Merti Aquifer, Kenya Technical report no 1 of ARIGA. Assessing Risks of Investment in Groundwater Development in Sub-Saharan Africa

Colofon
Document Title . Hydrogeological Assessment of the Merti Aquifer, Kenya
Client . A project financed by NERC – UPGRO
Status . Draft Report
Date . 5 augustus 2014
Project number . 528
Project team . Arjen Oord (Msc), Raoul Collenteur (Bsc), Dr. Lieselotte Tolk
Disclaimer
No rights may be derived from the information, recommendations or calculated values found in this document.. The authors are not responsible for any errors or consequences. Feel free to let us know if you have any additions or corrections through [email protected]
Summary
The Government of Kenya has approached the Dutch investment company ORIO to support the investment in infrastructure for the Habaswein-Wajir Water Supply project. The project proposes to draw water from the Merti Aquifer to supply the city of Wajir with drinking water, through a 120 km pipeline. The proposed well-field is located near Habaswein and will be used for urban water supply for Habaswein as well. This documents reports the outcomes of a hydrogeological assessment that determines the risk of groundwater depletion as a result of the proposed well-field. It is a technical report published in the framework of ARIGA - Assessing Risks of Investment in Groundwater Development in Sub-Saharan Africa. The principles of Applied Information Economics are used to develop a decision model for the water supply intervention. The results of the hydrogeological study are used in that decision model. The hydrogeological study aims to predict the effect of the pipeline project on the groundwater system, while also stating the uncertainty in the predictions. This study focusses on the prediction of drawdown of groundwater levels, ultimately leading to boreholes falling dry, and deteriorating water quality as a result of displacement of saline water in the aquifer in a 30 year time period. Process-based models, that conceptualize the physical processes in the groundwater system, are combined with stochastic methods. This approach provides the probabilistic characteristics of the model outcomes to support decision-making.
ii Acacia Water Draft Report

Table of Contents 1 Introduction ............................................................................................................. 1
1.1 Framework ....................................................................................................................................... 1
1.2 Study objective and approach.......................................................................................................... 1
2 Description of the Study Area .................................................................................. 2
2.1 Geography ........................................................................................................................................ 2
2.2 Hydrology ......................................................................................................................................... 3
2.3 Geology ............................................................................................................................................. 3
2.4 Hydrogeology ................................................................................................................................... 5
3 Methodology ............................................................................................................ 8
3.1 Method of Study ............................................................................................................................... 8
3.2 Dropping Water Levels .................................................................................................................... 9
3.2.1 Analytical Approach .............................................................................................................. 10
3.3 Salinity ............................................................................................................................................ 10
3.3.1 Numerical solutions for upconing ......................................................................................... 11
3.4 Monte Carlo .................................................................................................................................... 13
3.5 Annual Chance ............................................................................................................................... 13
4 Concept of the aquifer model .................................................................................. 14
4.1 Aquifer Geometry ........................................................................................................................... 14
4.2 Hydraulic characteristics ............................................................................................................... 14
4.3 Aquifer Salinity .............................................................................................................................. 15
4.4 Groundwater abstraction ............................................................................................................... 16
4.5 Recharge ......................................................................................................................................... 16
4.6 Numerical model discretization .................................................................................................... 17
4.7 Summary ........................................................................................................................................ 18
5 Results ................................................................................................................... 19
5.1 Drying of Boreholes ....................................................................................................................... 19
5.2 Salinity ............................................................................................................................................ 20
5.3 Conclusion ...................................................................................................................................... 21
6 Summary and Conclusions .................................................................................... 22
6.1 Summary and Conclusions ............................................................................................................ 22
6.2 Recommendations ......................................................................................................................... 23
Hydrogeological Assessment of the Merti Aquifer, Kenya Acacia Water iii

1 Introduction
1.1 Framework
The Government of Kenya has approached the Dutch investment company ORIO to support the investment in infrastructure for the Habaswein-Wajir Water Supply project. The project proposes to draw water from the Merti Aquifer to supply the city of Wajir with drinking water, through a 120 km pipeline. The proposed well-field is located near Habaswein and will be used for urban water supply for Habaswein as well. This documents reports the outcomes of a hydrogeological assessment that determines the risk of groundwater depletion as a result of the proposed well-field. It is a technical report published in the framework of ARIGA - Assessing Risks of Investment in Groundwater Development in Sub-Saharan Africa. The principles of Applied Information Economics are used to develop a decision model for the water supply intervention. The results of the hydrogeological study are used in that decision model. The ARIGA project is carried out in cooperation with ICRAF, CETRAD and University College London for NERC. The Merti Aquifer is located in northeast Kenya and provides water to the local population as well as a growing number of refugees in the area. Although it is the most important source of fresh water in the region, relatively little is known about the extent of the aquifer, its hydrogeological parameters and groundwater recharge. Lack of data and high uncertainty are typical features of many deep aquifers, particularly in Sub-Saharan Africa. The uncertainty that comes with conceptualizing the groundwater system in such a data-scarce environment greatly influences the outcome of hydrogeological assessments, often approached in a single-outcome deterministic way. However, the choices made in the conceptual model influence the outcome of the end-result. These uncertainties are generally not presented to the end-users and decision makers. Decision makers often have to deal with uncertainty when deciding on developing groundwater resources, while their extent and other characteristics are often unknown. In this study, the uncertainty involved with hydrogeological predictions is evaluated.
1.2 Study objective and approach
The study aims to predict the effect of the pipeline project on the groundwater system, while also stating the uncertainty in the predictions. This study focusses on the prediction of drawdown of groundwater levels, ultimately leading to boreholes falling dry, and deteriorating water quality as a result of displacement of saline water in the aquifer in a 30 year time period. Process-based models, that conceptualize the physical processes in the groundwater system, are combined with stochastic methods; elements representing the uncertainty in the variables are incorporated in the modelling process. This approach provides the probabilistic characteristics of the model outcomes to support decision-making.
Hydrogeological Assessment of the Merti Aquifer, Kenya Acacia Water 1

2 Description of the Study Area
2.1 Geography
This study focusses on the Habaswein-Dilmanyale aquifer in Wajir South District, Wajir County (Kenya). The local aquifer is part of the much larger cross-boundary Merti Aquifer. The study is defined by latitudes 0°50’N to 1°00’ N and longitudes 39°30’E to 40°30’E. The Merti Aquifer is located the northeast of Kenya in Isiolo- , Marsabit-, Garissa- and Wajir County. It stretches from Mt. Marsabit in the North to the town of Liboi and beyond into Somalia in the southeast, bordered by Mount Kenya in the west and Wajir in the east. An outline of the Merti Aquifer is provided in Figure 1.
Figure 1: Overview map of the study area with the location of the Merti Aquifer, Ewaso Ng’iro River, Wajir and Habaswein and the approximate location of the proposed pipeline.
2 Acacia Water Draft Report

2.2 Hydrology
Rainfall and Evaporation Rainfall in the area is limited and is characterized by large temporal and spatial variability. The mountainous areas of Mt. Kenya and Mt. Marsabit have the highest rainfall (1100 mm and 600-700 mm per year respectively), while the lower lying areas receive only 150-350 mm a year (GIBB, 2004). Most of the rainfall occurs in two rainy seasons during October-November and February-March (Swarzenski & Mundorff, 1977). The potential evaporation in the area is large, up to 2600 mm a year, and surpasses the rainfall most months of the year. However, rainfall events in the area are known to have a strong convective character, resulting in very local rainfall with a high intensity. As such, runoff may occur depending on the antecedent state of the system.
Rivers Although perennial (permanent) surface water is important for the water supply in the study area, it is outweighed by ephemeral (seasonal) sources. There are two perennial water courses in the area underlain by the aquifer: the Rivers Tana and Ewaso Ng'iro (see Figure 1). The Ewaso Ng’iro is relevant for the groundwater system underlying Habaswein and the surrounding areas. The Ewaso Ng'iro River drains the northern and western slopes of Mount Kenya and the NE slopes of the Aberdares. At Archer's Post (north of Isiolo), the mean annual flow was approximately 633 million cubic metres per year during the period 1949-1990 (GIBB, 2004). After the Ewaso Ng’iro River becomes ephemeral, it is referred to as the Lagh Dera. The ephemeral river floods irregularly. In the 1950’s the Lagh Dera was known to flood the Lorian Swamps near Habaswein regularly. However, increased water subtractions and changes in climate have caused a now irregular and less frequent flooding of this area. Currently, the swamps have retreated many kilometers upstream, decreasing the perennial swamp size from 150km2 to 39km2 (De Leeuw, Said, Kifugo, Musyimi, Mutiga, & Peden, 2012). These flood-areas are commonly referred to as the Lorian Swamps, even though the location has shifted. In most years, the perennial Ewaso Ng’iro becomes ephemeral near the town of Merti. When the rains are poor, the cessation of flow occurs even further upstream. This leaves the downstream inhabitants and livestock largely dependent on groundwater.
2.3 Geology
Anza Rift The area underlain by the Merti Aquifer comprises a thick and complex sequence of Mesozoic to Quarternary sediments, which overlie metamorphic rocks of the Precambrian Basement System. The aquifer is situated in the Anza Rift, which was formed in the Jurassic period of the Mesozoic era. It runs inland from the coast in north-western direction, and links the Lamu embayment of southern Kenya with the South Sudan rifts. This geological setting shapes the hydrogeology in the study area. The central part of the Anza Rift roughly lies under the course of the Lagh Dera and extends to the north-west beneath and west of the Mount Marsabit volcano. The southernmost part of the Anza Rift is an area where basins of several different ages intersect, with their sediments superimposed on each other (Bosworth & Morley, 1994). Widespread rifting and vertical displacements occurred in the Anza Rift during the Middle and Late Cretaceous and continued into the early Tertiary (Bosworth & Morley, 1994). As a result of various stages of rifting, uplifting, down-warping and sea level fluctuations, the Anza Rift became filled with a complex sequence of sediments, deposited in diverse environments that range from shallow to deep marine, continental-fluvial, wind-blown and lacustrine. The structurally altered Anza basin sediments are covered by un-faulted colluvial and alluvial sediments of Miocene and younger age.
Hydrogeological Assessment of the Merti Aquifer, Kenya Acacia Water 3

Geology A schematic representation of the sub-surface is shown in figure 5. The rifting process of the Anza rift has occurred in three different stages, as recognized by Bosworth and Morley (1994). In the first stage, from the late Jurassic into the Neocomian, extensional forces led to the formation of half grabens and rotational strata (Bosworth & Morley, 1994). This formation is covered by carbonates of lacustrine origin and eolian sands. This stage is followed by a period of basin reorganization that eliminated the half graben geometry. In the late Cretaceous period multiple regressions and transgressions occurred. This caused several hundreds of meters of deep marine shale to be deposited in the central Anza basin, while coarse clastic fluvial material was deposited in the northwest (Bosworth & Morley, 1994). Later, fluvial sandstone and lacustrine sediments were deposited, followed by coarse fluvial sediments by the end of the Cretaceous. The Paleogene (65 – 23 Ma BP) deposits in the Anza rift are complex and a thorough understanding of the stratigraphy remains largely unavailable. They consist of fluvial and lacustrine sediments, silt, sand and clay. The thickness of the layer differs throughout the basin, from 0 to 300 meters west of Mt. Marsabit, up to 3000 meters in the southeast of the rift (Bosworth & Morley, 1994). Of main importance to the hydrogeology are the Merti beds, which form the main aquifer body in the Merti Aquifer. Bosworth and Morley (1994) conclude that the deposits in the Anza rift are “capped by a few hundred meters of unfaulted Miocene to Recent sandstone, conglomerates and basalt”. Within this geological unit the Pliocene sediments are deposited that form the Merti Beds that are generally assumed to have a “red, white, gray or tan color” and that “include friable to semiconsolidated gravel, grit, sand, silt and clay, generally intercalated in lenticular beds” (Swarzenski & Mundorff, 1977). These beds are locally capped by two late Pliocene lava flows probably originating from Mount Kenya to the west. The entire basin is capped by Pleistocene and Holocene fluvial sediments deposited by the main drainages in the area. These deposits consist of sand, silt and clay and are generally a couple of meters in thickness.
Faults The Anza rift is characterized by many faults throughout the basin, possibly leading to both preferential flow paths as well as abrupt discontinuities in flow direction. Many faults have been identified in the area by different studies (Bosworth & Morley, 1994), most notably the Lagh Bogal fault bordering the Anza rift in the west (Reeves, Karanja, & Macleod, 1986). Other minor and major faults were identified in this study, as shown in figure 3.
4 Acacia Water Draft Report

Figure 2: Location of the Anza Rift, based on (Reeves, Karanja, & Macleod, 1986)
2.4 Hydrogeology
Groundwater resources near Habaswein include pans, shallow wells and boreholes. Groundwater occurs in shallow aquifers as well as in deep aquifers in the area. Shallow aquifers can be found in the alluvium beneath and along (ephemeral) river beds, where they occur as shallow groundwater bodies. Boreholes that tap into the deeper aquifers have variable yields and water quality (salinity). A large fresh water body is present in what is regarded in most studies as the Merti aquifer, which is one of the largest known aquifers in the region. Around Habaswein, water is generally struck at a depth of approximately 130 m below ground level. Test yields of the existing boreholes at Habaswein vary from 75 to 350 m3/day. Apart from aquifer characteristics, the yield depends on borehole characteristics, such as screen length. Only one existing borehole is known to have a large screen length (25 m), which is also has the highest yield (350m3/day). EC values at Habaswein range from 800 to 2000 µS/cm.
Hydrogeological Assessment of the Merti Aquifer, Kenya Acacia Water 5
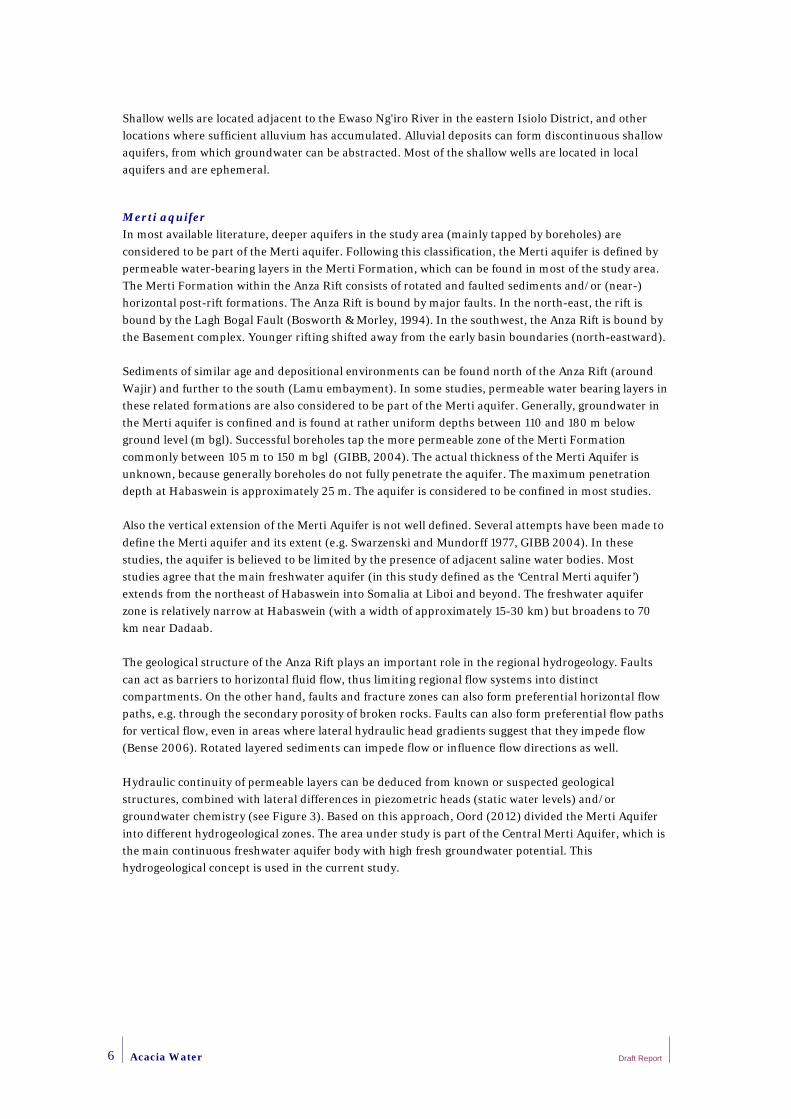
Shallow wells are located adjacent to the Ewaso Ng'iro River in the eastern Isiolo District, and other locations where sufficient alluvium has accumulated. Alluvial deposits can form discontinuous shallow aquifers, from which groundwater can be abstracted. Most of the shallow wells are located in local aquifers and are ephemeral.
Merti aquifer In most available literature, deeper aquifers in the study area (mainly tapped by boreholes) are considered to be part of the Merti aquifer. Following this classification, the Merti aquifer is defined by permeable water-bearing layers in the Merti Formation, which can be found in most of the study area. The Merti Formation within the Anza Rift consists of rotated and faulted sediments and/or (near-) horizontal post-rift formations. The Anza Rift is bound by major faults. In the north-east, the rift is bound by the Lagh Bogal Fault (Bosworth & Morley, 1994). In the southwest, the Anza Rift is bound by the Basement complex. Younger rifting shifted away from the early basin boundaries (north-eastward). Sediments of similar age and depositional environments can be found north of the Anza Rift (around Wajir) and further to the south (Lamu embayment). In some studies, permeable water bearing layers in these related formations are also considered to be part of the Merti aquifer. Generally, groundwater in the Merti aquifer is confined and is found at rather uniform depths between 110 and 180 m below ground level (m bgl). Successful boreholes tap the more permeable zone of the Merti Formation commonly between 105 m to 150 m bgl (GIBB, 2004). The actual thickness of the Merti Aquifer is unknown, because generally boreholes do not fully penetrate the aquifer. The maximum penetration depth at Habaswein is approximately 25 m. The aquifer is considered to be confined in most studies. Also the vertical extension of the Merti Aquifer is not well defined. Several attempts have been made to define the Merti aquifer and its extent (e.g. Swarzenski and Mundorff 1977, GIBB 2004). In these studies, the aquifer is believed to be limited by the presence of adjacent saline water bodies. Most studies agree that the main freshwater aquifer (in this study defined as the ‘Central Merti aquifer’) extends from the northeast of Habaswein into Somalia at Liboi and beyond. The freshwater aquifer zone is relatively narrow at Habaswein (with a width of approximately 15-30 km) but broadens to 70 km near Dadaab. The geological structure of the Anza Rift plays an important role in the regional hydrogeology. Faults can act as barriers to horizontal fluid flow, thus limiting regional flow systems into distinct compartments. On the other hand, faults and fracture zones can also form preferential horizontal flow paths, e.g. through the secondary porosity of broken rocks. Faults can also form preferential flow paths for vertical flow, even in areas where lateral hydraulic head gradients suggest that they impede flow (Bense 2006). Rotated layered sediments can impede flow or influence flow directions as well. Hydraulic continuity of permeable layers can be deduced from known or suspected geological structures, combined with lateral differences in piezometric heads (static water levels) and/or groundwater chemistry (see Figure 3). Based on this approach, Oord (2012) divided the Merti Aquifer into different hydrogeological zones. The area under study is part of the Central Merti Aquifer, which is the main continuous freshwater aquifer body with high fresh groundwater potential. This hydrogeological concept is used in the current study.
6 Acacia Water Draft Report

Figure 3: Salinity distribution in the Merti Aquifer (based on Oord, 2012). Little date is availabile on water chemistry of the southwestern flank of the Merti Aquifer. This is likely the result of poor yields and water quality in this area, leading to few completed boreholes
Figure 4: Three dimensional block diagram of the Anza Rift and the Merti Aquifer, showing the saline southern fringes of the aquifer (A), the fresh Central Merti Aquifer, near Habaswein (B) and the northern horst, beyond the Lagh Bogal faultline (C). Fresh water (blue shade) is found in the Central Merti Aquifer, underlain and flanked by saline water (red shade and asterisks . The rotated blocks at the left are the result of late Jurassic rifting. The graben structure in the centre is the result of Cretaceous rifting. Unfaulted Pliocene to Recent sediments overlie the faulted and rotated complex. The Merti Aquifer is located in these sediments.
Merti Aquifer
Hydrogeological Assessment of the Merti Aquifer, Kenya Acacia Water 7
3 Methodology
3.1 Method of Study
The uncertainties related to the ability of the proposed well-field to provide sustainable, high-quality water were studied in more detail in a hydrogeological assessment. The most relevant water-related risks for the Merti Aquifer are drying up of wells in the proposed well field and deterioration of water quality as a result of increasing salinity of the abstracted water. For this, process-based hydrogeological models were combined with stochastic methods (Monte Carlo simulations) to calculate the expected drop in groundwater levels or drawdown (potentially leading to drying up of wells) and saline water intrusion, potentially leading to deteriorating water quality. While the newly proposed National Water Policy, which is currently under discussion in parliament, states the importance of ensuring inter-generational sustainability of groundwater use, inadequate information about basic aquifer parameters hampers the practical application of this principle. In fact, lack of data and high uncertainty are typical features of many deep aquifers, particularly in Sub-Saharan Africa. Although the Merti aquifer is a vital source of fresh water in the region, relatively little is known about the extent of the aquifer, its hydrogeological parameters and groundwater recharge. Hydrogeological assessments generally aim to describe the groundwater system and assess the groundwater potential for water supply purposes. The groundwater system is conceptualized and appropriate analytical or numerical methods are used to determine the effects of groundwater abstractions. Often, these assessments are based on extrapolation of known parameters, literature values and best-guess parameters. The uncertainty that comes with conceptualizing the groundwater system in such a data-scarce environment and the choices made in the conceptual model influence the outcome of the model. These uncertainties are often not presented to the end-users. Decision making for the development of groundwater resources hence has to deal with an uncertainty, while the extent of it is unknown. In this study, the stochastic methodology aims to predict the state of the groundwater system, while also stating the uncertainty in the predictions. This approach is illustrated in Figure 5. This approach provides the probabilistic characteristics of the model outcomes to support decision-making (see table 1 and chapter 4 for the uncertainties in the parameters and further explanation of the uncertainties). This study focusses on the prediction of drawdown of groundwater levels, ultimately leading to boreholes falling dry, and deteriorating water quality as a result of displacement of saline water in the aquifer. The study is based on the supposition that both factors depend on a limited set of aquifer properties, namely well-field properties, abstraction regime and hydrological processes that influence groundwater recharge.
8 Acacia Water Draft Report

Figure 5: Representation of the different sources of uncertainty in modelling, in which P1 - Pi indicate the model parameters. The probability distributions are illustrative and do not represent real values or distributions.
3.2 Dropping Water Levels Pumping water from an aquifer usually results in lowering of the groundwater levels (drawdown). A drop in hydraulic head can lead to various problems, such as decreased borehole yield, land subsidence and boreholes falling dry. The construction of a well near Habaswein can lead to drawdown at the boreholes and in the surrounding areas. The magnitude of the drawdown is related to aquifer properties (e.g. aquifer geometry, hydraulic properties and recharge) as well as borehole properties (e.g. abstraction rate, penetration depth, screen length). The drawdown at a borehole at a given time is the change in head or water level relative to the initial head (before pumping started) at the same location. The drawdown can be calculated if the borehole and aquifer properties are well known. This way, the long term safe yield can be established, avoiding that the borehole is pumped dry. In the Merti, many important aquifer properties are unknown. Therefore, the before mentioned stochastic approach was followed to determine drawdown. The widely used three-dimensional finite-difference groundwater model MODFLOW-2005 (Harbaugh, 2005) can be applied to accurately represent the complexity of the aquifer. However, if the well diameter is much smaller than the size of the grid-cells, the maximum drawdown near the well is underestimated. Refining of the grid around the well-field would increase run-time of the models, which is impractical for stochastic modelling. Therefore, analytical methods were used to calculate the maximum drawdown near the wells. To determine the specific drawdown at the location of the wells, the Theis equation was used (Theis, 1935), which describes transient flow of water to a single pumping well in a confined aquifer.
Drawdown Threshold To evaluate whether calculated drawdown leads to drying of wells, we determined a drawdown threshold. In borehole design, the depth of the well-screen and the pump determines at what drawdown the well falls dry. This design can be altered according to expected effects of drawdown. At the time of writing, a well field design was not yet available. Therefore the threshold was based on common well design limitations, aquifer characteristics, recommendations from BAM International et al. (2012) and the consideration that in the Merti Aquifer the static water level in wells is generally several meters above the top of the aquifer. In production boreholes, a pump is usually placed at the depth well screen, where the water passes from the aquifer into the borehole. The pump is placed at such a depth, that it will not fall dry as a result a drop in levels within the borehole itself or in the aquifer. The advantage of placing the screen at a larger depth is a greater allowance for drawdown, without the pump falling dry. The disadvantages are increased cost and risk of upconing. Commonly, the pump inlet is therefore installed at a depth several meters below the anticipated level drop in the boreholes.
Hydrogeological Assessment of the Merti Aquifer, Kenya Acacia Water 9

Long-term monitoring data is not available for boreholes near Habaswein. For boreholes in the Dadaab refugee camps a maximum total drop in water level of several meters is reported in the past decade (Earth Water Ltd., 2011). Based on these figures and considerations, a range of threshold values at which the drawdown leads to drying of wells was selected of 10-12 m.
3.2.1 Analytical Approach The Merti aquifer is considered to be mainly a confined aquifer. When a fully penetrating well pumps a confined aquifer, the influence of the pumping extends radially outwards from the well with time, and the pumped water is withdrawn entirely from the storage of the aquifer. Theis (1935) developed a mathematical model of transient flow of water to a pumping well. The Theis method, used for determining the hydraulic properties of aquifers, is based on a mathematical equation (i.e., the Theis equation) for flow to a fully penetrating line sink discharging at a constant rate in a homogeneous, isotropic and nonleaky confined aquifer of infinite extent (Kruseman and De Ridder, 1990). This method is generally used to interpret the results of aquifer tests in order to determine aquifer properties. In this study the equation is used to calculate drawdown stochastically. The flow to the well is in unsteady state, i.e. the drawdown difference with time are not negligible, nor is the hydraulic gradient constant with time. The unsteady-state equation is written as:
𝑠𝑠 = 𝑄𝑄
4𝜋𝜋𝜋𝜋𝜋𝜋𝑊𝑊(𝑢𝑢)
Where: s = drawdown in m at a distance r from the well Q = the constant abstraction rate in m3/day KD = the transmissivity of the aquifer
u = 𝑟𝑟2𝑆𝑆4𝐾𝐾𝐾𝐾𝐾𝐾
S = the dimensionless storativity t = time in days since pumping started
W(u) = −0.5772− ln𝑢𝑢 + 𝑢𝑢 − 𝑢𝑢2
2∙2!+ 𝑢𝑢3
3∙3!− 𝑢𝑢4
4∙4!+ ⋯
The Merti aquifer, which is mainly confined (Mumma et al., 2011), mostly matches the conditions for application of the analytical approach described by Krusemann and Ridder (1990). Conceptualizing the aquifer as homogenous is justified, since the effect of variation in aquifer properties is addressed through the Monte Carlo approach. We used the principle of superposition to calculate the combined effect of multiple wells. In the Theis equation the aquifer is assumed to have an infinite length and a fixed width. Since the Merti aquifer does not fully meet this assumption, we introduced mirror image wells to incorporate the influence of lateral aquifer boundaries (Reilly et al., 1984). A closed boundary can be simulated by adding a mirror image of the pumping well at equal distance opposite of the boundary, and adding the calculated drawdown. Calculations were not compensated for an additional drawdown resulting from partial penetration of the aquifer.
3.3 Salinity
Saline water encroachment is the process whereby saline water intrudes the fresh water aquifer, usually as a result of pumping. It can be lateral movement of saline water, from adjacent aquifers containing saline water, or upconing from deeper aquifers. Upconing is the upward movement of saline water from deeper layers, right underneath the wells.
10 Acacia Water Draft Report

Lateral displacement In the Merti, the lateral distance to the adjacent saline water bodies is at least 20 km from Habaswein. The displacement of the saline water is approximately equal to the actual flow velocity of the groundwater. The groundwater flux has been calculated to be 2 – 12 m per year (BAM International et al., 2012). The actual velocity of water particles in a porous medium is higher and is calculated by dividing the groundwater flux by the porosity of the aquifer. The porosity is estimated to be 0.1 ±0.05 (see table 1), the maximum actual velocity based on these numbers is thus about 240 m/yr. Taking into account the actual velocity, it will at least a hundred years for saline water to reach the wells from adjacent water bodies. Given the project horizon of 30 years, lateral displacement will not be regarded in this study.
Vertical displacement Pumping a well in a fresh water aquifer underlain by saline groundwater causes a rise of the saline water front underneath the well. The process of upconing is a response to the lowering of pressure around the well. The displacement of saline water is the result of advective transport as well as dispersive transport to the well. Dispersion during the displacement of the fresh-saline interface leads to the formation of a transition zone between fresh and saline water. The width of the transitions zone increases during the upconing process (Diersch et al, 1984). This process can lead to increased salinity in the pumped well before the initial interface between fresh and saline water reaches the borehole. The current abstractions reveal a salinization risk in the Merti aquifer. Water quality in the Dadaab refugee camps has deteriorated over time, mainly due to increasing salinity, and also in Habaswein evidence exists of some salinization as a result of long term abstraction (Mumma et al., 2011). These observations strengthen the plausibility that a saline groundwater body underlies the freshwater aquifer. The displacement of the salt water zone is the result of aquifer properties as well as the pumping regime. Through careful and controlled pumping, the fresh-saline water interface can be kept at a position of equilibrium, without contamination of the borehole (Diersch et al, 1984). Different analytical and numerical approaches have been followed in literature to investigate and describe the process of upconing. In analytical formulations, the main assumption is that the interface between freshwater and saline water is abrupt, neglecting the formation of a transitions zone through dispersion. Numerical solutions can couple the flow and transport equations, incorporating density effects and dispersion. These coupled methods, however, lead to long calculation times, rendering them inefficient for stochastic modelling purposes. A lot of work has been done on upconing in groundwater supply (e.g. Diersch et al., 1984, Bower et al., 1999; Garabedian, 2013). Unfortunately, estimating the salt-fresh water interface rise under a well is a difficult technical problem (Garabedian, 2013). In this study different options are explored. In order to assess the uncertainty in predictions of upconing, the MODFLOW-SWI2 code was found to be most practical. This is a numerical, non-coupled approach as is further described below.
3.3.1 Numerical solutions for upconing In order to incorporate the combined effect of all the wells in the well-field, a numerical approach was followed. MODFLOW and related programs have capabilities to simulate solute transport and variable-density flow (including saltwater). This makes the program suitable for predictions of saline water encroachment in the Merti aquifer. The numerical solution allows for a more complex representation of the aquifer and the well-field. Two numerical solutions (SEAWAT and SWI2) were tested for suitability in the combined deterministic stochastic modelling approach. MODFLOW (McDonald, and Harbaugh, 1988) is a three-dimensional finite-difference groundwater model. MODFLOW is considered an international standard for simulating and predicting groundwater conditions (USGS). MODFLOW-2005 is the most current release of MODFLOW.
Hydrogeological Assessment of the Merti Aquifer, Kenya Acacia Water 11

MODFLOW-2005 (Harbaugh, 2005) simulates steady and nonsteady flow in an irregularly shaped flow system in which aquifer layers can be confined, unconfined, or a combination of confined and unconfined. Flow from external stresses, such as flow to wells, areal recharge, evapotranspiration, flow to drains, and flow through river beds, can be simulated (Harbaugh, 2005). In the numerical approach, the aquifer geometry is incorporated, as well as the geometry of the well field. This deterministic modelling approach is combined with stochastic methods, whereby aquifer parameters are introduced in the modelling process, in order to determine the uncertainty in model predictions. The stochastic component was programmed in Python, using the Flopy package (Bakker, Post, Hughes, Langevin, Francés, & White, 2013). The Flopy package consists of a set of scripts to run MODFLOW and MODFLOW-related groundwater programs. The model conceptualization of the numerical model is described in chapter 4.
SEAWAT The SEAWAT-code was explored for simulation of upconing. Given that stochastic modelling requires a large number of model runs, it was found that SEAWAT is unpractical for stochastic modelling due to the long runtime for each model realization. The SEAWAT (Langevin, 2009) is a generic MODFLOW/MT3DMS-based computer program designed to simulate three-dimensional variable-density groundwater flow coupled with solute and heat transport. SEAWAT therefore enables the simulation of dispersion affected upconing. the model is capable of predicting the actual concentration in the well, rather than the displacement of an abrupt fresh-saline water interface. SEAWAT requires a high (vertical) resolution of the model grid. The coupled calculations and vertical resolution result in long calculation times, especially for three-dimensional problems.
SWI2 The SWI2 Package (Bakker et al, 2013) is the latest Seawater Intrusion (SWI) Package for MODFLOW. The SWI2 Package allows three-dimensional vertically integrated variable-density groundwater flow and seawater intrusion in coastal multi-aquifer systems to be simulated in MODFLOW-2005. For variable-density groundwater flow calculations an aquifer is vertically discretized into zones of differing densities, separated from each other by defined surfaces representing interfaces or density iso-surfaces. The main advantage of using the SWI2 Package instead of variable-density groundwater flow and dispersive solute transport codes, such as SEAWAT, is that fewer model cells are required for simulations using the SWI2 Package because every aquifer can be represented by a single layer of cells. This reduction in number of required model cells and the elimination of the need to solve the advective-dispersive transport equation results in substantial model run-time savings, which can be large for regional aquifers. This makes the SWI2 package highly suitable for stochastic modelling. A limitation of the numerical approach used in the SWI2 Package is that it does not account for diffusion and dispersion (i.e. a sharp-interface approach). These processes can lead to the formation of a transition zone along the fresh-saline groundwater interface (Paster and Dagan, 2008). The width of such a zone increases during the upconing process and can lead to increased salinity of the abstracted water, before the initial interface between fresh and saline water reaches the well (Diersch et al., 1984). The reported increase of salinity in wells over time in the Merti Aquifer (Mumma et al) indicates that such a transition zone maybe present underneath the freshwater aquifer.
Approach to correct for dispersion For practical applications it is customary to limit the pumping rate, when sharp-interface calculations are used for design-purposes (Diersch et al., 1984). A safety factor can be introduced to ensure that salinity of the pumped water does not increase. Analogue to the analytical approach reviewed by Diersch et al. (1984), a safety factor of 0.4 to 0.6 was introduced to determine the threshold value for the upward movement of the fresh-saline water interface. Increased salinity in the abstracted water was assumed to occur when the fresh-saline interface has risen to 40-60% of the original depth below the well-field. The probability of 30 years of pumping leading to increased salinity is determined by using the model described above, combined with Monte Carlo simulations. The mixing zone was simulated by introducing separate brackish and saline layers in the model. The depth of the saline
12 Acacia Water Draft Report

water below the top of the aquifer, as well as the density of saline water, was varied in the Monte Carlo simulations, in addition to relevant aquifer properties and geometry.
3.4 Monte Carlo
With a Monte Carlo approach an ensemble of simulations was performed, using both the numerical and analytical methods, to establish the uncertainty range of the groundwater drawdown exceeding the threshold value. In these simulations the relevant aquifer parameters and geometry (i.e. conductivity, vertical anisotropy, storativity, effective porosity and aquifer thickness) were varied randomly within their probability distributions.
3.5 Annual Chance
The methods applied for predicting the effects of increased groundwater abstractions show the development of negative effects in time. The cost-benefit risk model requires an annual chance of failure as a result of drying boreholes and increased salinity. The annual chance of failure was based on the chance of failure after 30 years, assuming no change in annual chance in time. The following equation was used to deduce the annual chance of project failure: 𝐶𝐶ℎ𝑎𝑎𝑎𝑎𝑎𝑎𝑎𝑎 𝑜𝑜𝑜𝑜 𝑜𝑜𝑎𝑎𝑓𝑓𝑓𝑓𝑢𝑢𝑓𝑓𝑎𝑎 = 1 − (1 − 𝑥𝑥)𝑦𝑦 x = annual chance of failure y = total number of years
Hydrogeological Assessment of the Merti Aquifer, Kenya Acacia Water 13
4 Concept of the aquifer model
4.1 Aquifer Geometry
The Merti Aquifer, when defined by the presence of the geologically related Merti Beds, covers a total area of 139,000 km2 (Mumma et al, 2011). Approximately 61,000 km2 of this area holds fresh to brackish groundwater. An area of 10,000 km2 stretching from Habaswein to the Somali border is underlain by fresh groundwater. The main freshwater body of the Merti Aquier, the Central Merti Aquifer, has an elongated shape, stretching more or less from the Marsabit district to the border with Somalia and possibly beyond, along the axis of the Lagh Dera bed. This area is described as the Central Merti Aquifer.
Extent The study done by BAM International et al. (2013) study focused on a rectangle of 15 km by 30 km, running parallel to the Ewaso Ng’iro River, which is part of the Central Merti Aquifer. The Gauff report considers a strip with a width of 15 km. From water quality analysis it is found that the width of the freshwater body ranges from 30 km near Habaswein to over 90 km wide near the Somali border (Oord 2012). Along the longitudinal axis of the aquifer, the aquifer is likely to be a hydraulically continuous body, when regarded at a regional scale. The sphere of influence of the groundwater abstraction depends on aquifer geometry, properties and recharge rate. For evaluation of the effects, it is important that water can be drawn from the entirety of the Central Merti Aquifer. Therefore, it is assumed that the aquifer has a total length of 300 km and an average width of 25 km.
Thickness The thickness of the Central Merti Aquifer is not well defined (GIBB Africa Ltd. 2004, Oord 2012, BAM International 2012). However, field research in the form of geo-electrical exploration in the area around Habaswein has yielded more detailed information in the structure and thickness of this part of the Merti aquifer (BAM International, 2012). According to BAM International et al.(2012), the aquifer has an average thickness of 127 m, based on geophysical exploration. The depth to the top of the aquifer ranges from 100 to 250 m below ground level. Thickness of the aquifer influences the effects of groundwater abstraction. In the conceptual approach, the aquifer thickness is regarded as a stochastic parameter. A normal distribution comprising the range of 80 to 160 m within its 95% certainty range is assumed. This results in a mean thickness of 120m and a standard deviation of 20m.
4.2 Hydraulic characteristics The hydraulic parameters of the aquifer determine how the groundwater system will react to increased groundwater abstraction. In the model concept, the aquifer is assumed to be homogeneous. In the stochastic modelling approach, model parameters are varied in each model run, leading to a wide range of model predictions. Estimates are based on existing literature of the Merti aquifer or generic literature. For modelling purposes, the parameters values are assumed to follow a normal distribution. Some parameters were truncated to avoid modelling with physically impossible or unlikely parameter values. For many parameters, such as storativity and vertical anisotropy, there are few to no estimates for the Merti aquifer. In these cases, a wide range will be used, based on generic literature values.
14 Acacia Water Draft Report

Hydraulic Conductivity The conductivity is calculated from transmissivity values that are based on pumping well tests that assume full aquifer penetration. Since the aquifer thickness is unknown, the transmissivity values can easily be underestimated. Comparison of older boreholes with new boreholes that are generally deeper support this, showing increased transmissivities based on recent tests (GIBB Africa Ltd., 2004). Mumma et al (2011) reports that hydraulic conductivity values derived from transmissivity values range from 0.007 m2/d to 0.013 m2/d (fine facies) to 0.1 to 12 m/d (coarse facies). As the lower bound of the coarse facies (central Mert i Aquifer) is extremely low for this type of generally high yielding aquifer, a lower bound of 4 m/d is applied instead. A normal distribution comprising the range of 4 m/day to 16 m/day within its 95% certainty range is assumed. This results in a mean of 10m/day and a standard deviation of 3m/day. The vertical hydraulic conductivity is taken as α·Kh, where Kh is the average regional horizontal conductivity used in the model and α the vertical anisotropy factor. A vertical anisotropic factor (α) is introduced to simulate vertical impediment experienced by vertical heterogeneity and vertical resistance (see 4.2). Storativity has not been accurately measured in the field, and without establishing the thickness of the aquifer, measurements come with large uncertainty. The storage parameter is determined by undertaking pumping well tests. The estimates for the value of storativity range from 3 x 10⁻⁶ to 4.5 x 10⁻³ GIBB Africa Ltd. (2004) (n=3). Given the uncertainty in this parameter, literature values for specific storage for aquifers consisting of fine to coarse sand are used to calculate storativity.
4.3 Aquifer Salinity
Occurrence of saline water has been observed in the outer fringes of the Merti aquifer and is also believed to underlie the fresh water layer. The current abstractions reveal a salinization risk in the Merti aquifer. Water quality in the Dadaab refugee camps has deteriorated over time, mainly due to increasing salinity, and also in Habaswein evidence exists of some salinization as a result of long term abstraction (Mumma et al., 2011). These observations strengthen the plausibility that a saline groundwater body underlies the freshwater aquifer. In this study, the saline water is assumed to be located directly below the fresh water aquifer in the entire Central Merti Aquifer. It is unknown whether any confining layers underlie the fresh water body around Habaswein. It is assumed that there is no confining layer between the fresh and the saline water. Since no actual data is available on the occurrence density and transition zone of the saline water, assumptions are made, using a range of parameter estimates. Usually, as sharp interface is maintained between fresh and saline water if active and abundant recharge occurs and the interface is not affected by groundwater abstraction. Given that some evidence exists that salinity has increased over time in the wells at Habaswein (Mumma et al, 2011), it is assumed that a transition zone is present. Of pivotal importance in the risk-assessment of upconing is the depth of the saline water below the top of the aquifer. In the Gauff report, the depth to the saline water was estimated to be more than 200 m below ground level. Brackish pockets have been interpreted at depths between 100 and 200 m below ground level. These figures are based on geo-electrical research. At these depths, the exact level of saline water is difficult to establish due to poor resolution. Moreover, the distinction between saline water and clay layers is difficult to make without correlating the results to actual borehole-logs, because of the equivalence between the two in the geo-electrical response. Given this uncertainty, the thickness of the fresh water body (and thus the depth to the saline water) is regarded as a stochastic parameter. In this study, the thickness of the fresh water body ranges from 60 m to 140.
Hydrogeological Assessment of the Merti Aquifer, Kenya Acacia Water 15

The saline water is assumed to have an average density of 1010 kg/m3, based on an average TDS of 20.000 mg/l for saline water at a temperature of 35˚C. The national limit for allowed salt concentration is 1.5 kg/m3, which is easily surpassed saline water enters the wells. Two interfaces are assumed to exist, marking 50% and 25% of the maximum salinity. This represents the existence of a transition zone between saline and fresh water. The thickness of the transition zone is assumed to be 5 m. Furthermore, to allow for horizontal flow in the saline aquifer, a fixed thickness of 20 m is assumed for this aquifer.
4.4 Groundwater abstraction
BAM International et al. (2012) estimates that the total water demand for the Habaswein-Wajir Water Supply project will be 6,200 m3/day (2.3 million m3/year). They determined that the safe yield for individual boreholes is 24 m3/hour. The available water from the Habaswein-Dilmanyale aquifer was estimated at 5,945 m3/day (2.2 million m3/year). They recommended a total number of 12 wells, with a minimum spacing of 700 m and a filter length of 20 m. The model simulations were run for a well field of 12 wells as well as 14 wells, to incorporate a scenario where the abstraction is distributed over a larger number of wells.
4.5 Recharge The groundwater recharge to the Merti Aquifer is a much-debated topic and causes a large part of the uncertainty about the groundwater system. Knowledge of aquifer recharge is generally critical for designing a sustainable long-term groundwater use strategy. Many concepts of recharge mechanisms in the Merti Aquifer have been proposed over the years, many of which are summarized in the GIBB Africa Ltd. (2004) report. These values are widely used in various studies:
1. Recharge via the bed of the Ewaso Ng’iro river: the Ewaso Ng’iro is partly situated above the Merti Aquifer. 0.9 Mm3/yr.
2. Local recharge through volcanic rock plateau: 2.4 Mm3/yr. 3. Recharge via the bed of the Lagh Dera: 1.2 Mm3/yr.
These recharge mechanisms are all more or less continuous or at least annual events. There are however, several studies that point to the existence of decennial, centennial and even millennial recharge events (Mumma et al, 2011). These recharge events are estimated to be in the range of 30 Mm3 per event and hence can lead to a significant groundwater recharge. The GIBB Africa Ltd (2004) report suggests that recharge is possibly much more; a total annual recharge of 33 Mm,3 based on dilution calculations. Groundwater recharge estimates play an important role in establishing the sustainability of artificial groundwater abstraction. However, the exact role of recharge for the development of well-fields is not straight-forward. Generally speaking, the effect of groundwater abstraction is as follows. All water abstracted by wells is balanced by a loss of water. Shortly after the start of pumping, this loss is largely from groundwater storage in the aquifer. As a result of continued pumping, the loss of water can additionally be balanced by an increase of recharge and/or a decrease of discharge. Recharge increases through an increase of the catchment area. This is the result of the propagation of drawdown effects. A larger area will now contribute as direct recharge through precipitation ifn there is no impermeable layer overlying the aquifer and if the precipitation exceeds the actual evaporation. Another effect of the lowering of the water table is increased infiltration through recharging rivers, streams and wetlands if direct hydraulic contact exists between the surface- and groundwater (i.e. the water table is not below the bottom of the surface water body. Inflow from adjacent aquifers might also increase. Discharge decreases by a reduction of spring-flow, evapotranspiration, flow into adjacent aquifers and return flow to rivers and streams.
16 Acacia Water Draft Report

As long as the abstraction from wells is limited and hydraulic contact exists between surface and groundwater, the increase in recharge and decrease in discharge will lead to the establishment of a new equilibrium (Huisman, 1975). In case of the Merti Aquifer, direct recharge through precipitation is limited. Furthermore, the aquifer is relatively deep and groundwater levels are well below the bottom of surface water bodies, such as the Lorian Swamp. Therefore, it is unlikely that an increase in groundwater abstraction will be balanced by an increase in recharge. Balancing the groundwater abstraction by a decrease in natural discharge is also unlikely. There is no known natural discharge of groundwater through streams or springs. The aquifer is too deep to be effected by changes in evapotranspiration. It is unknown whether there is inflow from and outflow to adjacent aquifers. Given the poor aquifer properties of the area surrounding the central part of the Merti Aquifer, a large influx of (saline) groundwater is not likely. Based on the current knowledge of recharge and discharge mechanisms, it is concluded that increased groundwater abstraction is unlikely to be balanced by a change in recharge and discharge values. Because of this, the drop in groundwater levels as a result of artificial abstraction is reduced to a problem of superposition; the effect is superimposed on natural fluctuations of water levels. Both the chance of boreholes falling dry and increased salinity depend on the drawdown as a result of pumping. In this study, natural recharge and discharge will be kept constant and results presented as relative to the current groundwater heads. Several tests using the established recharge concepts for the Meri Aquifer were conducted to justify the omission of recharge as a stochastic parameter. This assumption was found to be valid, given that most recharge concepts are based on indirect recharge routes, where a large unsaturated zone exists between the surface water and deep groundwater.
4.6 Numerical model discretization
Groundwater flow within the aquifer is simulated in MODFLOW using a finite-difference approach. The finite-difference 3-dimensional grid is composed of a specified number of rows, columns and layers that represent the aquifer properties and boundary conditions. Layers are approximately horizontal collections of rows and columns. Each layer contains the same number of rows and columns. In order to accurately calculate cell-to-cell flow, the cell size of the grid must be small enough to accommodate adequate representation of the aquifer geometry and well-field. The total number of cells, however, greatly influences model performance. To allow for optimal model performance, a horizontal resolution of 350 m by 350 m is used. The model is divided in two layers: one layer has a thickness equal to the proposed length of the well screen (20 m). The second layer has a constant thickness, which is varied in each model run, based on the stochastic distribution of the thickness parameter. The well field is represented by 12 model cells that function as wells, with a constant abstraction rate of 500 m3/day. The aquifer boundaries perpendicular to the known flow direction (along the longitudinal axis of the aquifer) are modelled as general head boundaries (GHB). This condition allows water to move into or out of the model, based on the head, hydraulic conductivity and distance term. The distances used in the GBH represent the distance to the main suspected recharge area (Mt. Marsabit and the Yamicha volcanics) upstream and the Somali border downstream. The model will calculate inflow (recharge) through these boundaries accordingly. This way, the longitudinal dimension of the model is diminished, to save model run-time. Trial runs were made to verify that the distance to the GHB is adequate, so that model results are not influenced by the position of the GHB. The total simulation time is 30 years, using time steps of 110 days. Test runs were made to determine the optimal length of time steps, without influencing the results variable density calculations.
Hydrogeological Assessment of the Merti Aquifer, Kenya Acacia Water 17
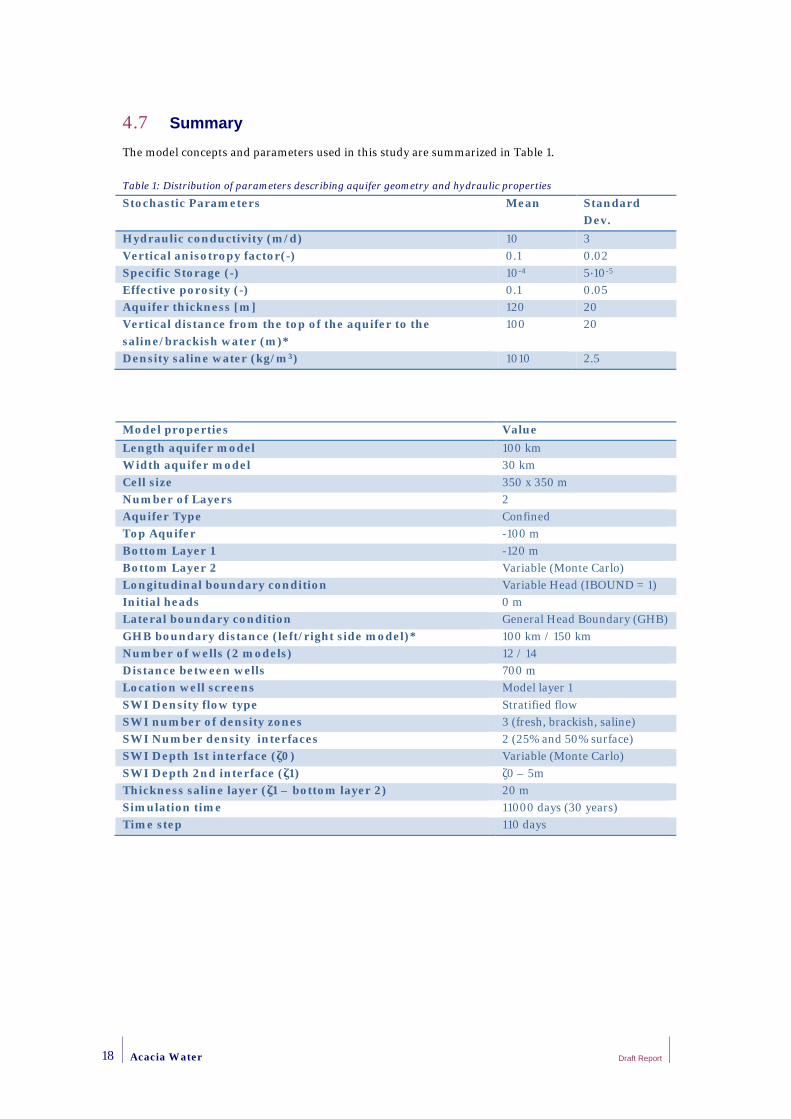
4.7 Summary The model concepts and parameters used in this study are summarized in Table 1. Table 1: Distribution of parameters describing aquifer geometry and hydraulic properties
Stochastic Parameters Mean Standard Dev.
Hydraulic conductivity (m/d) 10 3 Vertical anisotropy factor(-) 0.1 0.02 Specific Storage (-) 10-4 5∙10-5 Effective porosity (-) 0.1 0.05 Aquifer thickness [m] 120 20 Vertical distance from the top of the aquifer to the saline/brackish water (m)*
100 20
Density saline water (kg/m3) 1010 2.5 Model properties Value Length aquifer model 100 km Width aquifer model 30 km Cell size 350 x 350 m Number of Layers 2 Aquifer Type Confined Top Aquifer -100 m Bottom Layer 1 -120 m Bottom Layer 2 Variable (Monte Carlo) Longitudinal boundary condition Variable Head (IBOUND = 1) Initial heads 0 m Lateral boundary condition General Head Boundary (GHB) GHB boundary distance (left/right side model)* 100 km / 150 km Number of wells (2 models) 12 / 14 Distance between wells 700 m Location well screens Model layer 1 SWI Density flow type Stratified flow SWI number of density zones 3 (fresh, brackish, saline) SWI Number density interfaces 2 (25% and 50% surface) SWI Depth 1st interface (ζ0) Variable (Monte Carlo) SWI Depth 2nd interface (ζ1) ζ0 – 5m Thickness saline layer (ζ1 – bottom layer 2) 20 m Simulation time 11000 days (30 years) Time step 110 days
18 Acacia Water Draft Report

5 Results
5.1 Drying of Boreholes
Based on Monte Carlo simulations using the Theis equation, plausible drawdowns after a 30-year period ranged from 5.4 m (10th percentile) to 13.7 m (90th percentile) with a median drawdown of 8.0 m in a well field using 12 wells (Figure 10a,b). In a well field using 14 wells, drawdown ranged from 5.2 m (10th percentile) to 13.3 m (90 th percentile) with a median of 7.8 m. The difference between the 12 and 14 well design was relatively small (Figure 10c,d). Due to the relatively small distance between wells, the total drawdown at a well was mainly caused by the combined effect of surrounding wells. From the probability-based calculations we concluded that the chance of wells running dry after 30 years was 15% to 30%, assuming that 10 m to 12 m drawdown would cause wells to fall dry.
Figure 10: Results of the hydrogeological assessment – a) histogram of calculated drawdown values, b) cumulative probability distribution of calculated drawdown.
Hydrogeological Assessment of the Merti Aquifer, Kenya Acacia Water 19
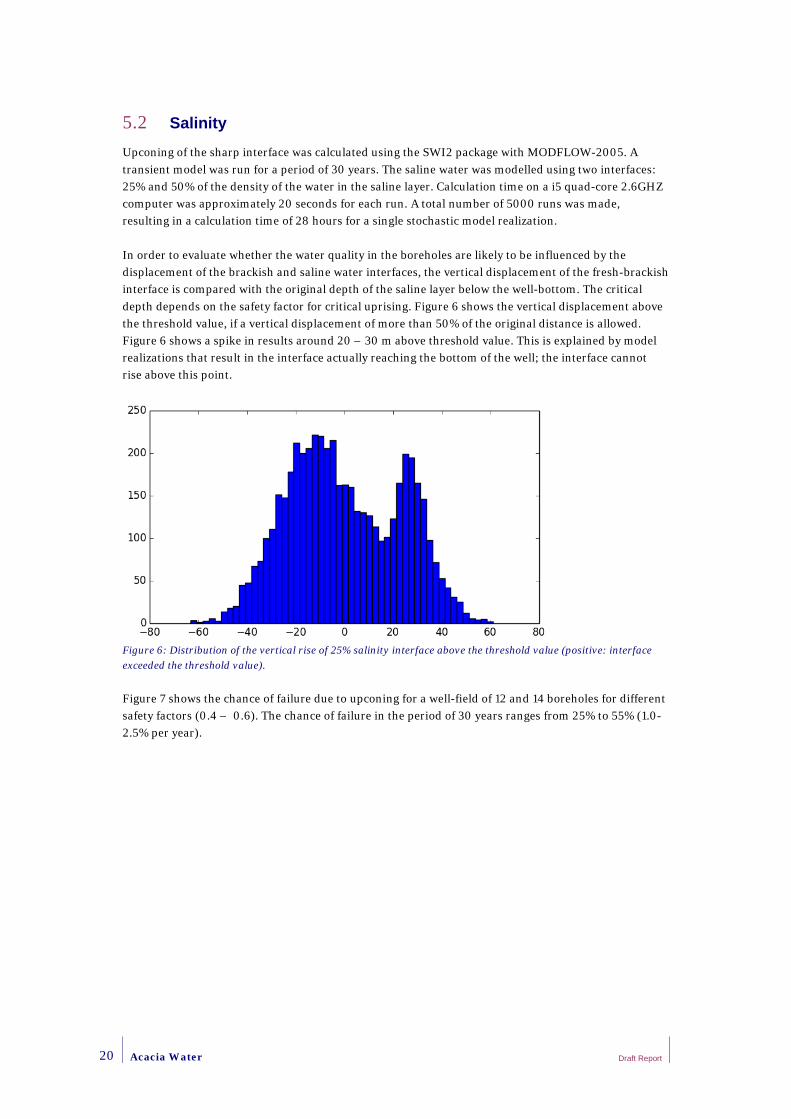
5.2 Salinity Upconing of the sharp interface was calculated using the SWI2 package with MODFLOW-2005. A transient model was run for a period of 30 years. The saline water was modelled using two interfaces: 25% and 50% of the density of the water in the saline layer. Calculation time on a i5 quad-core 2.6GHZ computer was approximately 20 seconds for each run. A total number of 5000 runs was made, resulting in a calculation time of 28 hours for a single stochastic model realization. In order to evaluate whether the water quality in the boreholes are likely to be influenced by the displacement of the brackish and saline water interfaces, the vertical displacement of the fresh-brackish interface is compared with the original depth of the saline layer below the well-bottom. The critical depth depends on the safety factor for critical uprising. Figure 6 shows the vertical displacement above the threshold value, if a vertical displacement of more than 50% of the original distance is allowed. Figure 6 shows a spike in results around 20 – 30 m above threshold value. This is explained by model realizations that result in the interface actually reaching the bottom of the well; the interface cannot rise above this point.
Figure 6: Distribution of the vertical rise of 25% salinity interface above the threshold value (positive: interface exceeded the threshold value). Figure 7 shows the chance of failure due to upconing for a well-field of 12 and 14 boreholes for different safety factors (0.4 – 0.6). The chance of failure in the period of 30 years ranges from 25% to 55% (1.0-2.5% per year).
20 Acacia Water Draft Report

Figure 7: Results of the hydrogeological assessment – a)cumulative probability distribution of the fresh-saline water interface exceeding the critical depth in a field of 12 wells, using different safety factors (Θ) – positive values represent exceedance of the threshold, b) cumulative probability distribution of the fresh-saline water interface exceeding the critical depth in a field of 14 wells.
5.3 Conclusion
Using SWI2 in combination with MODFLOW-2005 is a practical tool in evaluating the risk of upconing as a result of groundwater abstraction. The upconing is mainly a result of the drop of pressure right underneath the well, as a result of drawdown. The risk of upconing in the case of the Habaswein-Wajir Water Supply is much larger than the risk of boreholes falling dry. The process of upconing is difficult to reverse, but can be avoided by careful groundwater abstraction and monitoring of the upward movement of the fresh-saline interface. Of main importance is that the depth to the saline water is established by drilling exploratory boreholes. If no saline water is found at a depth of 250 m below ground level, chances are slim that upconing will be a problem in the next 30 years. The main advantage of using SWI2 with MODFLOW-2005 is that it allows for a complex representation of the aquifer geometry, without leading to excessive model run-time. The relative importance of parameters, such as depth to the saline layer, were evaluated for different parameter ranges. The stochastic approach thus leads to increased insight in aquifer response to abstraction and its uncertainties. This can help in planning field-research and research-fund allocation.
a)
b)
Hydrogeological Assessment of the Merti Aquifer, Kenya Acacia Water 21

6 Summary and Conclusions
6.1 Summary and Conclusions
As part of the Wajir-Habaswein Water Supply Project, a well field is proposed for the Merti Aquifer near Habaswein. The aquifer is part of the larger freshwater Central Merti Aquifer, one of the most important sources of freshwater in northern Kenya. As part of the ARIGA-project, the chance of success of this project from a hydrogeological point of view was assessed, using a risk-based approach. The proposed safe yield for groundwater abstraction from the aquifer was used for combined deterministic-stochastic model calculations, allowing for uncertainty evaluation in model predictions. The aim of the study was to determine the chance of critical drawdown, leading to boreholes falling dry and the chance of deteriorating quality of the abstracted water, as a result of salt water intrusion (upconing). The projections are made for a 30 year period of continued groundwater abstraction. The stochastic-deterministic modelling approach revealed a higher annual probability to the risk of saline water upconing (1.0-2.5% per year) than to wells running dry (0.5-1.2%). While this may seem low, it corresponds to risks 25-55% and 15-30% over the 30 year time frame considered by the model. Plausible drawdowns after a 30-year period ranged from 5.4 m to 13.7 m with a median drawdown of 8.0 m in a well-field using 12 wells. Spreading the total abstraction over 14 boreholes slightly reduces the total drawdown. The total drawdown in the well-field is largely the result of the proximity of the boreholes in the well-field (distance between boreholes is 700 m). Lateral movement of saline water is unlikely to affect water quality in the boreholes, because of the distances involved and the low groundwater velocity in the Merti Aquifer. The chance of the water quality greatly mainly depends on the upward movement of saline water as a result of pumping (upconing). The process of upconing is highly sensitive for aquifer and groundwater properties, as well as the pumping regime. There is a sharp tipping point where conditions become supercritical, leading to a steady upward movement of the saline water body. The combined deterministic and stochastic approach, using MODFLOW-2005 and the SWI2 package with a range of estimated parameter values, leads to increased insight in aquifer response to abstraction in data-scarce areas. The uncertainty approach can be used to make a weighed decision whether groundwater supply is viable from a hydrogeological point of view, or funds should be allocated towards more research, before the decision can be made.
22 Acacia Water Draft Report

6.2 Recommendations The uncertainty in drawdown-calculations mainly depends on aquifer properties such as conductivity, thickness and storativity. Uncertainty can therefore be decreased by conducting several full-scale aquifer tests, before implementation of the water supply project. The uncertainty in the effect of upconing mainly depends on the depth to the saline water. In order decrease the uncertainty with regard to the risk of upconing, exploratory boreholes should be drilled to a depth of at least 250 m. Careful well-field design, based on information of exploratory boreholes and aquifer tests can reduce the risk of upconing. The well-field design should be based on field-research, supported by modelling. The risk of upconing can also be lowered by increasing the spacing between boreholes in the well-field. Upconing is a relatively slow process. If monitoring boreholes are installed, upconing can be detected at an early stage. A strategic monitoring network can be used to as an early warning system. If an increase in salinity is detected, the pumping regime can be adjusted in order to avoid further upconing. It should be noted that this leads to decreased water availability.
Hydrogeological Assessment of the Merti Aquifer, Kenya Acacia Water 23


Annex 1: References Bakker, M., Schaars, F., Hughes, J.D., Langevin, C.D. and Dausman, A.M., 2013. Documentation of the seawater intrusion (SWI2) package for MODFLOW. USGS. BAM International, G.I., BAM Balteau, Vitens Evides International, 2012. Development Phase Wajir/Habaswein Water Supply Project: Hydrological Report (Revision 1), Ministry Of State For Development Of Northern Kenya And Other Arid Lands, Kenya. De Leeuw, J. et al., 2012. Benefits of riverine water discharge into the Lorian Swamp, Kenya. Water, 4(4): 1009-1024. Diersch, H.-J., Prochnow, D. and Thiele, M., 1984. Finite-element analysis of dispersion-affected saltwater upconing below a pumping well. Applied Mathematical Modelling, 8(5): 305-312. Garabedian, S. P. (2013), Estimation of Salt Water Upconing Using a Steady-State Solution for Partial Completion of a Pumped Well. Groundwater, 51: 927–934. doi: 10.1111/gwat.12013 GIBB Africa Ltd., 2004. UNICEF Kenya Country Office - Study of the Merti Aquifer - Technical Report ISsue 2.0. Harbaugh, A.W., 2005. MODFLOW-2005, the US Geological Survey modular ground-water model: The ground-water flow process. US Department of the Interior, US Geological Survey Reston, VA, USA. Huisman, L., 1975. Groundwater Recovery, Macmillan pub. Kruseman, G.P. and Ridder, N.A., 1990. Analysis and evaluation of pumping test data. ILRI publication(47). Langevin, C., Thorne Jr, D., Dausman, A., Sukop, M. and Guo, W., 2007. SEAWAT version 4: a computer program for simulation of multi-species solute and heat transport: US Geological Survey Techniques and Methods Book 6. Chapter A22, 39. Mumma, A., Lane, M., Kairu, E., Tuinhof, A. and Hirji, R., 2011. Kenya: Groundwater Governance Case Study. Oord, A., 2011. Droogte in de Hoorn van Afrika Ontwikkeling van de Merti aquifer in noordoost Kenia. Stromingen, 16(3). Osman, A.D., 2012. Groundwater quality in Wajir (Kenya) shallow aquifer: An examination of the association between water quality and water-borne diseases in children, La Trobe University, Bundoora, 185 pp. Paster, A. and Dagan, G., 2008. Mixing at the interface between two fluids in aquifer well upconing steady flow. Water resources research, 44(5). Reilly, T.E., Franke, O.L. and Bennett, G.D., 1984. The principle of superposition and its application in ground-water hydraulics.
Hydrogeological Assessment of the Merti Aquifer, Kenya Acacia Water 1

Swarzenski, W.V. and Mundorff, M.J., 1977. Geohydrology of North eastern province, Kenya, USGS Water Supply Paper 1757-N, 1977, 68 Pp Theis, C.V., 1935. The relation between the lowering of the piezometric surface and the rate and duration of discharge of a well using ground water storage. US Department of the Interior, Geological Survey, Water Resources Division, Ground Water Branch.
2 Acacia Water Draft Report

Acacia Water Jan van Beaumontstraat 1 2805 RN Gouda Telefoon: 0182 – 686424 Internet: www.acaciawater.com Email: [email protected]