Embed Size (px)
Citation preview

CommIT (Communication & Information Technology) Journal 13(2), 105–111, 2019
Hydroponic Nutrient Control System Basedon Internet of Things
Herman1, Demi Adidrana2, Nico Surantha3, and Suharjito41−4Computer Science Department, BINUS Graduate Program - Master of Computer Science, Bina
Nusantara UniversityJakarta 11480, Indonesia
Email: [email protected], [email protected], [email protected],[email protected]
Abstract—The human population significantly in-creases in crowded urban areas. It causes a reductionof available farming land. Therefore, a landless plantingmethod is needed to supply the food for society. Hy-droponics is one of the solutions for gardening methodswithout using soil. It uses nutrient-enriched mineral wa-ter as a nutrition solution for plant growth. Traditionally,hydroponic farming is conducted manually by monitoringthe nutrition such as acidity or basicity (pH), the valueof Total Dissolved Solids (TDS), Electrical Conductivity(EC), and nutrient temperature. In this research, theresearchers propose a system that measures pH, TDS,and nutrient temperature values in the Nutrient FilmTechnique (NFT) technique using a couple of sensors.The researchers use lettuce as an object of experimentand apply the k-Nearest Neighbor (k-NN) algorithmto predict the classification of nutrient conditions. Theresult of prediction is used to provide a command to themicrocontroller to turn on or off the nutrition controlleractuators simultaneously at a time. The experiment resultshows that the proposed k-NN algorithm achieves 93.3%accuracy when it sets to k = 5.
Index Terms—Hydroponic, k-Nearest Neighbor (k-NN), pH, Total Dissolved Solids (TDS)
I. INTRODUCTION
THE population of the world has increased al-most 2000 times from the past 12-millennium
population [1]. Population increases significantly inbig cities [2]. The increasing population causes thedecreasing of open land, which is required as mediato grow plants and maintain the world population’sfood supply. Therefore, a landless planting method isneeded in rural and urban areas. Hydroponics is one ofthe solutions to gardening methods without using soilas planting media. It uses nutrient-enriched mineralwater as a nutrient solution for plant growth [3]. Ingeneral, maintaining the quality of hydroponic plants
Received: Sep. 14, 2019; received in revised form: Nov. 13, 2019;accepted: Nov. 14, 2019; available online: Nov. 18, 2019.
is done manually by monitoring the nutrition suchas acidity or basicity (pH) value, the value of totaldissolved solids (TDS), electrical conductivity (EC),and water temperature. Using the Internet of Things(IoT) concept, monitoring and controlling can be doneremotely through the Internet in real-time. Accordingto Ref. [4], IoT can increase plant growth due tomaintaining the nutritional value and reducing plantmaintenance costs by around 23%–70%.
Some studies are done by employing IoT on thehydroponic nutrient control system. Reference [5] ap-plies IoT to monitor pH and nutrient temperature onhydroponic with the NFT method. It can show thecondition of nutrients, send a notification through atext message gateway, and control the actuator pH andoxygen pump. Reference [6] builds an IoT for thehydroponics system. It is divided into two parts: theautomatic part and the manual part. It allows usersto manually control the nutrient such as light, tem-perature, and humidity. The system runs automaticallyto check and refill nutrients by self-regulating anddisplays the graphics of nutrients to the users.
In another hydroponic research [7], IoT is combinedwith Deep Neural Networks (DNN) to predict nutrientcontrol. The DNN predicts the label based on tablecontrol, which has eight labels. The system outputshows the sensor value and predicts the control labelswith the prediction of accuracy percentage.
Moreover, Ref. [8] predicts the soil using machinelearning and IoT. The study is a soil-based system andpredicts the soil condition. The irrigation system isfully automated and uses k-Nearest Neighbor (k-NN)as a machine learning classification to predict the soilcondition.
The k-NN is known as a simple and easy to use.It can also be used in various applications [9]. The k-NN is also known as a lazy algorithm, in which thecalculation of the classification of the test sample is
Cite this article as: Herman, D. Adidrana, N. Surantha, and Suharjito, “Hydroponic Nutrient Control SystemBased on Internet of Things”, CommIT (Communication & Information Technology) Journal 13(2), 105–111,2019.large. It uses a large amount of memory, so the scoringis slow [10]. Moreover, Ref. [11] uses k-NN to predictwater quality by comparing to Random Forest (RF)method results and testing several water conditions.The k-NN classification has higher accuracy than theRF with the same data samples. It indicates that k-NN can be used for water quality prediction andmanagement.
Similarly, Ref. [12] proposes the uses of fuzzy logicand IoT for monitoring and controlling system. IoTdevices are used to monitor plant conditions and waterneeds. Meanwhile, fuzzy logic is used to control thesupply of water and nutrition precisely. This researchalso uses lettuce and bok choy and compares themby using smart control with a traditional method. Theresult shows that using intelligent control, plants cangrow better by validating through the visual look ofthe plants.
In this research, the researchers propose a systemdesign of the Nutrient Film Technique (NFT) for ahydroponic nutrition control system using the k-NNmethod and IoT. This system design is expected toprovide accurate calculation results to command themicrocontroller to turn on or off the nutrition con-trollers more than one at a time, such as pH down, pHup, AB nutrition, and filter pump. The k-NN algorithmis used for predicting the classification of nutrientconditions so the system can provide information onnutrition conditions to the user. pH and TDS values arecontrolled using pH (Up and Down) solution, nutrients(A and B) to increase the TDS value, and nutrient filterto reduce the TDS value obtained from the pH sensorand TDS sensor.
II. RESEARCH METHOD
NFT method is selected for the hydroponic system.It has three holes of plant net pot and two levels of thegutter. It is divided into 12 parts. Those are nutrienttank, IoT module (sensor module and actuator module),sensors (pH, TDS, Temperature probe), pH up liquidtank, pH down liquid tank, nutrient A liquid, nutrientB liquid, TDS down pump, TDS down filter, nutrientcirculation pump, gutter, and net pot. The NFT systemcan be seen in Fig. 1.
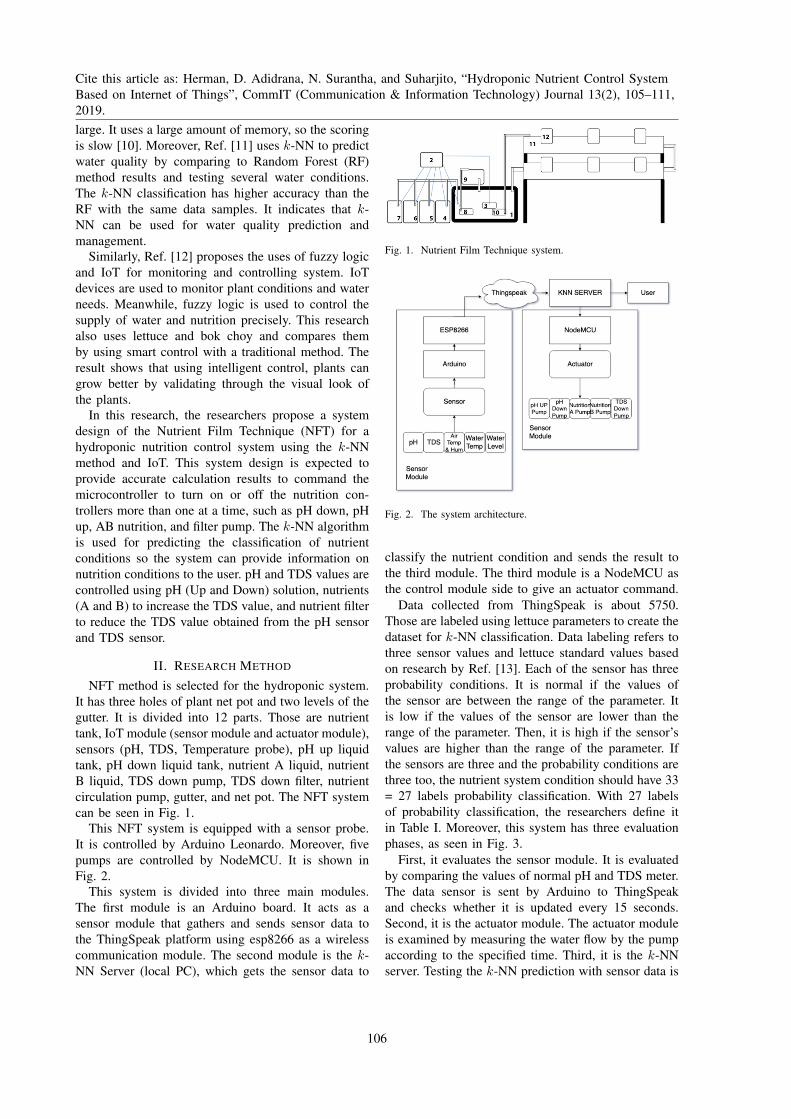
This NFT system is equipped with a sensor probe.It is controlled by Arduino Leonardo. Moreover, fivepumps are controlled by NodeMCU. It is shown inFig. 2.
This system is divided into three main modules.The first module is an Arduino board. It acts as asensor module that gathers and sends sensor data tothe ThingSpeak platform using esp8266 as a wirelesscommunication module. The second module is the k-NN Server (local PC), which gets the sensor data to
IEEE TRANSACTIONS ON EDUCATION
2
the microcontroller to turn on or off the nutrition controllers
more than one at a time, such as pH down, pH up, AB
nutrition, and filter pump. k-NN (k-Nearest Neighbor)
algorithm uses for predicting the classification of nutrient
conditions so the system can provide information on nutrition
conditions to the user. pH and TDS values controlled using pH
(Up and Down) solution, nutrients (A and B) to increase the
TDS value, and nutrient filter to reduce the TDS value
obtained from the pH sensor and TDS sensor.
II. METHOD
NFT method selected for the hydroponic system, it has 3
holes of plant net pot and 2 levels of the gutter, while the
design is as follows in Fig.1, which divided into 12 parts:
1) Nutrient tank
2) IoT module (sensor module and actuator module)
3) Sensors (pH, TDS, Temperature probe)
4) pH up liquid tank
5) pH down liquid tank
6) Nutrient A liquid
7) Nutrient B liquid
8) TDS down pump
9) TDS down filter
10) Nutrient circulation pump
11) Gutter
12) Net pot
Fig 1: NFT System
This NFT system equipped with a sensor probe controlled by
Arduino Leonardo and five pumps controlled by NodeMCU
“Fig. 2”.
Fig. 2: System Architecture
This system divided into three main modules, the first
module is an Arduino act as sensor module which gather and
sends sensor data to the thingspeak platform using esp8266 as
a wireless communication module, the second module is the k-
NN Server (local PC) which gets the sensor data to classify the
nutrient condition and sends the result to the third module
which is a NodeMCU as the control module side to give
actuator command.
Data collected from thingspeak is about 5,750 and labeled
using lettuce parameters to create the dataset for k-Nearest
Neighbor classification. Data labeling refers to 3 sensor values
and lettuce standard values based on research [13], each of
these sensors have 3 probability condition such as normal if
the values of the sensor are between parameters range, low if
the values of the sensor are lower than parameters range, and
high if the sensors values are higher than parameters range.
Then, if the sensors are 3 and the probability conditions are 3
too, so the nutrient system condition should have 33 = 27
labels probability classification, then with thus 27 labels
probability classification, we define it with table 1.
This system has 3 evaluate phase, as can be seen in Fig 3
Fig 3: Evaluation phase
a) Evaluate the Sensor Module
The Sensor module evaluated by comparing the
values of normal pH and TDS meter where the data
sensor sent by Arduino to thingspeak and check
whether it is updated every 15 seconds.
b) Actuator Module
The actuator module evaluated by measuring the
water flow that can be flowed by the pump according
to the specified time.
c) k-NN Server
Evaluation
Sensor Module
Actuator Module
K-NN Server
Fig. 1. Nutrient Film Technique system.
IEEE TRANSACTIONS ON EDUCATION
2
the microcontroller to turn on or off the nutrition controllers
more than one at a time, such as pH down, pH up, AB
nutrition, and filter pump. k-NN (k-Nearest Neighbor)
algorithm uses for predicting the classification of nutrient
conditions so the system can provide information on nutrition
conditions to the user. pH and TDS values controlled using pH
(Up and Down) solution, nutrients (A and B) to increase the
TDS value, and nutrient filter to reduce the TDS value
obtained from the pH sensor and TDS sensor.
II. METHOD
NFT method selected for the hydroponic system, it has 3
holes of plant net pot and 2 levels of the gutter, while the
design is as follows in Fig.1, which divided into 12 parts:
1) Nutrient tank
2) IoT module (sensor module and actuator module)
3) Sensors (pH, TDS, Temperature probe)
4) pH up liquid tank
5) pH down liquid tank
6) Nutrient A liquid
7) Nutrient B liquid
8) TDS down pump
9) TDS down filter
10) Nutrient circulation pump
11) Gutter
12) Net pot
Fig 1: NFT System
This NFT system equipped with a sensor probe controlled by
Arduino Leonardo and five pumps controlled by NodeMCU
“Fig. 2”.
Fig. 2: System Architecture
This system divided into three main modules, the first
module is an Arduino act as sensor module which gather and
sends sensor data to the thingspeak platform using esp8266 as
a wireless communication module, the second module is the k-
NN Server (local PC) which gets the sensor data to classify the
nutrient condition and sends the result to the third module
which is a NodeMCU as the control module side to give
actuator command.
Data collected from thingspeak is about 5,750 and labeled
using lettuce parameters to create the dataset for k-Nearest
Neighbor classification. Data labeling refers to 3 sensor values
and lettuce standard values based on research [13], each of
these sensors have 3 probability condition such as normal if
the values of the sensor are between parameters range, low if
the values of the sensor are lower than parameters range, and
high if the sensors values are higher than parameters range.
Then, if the sensors are 3 and the probability conditions are 3
too, so the nutrient system condition should have 33 = 27
labels probability classification, then with thus 27 labels
probability classification, we define it with table 1.
This system has 3 evaluate phase, as can be seen in Fig 3
Fig 3: Evaluation phase
a) Evaluate the Sensor Module
The Sensor module evaluated by comparing the
values of normal pH and TDS meter where the data
sensor sent by Arduino to thingspeak and check
whether it is updated every 15 seconds.
b) Actuator Module
The actuator module evaluated by measuring the
water flow that can be flowed by the pump according
to the specified time.
c) k-NN Server
Evaluation
Sensor Module
Actuator Module
K-NN Server
Fig. 2. The system architecture.
classify the nutrient condition and sends the result tothe third module. The third module is a NodeMCU asthe control module side to give an actuator command.
Data collected from ThingSpeak is about 5750.Those are labeled using lettuce parameters to create thedataset for k-NN classification. Data labeling refers tothree sensor values and lettuce standard values basedon research by Ref. [13]. Each of the sensor has threeprobability conditions. It is normal if the values ofthe sensor are between the range of the parameter. Itis low if the values of the sensor are lower than therange of the parameter. Then, it is high if the sensor’svalues are higher than the range of the parameter. Ifthe sensors are three and the probability conditions arethree too, the nutrient system condition should have 33= 27 labels probability classification. With 27 labelsof probability classification, the researchers define itin Table I. Moreover, this system has three evaluationphases, as seen in Fig. 3.
First, it evaluates the sensor module. It is evaluatedby comparing the values of normal pH and TDS meter.The data sensor is sent by Arduino to ThingSpeakand checks whether it is updated every 15 seconds.Second, it is the actuator module. The actuator moduleis examined by measuring the water flow by the pumpaccording to the specified time. Third, it is the k-NNserver. Testing the k-NN prediction with sensor data is
106

Cite this article as: Herman, D. Adidrana, N. Surantha, and Suharjito, “Hydroponic Nutrient Control SystemBased on Internet of Things”, CommIT (Communication & Information Technology) Journal 13(2), 105–111,2019.
TABLE ITHE DETAILED CLASS DISTRIBUTION OF MOSCOW PRIVATE DATASET.
Label Condition Solution
1 Normal Idle2 Normal pH, normal ppm, high temperature Chiller on3 Normal pH, normal ppm, low temperature Chiller off4 Normal pH, high ppm, normal temperature TDS down, pump on5 Normal pH, high ppm, high temperature TDS down, pump on, chiller on6 Normal pH, high ppm, low temperature TDS down, pump on7 Normal pH, low ppm, normal temperature Nutrition ab pump on8 Normal pH, low ppm, high temperature Nutrition ab pump on, chiller on9 Normal pH, low ppm, low temperature Nutrition ab pump on10 High pH, normal ppm, normal temperature pH down, pump on11 High pH, normal ppm, high temp pH down, pump on, chiller on12 High pH, normal ppm, low temperature pH down, pump on13 High pH, high ppm, normal temperature pH down pump on, TDS down, pump on14 High pH, high ppm, high temperature pH down pump on, TDS down, pump on, chiller on15 High pH, high ppm, low temperature pH down, pump on, TDS down, pump on16 High pH, low ppm, normal temperature pH down pump on, nutrition ab pump on17 High pH, low ppm, high temperature pH down pump on, chiller on18 High pH, low ppm, low temperature pH down pump on, nutrition ab on19 Low pH, normal ppm, normal temperature pH up, pump on20 Low pH, normal ppm, high temperature pH up, pump on, chiller on21 Low pH, normal ppm, low temperature pH up, pump on22 Low pH, high ppm, low temperature pH up, pump on, TDS down, pump on23 Low pH, high ppm, high temperature pH up, pump on, TDS down, pump on, chiller on24 Low pH, high ppm, low temperature pH up, pump on, TDS down, pump on25 Low pH, high ppm, normal temperature pH up, pump on, nutrition ab pump on26 Low pH, low ppm, high temperature pH up, pump on, nutrition ab pump on, chiller on27 Low pH, low ppm, low temperature pH up, pump on, nutrition ab pump on
IEEE TRANSACTIONS ON EDUCATION
2
the microcontroller to turn on or off the nutrition controllers
more than one at a time, such as pH down, pH up, AB
nutrition, and filter pump. k-NN (k-Nearest Neighbor)
algorithm uses for predicting the classification of nutrient
conditions so the system can provide information on nutrition
conditions to the user. pH and TDS values controlled using pH
(Up and Down) solution, nutrients (A and B) to increase the
TDS value, and nutrient filter to reduce the TDS value
obtained from the pH sensor and TDS sensor.
II. METHOD
NFT method selected for the hydroponic system, it has 3
holes of plant net pot and 2 levels of the gutter, while the
design is as follows in Fig.1, which divided into 12 parts:
1) Nutrient tank
2) IoT module (sensor module and actuator module)
3) Sensors (pH, TDS, Temperature probe)
4) pH up liquid tank
5) pH down liquid tank
6) Nutrient A liquid
7) Nutrient B liquid
8) TDS down pump
9) TDS down filter
10) Nutrient circulation pump
11) Gutter
12) Net pot
Fig 1: NFT System
This NFT system equipped with a sensor probe controlled by
Arduino Leonardo and five pumps controlled by NodeMCU
“Fig. 2”.
Fig. 2: System Architecture
This system divided into three main modules, the first
module is an Arduino act as sensor module which gather and
sends sensor data to the thingspeak platform using esp8266 as
a wireless communication module, the second module is the k-
NN Server (local PC) which gets the sensor data to classify the
nutrient condition and sends the result to the third module
which is a NodeMCU as the control module side to give
actuator command.
Data collected from thingspeak is about 5,750 and labeled
using lettuce parameters to create the dataset for k-Nearest
Neighbor classification. Data labeling refers to 3 sensor values
and lettuce standard values based on research [13], each of
these sensors have 3 probability condition such as normal if
the values of the sensor are between parameters range, low if
the values of the sensor are lower than parameters range, and
high if the sensors values are higher than parameters range.
Then, if the sensors are 3 and the probability conditions are 3
too, so the nutrient system condition should have 33 = 27
labels probability classification, then with thus 27 labels
probability classification, we define it with table 1.
This system has 3 evaluate phase, as can be seen in Fig 3
Fig 3: Evaluation phase
a) Evaluate the Sensor Module
The Sensor module evaluated by comparing the
values of normal pH and TDS meter where the data
sensor sent by Arduino to thingspeak and check
whether it is updated every 15 seconds.
b) Actuator Module
The actuator module evaluated by measuring the
water flow that can be flowed by the pump according
to the specified time.
c) k-NN Server
Evaluation
Sensor Module
Actuator Module
K-NN Server
Fig. 3. The evaluation phase.
based on 27 conditions of nutrient using real-time testdata from ThingSpeak. Then, the researchers calculatethe accuracy with different k-value to get the optimalk-accuracy with the Eq. (1). The accuracy result showsthe percentage of tests that are correctly classified byclassifier [14]. The equation can be seen as follows:
Accuracy =True ClassificationTotal Classification
× 100%. (1)
A. Proposed Hardware Design
A sensor module consists of several tools andsensors. Those are Arduino, breadboard, pH sensor,TDS sensor, DHT11 sensor, DS1B820 sensor, HC-SR04 Sensor, and ESP8266. Figure 4 is a schematic
description of the Arduino pin connection to the pinsensor and ESP8266. There are three sensors withdigital pins connected to the 3.3v pin and groundpin, and two analog sensors (pH sensor and a TDSsensor) that are connected with 5v pin and ground pin.Furthermore, ESP8266, as a wireless communicationmedia, is connected to D10 and D11 pins, which areconnected serially and given a 5v and ground voltage.
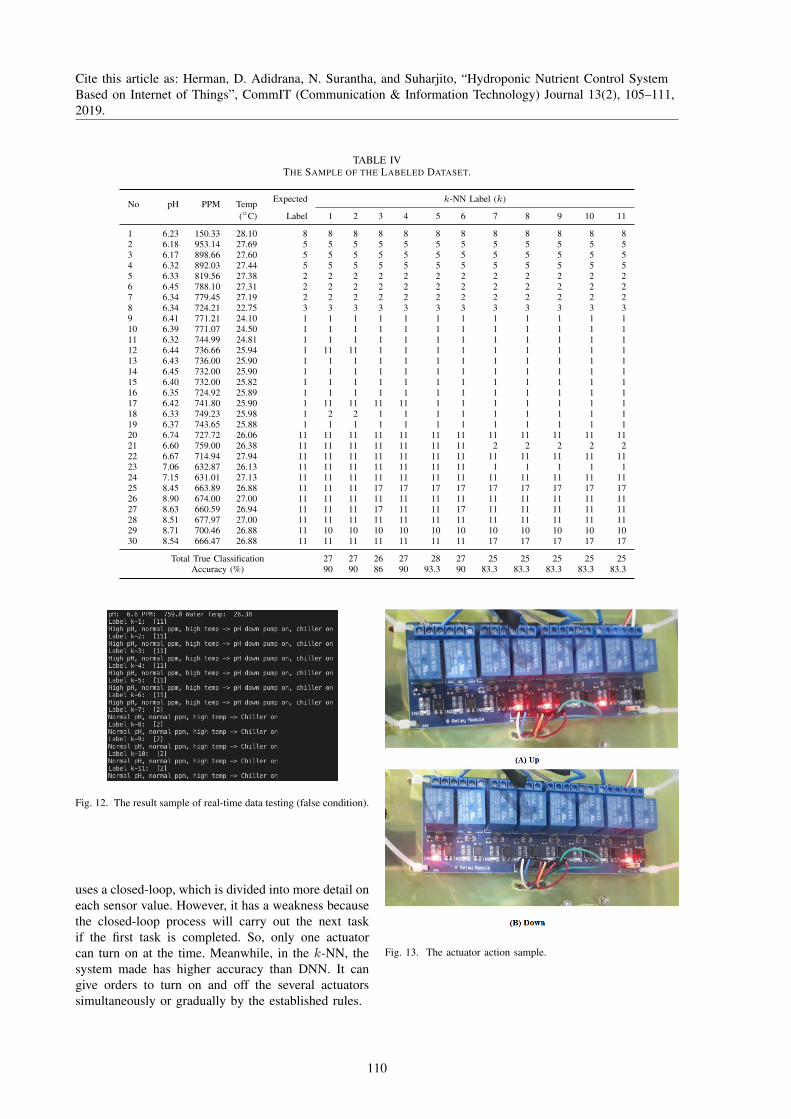
Moreover, the actuator module consists ofNodeMCU, breadboard power supply, 8-chanelrelay, and five water pumps with the scheme inFig. 5. The relay connects with five digital pins fromNodeMCU to exchange data from pump 1 to pump5. The relay is connected with a 3.3v and GND pinfrom NodeMCU. Meanwhile, the pump gets voltageand GND from the 5v power supply. Figure 6 is theresult of the sensor and actuator module that havebeen arranged and installed inside the box. Once itis assembled, the sensor and actuator modules areinstalled on the NFT hydroponic system. It is shownin Fig. 7.
B. Actuator Control Design
The actuator is controlled by using the results of thek-NN classification. It runs on k-NN Server in localPC with the specification, as follows:
1) AMD C60 1 GHz CPU2) 1 GB RAM Memory3) 250 GB hard drive
107
Cite this article as: Herman, D. Adidrana, N. Surantha, and Suharjito, “Hydroponic Nutrient Control SystemBased on Internet of Things”, CommIT (Communication & Information Technology) Journal 13(2), 105–111,2019.
IEEE TRANSACTIONS ON EDUCATION
3
(1), the accuracy result shown the percentage of tests
that are correctly classified by classifier[14].
𝐴𝑐𝑐𝑢𝑟𝑎𝑐𝑦 = True Classification
𝑇𝑜𝑡𝑎𝑙 𝐶𝑙𝑎𝑠𝑠𝑖𝑓𝑖𝑐𝑎𝑡𝑖𝑜𝑛𝑥100%. (1)
III. PROPOSED HARDWARE DESIGN
A Sensor module consists of several tools and sensors,
1) Arduino
2) Breadboard
3) pH sensor
4) TDS sensor
5) DHT11 sensor
6) DS1B820 sensor
7) HC-SR04 Sensor
8) ESP8266
Fig 4 Module Sensor Scheme
Fig. 4 is a schematic description of the Arduino pin
connection to the pin sensor and esp8266. There are 3 sensors
with digital pins connected to 3.3v pin and ground pin, 2 analog
sensors, which is a pH sensor, and a TDS sensor that connected
with 5v pin and ground pin. Furthermore, esp8266 as a wireless
communication media connected to D10 and D11 pins which
are connected serially and given a 5v and ground voltage
The actuator module consists of NodeMCU, Breadboard
Power Supply, 8 Chanel Relay, and 5 pcs water pump with the
scheme in Fig. 5
Fig 5. Actuator Module Scheme.
The relay connects with 5 digital pins from NodeMCU to
exchange data from pump 1 to pump 5. The relay connected
TABLE I
NUTRITION CONDITION CLASSIFICATION
Label Condition Solution
1 Normal Idle
2 Normal pH, normal
ppm, high temp Chiller on
3 Normal pH, normal ppm, low temp
Chiller off
4 Normal pH, high ppm,
normal temp TDS down pump on
5 Normal pH, high ppm,
high temp TDS down pump on, chiller on
6 Normal pH, high ppm, low temp
TDS down pump on
7 Normal pH, low ppm,
normal temp Nutrition ab pump on
8 Normal pH, low ppm,
high temp Nutrition ab pump on, chiller on
9 Normal pH, low ppm, low temp
Nutrition ab pump on
10 High pH, normal ppm,
normal temp pH down pump on
11 High pH, normal ppm,
high temp pH down pump on, chiller on
12 High pH, normal ppm, low temp
pH down pump on
13 High pH, high ppm,
normal temp
pH down pump on, TDS down pump
on
14 High pH, high ppm,
high temp
pH down pump on, TDS down pump
on, chiller on
15 High pH, high ppm, low temp
pH down pump on, TDS down pump on
16 High pH, low ppm,
normal temp
pH down pump on, nutrition ab
pump on
17 High pH, low ppm,
high temp pH down pump on, chiller on
18 High pH, low ppm, low temp
pH down pump on, nutrition ab on
19 Low pH, normal ppm,
normal temp pH up pump on
20 Low pH, normal ppm,
high temp pH up pump on, chiller on
21 Low pH, normal ppm, low temp
pH up pump on
22 Low pH, high ppm,
low temp pH up pump on, TDS down pump on
23 Low pH, high ppm,
high temp
pH up pump on, TDS down pump
on, chiller on
24 Low pH, high ppm, low temp
pH up pump on, TDS down pump on
25 Low pH, high ppm,
normal temp
pH up pump on, nutrition ab pump
on
26 Low pH, low ppm,
high temp
pH up pump on, nutrition ab pump
on, chiller on
27 Low pH, low ppm, low temp
pH up pump on, nutrition ab pump on
Fig. 4. The Module sensor scheme.IEEE TRANSACTIONS ON EDUCATION
4
Fig 5. Actuator Module Scheme.
The relay connects with 5 digital pins from NodeMCU to
exchange data from pump 1 to pump 5. The relay connected
with a 3.3v and GND pin from NodeMCU while the pump
gets voltage and GND from the 5v power supply.
Fig 6. is the result of the sensor and actuator module that
have been arranged and installed inside the box.
Fig 6. The Result of Sensor and Actuator Module
Once assembled, the sensor and actuator modules installed
on the NFT hydroponic system as follows in Fig 7.
Fig 7. NFT system assembled with module
IV. ACTUATOR CONTROL DESIGN
The actuator controlled by using the results of the k-NN
classification runs on k-NN Server in local PC with
specification: 1) AMD C60 1 Ghz CPU
2) 1 Gb RAM Memory
3) 250 GB hard drive
4) Windows 7 32bit
Fig 8 shows the actuator control design flowchart.
Fig 8. The actuator control design flowchart
The first phase before building the actuator control saves the
sensors data from the database with CSV format as a dataset
as follows in table 2.
This dataset then classified and labeled manually using a
spreadsheet-based on 27 probability classifications, so the
labeled dataset created and shown in table 3.
TABLE II
SAMPLE OF DATASET THE COLLECTED FROM THINGSPEAK
entry_id
airtem
hum watertem
pH ppm ec wlvl
3276 28.6 63 27 5.94 900.15 1406.49 15 3277 28.7 63 27.06 6.3 834.12 1303.31 15 3278 28.5 60 27 6.07 792.49 1238.26 15 3279 28.5 63 27.13 6.54 849.18 1326.84 15 3280 28.6 63 27.06 6.4 835.27 1305.11 15
Fig. 5. The actuator module scheme.
IEEE TRANSACTIONS ON EDUCATION
4
Fig 5. Actuator Module Scheme.
The relay connects with 5 digital pins from NodeMCU to
exchange data from pump 1 to pump 5. The relay connected
with a 3.3v and GND pin from NodeMCU while the pump
gets voltage and GND from the 5v power supply.
Fig 6. is the result of the sensor and actuator module that
have been arranged and installed inside the box.
Fig 6. The Result of Sensor and Actuator Module
Once assembled, the sensor and actuator modules installed
on the NFT hydroponic system as follows in Fig 7.
Fig 7. NFT system assembled with module
IV. ACTUATOR CONTROL DESIGN
The actuator controlled by using the results of the k-NN
classification runs on k-NN Server in local PC with
specification: 1) AMD C60 1 Ghz CPU
2) 1 Gb RAM Memory
3) 250 GB hard drive
4) Windows 7 32bit
Fig 8 shows the actuator control design flowchart.
Fig 8. The actuator control design flowchart
The first phase before building the actuator control saves the
sensors data from the database with CSV format as a dataset
as follows in table 2.
This dataset then classified and labeled manually using a
spreadsheet-based on 27 probability classifications, so the
labeled dataset created and shown in table 3.
TABLE II
SAMPLE OF DATASET THE COLLECTED FROM THINGSPEAK
entry_id
airtem
hum watertem
pH ppm ec wlvl
3276 28.6 63 27 5.94 900.15 1406.49 15 3277 28.7 63 27.06 6.3 834.12 1303.31 15 3278 28.5 60 27 6.07 792.49 1238.26 15 3279 28.5 63 27.13 6.54 849.18 1326.84 15 3280 28.6 63 27.06 6.4 835.27 1305.11 15
Fig. 6. The result of the sensor and actuator module.
4) Windows 7 32bit
Figure 8 shows the actuator control design flowchart.The first phase before building the actuator control issaving the sensors data from the database with CSV
IEEE TRANSACTIONS ON EDUCATION
4
Fig 5. Actuator Module Scheme.
The relay connects with 5 digital pins from NodeMCU to
exchange data from pump 1 to pump 5. The relay connected
with a 3.3v and GND pin from NodeMCU while the pump
gets voltage and GND from the 5v power supply.
Fig 6. is the result of the sensor and actuator module that
have been arranged and installed inside the box.
Fig 6. The Result of Sensor and Actuator Module
Once assembled, the sensor and actuator modules installed
on the NFT hydroponic system as follows in Fig 7.
Fig 7. NFT system assembled with module
IV. ACTUATOR CONTROL DESIGN
The actuator controlled by using the results of the k-NN
classification runs on k-NN Server in local PC with
specification: 1) AMD C60 1 Ghz CPU
2) 1 Gb RAM Memory
3) 250 GB hard drive
4) Windows 7 32bit
Fig 8 shows the actuator control design flowchart.
Fig 8. The actuator control design flowchart
The first phase before building the actuator control saves the
sensors data from the database with CSV format as a dataset
as follows in table 2.
This dataset then classified and labeled manually using a
spreadsheet-based on 27 probability classifications, so the
labeled dataset created and shown in table 3.
TABLE II
SAMPLE OF DATASET THE COLLECTED FROM THINGSPEAK
entry_id
airtem
hum watertem
pH ppm ec wlvl
3276 28.6 63 27 5.94 900.15 1406.49 15 3277 28.7 63 27.06 6.3 834.12 1303.31 15 3278 28.5 60 27 6.07 792.49 1238.26 15 3279 28.5 63 27.13 6.54 849.18 1326.84 15 3280 28.6 63 27.06 6.4 835.27 1305.11 15
Fig. 7. Nutrient Film Technique system with the assembled module.
format as a dataset. It is shown in Table II. Then,this dataset is classified and labeled manually usinga spreadsheet-based on 27 probability classifications.Thus, the labeled dataset is created and shown inTable III.
After a dataset is labeled, actuator control is built,as shown in Fig. 8. First, the researchers take the pre-viously made dataset and divide it into attributes as xand label as y. The y is dependent data. The attribute isindependent data, which is pH, TDS, and temperaturesensor data. Second, the researchers normalize the xdata using the MinMaxScaler function to transformdataset values between 0–1. Third, the researchersget the last updated sensors data from ThingSpeak.Fourth, the researchers calculate the last updated datausing Euclidian distance with each sensor data fromthe dataset. Fifth, the researchers rank the Euclidianresult from the lowest to highest distance. The lowestresult indicates the closest distance to the last updatedsensors data. Sixth, the researchers classify the resultdata by counting the majority uses optimal k, which isdetermined later. The classification result is shown inFig. 9.
Figure 9 shows the label of [1], so the k-NNserver sends a command to NodeMCU to control theactuator based on the solution from Table I as “NormalCondition”. Thus, the actuator will turn the chiller andall pumps off.
III. RESULTS AND DISCUSSION
The k-NN evaluation uses real-time data fromThingSpeak. It is done by retrieving real-time data forevery 25 minutes of data collection from ThingSpeak.Each dataset is calculated by using k-value to getthe majority rank. The initial range of k-values is bydividing the dataset into 80% data train and 20% testdata. Then, calculating accuracy is done by the k-NNclassification.
Figure 10 shows the four test results to get the initialk-value range. It shows that the highest k-value isk = 5. It decreases on the higher k-value, so the teststops at k = 11. The next test is retrieving real-timedata from ThingSpeak and giving several conditionson hydroponic nutrition. Then, the researchers use the
108

Cite this article as: Herman, D. Adidrana, N. Surantha, and Suharjito, “Hydroponic Nutrient Control SystemBased on Internet of Things”, CommIT (Communication & Information Technology) Journal 13(2), 105–111,2019.
TABLE IITHE COLLECTED SAMPLE OF DATASET FROM THINGSPEAK.
Entry id Air Temp. Humidity Water Temp. pH PPM EC WLVL(◦C) (RH) (◦C)
3276 28.6 63 27.00 5.94 900.15 1406.49 153277 28.7 63 27.06 6.30 834.12 1303.31 153278 28.5 60 27.00 6.07 792.49 1238.26 153279 28.5 63 27.13 6.54 849.18 1326.84 153280 28.6 63 27.06 6.40 835.27 1305.11 15
TABLE IIITHE SAMPLE OF THE LABELED DATASET.
No pH ppm Water Temp. Label
1 5.94 723.00 27.00 22 6.19 970.23 27.06 53 6.07 366.00 27.00 84 6.93 689.00 27.13 115 7.89 935.27 27.06 14
IEEE TRANSACTIONS ON EDUCATION
4
Fig 5. Actuator Module Scheme.
The relay connects with 5 digital pins from NodeMCU to
exchange data from pump 1 to pump 5. The relay connected
with a 3.3v and GND pin from NodeMCU while the pump
gets voltage and GND from the 5v power supply.
Fig 6. is the result of the sensor and actuator module that
have been arranged and installed inside the box.
Fig 6. The Result of Sensor and Actuator Module
Once assembled, the sensor and actuator modules installed
on the NFT hydroponic system as follows in Fig 7.
Fig 7. NFT system assembled with module
IV. ACTUATOR CONTROL DESIGN
The actuator controlled by using the results of the k-NN
classification runs on k-NN Server in local PC with
specification: 1) AMD C60 1 Ghz CPU
2) 1 Gb RAM Memory
3) 250 GB hard drive
4) Windows 7 32bit
Fig 8 shows the actuator control design flowchart.
Fig 8. The actuator control design flowchart
The first phase before building the actuator control saves the
sensors data from the database with CSV format as a dataset
as follows in table 2.
This dataset then classified and labeled manually using a
spreadsheet-based on 27 probability classifications, so the
labeled dataset created and shown in table 3.
TABLE II
SAMPLE OF DATASET THE COLLECTED FROM THINGSPEAK
entry_id
airtem
hum watertem
pH ppm ec wlvl
3276 28.6 63 27 5.94 900.15 1406.49 15 3277 28.7 63 27.06 6.3 834.12 1303.31 15 3278 28.5 60 27 6.07 792.49 1238.26 15 3279 28.5 63 27.13 6.54 849.18 1326.84 15 3280 28.6 63 27.06 6.4 835.27 1305.11 15
Fig. 8. The actuator control design flowchart.
IEEE TRANSACTIONS ON EDUCATION
5
After dataset labeled then Actuator control build as on fig 8,
and the detailed steps are,
1) Take the previously made dataset and divide it into
attributes as X and label as y. y is dependent data, and
the attribute is independent data, which is pH, TDS, and
temperature sensor data
2) Normalized the X data using the MinMaxScaler function
to transform dataset values between 0 – 1.
3) Get the last updated sensors data from thingspeak,
4) Calculate the last updated data using Euclidian distance
with each of the sensor's data from the dataset.
5) Rank the Euclidian result from the lowest to highest
distance, the lowest result indicates the closest distance
to the last updated sensors data.
6) Classify the result data by counting the majority uses
optimal k which determined later.
7) The classification result is shown in Fig 9.
Fig 9. k-NN Result
8) Fig 9 shows the label is “[1]”, so the k-NN server sends a
command to NodeMCU to control the actuator based on
solution from table 1 as “Normal Condition” so the
actuator will turn the chiller and all pump off.
TABLE III LABELED DATASET SAMPLE
no pH ppm watertem label 1 5.94 723 27 2 2 6.19 970.23 27.06 5 3 6.07 366 27 8 4 6.93 689 27.13 11 5 7.89 935.27 27.06 14
Fig. 9. The k-Nearest Neighbor result.
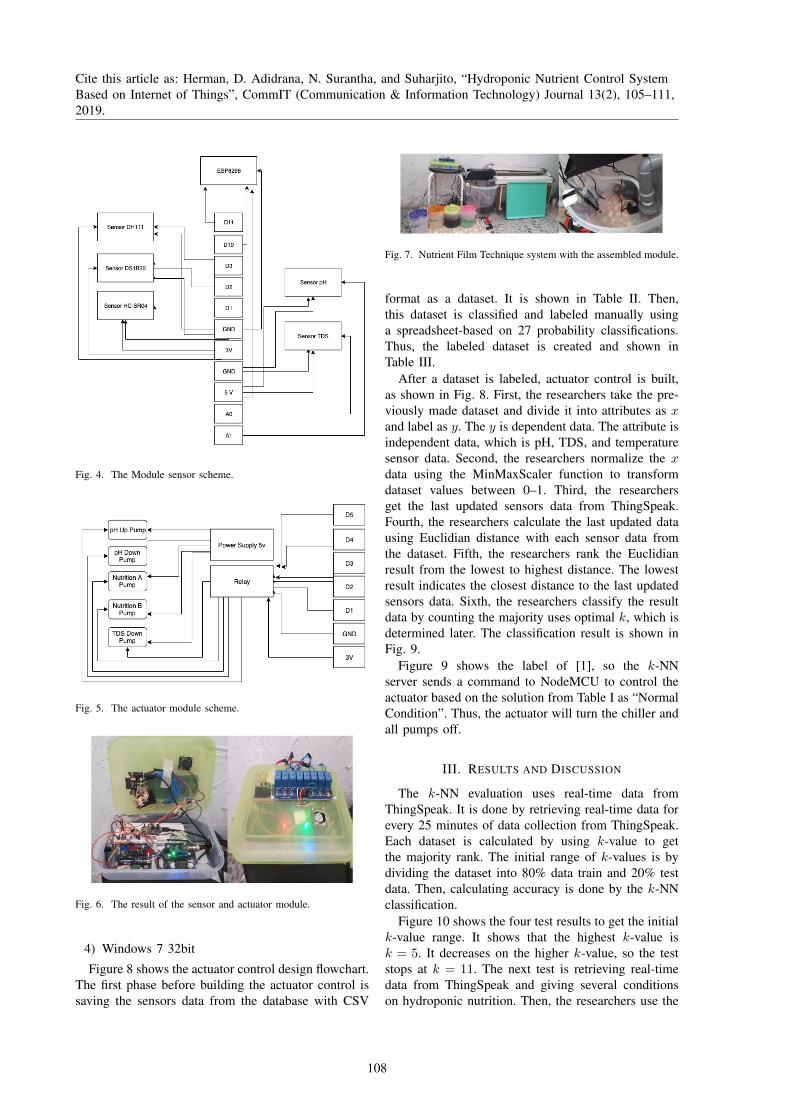
k-value range between 1–11. Table IV shows the clas-sification result. Moreover, the sample classificationsresult are shown in Figs. 11 and 12.
Equation (1) is used to get the classification accuracyvalue from 30 experiments. The highest accuracy valueof the k-NN classification is 93.3% with k = 5.The actuator module uses it as a command. Then,Fig. 13 shows the actuator module action sample.
IEEE TRANSACTIONS ON EDUCATION
7
k-NN evaluation uses realtime data from thingspeak by
retrieving realtime data for every 25 minutes of data collection
from thingspeak. Each data calculated uses k value to get the
majority rank. The initial range of k values defines by dividing
the dataset into 80% data train and 20% test data, then
calculating accuracy by carrying out the k-NN classification.
Fig 10. Initial test for k value
Fig 10 shows 4 test result to get the initial k value range, it
shows the highest k value is k = 5 and decreasing on higher k
value, so the test stops at k = 11. The next test is retrieving
realtime data from thingspeak and give several conditions on
hydroponic nutrition then use k value range between 1 – 11.
Table 4 above shows the classification result, and the sample
classifications result are shown in Fig 11 – Fig 12.
Fig 11 Realtime data testing result sample (true condition).
Fig 12 Realtime data testing result sample (with the false condition)
Equation (1) used to get the classification accuracy value
from 30 experiments. The highest accuracy value of the k-NN
classification is 93.3% with k = 5.
Fig 11 and 12 show the k-NN classification solution. The
actuator module uses it as a command; Fig 13 shows the
actuator module action sample.
Fig 13 Actuator action sample (A) Up, (B) Down
Fig 13 (A) shows 3 actuator lights on (red light), indicate the
actuator module received the command from k-NN Server and
turn on the nutrition A pump, nutrition B pump, and pH down
pump. Fig 13 (B) shows 2 actuator lights on, indicate the
actuator module turns the pH Up pump on and TDS down
pump on at a time.
From previous studies [7] and [12] , a comparison between
method with this k-NN method can be seen in table 5
Fig. 10. The initial test for k-value.
IEEE TRANSACTIONS ON EDUCATION
7
k-NN evaluation uses realtime data from thingspeak by
retrieving realtime data for every 25 minutes of data collection
from thingspeak. Each data calculated uses k value to get the
majority rank. The initial range of k values defines by dividing
the dataset into 80% data train and 20% test data, then
calculating accuracy by carrying out the k-NN classification.
Fig 10. Initial test for k value
Fig 10 shows 4 test result to get the initial k value range, it
shows the highest k value is k = 5 and decreasing on higher k
value, so the test stops at k = 11. The next test is retrieving
realtime data from thingspeak and give several conditions on
hydroponic nutrition then use k value range between 1 – 11.
Table 4 above shows the classification result, and the sample
classifications result are shown in Fig 11 – Fig 12.
Fig 11 Realtime data testing result sample (true condition).
Fig 12 Realtime data testing result sample (with the false condition)
Equation (1) used to get the classification accuracy value
from 30 experiments. The highest accuracy value of the k-NN
classification is 93.3% with k = 5.
Fig 11 and 12 show the k-NN classification solution. The
actuator module uses it as a command; Fig 13 shows the
actuator module action sample.
Fig 13 Actuator action sample (A) Up, (B) Down
Fig 13 (A) shows 3 actuator lights on (red light), indicate the
actuator module received the command from k-NN Server and
turn on the nutrition A pump, nutrition B pump, and pH down
pump. Fig 13 (B) shows 2 actuator lights on, indicate the
actuator module turns the pH Up pump on and TDS down
pump on at a time.
From previous studies [7] and [12] , a comparison between
method with this k-NN method can be seen in table 5
Fig. 11. The result sample of real-time data testing (true condition).
Fig. 13(A) shows three lights on actuator (red light).Those indicate that the actuator module receives thecommand from the k-NN server and turns on thenutrition A pump, nutrition B pump, and pH downpump. Figure 13(B) shows two lights in the actuator. Itimplies that the actuator module turns the pH up, pumpon, TDS down, pump on at a time. From previousstudies [7, 12], a comparison between DNN, fuzzylogic, and k-NN method can be seen in Table V. Thefuzzy logic method has the highest accuracy because it
109
Cite this article as: Herman, D. Adidrana, N. Surantha, and Suharjito, “Hydroponic Nutrient Control SystemBased on Internet of Things”, CommIT (Communication & Information Technology) Journal 13(2), 105–111,2019.
TABLE IVTHE SAMPLE OF THE LABELED DATASET.
No pH PPM Temp Expected k-NN Label (k)
(◦C) Label 1 2 3 4 5 6 7 8 9 10 11
1 6.23 150.33 28.10 8 8 8 8 8 8 8 8 8 8 8 82 6.18 953.14 27.69 5 5 5 5 5 5 5 5 5 5 5 53 6.17 898.66 27.60 5 5 5 5 5 5 5 5 5 5 5 54 6.32 892.03 27.44 5 5 5 5 5 5 5 5 5 5 5 55 6.33 819.56 27.38 2 2 2 2 2 2 2 2 2 2 2 26 6.45 788.10 27.31 2 2 2 2 2 2 2 2 2 2 2 27 6.34 779.45 27.19 2 2 2 2 2 2 2 2 2 2 2 28 6.34 724.21 22.75 3 3 3 3 3 3 3 3 3 3 3 39 6.41 771.21 24.10 1 1 1 1 1 1 1 1 1 1 1 110 6.39 771.07 24.50 1 1 1 1 1 1 1 1 1 1 1 111 6.32 744.99 24.81 1 1 1 1 1 1 1 1 1 1 1 112 6.44 736.66 25.94 1 11 11 1 1 1 1 1 1 1 1 113 6.43 736.00 25.90 1 1 1 1 1 1 1 1 1 1 1 114 6.45 732.00 25.90 1 1 1 1 1 1 1 1 1 1 1 115 6.40 732.00 25.82 1 1 1 1 1 1 1 1 1 1 1 116 6.35 724.92 25.89 1 1 1 1 1 1 1 1 1 1 1 117 6.42 741.80 25.90 1 11 11 11 11 1 1 1 1 1 1 118 6.33 749.23 25.98 1 2 2 1 1 1 1 1 1 1 1 119 6.37 743.65 25.88 1 1 1 1 1 1 1 1 1 1 1 120 6.74 727.72 26.06 11 11 11 11 11 11 11 11 11 11 11 1121 6.60 759.00 26.38 11 11 11 11 11 11 11 2 2 2 2 222 6.67 714.94 27.94 11 11 11 11 11 11 11 11 11 11 11 1123 7.06 632.87 26.13 11 11 11 11 11 11 11 1 1 1 1 124 7.15 631.01 27.13 11 11 11 11 11 11 11 11 11 11 11 1125 8.45 663.89 26.88 11 11 11 17 17 17 17 17 17 17 17 1726 8.90 674.00 27.00 11 11 11 11 11 11 11 11 11 11 11 1127 8.63 660.59 26.94 11 11 11 17 11 11 17 11 11 11 11 1128 8.51 677.97 27.00 11 11 11 11 11 11 11 11 11 11 11 1129 8.71 700.46 26.88 11 10 10 10 10 10 10 10 10 10 10 1030 8.54 666.47 26.88 11 11 11 11 11 11 11 17 17 17 17 17
Total True Classification 27 27 26 27 28 27 25 25 25 25 25Accuracy (%) 90 90 86 90 93.3 90 83.3 83.3 83.3 83.3 83.3
IEEE TRANSACTIONS ON EDUCATION
7
k-NN evaluation uses realtime data from thingspeak by
retrieving realtime data for every 25 minutes of data collection
from thingspeak. Each data calculated uses k value to get the
majority rank. The initial range of k values defines by dividing
the dataset into 80% data train and 20% test data, then
calculating accuracy by carrying out the k-NN classification.
Fig 10. Initial test for k value
Fig 10 shows 4 test result to get the initial k value range, it
shows the highest k value is k = 5 and decreasing on higher k
value, so the test stops at k = 11. The next test is retrieving
realtime data from thingspeak and give several conditions on
hydroponic nutrition then use k value range between 1 – 11.
Table 4 above shows the classification result, and the sample
classifications result are shown in Fig 11 – Fig 12.
Fig 11 Realtime data testing result sample (true condition).
Fig 12 Realtime data testing result sample (with the false condition)
Equation (1) used to get the classification accuracy value
from 30 experiments. The highest accuracy value of the k-NN
classification is 93.3% with k = 5.
Fig 11 and 12 show the k-NN classification solution. The
actuator module uses it as a command; Fig 13 shows the
actuator module action sample.
Fig 13 Actuator action sample (A) Up, (B) Down
Fig 13 (A) shows 3 actuator lights on (red light), indicate the
actuator module received the command from k-NN Server and
turn on the nutrition A pump, nutrition B pump, and pH down
pump. Fig 13 (B) shows 2 actuator lights on, indicate the
actuator module turns the pH Up pump on and TDS down
pump on at a time.
From previous studies [7] and [12] , a comparison between
method with this k-NN method can be seen in table 5
Fig. 12. The result sample of real-time data testing (false condition).
uses a closed-loop, which is divided into more detail oneach sensor value. However, it has a weakness becausethe closed-loop process will carry out the next taskif the first task is completed. So, only one actuatorcan turn on at the time. Meanwhile, in the k-NN, thesystem made has higher accuracy than DNN. It cangive orders to turn on and off the several actuatorssimultaneously or gradually by the established rules.
Fig. 13. The actuator action sample.
110

Cite this article as: Herman, D. Adidrana, N. Surantha, and Suharjito, “Hydroponic Nutrient Control SystemBased on Internet of Things”, CommIT (Communication & Information Technology) Journal 13(2), 105–111,2019.
TABLE VTHE COMPARISON RESULT OF THE METHODS.
Method Advantage Disadvantage
k-NN
With optimal k, theaccuracy is high.
Need to experimentwith some k-value.
This system canturn on the actuatorsimultaneously.This system canturn off the actuatorsimultaneously orgradually.
DNN
The system can turnon the actuator si-multaneously.
The accuracy islower than thek-NN result.The system cannotturn off the actuatorgradually.
Fuzzy Logic High accuracy. The system cannotturn on the actuatorsimultaneously.
IV. CONCLUSION
This research is conducted to test the system de-sign using k-NN to classify nutrient conditions ona hydroponic system with IoT on a prototype scale.The evaluated system shows that k-NN successfullyclassifies the nutrient condition with several k-values.The classification result can be used in a real-timecondition and used as a command to the actuatormodule. The actuator also can turn on or off thenutrition controller simultaneously at a time accordingto the label that is classified. This system can be furtherdeveloped by making real planting to prove the successof the system and improving the accuracy value of thek-NN classification.
REFERENCES
[1] M. Roser, H. Ritchie, and E. Ortiz-Ospina. (2013) World population growth.[Online]. Available: https://ourworldindata.org/world-population-growth
[2] H. Ritchie and M. Roser. (2018) Urbanization.[Online]. Available: https://ourworldindata.org/urbanization
[3] K. Roberto, How-to hydroponics. New York:FutureGarden, Inc., 2003.
[4] D. Komaludin, “Penerapan teknologi Internet ofThing (IoT) pada bisnis budidaya tanaman hidro-ponik sebagai langkah efisiensi biaya perawatan,”Prosiding FRIMA (Festival Riset Ilmiah Manaje-men dan Akuntansi), no. 1, pp. 682–690, 2018.
[5] J. Felizardo, A. Halili, and J. Payuyao, “Auto-mated hydroponics system with pH and tem-perature control,” in 2nd Regional Conferenceon Campus Sustainability: Capacity Building
in Enhancing Campus Sustainability, UniversitiMalaysia Sabah, Kota Kinabalu, Malaysia, April7–8, 2015, pp. 259–273.
[6] K. Kularbphettong, U. Ampant, and N. Kon-grodj, “An automated hydroponics system basedon mobile application,” International Journal ofInformation and Education Technology, vol. 9,no. 8, pp. 548–552, 2019.
[7] M. Mehra, S. Saxena, S. Sankaranarayanan, R. J.Tom, and M. Veeramanikandan, “IoT based hy-droponics system using Deep Neural Networks,”Computers and Electronics in Agriculture, vol.155, no. December, pp. 473–486, 2018.
[8] Y. Shekhar, E. Dagur, S. Mishra, and S. Sankara-narayanan, “Intelligent IoT based automated irri-gation system,” International Journal of AppliedEngineering Research, vol. 12, no. 18, pp. 7306–7320, 2017.
[9] K. Syaliman, E. Nababan, and O. Sitompul, “Im-proving the accuracy of k-Nearest Neighbor usinglocal mean based and distance weight,” Journalof Physics: Conference Series, vol. 978, no. 1, p.012047, 2018.
[10] J. Sun, W. Du, and N. Shi, “A survey of kNNalgorithm,” vol. 1, no. 1, pp. 1–10, 2018.
[11] K. Ashwini, T. Nadu, J. J. Vedha, D. Diviya,and M. D. Priya, “Intelligent model for predictingwater quality,” International Journal of AdvanceResearch, Ideas and Innovations in Technology,vol. 5, no. 2, pp. 70–75, 2019.
[12] Herman and N. Surantha, “Intelligent monitoringand controlling system for hydroponics precisionagriculture,” in 2019 7th International Confer-ence on Information and Communication Tech-nology (ICoICT). Kuala Lumpur, Malaysia:IEEE, July 24–26, 2019, pp. 1–6.
[13] A. Thakare, P. Belhekar, P. Budhe, U. Shinde,and V. Waghmode, “Decision support system forsmart farming with hydroponic style,” Interna-tional Journal of Advanced Research in ComputerScience, vol. 9, no. 1, pp. 427–431, 2018.
[14] P. Mulak and N. Talhar, “Analysis of distancemeasures using k-Nearest Neighbor algorithm onKDD dataset,” International Journal of Scienceand Research, vol. 4, no. 7, pp. 2101–2104, 2015.
111