Embed Size (px)
Citation preview

HYO 5 ·10 HYDRAULICS BRANCH
tr1 OFFICIAL FIL E COPY
C '--->-:c
·· - i
.c-.1.v-=-ru-=-.cr-r--v:n-----r.1.~.1= JSE OF THE DEPARTMENT OF WATER RESOURCES STATE OF CALIFORNIA
UNITED ST ATES DEPARTMENT OF THE INTERIOR
BUREAU OF RECLAMATION
BUREAU OF RF.CV,HTTON' HYDRAULIC L.ABORATORY,
~ir-f1~r lH ~i.JL
WREN BOBBnww.p RETII:eU PROMPTLY,
HYDRAULIC MODEL STUDIES OF THE FLOOD CONTROL OUTLET AND SPILLWAY FOR OROVILLE DAM
CALIFORNIA DEPARTMENT OF WATER RESOURCES STATE OF CALIFORNIA
Report No. Hyd-510
liydraulics Branch DIVISION OF RESEARCH
OFFICE OF CHIEF ENGINEER DENVER, COLORADO
September 30, 1965
The information contained in this report may not be used in any publication, advertising, or other promotion in such a manner as to constitute an endorsement by the United States Government or the Bureau of Reclamation, either explicit or implicit, of any material, product, device, or process that may be referred to in the report.
r

""·· '\ . ··~.
_ _,,...:.>-.
I . . '
.
"'.
/ ·,(
,_.,_,·,·
\ ~'
l
.·-.:
... , -, ..
4 z
}
'\
PREFACE
Hydraulic model studies of features of Oroville Dam were conducted
in the Hydraulic Laboratory in Denver, Colorado. The studies were
made under Contract No. 14-06-D-3399 between the California Depart
ment of Water Resources and the Bureau of Reclamation.
The basic designs were conceived and prepared by the Department
of Water Resources engineers. Final designs were established
through model studies that verified the adequacy of the basic designs,
or led to modifications needed to obtain more satisfactory performance.
During the course of the studies, Messrs. R. A. Hill, Chairman of the
' board of consultants; and A. R. Golze, H. G. Dewey, Ir., E. W. Stroppini,
L. O. Tra.nstrum, G. W. Dukleth, and E. A. Menuez, of the California
Department of Water Resources staff visited the laboratory to observe
the tests and discuss model results. Mr. Dukleth served as liaison
officer between the Bureau and the Department during the first phase
of the testing program •

UNITED STATES DEPARTMENT OF THE INTERIOR
BUREAU OF RECLAMATION
OFF1CE OF CHIEF ENGINEER
IN REPLY REFER TO: D-293
BUILDING 53, DENVER FEDERAL CENTER
DENVER. COLORADO 80225
September 30, 1965
Mr. William E. Warne, Director Department of Water Resources State of California Post Office Box 388 Sacramento, California 9 5802
Dear Mr. Warne:
I am pleased to submit Hydraulics Branch Report No. Hyd-510 which constitutes our final report on studies conducted on the Flood Control Outlet and Spillway of Oroville Dam. I believe you will find this report interesting and informative, and that it will satisfy the requirements of your office for a comprehensive discussion of the extensive test program.
Enclosure
Sincerely yours,
B. P. Bellport Chief Engineer

:B :;:- .-rt}:::_ t~ t-! -. ~~~-ti ~r-.ri.~1-t) .. -}l())1?,3 TJ-'1 ~-,::lH i·· ·:::ii :p· -. f n~J,/::f;::;.i\ :::::;tiJ'~'
~Ql{,~-tf,~_..:I:::.:3~, ·::;tj UA3Pbl~
.... ·-
'\.::..;.~t~tA:)-.~~-~9:-;~~~"'Cl\ -_ ·
.JJ.1-c~cr~-:L:~~~ .~l1 . ·~ t:Try; ~,=.-~-rr ~ t?~i ~:r -I,? .t-rf:.:)
--::-·-·
.. ___ ~\. ~
CONTENTS
Page
ABSTRA.CT . . . . . . . . . . . . . . . . . . . • . . . vii PURPOSE. . . . . . . . . . . . . . . . . . . 1 CONCLUSIONS • . • • • • . • • . • • • . • 1 ACKNOWLEDGEMENT • • • • . • • • • • • . • • • . • • 5 INTRODUCTION . • • . • • • • • • • • • • • • • • • • • 5 PART !--COMBINED FLOOD CONTROL OUTLET AND
SPII.iLWAY. . . . . . . . . . . . . . . . . . . . . 7
The 1:78 Scale Model • • • The Investigation . • . • .
. . . . . . . . . . . . . . . . . . . . General . . . . . . . . . . . . . . . . . . . . Flood control outlet and spillway approach channel
flow . . . . . . . . . . . . . . . . . . . . .
7 8
8
8
Approach channel changes. • • • • • • • • • • • • 9 Approach flow velocity measurement . • . • • • 9
Flood control outlet flow. • • • . • • • . • • • 10 Spillway flow. • • . • • . • • • • • • • • • • • . • 10 Bellmouth pressures . . • • • • • • • • • • • • • • 10 Discharge rating . • • • . • • • • • • • • • • • • • 11 Chute apron . . • • • • • • • • • • • • • • • • • • 11
First outlet channel change • • • . . • . • • • • • 12 Second outlet channel change • • • • • • • • • • • 12 First spillway change. • • • • • • • • • • • • • • 13 Second spillway change • • • • • • • • • • • • • • 13 Third spill way change • • • • • • • • • • • • • • 14
PART II--1:48 MODEL STUDIES OF THE FLOOD CONI'ROL OlITLET. • • . • . . . . . . . . . . . . . .
The 1: 48 Scale Sectional Model . . . . . . . . The Investigation of the First Modification to
the Flood Control Outlet . . . . .
. . . . . . . . .
15 15
16
Without Wall of Symmetry • • • • • • • • • • • • • • . 16 With Wall of Symmetry. • • . . • • • . • • • • • • • • 16 Outlet Flow . . . . . . . . . . . . . . . . . . . _ . . 17 Changes in the Approach Channel • • • • • • • • • • • • 18
Approach channel sidewall transition • • . • • • • . • 18 Filled depression at dam . . • • • • • • • • • . • • 18 Vertical wall above outlet entrances • • • . • • • . • 18
i

CONTENTS--Continued
Pressures in Outlet • • • • • • • • • • . . . . . . . . Page
19
Pressures without wall of symmetry • • • • • • . • • 19 Pressures with wall of symmetry o • • • • • • • • • • 19 Pressures with vertical wall over entrances . • • • • • 20 Effect of gate closure • • • • . • • • • • . • . • • • 20
Discharge Rating • . • • . . • • • • • . • •
Investigation of the Second Modification to the Flood Control Outlet . . . . . . .
Approach Channel Flow • . • • • • • . • • • Outlet Flow . . . . . . . . . . . . . . . . . Design Changes • · o • • • • • • • • • • • • •
. . . . .
. . . . .
20
21
21 22 22
Vertical wall above outlet entrance • • • • . • • • • . 22 Pier extensions at the outlet entrance • . • • . • . • • 23 Revised approach topography. • • • • • . • • o • • • 24
Pressures in Bellmouth Entrance . • . Discharge Capacity . . . . . . . . .
e O O e e 8 0 • •
. . . . . . . . . Investigation of the Third Modification to
Flood Control Outlet {Recommended) . • . . . . . . . . . Flow in Approach Channel and Outlet • • • • Approach Channel Erosion . • • • • • • • • Outlet Pressures • • . • • . • • . • • • •
• • • 0 • • . . . . . . . . . . . .
Comparison to Corps of Engineers' data. • . • . Pressures for Bay 6 only operating. • • . • • • • • • Dynatnic pressures . • • • • • • • . o • • • • . . . Center pier pressure test . • . • • . • • • • •
Discharge Rating . . . • . • • • • 0 . . . . .
24 25
26
26 27 27
29 29 30 30
30
PART m--1:78 MODEL STUDIES OF THE FLOOD CONTROL OUTLET STRUCTURE . • • . . • . . . . . . • . . . . 32
The 1: 78 Scale Model. . . . . . . . . • . • . . . . . . . 32 The Investigation. . . . . . . . . • . . • . . • . . . . . 32
Flow in Approach Channel and Bellmouth Outlet. • • . . . 32
ii

CONTENTS- -Continued
Approach wall height . • . • • • • • • o • • •
Flow velocity in approach channel . • • . • • . Bellmouth pressures . • • • • • . . . Discharge capacity . • • . • . • • • • • • • •
. . . . . .
. . . . Outlet Chute . • . • • . • • • • Chute Flow Energy Dissipation •. . . . . . . . . .
. . . . . . . .
. .
Page
33 33 34 34
34 35
Initial design. . • • . • . • • • • . • • • . • • • • 36 Jump-type basin . . . . • • • • . • . . . . • . 36 Left riverbank excavation • • . • • • • • . . • • • . 36 Right riverbank excavation • • • • • . • • . • • • • 37 Plunge-type basin • . • . • • . . . . . . • 38 Flip buckets . • . • . • . • . • • • • • • . . • 39 Chute blocks • . . . . . . • • . • • . • . • • . 40 Chute end sill • • . . • • • . . • . . • • . 41 Basin size tests • • . • . • • • . . . . . • • • • • 42 Recommended chute blocks and stilling basin . • . • • 42 Chute block and sidewall pressure tests. • • . . • . • 42 Feather River erosion tests • • . • . • • • . . . • • 45 Tailwater interference . . • • • . • . • • 45
Bibliography · · · · · · · · · · . . . . 47
Figur~
Artist's Conception of Oroville Dam . • • • . • • . . Frontispiece Oroville Dam--Location Map • . . • • • . • . 1
Preliminary Design Outlet and Spill way
Oroville Spill way--General Arrangement. . . . . • • Oroville Spillway--Outlet Works and Spillway Gate
Structures . . . . . . . . . . . . . . . . . . . . . . The Flood Control Outlet and Spillway Model • • . • . • . Combined Discharge 650, 000 cfs • . • • . . . • Flow Approaching Outlet . • . . . • • • . . Flow Approaching Outlet with 110-foot Radius
WingwaJ.ls . . . . . . . . . . . . . . . . . . . Location of Velocity Measurements . . . . . . • • . • • Direction of Approach Flow for Use in Obtaining Velocity
Distribution . . . . . . . . . . . . . . . . . . . . . Velocity Traverses • . . . • . . . . . . . . . . • . . Velocity Profiles--250, 000-cfs Discharge Through Outlet
Only • • • • • • • e • • • • • • • • • • • • • • • •
iii
2
3 4 5 6
7 8
9 10
11

CONTENTS--Contmued
Velocity Profiles--150, 000-cfs Discharge Through Outlet Only . . . . . . . . . . . . . . . . . . .
Operation of Flood Control Outlet • • . • . • • • . • • . Pressures m Bellmouth Outlet . • . . • . . • . • • • . Discharge Ratmg. • . • . . . . . . • • • . • Outlet Discharge Coefficients . • • • • • • • . • • • • • Prelimmary Outlet and Spillway Apron. • . • • • • • • . Flow m Prelimmary Outlet and Spillway Apron •••••• First Change to Outlet and Spill way Apron • • • • • • • • Flow on Apron with First Change . . . . • • . • • • • • Second Change to Outlet and Spill way Apron • . . • . • . • Flow on Apron with Second Change . . • • • • • • . • • • Third Change to Outlet and Spill way Apron • . • . . • Flow on Apron with Third Change • • • • • • • • • • . •
First Modification of Outlet
Oroville Spillway Model Study Location and Layout of Facilities . . . . . . . . . . . . . . . . . . . . . .
Oroville Spill way Model Study--Approach· Channel and Flood Control Outlet--General Arrangement. • • . • • •
Oroville Spillway Model Study--Flood-Control Outlet Section a.rid Details. . . . . . . . . . . . . . . . . . . . . .
1: 48 Scale Sectional Model . • • • • . . • • • . • • . • The Model without the Wall of Symmetry--Three-b~y
Operation . . . . . . . . . . . . . . . . . . . . Approach and Downstream Flow Conditions • • • • • . • . Outlet Entrance Flow Conditions • • • • . . . . . . . . • Changes to Outlet Entrance Area • . • • . . . • • . . • Vertical Wall above Outlet Entrance • . . • . • . • • . • Piezometer Locations on the Roof and Piers of the
Bellmouth Outlet . . • • • • • • • . . • . . • • • • • Bellmouth Pressures. . • • • • • • • • • . . • . • • • Bellmouth Pressures Versus Gate Closure • • • . • • • . Discharge Capacity. • • . • • • • • • • . • • • . • • • Coefficient Curve--Full Gate Openmg • • • . . •
Second Modification of Outlet
Oroville Spillway Model Study--Approach Channel and Flood Control Outlet--General Arrangement. . • • • . . . . .
Oroville Spillway Model Study--Flood Control Outlet Section 8lld Details. . . . . . . . . . . . . . . . . . . . . .
The 1: 48 Scale Sectional Model . • • • • • 0 • • • • • •
iv
Figure
12 13 14 15 16 17 18 19 20 21 22 23 24
25
26
27 28
29 30 31 32 33
34 35 36 37 38
39
40 41

CONTENTS--Continued
Flow at Entrance and Exit .. • . . . . • . . • • . . • . . Effect of Vertical Wall above Outlet Entrances . • . . Test of Pier Extensions at the Outlet Entrances • . . . • . RevisedApproachTopography •.•••••.••.••• BellmouthPressures .••••.••..••••..•• Bellmouth Pressures with 15-foot Vertical Wall . • • • Discharge Capacity . • . . • • • • • • • • . • . • • • • Discharge Operation Curve. . • . • • • . • • • • • • • • Coefficient of Discharge--Full Open Gates. • • • • . • • .
Third Modification of Outlet
Oroville Spillway Model Study--Location and Layout of Facilities . . . . . . . . . . . . . . . . . . . . . . .
Oroville Spillway Outlet Works--Details. • • • • • • • • . The h48 Scale Sectional Model • . . • • . • . . . • • • . Flow ·in Approach Channel . . . . • • • • • • . • • • . • Approach Channel and Downstream Flow--150, 000-cfs
Discharge. . . . . . . . . . . . . . . . . . . . . Approach Channel and Downstream Flow--277, 000-cfs
Discharge. . . . . . . . . . . . . . . . . . . . Approach Channel Erosion . . . • • • • . . . . . . . • . Piezomet-er Location Plan . . . . • . . . . . . . . . • . Bellmouth Outlet Pressures--Discharge 277, 000 cfs . . . . Bellmouth Pressures • . • • . . . . • . . . . Bellmouth Pressure Comparison to U.S. Corps of
Engineers Data • • . . • . . . . . • . • . • • . Piezometer Pressures--Only Bay 6 Operating ..•. Dynamic Pressure Records . . . . . . . . . • . Summary of Dynamic Pressures on Bellmouth Roof. • . Pressures on 5- and 8-foot-wide Piers . . . . . . • • Discharge Rating • . • . . • . . . . . . . . . . • • • . Discharge Capacity . . . . . • . • . • . . . . . . • . . Coefficient of Discharge--F'u.11 Open Gates.
· Recommended Design Outlet
Flood Control Outlet--General Arrangement Elevation arid Sections. . . . . . . . . . . . . . . . . . . .
The 1:78 Scale Model • . . • . . • . . • • • • Flow at Outlet Structure . • • • . . . . . . . . . Bellmouth Entrances • • . • • . . • • • . . • . . Flow with and without Approach Wall Extension on
Left Side . . . . . . . . . . . . . . . . . . . .
V
Figure
42 43 44 45 46 47 48 49 50
51 52 53 54
55
56 57 58 59 60
61 62 63 64 65 66 67 68
69 70 71 72
73

CONTENTS--Contmued
Flow with and without Approach Wall Extension on Right Side . . . . . . . . . . . . . . . .
Log Boom. . . . . . . . . . . . . . . . . . . . . . . Velocity Traverses. . . . . . . . . . . . . . . . . . . Velocity Traverse . . . . . . . . . • . . . • . . . . . Vertical Velocity Profiles m Approach Channel . . Comparison of Bellmouth Pressures . . . . . . . . Chute Flow Downstream from Outlet Bays . • . . Flow in Chute . . . . . . . . . . . . . . . . . . . Water Surface Profiles at Chute Sidewalls Initial Chute and Flip Bucket . . . . . . . . . . . . . . Flow in River from Initial Flip Bucket . . . . . . . . . . Flow with Straight Chute and Left Bank Excavation. . . Flow with Left Bank Excavation . . . . . . . . . . . . . Flow with Curved Excavation m Left Bank . . . • . Flow m Basm with Trajectory Apron ~t End of Chute. Flip Bucket and Chute Blocks for Flow Dispersion. . . • • Arrangements Tested for Flow Dispersion . • . . . . Proposed Chute Blocks and Excavation at End of Chute . . . Chute Plan, Profile and Typical Sections . . . . . . Termmal Structure. . . . . . . . . • . . . . . . • The Recommended Chute Blocks and Plunge Basin . . . . . Operation of Recommended Chute Blocks and Plunge
Basin . . . . . . . . . . . . . . . . . . . . . . Location of Chute Block and Sidewall Piezometers Plan
arid Sections . . . . . . . . . . . . . . . . . . . Chute Block Pressures, Blocks No. 1 and 4. . . . . . . . Chute Block Pressures . . . . . . . . . . . • . . . . . Effect of Aeration on Pressures at Corner of Chute Block . Modified Chute Blocks--Recommended. . . • . . . . . . Pressures on Modified Block . . . . . . . . . . . • . . Recommended Chute Block . . . . . . . . . . . . • • . Chute Block Pressures--Blocks No. 2 and 3 • • • • • • • Chute Block Pressures for Various Corner End Heights •. Sidewall Pressures. . . . . . . • . . . . . . • • . • . Flow and Erosion m River with Wall on Left Bank .•. Sedimentation Due to Erosion Along Left Bank. . . . •
vi
Figure
74 75 76 77 78 79 80 81 82 83 84 85 86 87 88 89 90 91 92 93 94
95
96 97 98 99
100 i
101 102 103 104 105 106 107
ABSTRACT
The initial combined flood control outlet and spillway for Oroville Dam, in which the flow from the bays converged rapidly into a narrow lined chute, did not operate satisfactorily on a 1:78 scale overall hydraulic model, so various changes were studied and an arrangement of separate structures was approved. Tests on the 1:78 model of the approach channel, flood control outlet, gated spillway, chute, and river channel showed other flow conditions were excellent. The structure was redesigned as separate flood control outlet and emergency spillway, and the outlet was then studied on a 1:48 sectional model and the 1:78 model. The outlet was designed for a normal discharge capacity of 250, 000 cfs at reservoir el 900. Energy dissipation of the outlet flow was accomplished by dispersing the flow with four 23- x 44-ft wedge-shaped chute blocks. This dispersed flow landed in a large plunge pool excavated in the right bank of the Feather River. Subatmospheric pressures at small areas of the blocks were eliminated by aeration and a slight reshaping of the· block corners. Pressures on the bellmouth entrance surfaces were subatmospheric near the upstream end, but a more gradually curved bellmouth raised the pressures. Studies showed that if the flood control outlet was contained in a gravity dam section rather than the preliminary slab and buttress section, the vertical face of the gravity section greatly reduced vortex action and turbulence in the approach flow.
DESCRIPTORS-- control structures/ converging sections/ aprons/ turbulent flow/ cavitation/ discharge coefficients/ water surface profiles/ research and development/ negative pressures/ erosion/ *flood control/ air demand/ flow control/ aeration/ head losses/ hydraulic models/ model tests/ eddies/ *outlet works/ vortices/ hydrostatic pressures/ *stilling basins/ velocity distribution/ flip buckets/ *spillways/ training walls/ turbulent flow IDENTIFIERS-- California/ Oroville Dam/ *bellmouth entrances/ *chute blocks/ hydraulic design/ approach channels/ flow dispersion/ converging flow
vii

UNITED STATES DEPARTMENT OF THE INTERIOR
BUREAU OF RECLAMATION
Office of Chief Engineer Division of Research Hydraulics Branch Denver, Colorado September 30, 1965
Report No. Hyd-510 Authors: T. J. Rhone
W. F. Arris Reviewed by: W. E. Wagner Submitted by: H. M. Martin
Subject: Hydraulic model studies of the flood control outlet and spillway for Orovilie Dam--California Department of Water Resources, State of California
PURPOSE
The hydraulic model investigation described in this report was conducted to study the adequacy and hydraulic performance of the flood control outlet structure and spillway, including the approach channel, outlets, chute, energy dissipator, and river channel in the vicinity of the chute terminal structure.
CONCLUSIONS
Part I--The Combined Flood Control Outlet and Spillway
1. Flow in the spillway and outlet approaches was very good, but turbulence at the pier noses caused flow impingement on the radial gate counterweights, Figure 5.
2. The amount of excavation in the spillway approaches could be reduced by approximately 30 percent without adversely affecting the spillway flow conditions.
3. Curved wingwalls improved· the flow at the outlet entrances, Figure 7.
4. Flow in the approaches was well distributed as indicated by velocity measurements, Figures 10, 11, and 12.
5. Flow impingement on the counterweights of the outside outlet gates, when the outlets only were operating could be prevented by opening the spillway gates adjacent to the outlets a small amount.
6. Pressures on the bellmouth surfaces of the outlets were satisfactory, Figure 14.

7. The discharge capacity of the outlets was as much as 17 percent less, and the spillway capacity was slightly greater than the design computations, Figure 15.
8. Flow with the outlets only operating overtopped the sides of the center channel and occasionally overtopped the sidewalls of the chute, Figure 17.
9. Merging of the spillway and outlet flows in the center channel was unsatisfactory; consequently, flow conditions in the chute were poor, Figure 18.
10. Lowering the floor of the center channel improved the flow conditions for all discharge combinations but this solution would require extensive rock excavation and costly concrete lining.
11. Increasing the rate of convergence of the outside walls caused the spillway flow to concentrate on either side of the outlet flow, resulting in excessive f:tplashing and spray and overtopping of the chute sidewalls, Figures 19 through 24.
12. This phase of the studies indicated that the combined spillwayflood control outlet could not be readily adapted to discharge into a narrow lined channel.
Part II--1:48 Model Studies of the Flood Control Outlet
13. Unsymmetrical operation caused severe drawdown and turbulence at the entrances of the operating conduits.
14. Symmetrical flows in the approach channel were smooth for discharges up to 200, 000 cfs.
15. A severe contraction occurred at the end pier for uncontrolled discharges up to 125,000 cfs, before the entrances submerged. After submergence there was severe surging and turbulence of the water surface, Figure 31; vortices formed over the entrances for discharges up to 200,000 cfs; above 200J. 000 cfs excellent flow conditions existed at the entrance, Figure ;:sO.
16. Flow emerging from the outlets at 100 percent gate opening became separated from the roofs because of the excessive curvature of the bellmouth roof, Figure 33. This flow separation could be prevented by slightly closing the gates.
17. Modifications to the approach, such as warped approach walls and earthfills at the dam, did not improve the flow conditions sufficiently to warrant their use, Figure 32.
2

18. Vertical walls above the entrances reduced the turbulence and vortex action and eliminated the flow separation in all except the end bay. A 14-foot-high wall was necessary to improve flow conditions, Figure 33.
19. Pressures on the bellmouth roof and on the piers were near or above atmospheric for discharges up to 150,000 cfs. At near maximum discharges, pressures as low as vapor pressure were indicated in the top right corner of the end bay, Figure 35. The 14-foot-high vertical wall improved the pressures in the bellmouth entrances, but 4 feet of gate closure was necessary to raise all pressures to atmospheric, Figure 36.
20. Calibration of the outlet structure indicated that the maximum discharge (277, 000 cfs) would be obtained at the design reservoir elevation of 91 7, Figure 37.
21. Replacing the buttress dam on either side of the outlets with a gravity dam, Figure 41, increased the surging and vortex action over the entrances, Figure 42.
22. A vertical wall over the entrances extending to the water surface eliminated the large vortices, but flow around the end of the wall created some turbulence and eddying, Figure 43; curved wingwalls slightly reduced these eddies.
23. Pier extensions on top of the sloping buttress roof and in front of the entrances did not improve the flow, Figure 44; neither was the approach flow improved by excavating the hillside along the right side of the approach channel, Figure 45.
24. Severely subatmospheric pressures were measured in the center and right corner of the bellmouth roof of Bay 7 at discharges above 260, 000 cfs, Figure 46; 10 percent gate closure raised the pressures to atmospheric. The vertical wall or pier extensions did not improve the pressures, Figure 47.
25. The discharge capacity of the structure was about 5 percent greater than that of the previous arrangement, Figure 48.
26. Placing the outlets in a gravity dam section, Figure 52, improved the flow conditions at the entrance, Figures 54 to 56.
27. There was a tendency for the channel floor to erode upstream from the entrances. The model indicated that this erosion would be 4 to 7 feet deep and extend about 50 feet upstream along the right side of the approach channel, Figure 57. Later study on the 1: 78 scale model showed similar erosion.
3

28. Slightly improved pressures were measured in the more gradual bellmouth roof of this modification, Figure 59, but vapor pressures were noted in a small region in the left side and near the upstream end · of the roof of Bay 8. These pressures could be raised to near atmospheric by closing the gate 9 inches, Figure 60. Pressures along the sides of the piers were satisfactory.
29. The discharge capacity of this structure was about 3 percent higher than that of the previous arrangement, Figure 66. The 277, 000-cfs discharge could be obtained at reservoir elevation 908, Figure 67.
Part m--Approved Flood Control Outlets, 1:78 Scale Studies
30. Flow approaching the entrances was well distributed and very smooth, Figure 71.
31. At 277, 000 cfs a 20-foot-diameter vortex formed over the entrance of Bays 1 and 2, Figure 73. This vortex could be nearly eliminated by increasing the height of the left approach wall to elevation 907. A similar increase to the right wall created poor flow conditions on the right side, Figure 7 4.
32. The maximum average velocity in the approach channel, for 150,000 cfs was about 8. 4 feet per second, Figure 76.
33. Bellmouth pressures in the 1:78 model compared favorably with the pressures in the 1:48 sectional model, Figure 79. The discharge capacity of the 1:78 model was within 1. 4 percent of the quantities measured with the 1: 48 model.
34. The flow in the chute was very smooth at all discharges, Figure 80. However, the 277, 000-cfs discharge overtopped the chute sidewalls, Figure 81, indicating that the walls should be raised about 2 feet in height.
35. Flow from the original flip bucket crossed·the river and traveled up the far bank, reaching a height of 170 feet above the river water surface, Figure 84.
36. Extending the chute to a point near the rive:r, entailed a large amount of excavation but resulted in better energy dissipation, Figure 85.
37. An extensive excavation in the left bank, opposite the chute, did not improve the energy dissipation sufficiently to warrant the additional excavation, Figures 86 and 87.
38. A deep excavation, to elevation 140, in the right bank at the end of the chute improved the flow conditions, Figure 88, but it was considered impractical to excavate below elevation 175. Ten- to twenty-foot-high sills at the end of the excavated basin greatly increased the energy dissipation.
4

39. Different types of flip buckets on the chute, Figures 89 and 90, used in conjunction with the excavation in the right bank resulted in fair energy dissipation.
40. Four wedge-shaped blocks, about 23 feet high by 44 feet long by 10 feet wide, placed at an 18° angle with the centerline of the chute were recommended for the prototype, Figures 91, 92, and 93.
41. Small areas of subatmospheric pressures in and near the chute blocks were eliminated by special treatment at the upstream end of the blocks near the invert and at the downstream corner of the side facing the flow, Figures 100 and 102. There_ was no air demand at air vents on the downstream sides of the blocks.
42. A wall on the left bank of the river opposite the chute reduced the eddy in the river, Figure 106; however, severe erosion occurred at the end of the wall.
43. The overburden moved by the impingement of the chute flow on the left bank will form an extensive deposit that could extend across the river and adversely affect the powerplant tailrace water surface elevation, Figure 107.
ACKNOWLEDGMENT
The study described in this report was accomplished through cooperation between the Department of Water Resources, State of California, and the Hydraulics Branch, Division of Research, Bureau of Reclamation. Photography was by Mr. W. M. Batts, Office Services Branch, Bureau of Reclamation.
INTRODUCTION
Oroville Dam is the principal structure of the multipurpose Oroville Division of the State Water Facilities. This composite structure is a major feature of the California Water Plan being accomplished by the Department of Water Resources, State of California. The 770-foothigh, 6, 800-foot-long earthfill dam is being built across the Feather River about 5 miles upstream from Oroville, California, Figure 1. The dam will create a reservoir with a capacity of 3, 484, 000 acre-feet. The principal hydraulic features of the dam are the flood control outlets and spill way described in this report. Discussions of model studies on other hydraulic features at the dam have been reported in other laboratory reports.1/, Y, ~/, ii, QI, and 6/
l7Nu.mbers refer to references at the end of this report.
5
In the early stages of design, the control structure at Oroville Dam consis_ted of a flood control outlet structure flanked on either side by a 234-foot-wide overfall spillway. A 400-foot-long concrete apron downstream from the structure converged the flow into an excavated pilot channel leading to the Feather River. This concept was subsequently changed by the addition of a 150-foot-wide concrete-lined chute extending directly downstream from the flood control outlets to the river, a drop of about 550 feet in a distance of about 3, 000 feet. The converging training walls of the spill way directed the spillway flow into the concrete-lined chute, which was designed to carry the flood control outlet discharge of 250, 000 cfs; the infrequent spillway flows were expected to overtop the lined chute.
Because the flood control complex was basically designed to discharge into a wide unlined channel, hydraulic model studies were initiated to determine whether the flows from the spillways would satisfactorily merge with flows from the center flood control outlets into the comparatively narrow lined channel.
The model studies indicated that a practicable method of combining the spillway and flood control outlet flow into the narrow lined channel was not apparent. Consequently, the Department of Water Resources proposed a new concept that separated the spillway into two distinct structures, the flood control outlet and the emergency spill way. . ·
The original combined flood control outlet was investigated with a 1:78 scale model.. The flood control outlet for the second concept, and its subsequent modifications, was tested in both a 1:48 scale sectional model and a 1:78 scale overall model. The emergency spillway in the second design concept was not included in the model studies.
The results of the investigation will be reported in the order in which they were studied; Part I contains the results of the original combined spillway-flood control outlets study; Part II reports the results of the 1:48 scale sectional model investigations of the flood control outlets; and Part m contains the studies of the flood control outlets on the overall 1:78 scale model.
6

PART I--COMBINED FLOOD CONTROL OUTLET AND SPILLWAY
The Oroville Dam spillway, as initially tested by the Bureau of Reclamation, consisted of a flood control outlet section, flanked by two overfall spillway sections, Figure 2. Flow converged from the 623-foot width of the three sections to a 150-foot-wide chute in a distance of 1, 186 feet. The chute, 1, 988 feet in length, terminated in a flip bucket that directed the flow into the Feather River, approximately 600 feet below the maximum reservoir elevation. Tne overflow structure and chute followed closely the contours of the natural topography. The flood control outlets included five 27 - by 34-foot bays separated by 12-foot-wide piers; flow through each bay was controlled by top seal radial gates, Figure 3. The invert of the outlets was at elevation 813. 6. The spillway crest was at elevation 868. 0. Flow over each spillway section was controlled by four 47. 5- by 32-foot automatically operated radial gates. The flood control outlet was designed to pass a discharge of 250, 000 cf s at the normal reservoir water surface elevation 900. At the same reservoir elevation, the spillway was designed to pass 260,000 cfs. The maximum combined design discharge was 650, 000 cfs at reservoir elevation 909. 3.
The testing program for this structure was stopped when the California Department of Water Resources decided that the design could not readily be adapted for use in a concrete-lined chute.
The 1:78 Scale Model
The 1:78 scale model representing the Oroville Dam spillway contained the eight bays of the overfall spillway, the five bays of the flood control outlets, the excavated approach channels, and about 1, 300 by 2, 000 feet of the surrounding reservoir topography. The converging transition apron, sloping chute, and flip bucket downstream from the gated spill way and flood control outlets were also modeled, Figure 4. Construction of approximately 3, 000 feet of the Feather River bed downstream from the sloping channel was started but not finished before the design concept was changed.
Water was supplied to the model reservoir through a 12-inch-diameter pipe connected directly to the permanent laboratory water-supply system.The flow was stilled by passing it through a 6-inch-thick rock baffle. Model discharges were measured by venturi meters permanently installedin the laboratory. Powerplant discharge into the Feather River was simulated by a separate portable centrifugal pump discharging through a calibrated venturi meter.
The reservoir topography and approach channels were formed in concrete. The spillway crests and flood control outlet floor were constructed of
7

concrete screeded to sheet metal templates. The piers were made of wood treated to resist swelling. The bellmouth roof and radial gates were made from galvanized sheet steel. The transition apron, chute, and flip bucket were made of wood.
Reservoir elevations were measured by means of a hook gage installed in a stilling well with an inlet located approximately 4 feet downstream from the rock baffle and about 1 foot to the right of the right edge of the approach channel.
Pressure measurements were made on the flood control outlet bellmouths by means of piezometers connected to open-tube manometers.
The Investigation
General
The investigations were concerned with: (1) flow in the approach channel to the outlet and spillway; (2) flow entering the bellmouth entrances; (3) the pressure conditions and discharge capacity of the outlets; (4) flow emerging from the outlets; and (5) flow through the overfall spillway merging with the outlet flow in the lined chute.
No studies were made of the part of the structure downstream from the confluence of spillway and outlet flows.
Flood Control Outlet and Spillway Approach Channel Flow
Initial model operation showed generally good flow conditions in the approach channel, Figure 5. The broad excavated approaches to the overfall spillways provided ample flow area, even for the maximum combined discharge of ·550, 000 cfs. Although no excessive drawdown occurred around any of the piers, the flow surface was rough between the piers due to turbulence around the pier noses. This surface roughness caused the flow to impinge on the gate counterweights mainly in the end spillway bays.
When the discharge through the flood control outlet was greater than that through the spillways, some drawdown and turbulence occurred in front of the intermediate piers and u:pstream along the edges of the spillway approach channel. The flow over the edges of the spillway approach channel caused drawdown and eddying to extend about 50 feet upstream from the pier noses. Because of the lower natural topography on the right side of the spillway approach, a greater portion of the flow came from that side and increased the turbulence and drawdown in the right outlet.
Flow in the approach channel to the outlet was very smooth when only the flood control outlet was operating at 250, 000 cfs, reservoir elevation 900,
8

Figure 6. A water-surface drawdown of 7 to 8 feet occurred at the right inter':mediate pier, and 4 to 5 feet at the left intermediate pier. The drawdown was considerably reduced if the spillway bays adjacent to the intermediate piers were fully opened. At all times, some eddying was observed just upstream from the flood control outlets, and vortices periodically formed. These disturbances carried down through the outlets and caused the flow to impinge on the gate trunnion in the end bays.
Apruoach channel changes. --The extremely smooth flow over the sp~ way approaches indicated that the approach channel might be overexcavated. To determine what effect a lesser amount of chan-nel excavation would have on the approach flow, the natural topography was restored to within 800 feet of the spillway crest. This reduction in excavation did not adversely affect the flow appearance in the approach channel for outlet, spillway or combined operation.
Two types of wingwalls were tested to reduce the turbulence at the intermediate piers which occurred when the outlet operated separately. The walls were attached to the intermediate piers, and the first extended 195 feet upstream along the berm edge, and termi-nated in a 110-foot radius quarter circle. The 110-foot radius quarter circle connected directly to the intermediate piers, without the long extension was also tested. The latter wall created the best flow, Figure 7, but either wall improved the flow at the intermediate piers.
Approach flow velocity measurement. --A velocity traverse for a combined flow of 626,000 cfs was taken at Station 10+71. 50, 50 feet upstream from the pier noses in the approach channels of the outlet and spillways. Vertical velocity profiles for outlet discharges of 150, 000 and 250, 000 cfs at reservoir water surface elevation 900 feet were taken in the outlet approach channel at 15-foot intervals along Stations 10+71. 50 and 10+11. 50, Figure 8. Dye traces were used to properly orient the directional flowmeter at each position. The dye was fed into a copper tube which had holes drilled every 0. 3 foot along one side, Figure 9. The tube was placed upstream from the location of measurement and the meter was oriented according to the dye traces which emitted from the holes.
The flow velocity at 625, 000-cf s combined discharge was quite uniform across most of the approach channel, Figure 10. The velocities were higher near the outside edges of the spill way approaches due to the reservoir topographv. The velocities across the approach channel to the outlets were slightly lower than those in the spillway approaches.
The vertical velocity profiles showed an even distribution of flow across the flood control outlet approach channel. The velocity 110 feet upstream from the pier noses (Station 10+11. 50) was very uniform with a maximum variation of less than 2 fps at 250, 000-cfs
9

.,.r-
discharge; the velocity 50 feet upstream (Station 10+71. 50) had a maximum variation of about 6 fps, Figure 11. The maximum variation in velocity for 150, 000-cfs discharge was about 3 fps at Station 10+71. 50, Figure 12. The vertical velocity distribution was also very uniform, except at each side of the outlet channel where the flow over the channel sidewalls caused some disturbance.
Flood Control Outlet Flow
The outlets were operated separately with the spillway gates closed. As the reservoir water surface rose, all bays did not submerge at the same time. The water surfa:ce first touched the end bay roofs; when the end bays submerged, severe drawdown and vortex action occurred in the adjacent bays. Bays 2 and 4 were the last to submerge. There was much turbulence around the right intermediate pier anc;i ·the pier adjacent to it. This irregular flow condition caused high surface ridges in the flow which impinged on the gate trunnions in the end bays, Figure 13. Opening of the spillway gates a small amount reduced the turbulence at the outlet entrances and smoothed the .flow emerging from the outlets.
High fins of water formed just downstream from the flood control outlet piers where flow from adjacent outlets met. The size of the fins could be reduced by streamlining the downstream ends of the piers.
Spillway Flow
Generally, the flow over the spillway crest was very smooth. The drawdown around the piers at maximum discharge created a fin of water against the pier sides which impinged on the gate counterweights. This was most severe at the extreme left and right ends of the spillway, but was present to some extent in all bays. During the combined maximum discharge of 625, 000 cfs, the water surface of the spill way flow was about :s feet higher than the flood control outlet water surface at the downstream end of the intermediate piers. The difference in water surface levels caused the spill way flow to drop laterally around the intermediate piers into the lower flood control outlet channel· causing ·splashing and turbulence in the outlet flow.
Bellmouth Pressures
Eleven rows of four piezometers each were installed in the pier walls and bellmouth roof of the flood control outlets, Figure 14. Adjacent rows were located in the roof and walls along both top corners of Bay 5 and along the top right corner of Bay 3. Three rows were placed at elevation 830. 13 feet or midway between the floor and bellmouth roof on the left side of Piers 4 and 6 and the right side of Pier 5. Two rows were placed along the roof at the centerlines of Bays 3 and 5. These locations
10

were chosen as critical or representative pressure areas within the structure.
Pressures were recorded for outlet discharges of about 170, 000, 200,000, and 240,000 cfs, and no flow through the spillway. The lowest observed pressures, about 7 feet of water below atmospheric, were at the top left side of Pier 6, Figure 14. An area at the right side of Bay 3 roof also reached a subatmospheric pressure of about 3 feet. All other pressures were either near or above atmospherjc. All pressures were well above the cavitation range and should have had no adverse effect on the performance of the structure.
Discharge Rating
A calibration of the model indicated that the discharge capacity of the flood control outlets was lower than expected, Figure 15. This deficiency in discharge existed for all reservoir elevations above 850 and was as much as 17 percent at reservoir elevation 865. A rerouting of the design flood, however, indicated that the reservoir elevation would be increased only 0. 25 foot above that shown for the computed curve used to route the design flood. The model also showed that the spillway capacity was slightly lower than the computed value.
The combined outlet and spill way operating curve, as determined from the model, showed a sharp upswing at about 575, 000-cfs discharge. 'Th.is- sudden change in the capacity curve was probably due to back pressure caused by the flow impinging on the radial gate counterweights.
A coefficient of discharge curve for the flood confrol outlet operating with outlet gates fully open and the spillway gates closed, is shown on Figure 16.
Chute Apror1
Flow from the spillway and flood control outlet discharged onto a converging concrete-lined apron. The portion of the flow from the centrally located flood control outlet discharged into a depressed 183-footwide channel section of the apron that converged to the 150-foot-wide chute in a length of about 1,200 feet. The two spillway sections, one on either side of the outlet, discharged onto apron sections that were about 33. 4 feet higher than the invert of the outlet apron. The sidewalls of the spillway aprons also converged to the 150-foot-wide chute, and the invertssloped downward until they were about 10 feet higher than the outlet invert,at the upstream end of the chute, Figure 17.
Initial tests indicated that the principal problem was to converge a 610-foot-wide sheet of supercritical flow into a 150-foot-wide chute within a sufficiently short transition to be economically feasible. Flow conditions
11

were satisfactory when the outlet discharges were contained within the center portion of the channel. However, about 400 feet downstream from the outlets the flow overtopped the sides of the center channel at 250, 000-cfs outlet discharge, spread laterally across the two outside (or spillway) portions of the apron and impinged on the apron sidewalls, Figure 17. This caused considerable turbulence, pileup, and occasional overtopping of the chute sidewalls. The turbulence transmitted a large diamond pattern on the flow surface throughout the downstream chute. Greater turbulence and upset flow conditions occurred when spillway flows were added to the outlet flow. The spill way flow spread toward the center and passed over the outlet flow. The convergence of these two flows formed high fins of water which, at 620, 000-cfs combined flow, overtopped the apron sidewalls just upstream from the beginning of the 150-foot-wide chute and extending downstream for a distance of several hundred feet, Figure 18. These flow conditions indicated that major changes were necessary to create satisfactory flow conditions for outlet, spillway, and combined outlet and spillway discharges.
First outlet channel change. --Discharges up to 250, 000 cfs would be most frequently encountered through the flood control outlet. Changes were made in attempts to confine this discharge in the center channel and still have reasonably acceptable flow conditions when the spill ways were placed in operation. To accomplish this, the floor of the center or outlet section of the apron was arbitrarily lowered as far as possible against the model box floor. This lowered section .extended from the piers (Station 12+25. 63) to the 150-foot-wide chute (Station 24+12. 07) and sloped to the original floor between Stations 24+12. 07 and 29+00. The maximum outlet discharge (2501 000 cfs) was completely contained in the revised center section and the flow was smooth throughout the apron and chute. The spillway flow merged with the outlet flow without creating excessive turbulence or overtopping. However, the lowered center section would require a large amount of rock excavation and costly lining in the prototype so it was considered an uneconomical design.
Second outlet channel change. --A design containing discharges up to 150, 000 cfs in the center section was next tested. Water surface profiles for the outlet discharge of 150, 000 cfs was marked on the vertical sides of the center section, and the center floor was raised the amount of the difference between the 150, 000-cfs water surface profile and the top of the spillway side aprons.
Discharges up to and including 150,000 cfs at reservoir water surface elevation 900 were very smooth. When the outlet discharge was raised to 250, 000 cfs, the flow spread as in the initial design, hit the sidewalls and again caused turbulence and waves in the chute. When the spillway discharge was added to the outlet flow, the combined flows again caused extreme turbulence and splashing in the chute and overtopping the sidewalls.
12
First spillway change. --It seemed that turbulence and overtopping in the apron and chute might be reduced jf the flows could be made to converge at a lower velocity. This might be accomplished by merging the flows before the velocity became too great. Jn the initial design the angle that the spill way crest axis made with the outlet was 11 ° 26 '. The effect of increasing this angle was accomplished by increasing the angle of convergence of the sidewalls. To merge the spillway and outlet flows more rapidly, three changes were made which increased this angle.
The first change included sidewalls that converged on the center channel at an angle of 25° and extended from the end spillway piers at Station 12+05. 86 to the outlet portion of the apron 450 feet downstream. Guide vanes were placed at the ends of the spillway piers to train the flow in the direction of the sidewalls, Figure 19.
The maximum flood control outlet discharge of 250, 000 cfs started to overtop the raised spillway apron at about Station 15+20 but only a very small amount reached the sidewalls. The flow was fairly smooth with only minor turbulence and no- overtopping of the sidewalls, Figure 19.
A total discharge of 250,000 cfs (150,000 cfs through the outlet and 50,000 cfs through each spillway section) was tested next. The higher velocity of the spillway flow was sufficient to cause considerable splashing and turbulence when it merged with the outlet flow, Figure 20. The water converging from either side created a ridge of flow about 30 feet high on either side of the center channel. A diamond pattern with 5- to 10-foot-high fins of water formed on the chute. However, no overtopping of the sidewalls occurred.
A total discharge of 620, 000 cfs (250,000 cfs through the outlet and 185,000 cfs through each section of the spillway) caused flow conditions which were very similar. Ridges of flow in the center channel reached a 60-foot height. Water from the ridges folded over on top of the spillway flows and formed large fins which overtopped the sidewalls at the end of the converging section, Figure 20. The flow also overtopped the downstream chute walls at several points. Flow conditions were generally inferior to those of the initial design; however, the test did indicate that it might be possible to transition the flow into the narrow chute.
Second spillway chan~e. --The angle of convergence of the sidewalls was changed from 25 to 16°. The sidewalls were extended to the walls of the center channel, 780 feet downstream from the end of the outlet piers, Figure 21. The invert of the apron was the same as in the initial design. The flow, with the maximum outlet discharge of 250, 000 cfs, spread onto the spillway apron about 300 feet downstream
13

· from the outlet exit and struck the apron sidewalls about 200 feet farther downstream, Figure 21. The flow had sufficient force to create a 20-foot-high fin of water when it struck the sidewall. Twenty-five-foot-high waves formed in the main channel downstream from the point of intersection.
The flow with the combined outlet and spillway discharge of 250,000 cfs was generally very good, Figure 22. The spillway flow was smooth; when it merged with the outlet flow, a pileup occurred at about Station 16+00, but the sidewalls were not overtopped. The maximum combined discharge of 620,000 cfs formed the same general flow pattern, but the ridge of water was 50 feet high and slightly upstream, Figure 22. Two similar side flow concentrations formed and spilled over the curved sidewalls of the transitions with a steady full stream. Overtopping also occurred at several places farther down the chute. The extreme overtopping of the sidewalls indicated that the best angle of convergence should be between 16° and 25°.
Third spill way change. The third change simulated a 22° angle of convergence of the sidewalls, which were installed in the shape of a reverse curve extending from the end of the spillway piers (Station 12+05. 86), and becoming tangent to the sides of the center channel at Station 18+30, Figure 23. The sidewalls in this arrangement were 26 feet high, about 6 feet higher than the earlier walls. Guide vanes were again used to train the· flow downstream from the spillway piers. The curve for the sidewalls had been derived by experiment, using adjustable sidewalls which could be bent to any configuration and choosing the alinement that produced the smoothest flow conditions.
The maximum outlet discharge of 250, 000 cf s and the combined outlet and spillway discharge of 250,000 cfs produced satisfactory flow conditions similar to those of the previous test, Figure 23. The flow struck the sidewalls just upstream from the 150-foot-wide chute but there was no overtopping, Figure 24.
The maximum combined discharge of 620, 000 cfs had the same general flow pattern, Figure 24. The merging of the side flows with the center flow caused 60-foot-high fins which overtopped the sidewalls at the end of the transition. The flow downstream was highly turbulent and frequently overtopped the sidewalls.
Because these preliminary model studies showed that the concept of a combined spillway-flood control outlet, designed to discharge into a wide unlined channel, could not economically and practicably be adapted to a comparatively narrow concrete-lined channel_, the California Department of Water Resources proposed a raaically different design that separated the two features.
14

PART II--1:48 MODEL STUDIES OF THE FLOOD CONTROL OUTLET
The new design concept for the spillway called for major design modificatio11s. The spillway was separated into two structures, the flood control outlet and a 1, 740-foot-long uncontrolled overfall crest. The latter, the emergency spillway, discharged into a natural channel about 500 feet to the right or northwest of the outlets, Figure 25. Since the emergency spillway would operate only during extreme flood conditions, no model studies were made of this part of the structure.
The flood control outlet, Figures 26 and 27 consisted of seven 20-foot-wide by 32-foot-high outlets controlled by top seal radial gates. The outlet was placed in a section of a 455-foot-wide slab and buttress-type dam. Flow from this structure discharged into a 170-foot-wide, 31 400-foot-long, concrete-lined chute which terminated at the Feather River. Since the flood control outlet was expected to operate frequently, model studies were made to determine the flow characteristics of the outlet, chute, and the Feather River channel at the end of the chute.
Originally two models were planned for this study. A 1 :48 scale sectional model would be used to obtain discharge capacity curves, bellmouth entrance pressure data, and flow conditions upstream of and through the outlet bays. The second model, 1 :78 scale, would contain the complete outlet structure1 including the seven outlets, the excavated approach channel, surrounding topography, the concretelined chute, and a 3, 000-foot segment of the Feather River channel and would be used to investigate the flow characteristics of the overall structure. Because of adverse operating conditions revealed by the 1:48 model, the overall model of this design was not built.
The 1:48 Scale Sectional Model
The 1 :48 scale sectional model contained the three right-hand bays (5, 6, and 7) of the seven bays of the flood control outlets, a portion of the approach channel and adjacent topography on the right side of the approach channel, Figure 28. For most tests, a wall of symmetry was installed which extended from the left side of Bay 5 upstream about 400 feet into the reservoir. The purpose of the wall was to cause the flow to approach the three bays as if all seven were operating. Baffles and floats in the headbox were used to still the inflow and assure evenly distributed, smooth flow in the approach channel. Piezometers were installed at critical locations in the roofs and sides of the bellmouth entrances of Bays 5 and 7. The model topography was constructed with concrete mortar placed on wood and expanded metal lath forms. The outlet piers, bellmouth roofs, and
15

the dam face were built of wood. The floor of the outlet and the approach were formed in concrete, Figure 28.
Except where noted, all discharges in this report are given as total prototyp~ discharge, through the outlets assuming all seven bays were operating.
The Investigation of the First Modification to the Flood Control Outlet
Without Wall of §xmmetry
Without the wall of symmetry, model flow conditions were representative of prototype flows through the three right-hand bays only. Although this was not a probable prototype operation, flow conditions were observed in the model for several discharges with the gates full open.
In general, flow approaching the outlet was smooth; however, most of the flow that entered Bay 5 (the left-hand bay of the three operating bays) came from the left side of the reservoir, moved parallel with the dam and made an abrupt turn into Bay 5. This caused about a 16-foot-deep drawdown in the water surface around the pier on the left side of Bay 5 for discharges between 20,000 and 50,000 cfs (three bays operating). At 55,000 cfs the entrances became submerged and the drawdown was reduced to about 4 feet; for discharges greater than 70,000 cfs the submergence was sufficient to eliminate all drawdown. The flow entered Bays 6 and 7 from almost directly upstream and negligible drawdown occurred around the piers of Bays 6 and 7 at any discharge.
When the discharge was about 64, 000 cfs, small vortices formed over the entrances of Bays 6 and 7; as the flow increased to the maximum (119,000 cfs), the small vortices merged into one large vortex whose tail alternated between Bays 6 and 7, Figure 29. The tail of this vortex carried down through the outlets and caused the flow to separate from the roofs of Bays 6 and 7, Figure 29.
With Wall of Symmetry
The wall of symmetry was installed in the model for the remaining test program. With the wall of symmetry, the approach flow for discharges up to about 200, 000 cfs (assuming all seven bays in operation), was smooth and straight and was confined within the excavated approaeh channel. The flow entered and passed through Bays 5 and 6 with no excessive turbulence, Figure 30. However the flow moving down the right side of the channel impinged on the vertical surface to the right of Bay 7. This deflected the flow toward the left, causing a severe contraction around the end pier, Figure 31. Bay 5 flowed
16
full at reservoir elevation 853. 4 (Q = 100, 000 cfs), Figure 31; however, due to the contraction, Bay 7 did not fill until the reservoir was raised nearly 5 feet (Q = 125, 700 cfs).
After all bays submerged, there was extreme turbulence above the outlet entrances, as shown for the 150, 000-cfs discharge in Figure 31. The contraction on the right side of Bay 7 resulted in a depressed water surface above Bay 7 and a boil above Bay 5.
Severe vertical surging as well as horizontal oscillation of the water surface above the entrances created intermittently an 8- to 10-foot difference in water surface along the face of the outlet.
At a discharge of about 200,000 cfs the reservoir water surface overtopped the topography on the right side of the approach channel and spilled into the area excavated for the footing of the dam; the flow then moved along the dam toward the outlet. This strong lateral flow caused severe vortices and turbulence over the entrances. The vortices in front of Bays 5 and 7 were about 20 feet in diameter. Flow also moved across the topography into the approach channel and formed a large turbulent eddy along the right side of the channel. The vortex action and turbulence diminished as the reservoir water surface elevation increased. Near the 277, 000-cfs discharge the vortex action was intermittent and occurred only upstream from Bay 5, Figure 30.
Outlet Flow
Flow emerging from the outlet was not entirely satisfactory because of roughness in the water surface and separation of the flow from the outlet roofs. These adverse conditions were partly due to the poor entrance conditions and partly because of the bellmouth roof shape. Flow around the piers was very satisfactory.
The shape of the bellmouth roof was defined by the equation
x22 + Y2
2 = 1, Figure 27. This curve was quite abrupt and was 18. 67 19 10 feet long instead of the 19. 00-foot length required to form the full bellmouth. Generally the flow downstream from the bellmouths was smooth for discharges up to and including 200,000 cfs, except in Bay 7. The adverse flow conditions on the upstream side of Bay 7 and around the end pier carried through the outlet and created a depressed water surface in. the center of the bay and a large fin along the right pier, Figure 30. For a discharge slightly below 250,000 cfs, the flow began to separate from the downstream portion of the bellmouth roofs. This separation, which became greater as the dis.charge increased, occurred in all bays and may be seen in Figure 30 for discharge of 100,000 and 277,000 cfs. At 277,000 cfs the flow separation in Bay 5 was less, but never completely disappeared. The outlet
17
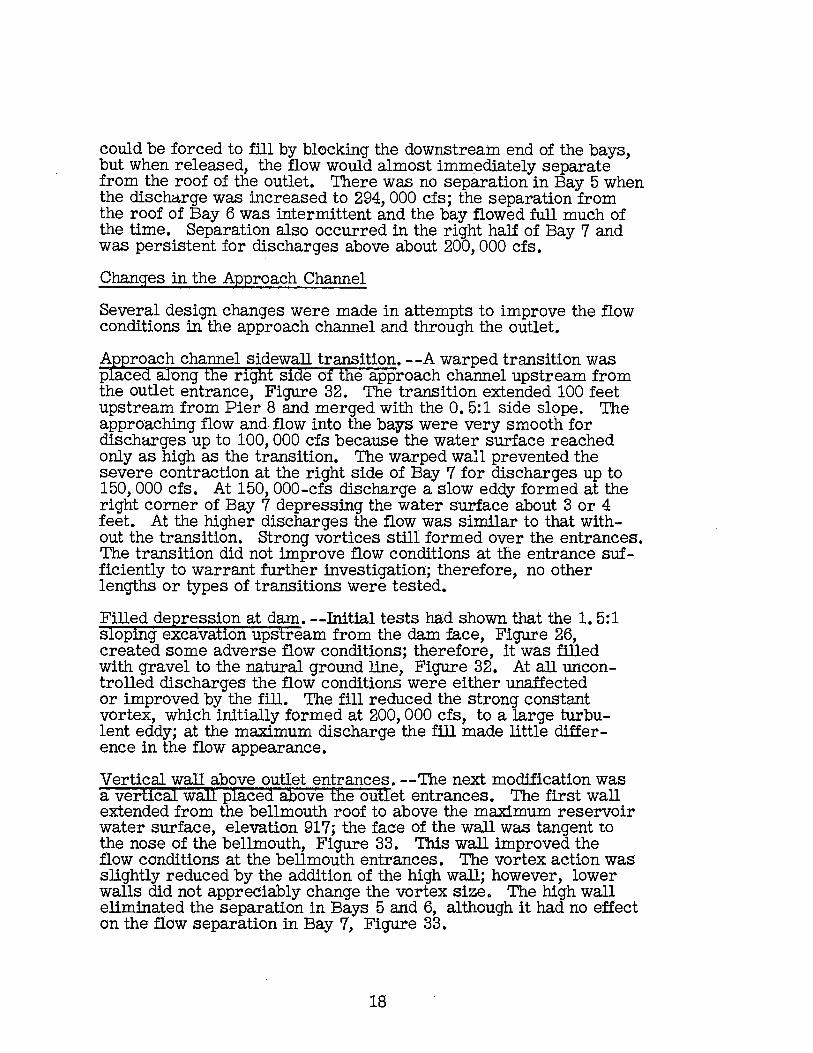
could be forced to fill by blocking the downstream end of the bays, but when released, the flow would almost imm_ediately separate from the roof of the outlet. There was no separation in Bay 5 when the discharge was increased to 294, 000 cfs; the separation from the roof of Bay 6 was intermittent and the bay flowed full much of the time. Separation also occurred in the right half of Bay 7 and was persistent for discharges above about 200,000 cfs.
Changes in the Approach Channel
Several design changes were made in attempts to improve the flow conditions in the approach channel and through the outlet.
Ataproach channel sidewall transition. - -A warped transition was paced along the right side of the approach channel upstream from the outlet entrance,. Figure 32. The transition extended 100 feet upstream from Pier 8 and merged with the O. 5:1 side slope. The approaching flow and flow into the bays were very smooth for dischcLI'ges up to 100,000 cfs because the water surface reached only as high as the transition. The warped wall prevented the severe contraction at the right side of Bay 7 for discharges up to 150,000 cfs. At 150, 000-cfs discharge a slow eddy formed at the right corner of Bay 7 depressing the water surface about 3 or 4 feet. At the higher discharges the flow was similar to that without the transition. Strong vortices still formed over the entrances. The transition did not improve flow conditions at the entrance sufficiently to warrant further investigation; therefore, no other lengths or types of transitions were tested.
Filled depression at dam. --Initial tests had shown that the 1. 5:1 sloping excavation upstream from the dam face, Figure 26, created some adverse flow conditions; therefore, it was filled with gravel to the natural ground line, Figure 32. At all uncontrolled discharges the flow conditions were either unaffected or improved by the fill. The fill reduced the strong constant vortex, which initially formed at 200, 000 cfs, to a large turbulent eddy; at the maximum discharge the fill made little difference in the flow appearance.
Vertical wall a:bove outlet entrances. --'The next modification was a vertical wall placed above the outlet entrances. The first wall extended from the bellmouth roof to above the maximum reservoir water surface, elevation 917; the face of the wall was tangent to the nose of the bellmouth, Figure 33. 'This wall improved the flow conditions at the bellmouth entrances. The vortex action was slightly reduced by the addition of the high wall; however, lower walls did not appreciably change the vortex size. The high wan eliminated the separation in Bays 5 and 6, although it had no effect on the flow separation in Bay 7, Figure 33.
18

All of the walls were effective in preventing separation in Bays 5 and 6, but had very little effect on the separation in Bay 7. The lowest wall that was tested was 3 feet high.
A wall extending above the reservoir water surface was most effectivec however, a 14-foot-high wall would provide satisfactory flow conaitions.
Pressures in Outlet
Sixty-nine piezometers were placed in the roofs and along the sides of Bays 5 and 7, Figure 34. In Bay 5, piezometers were located along the centerline and right side of the roof and along the right side at the roofline and 16. 35 feet above the invert. In Bay 7 piezometers were placed in the same relative locations as in Bay 5, but an additional row was placed in the roof near the left wall and two rows were installed on the left side, one at the roofl.ine and the other 16. 35 feet above the floor.
Pressure measurements were made at discharges of 150, 000 and 277, 000 cfs with the radial gates fully open and with the wall of symmetry in place. Pressures for the 277, 000-cfs discharge with three model arrangements are shown in Figure 35. The minimum observed pressure was equivalent to 7 feet of water below atmospheric. Pressures for the 150, 000-cfs discharge followed the same trend but were considerably higher than for the 277, 000-cfs discharge.
Pressures without wall of sllimetry. - -Without the wall of symmetry, the model represented flow ough the three right-hand bays only. The appearance of the fl.ow indicated that most of the flow came from the left, moved along the face of the dam, and made an. abrupt turn into the openings. Flow approaching the outlet in this manner generally resulted in reduced pressures on the right side of the piers and the left corner of the roofs and higher pressures on the left side of the piers and right corner of the roofs, Figure 35. The pressures in the right corner of the roof and on the left side of the piers were as much as 20 feet of water higher for unsymmetrical operation than for symmetrical operation. The pressures on the right side of the piers and in the left corner of the roofs were generally slightly lower during unsymmetrical operation.
Pressures with wall of s~mmetry. - - Model operation with the wall of symmetry represente flow conditions when all seven bays were discharging. For the maximum discharge, subatmospheric pressures equivalent to vapor pressure were measured in the upper right corner of Bay 5 about 5 feet downstream from the pier nose, Figure 35.
19

Generally, all observed pressures along the roofs of the bellmouth entrances were below atmospheric from a point about 3 feet downstream from the pier noses. Pressures on the sides of the piers at the roof were usually the same as the roof pressures. The pressures on the si <ie of the piers 16. 35 feet above the floor were above c:1.tlliv.:s,l).1..1.~r1<.; c:,xcept for Pier 8. At Pier 8 the water surface drawdown as the flow entered the outlet was reflected in subatmospheric pressures equivalent to about 8 feet of water. The separation of the flow from the roof on the downstream side of Bay 8 was also indicated by atmospheric pressures recorded in this area. It was. noted that just before the flow separated from the roof the pressures momentarily reduced to approximately vapor pressure.
Pressures with vertical wall over entrances. --Pressure measurements obtained with a 14-foot-filgh vertical Wall over the entrances showed that all pressures were increased 1 to 5 feet, Figure 35. Pressure observations made with other vertical walls in place indicated that the pressures were increased a maximum of 5 feet when test walls ranging from 3 feet in height to one extending to the maximum water surface elevation were tested.
Effect of gate closure. --Tests were made to determine the amount of gate closure necessary to raise the bellmouth pressures to an acceptable level for maximum reservoir elevation 917. Tests were made with the gates lowered 1, 2, and 4 feet below maximum opening. The tests showed that the gates should be lowered about 4 feet to assure atmospheric or higher pressures in all areas of the bellmouth entrances for maximum reservoir elevation. One foot of closure brought most of the pressures to nearly atmospheric or above. One area, however, along the right top corner of Bay 7 about 4 to 5 feet downstream from the nose of the pier, remained at ne.arly 20 feet of water below atmospheric until the gates were lowered 4 feet, Figure 36.
Discharge Rating
A discharge capacity rating curve for the outlet, with the wall of symmetry installed, was obtained from the model. This curve was superimposed on the design rating curve, Figure 37. The maximum deviation of the curves occurred between discharges of 100,000 and 200,000 cfs, where, for a given discharge_., about a 2-foot lower reservoir elevation was indicated by the model. The curves were coincident at the upper and lower ends. A discharge coefficient curve, computed from the discharge rating data, was superimposed on the design coefficient curve, Figure 38, and indicated a maxjmu:m deviation from the design curve of about 4 percent.
20

Investigation of the Second Modification to the Flood Control Outlet
Tests on the first modification had indicated that adverse flow and pressure conditions could be alleviated by certain basic changes in the configuration of the structure. The second modification to the flood control outlet incorporated these changes.
For the second modification, the portions of the buttress dam on either side of the outlet were replaced by gravity sections. The flood control outlet was still contained in the buttress section near the center of the dam, Figure 39. The only change to the buttress section containing the outlet was the addition of a 7. 73-foot-high vertical wall above the bellmouth entrances, Figure 40. Wingwalls extended from both end piers upstream at a 45° angle and merged into the approach channel sidewalls. The wingwalls and the backfill behind the right wall were terminated at elevation 864. O, or the same elevation as the top of the wall over the bellmouth entrances.
The model, altered to include these changes, is shown in Figure 41. The model deviated from the design drawings in one respect; the cut adjacent to the upstream face of the gravity dam was filled with gravel. Test results on the first modification had shown that this change would improve flow conditions at all discharges when the reservoir was above elevation 875.
Approach Channel Flow
Flow in the approach channel was generally smooth for all discharges up to 150,000 cfs, Figure 42. Some drawdown occurred at the outlet entrance on the right side of Bay 7 and increased from 1 foot at 75,000 cfs to about 4 feet at 100,000 cfs. The water surface over the entrances started to .surge when the discharge reached about 1287 000 cfs. The maximum surge (about 5 feet vertically), occurred at a discharge of 150,000 cfs. Flow along the wingwall was smooth with about a 1- to 2-foot rise in water surface at the wall.
The approach flow continued to be fairly smooth as the discharge was maintained at 150,000 cfs and the reservoir water surface was raised to elevation 000 by adjusting the gates. Some turbulence was noted in the approach channel anq was caused by the· shallow flow passing over the right topography and entering the deeper flow in the excavated approach channel. Vortices began to develop intermittently when the outlet entrances became submerged. When the reservoir reached elevation 900, a continuous 20-foot-diameter vortex formed in the otherwise smooth approach channel. The vortex located constantly over the Bay 7 entrance, Figure 42.
For the uncontrolled discharge of 250,000 cfs at about reservoir water surface elevation 900, the vortex also remained constant but increased
21

in size to about 25 to 30 feet in diameter at the water surface. A swir 1 around the vortex extended across the entire approach area and created much turbulence. The water surface was smooth at the 277, 000-cfs discharge and was broken only by an occasional small vortex, Figure 42. The maximum size of the vortex at the surface was about 8 feet in diameter.
Outlet Flow
The flow emerging downstream from the outlet was generally smooth for uncontrolled discharges up to 150,000 cfs. Evidence of the large vortices began to appear in Bay 7 as the reservoir water surface rose above elevation 890. The large vortices that formed over the entrance of Bay 7 at gate-controlled discharges of 150,000 cfs and free flows of 250,000 cfs with reservoir water surface elevation 000, caused heavy rolling, splashing, and aeration of the flow emerging from the outlets, Figure 42. The flow emerging from Bay 7. continued to be highly turbulent and aerated for discharges up to 277, 000 cfs even though the vortex action had subsided.
The separation of flow from the roofs of the entrances was not as great in this modification. There was no separation in Bay 5 and there was no apparent separation in Bay 7 despite the turbulence and aeration. A small amount of separation occurred in the center of Bay 6 at the 277, 000-cfs discharge. The separation in Bay 6 disappeared at discharges above 277, 000 cfs but considerable turbulence still existed in the flow emerging from Bay 7.
Design Changes
Several attempts were made to eliminate the vortices and improve the flow conditions by modifying the entrances.
Vertical wall above outlet entrance. --The vertical wall over the outlet was extended from elevation 864. 0 to above the maximum reservoir water surface and was terminated at the edge of the buttress outlet section, Figure 43.
The high wall virtually eliminated the large, constant vortices. Flow passing around the right end of the wall, however, created some turbulence and eddying. Several curved wingwalls were tested to reduce these adverse flow conditions. The most effective wingwall extended from the vertical wall on about a 5-foot radius to a straight wall which extended at a 45° angle back toward the face of the dam.
To determine the minimum wall height necessary to provide satisfactory flow conditions, the height was varied in 5-foot increments. The first discharge to be tested in this manner was 150, 000 cfs at reservoir water surface elevation 000, which had
22

produced the 20-foot-diameter vortex with the 7. 73-foot-high wall. Increasing the height of the vertical wall 5 feet reduced the size of the v0rtex slightly and caused it to occasionally disappear. Ten feet of additional_ wall height reduced the vortex to about 12 feet in diameter. Fifteen feet of additional vertical wall created a smooth surface with a few small whirl-. pools and occasionally a sporadic vortex with diameter up to 6 feet, Figure 43. A 20-foot-high addition to the wall height made the surface almost smooth with a few whirlpools and very little vortex action. Twenty-five feet of additional vertical wall was only slightly better than the 20-foot height.
A similar test was run for 250, 000-cfs free discharge. With the 7. 73-foot-high wall there was a 25- to 30-foot-diameter vortex in the center of a large swirl continually covering the entire approach area. The addition of 5 feet of vertical wall to the initial structure did not improve the flow conditions. Ten feet of additional height caused the vortex to become intermittent, occurring only about 50 percent of the timE:. A strong eddy always was present when no vortex was observed. Fifteen feet of additional wall height reduced the vortex action to the extent that a vortex about 14 feet in diameter developed occasionally for a short period of time; eddies and whirlpools occurred continually over the outlet. Twenty feet of additional wall height further reduced the surface roughness and vortex action. Very infrequently a vortex up to 6 feet in diameter developed for a short time. Twenty-five feet of additional wall improved the flow conditions slightly. The vertical walls did not materially improve the flow at 277, 000-cfs discharge. The tests indicated that the 15-foot-high wall eliminated most of the turbulence and vortices. Higher walls were progressively more effective in preventing the turbulence and vortex action.
Pier extensions at the outlet entrance. --Tests were made with two different types of pier extensions in an attempt to improve the flow conditions. In the first arrangement the piers were extended vertically upward to the maximum reservoir water surface. These extensions were fastened atop the sloped upstream face of the buttressed section of the dam. For the second arrangement, the pier noses were extended 16 feet upstream. The tops of these extensions also terminated above the maximum reservoir water surface. A third test was made combining both arrangements, Figure 44. All of these arrangements broke up the larger vortices, but created extensive vortex action in the chambers between the extensions. For a discharge of 150,000 cfs with the reservoir water surface at elevation 900, a 5-foot-diameter vortex formed almost continuously in the chamber over Bay 7; a slightly smaller vortex formed continuously over Bay 6. Over Bay 5, the water surface was usually smooth, but was broken occasionally by a small
23

vortex. At a 250, 000-cfs free discharge, a vortex filled the chamber over Bay 7. The flow in the chamber over Bay 6 was turbulent and was broken by strong eddies, and a vortex formed intermittently most of the time. The flow over Bay 51was usually smooth. At a discharge of 277,000 cfs, vortices up to about 5 feet in diameter formed intermittently in Bays 6 and 7, and turbulence and intermittent eddying occurred over Bay 5.
The second arrangement (upstream pier extensions) and the combination arrangement were both tested with the same discharges. The flow conditions were all generally worse with greater turbulence and stronger vortices than those observed in the first test; therefore, no further testing was done with pier extensions.
Revised apvroach tftogra~hl° - -In an attempt to improve the flow conditions ln £he OU et, re Opography to the right of the approach channel was arbitrarily excavated to elevation 864, the same elevation as the top of the approach transition wall and backfill, Figure 45. At 150, 000-cfs discharge with the reservoir water surface controlled to elevation 900 and at 250, 000-cfs free discharge, the flow appearance was very similar to that observed before the topography was excavated. At the 277, 000-cfs discharge, the water surface in the approach channel was very smooth with a very small vortex appearing occasionally.
There was no evidence of improved flow which would warrant the removal of additional topography to the right of the excavated approach channel.
Pressures in Bellmouth Entrance
Pressures in the bellmouth outlet was again recorded with the second modification to the outlet. The piezometer locations were the same as for the first modification and are shown on Figure 34. Although pressures at all piezometers were read, only the most highly subatmospheric are discussed. The lowest observed pressure conditions were found in the top right corner and the center of the roof of Bay 7. The pressures were acceptable for discharges up to about 250,000 cfs; at higher discharges some pressures were highly subatmospheric and approached vapor pressure at 277, 000 cfs, Figure 46. The lowest pressures were located in the top right corner of Bay 7.
A small amount of gate closure improved the subatmospheric pressures, but about 10-percent closure was necessary to assure aboveatmospheric pressures at all piezometers.
24
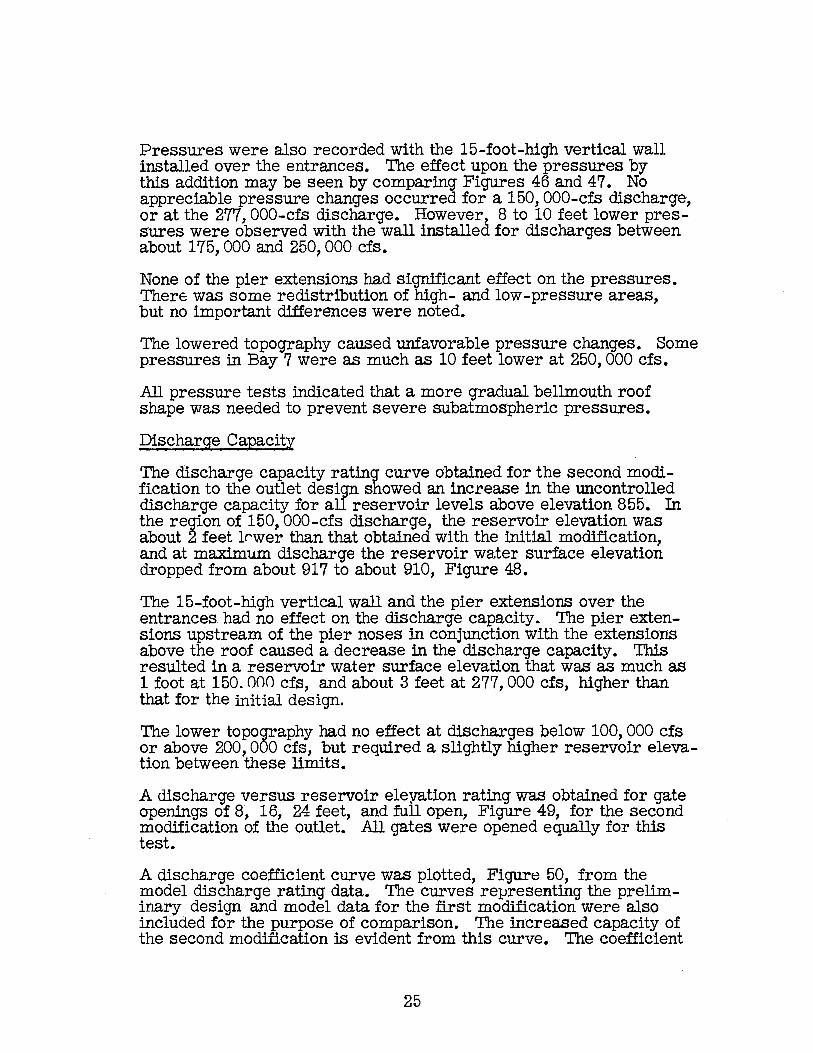
Pressures were also recorded with the 15-foot-high vertical wall installed over the entrances. The effect upon the pressures by this addition may be seen by comparing Figures 46 and 47. No appreciable pressure changes occurred for a 150, 000-cfs discharge, or at the 277, 000-cfs discharge. However~ 8 to 10 feet lower pressures were observed with the wall installea for discharges between about 175, 000 and 250, 000 cfs.
None of the pier extensions had significant effect on the pressures. There: was some redistribution of high- and low-pressure areas, but no important differences were noted.
The lowered topography caused unfavorable pressure changes. Some pressures in Bay 7 were as much as 10 feet lower at 250, 000 cfs.
All pressure tests indicated that a more gradual bellmouth roof shape was needed to prevent severe subatmospheric pressures.
Discharge Capacity
The discharge capacity rating curve obtained for the second modification to the outlet design showed an increase in the uncontrolled discharge capacity for all reservoir levels above elevation 855. In the region of 150, 000-cfs discharge, the reservoir elevation was about 2 feet l<'wer than that obtained with the initial modification, and at ma.xim:u.m. discharge the reservoir water surface elevation dropped from about 917 to about 910, Figure 48.
The 15-foot-high vertical wall and the pier extensions over the entrances had no effect on the discharge capacity. The pier extensions upstream of the pier noses in conjunction with the extensions above the roof caused a decrease in the discharge capacity. This resulted in a reservoir water surface elevation that was as much as 1 foot at 150. 000 cfs, and about 3 feet at 277,000 cfs, higher than that for the initial design.
The lower topography had no effect at discharges below 100, 000 cfs or above 200, 000 cfs, but required a slightly higher reservoir elevation between these limits.
A discharge versus reservoir eleya.tion rating was obtained for gate openings of 8, 16, 24 feet, and full open, Figure 49, for the second modification of the outlet. All gates were opened equally for this test.
A discharge coefficient curve was plotted, Figure 50, from the model discharge rating data. The curves representing the preliminary design and model data for the first modification were also included for the purpose of comparison. The increased capacity of the second modification is evident from this curve. The coefficient
25

of discharge (Cd) is defined as Cd= Q where A= area of A)i2qH
the passage at the gate and H = head on tfie "center line of the gate opening.
The discharge coefficients for the second modification were as much as 4. 9 percent higher than the design coefficient for the first modification.
Investigation of the Third Modification to Flood Control Outlet (Recommended)
The third modification to the flood control outlet and that which was ultimately adopted was substantially different from the previous outlet designs. The outlet was contained in a gravity dam section, Figures 51 and 52, which provided a vertical wall over the entrances instead of the sloping wall of the buttress dam used in previous arrangements; curved wingwalls were located on either side of the outlet entrances. An eighth bay was added and the bay width was reduced from 20 feet to 17 feet 7 inches. The outlet chute width was increased from 150 feet to 178 feet 8 inches. The chute alinement and invert slope were unchanged. The approach channel was widened to 178 feet 8 inches at the outlets and the sides flared 5° in an upstream direction. The bellmouth roof shape was made more gradual by changing the ratio of the axes of the elliptical curve from 1. 9: 1
2 2 to 3: 1. The equation of the new curve was ~ + "E- == 1, along the
33L.i W direction.of flow. The dividing piers and the top seal radial gates (except for width) were not changed.
Portions of the 1 :48 scale sectional model were reconstructed to represent the gravity dam outlet design, Figure 53. Four bays of the outlet section were built and included the new bellmouth shape and narrower bay width. The curved entrance wall on the right side and the diverging approach channel sidewall were added. The wall of symmetry was moved to the left to accommodate the four bays represented in the model, and four new radial gates were constructed. Piezometers were installed in the piers and roof of the outlet bays, in locations similar to those in the previous model.
Flow in ApProach Channel and Outlet
The flow in the approach channel and through the outlet was generally smooth. The turbulence, roughness, and vortices were very small and of minor importance. The approach flow for uncontrolled discharges up to about 100,000 cfs was extremely smooth, with no drawdown at the piers1 Figure 54. Some turbulence was created by flow over the right side of the approach channel about 350 feet upstream
26

from the vertical face of the dam for a discharge of 100,000 cfs; this turbulence was almost entirely smoothed out before the flow reached the outlet entrance. A ridge in the flow surface in the center of the bays was formed by the flow around the blunt pier noses. This ridge touched the .roofs of Bays 6 and 7, nearly touched the roof of Bay 5, and cleared the roof of Bay 8 by 4 to 6 feet.
Smooth flow conditions were also noted for 125, 000-cfs discharge, Figure 54. The right half of Bay 8 was just submerged due to a slight drawdown in the flow around the curved approach wall, while the water surface along the remainder of the outlets fully submerged the openings. There was a gentle oscillation of the water surface close to the outlet.
The approach flow for 150,000 cfs was also very smooth, Figure 55. The roughness created by side flow over the right topography had moved downstream about 50 feet but was smoothed out before reaching the piers. Some turbulence was noted in the water surface and was caused by the flow around the curved approach wall. The roughened water surface near the outlet oscillated vertically about 2 feet except over Bay 8 where it fluctuated about 4 feet. There was also an 8- to 10-foot horizontal oscillation of the roughened surface in front of the dam. A vortex-like swirl and about 4 feet of drawdown in the water surface formed at the right corner of Bay 8. The flow through and emerging from the bays was smooth. The flow surface cleared the gate trunnion by about 8 feet.
The approach flow was very smooth at 277, 000-cfs discharge, Figure 56. An occasional small vortex formed; the largest vortex was about 8 feet in diameter. Flow through and emerging from the bays was generally smooth; however, some aerated water appeared intermittently downstream from the roof in Bay 8. There was about 4 feet of clearance between the maximum water surface and the gate trunnion.
Approach Channel Erosion
· To determine the erosive tendencies upstream from the outlet structure, the approach channel invert was formed in 3/4-inch gravel, to represent 3-foot-diameter prototype riprap, Figure 57. There was very little apparent riprap movement for discharges up to · 250,000 cfs; at 277, 000-cfs riprap was removed from an area extending about 5 feet upstream from Bay 5 to about 50 feet upstream along the right side of the channel; riprap was removed to an average depth of 4 to 7 feet, and the deepest area was in front of Bay 8, Figure 57.
Outlet Pressures
The piezometers installed in the modified outlet bellmouths were located as shown in Figure 58. Piezometers 1 through 45 were
27

located in the roof along the sides and center lines of Bays 6 and 8. These locations were similar to those of previous tests to obtain comparative data, and were chosen so that the data could be compared with U. S. Corps of Engineers' tests of similar bellmouth shapes.v
Piezometers 46 and 47 were added to measure pressures at the stoplog slot; Piezometers 48 and 49 recorded pressures at the leading edge of the outlet floor; and Piezometers 50 and 51 were added to measure pressures at the pier nose below the bellmouth roof. Piezometers Sa, 17a, 26a, and 35a also were added later to cover additional areas of the bellmouth.
Pressures were plotted for the 277, 000-cfs discharge, Figu.r~ 59. Generally, the pressures were higher than they had been for the previous bellmouth shape. Pressures were considered to be within an acceptable limit if they did not exceed 20 feet of water below atmospheric for extreme operating conditions. Pressures in a limited area along the roof of Bay 8 from about 3 to 4 feet downstream from the pier nose exceeded this limit at the 277, 000-cfs discharge. These pressures were recorded at Piezometers 25, 26, and 35 and ranged from 20 to 32 feet of water below atmospheric. Tests were made to determine what operating conditions might bring these pressures up to an acceptable level.
One test was run to determine the maximum free-flow discharge which could be passed without creating highly subatmospheric pressures. The lowest pressure recorded for 234, 000-cfs free discharge was 10. 2 feet of water below atmospheric (at Piezom-eter 26), Figure 60. This discharge, which occurred at reservoir water surface elevation 891, was considered the highest uncontrolled discharge which would assure acceptable pressures in the outlet.
A second test was run to determine the minimum amount of gate closure required to raise the pressures to an acceptable level. Tests were run with all gates equally lowered 3 and 9 inches from the fully open position, while the reservoir water surface was held at elevation 907, Figure 60. A 268, 000-cfs discharge could be passed with the gate lowered 3 inches at this reservoir elevation. Although the 3-inch closure raised the pressures considerably, pressures equivalent to about 20 feet of water below atmospheric were still recorded at Piezometers 25 and 26.
About 254, 000-cfs was passed with the gates lowered 9 inches. This amount of closure raised pressures at most of the piezometers to atmospheric or above. The lowest pressure recorded at Piezom-eter 26, was 12 feet of water below atmospheric. Assuming a straight line relationship for gate closure versus pressure at Piezometer 26, acceptable pressures would be obtained at about 4. 3 inches of gate
28

closure. At this opening a discharge of about 265,000 cfs could be passed at reservoir water surface elevation 907.
These tests indicated that the pressures would be satisfactory for uncontrolled discharges up to 150,000 cfs, for gate-controlled discharge of 150,000 cfs with the reservoir water surface between elevations 864 and 900, and for gate-controlled discharges from 150,000 to 234, 000 cfs at reservoir water surface elevation 900. A minimum of aoout 4 inches of gate closure would be requ.irea for releases between 234, 000 to 265, 000 cfs which could be passed with the reservoir at elevation 907. Thus, the outlet would be subjected to highly subatmospheric pressures only in extreme operating conditions and then probably for short periods of time.
Com arison to Cor s of En eers' data. - -Pressure data obtained rom e ro e mo e was compare with similar data obtained
in model tests performed by th1;;; Corps of Engineers.']/ Pressure profiles obtained from the Oroville model were superimposed on published Corps' data for a similarly shaped bellmouth entrance, Figure 61. The Corps' model entrance was flared on the top only, the invert and sides were straight walls extending sufficiently far upstream to avoid contraction effects at the bellmouth. This arrangement would simulate operation of adjacent bays of a multiple bay structure having little or no flare on the sides. The Oroville outlet entrances were flanked by piers with rounded noses1 a configuration similar to the Corps' arrangement. A very close comparison of results was found as shown on Figure 61. A large pres·sure drop was noted for both models near the leading edge of the bellmouth.
The Corps' data have indicated that pressures would be higher if the bellmouth entrance was flared in three directions. However, the Oroville piers were sufficiently flat to simulate an entrance flared on top only. With this type of entrance restriction, it would be necessary to use the next flatter curve (Type D) to raise all pressures to a safe level at the extreme operating conditions. According to the Corps' data an ellipse with the equation x2 y2 02 + (D/2)2 = 1 would also produce adquately high pressures.
These shapes, however, would require longer outlets and would result in higher prototype construction costs.
Pressures for Bay 6 only oinrating. --Piezometers will be installed in Bay 6 of the prototype ou et structure. Prototype pressures will be measured with one bay operating at several representative conditions and compared with the model data. Pressures for these representative conditions were obtained in the model with Bay 6 only operating, Figure 62. These pressures will become significant only when they can be compared with data obtained from the prototype.
29

~amic :Sressures. - -Six piezometers which had indicated the &west su atmospheric pressures were also tested for dynamic
pressure response, Figure 63. The pressure measuring system consisted of a short length (about 2 to 3 feet) of rigid plastic tube between the piezometer and the pressure transducer. Unbonded strain-gage-type differential pressure transducers were used which had a 20-millivolt output at 5 volts input with a 2, 400-cps carrier frequency. The transducers had a natural frequency of about 4,000 cps. The transducer signals were fed to a carrier preamplifier (100 microvolt to 1 volt), which in turn was connected to a power amplifier. and direct writing recorder. The pressure averages were obtained from visual measurements. Data from the traces for three representative discharge conditions are summarized in Figure 64. Pressures were also recorded for other discharge conditions but were not significantly different than the water manometer pressures. The average values compared well with pressures obtained by water manometers. The frequency of oscillations were all quite low and indicate that there should be no vibration problems.
Center piertfuressure test. --The left boundary of the sectional model was e centerline of the center pier. This arrangement left no means of testing the effect that a wider center pier might have on the bellmouth pressures. Therefore, the right side of Pier 7 was widened from 5 to ~ feet to represent the center pier. The resulting pressures are shown in Figure 65. Pressures are shown for a discharge of 277, 000 cfs with the widened pier and with the normal pier. The wider pier raised the pressure at most piezometers.
Discharge Rating
A discharge capacity curve was prepared for the third modified outlets and has been superimposed on the previous discharge rating curves, Figure 66. The curve shows an increased capacity at all reservoir elevations, and the greatest increase occurred at the higher elevations. The 277, 000-cfs discharge was attained at reservoir elevation 908, about 9 feet lower than the design computations for the second modified outlet and about 2. 5 feet lower than the model data for the second outlet, Figure 66. The discharge capacity of eight bays for free and controlled discharge at equal gate openings in 4-foot increments is shown on Figure 67.
A new discharge coefficient curve, derived from the above data, was also superimposed onto the previous curves for comparison, Figure 68. The coefficient, at the 277, 000-cfs discharge, at reservoir water surface elevation 908, was about 5. 5 percent higher than the design coefficient for the previous bellmouth and about 3 percent higher than the previous model coefficient.
30

This design concept was satisfactory as indicated by the 1 :48 scale sectional model. Therefore it was incorporated in a 1:78 scale model of the entire structure for further investigations.
31
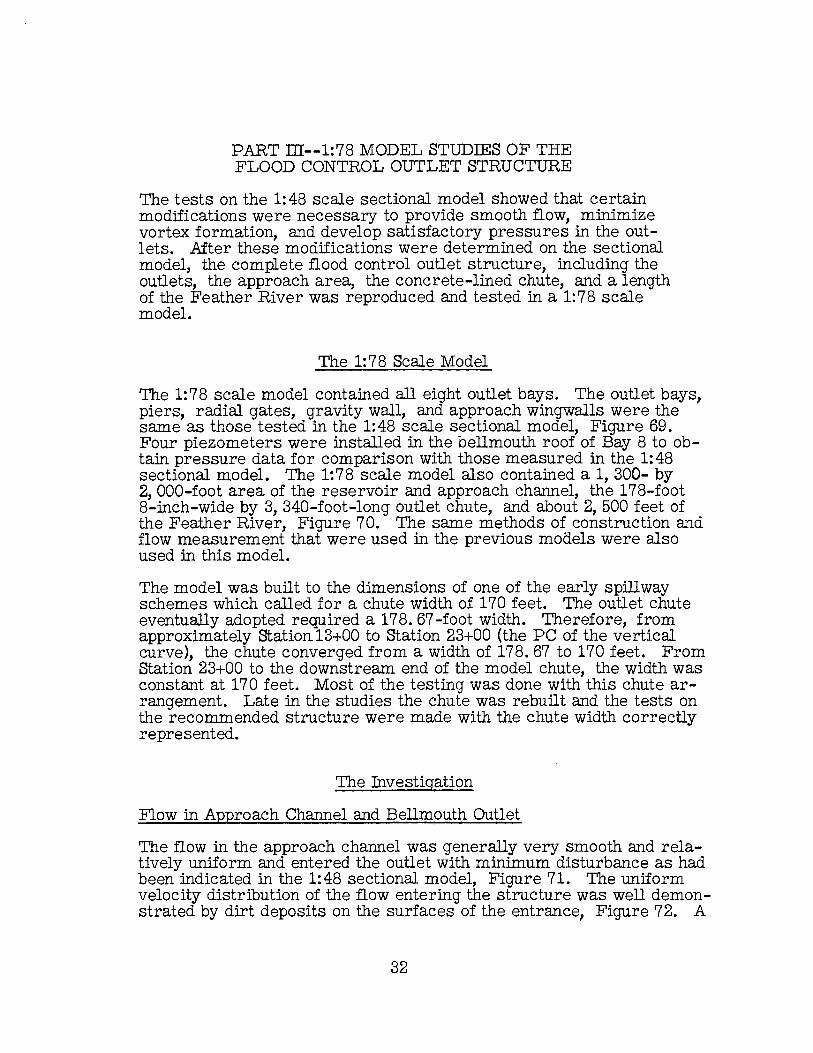
PART m--1:78 MODEL STUDIES OF THE FLOOD CONTROL OUTLET STRUCTURE
The tests on the 1: 48 scale sectional model showed that certain modifications were necessary to provide smooth flow, minimize vortex formation, and develop satisfactory pressures in the outlets. After these modifications were determined on the sectional model, the complete flood control outlet structure, including the outlets, the approach area, the concrete-lined chute, and a length of the Feather River was reproduced and tested in a 1:78 scale model.
The 1: 7 8 Scale Model
The 1:78 scale model contained all eight outlet bays. The outlet bays, piers, radial gates, gravity wall, and approach wingwalls were the same as those tested in the 1: 48 scale sectional model, Figure 69. Four piezometers were installed in the bellmouth roof of Bay 8 to_ obtain pressure data for comparison with those measured in the 1:48 sectional model. The 1:78 scale model also contained a 1, 300- by 2, 000-foot area of the reservoir and approach channel, the 178-foot 8-inch-wide by 3, 340-foot-long outlet chute, and about 2, 500 feet of the Feather River, Figure 70. The same methods of construction and flow measurement that were used in the previous models were also used in this model.
The model was built to the dimensions of one of the early spillway schemes which called for a chute width of 170 feet. The outlet chute eventually adopted required a 178. 67 -foot width. Therefore, from approximately Station13+00 to Station 23+00 (the PC of the vertical curve), the chute converged from a width of 178. 67 to 170 feet. From Station 23+00 to the downstream end of the model chute, the width was constant at 170 feet. Most of the testing was done with this chute arrangement. Late in the studies the chute was rebuilt and the tests on the recommended structure were made with the chute width correctly represented.
The Investigation
Flow in Approach Channel and Bellmouth Outlet
The flow in the approach channel was generally very smooth and relatively uniform and entered the outlet with minimum disturbance as had been indicated in the 1:48 sectional model, Figure 71. The uniform velocity distribution of the flow entering the structure was well demonstrated by dirt deposits on the surfaces of the entrance, Figure 72. A
32
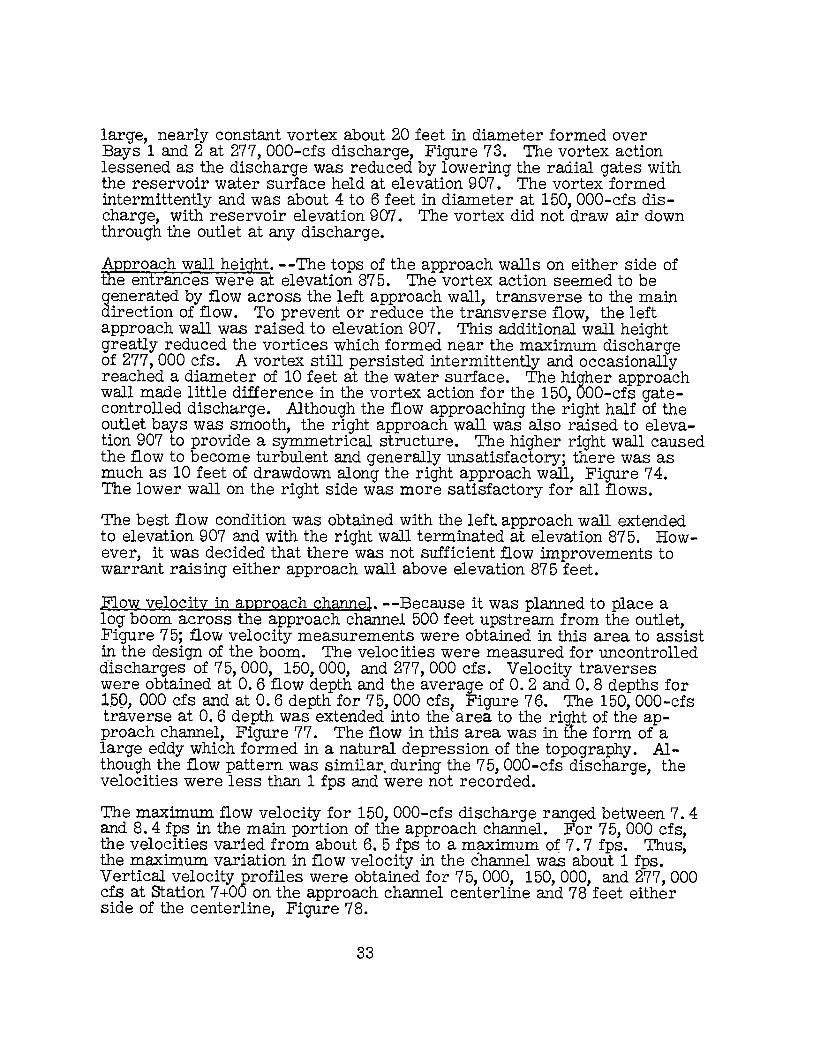
large, nearly constant vortex about 20 feet in diameter formed over Bays 1 and 2 at 277, 000-cfs discharge, Figure 73. The vortex action lessened as the discharge was reduced by lowering the radial gates with the reservoir water surface held at elevation 907. The vortex formed intermittently and was about 4 to 6 feet in diameter at 150, 000-cfs discharge, with reservoir elevation 907. The vortex did not draw air down through the outlet at any discharge.
Approach wall height. --The tops of the approach walls on either side of the entrances were at elevation 875. The vortex action seemed to be generated by flow across the left approach wall1 transverse to the main direction of flow. To prevent or reduce the transverse flow, the left approach wall was raised to elevation 907. This additional wall height greatly reduced the vortices which formed near_ the maximum discharge of 277, 000 cfs. A vortex still persisted intermittently and occasionally reached a diameter of 10 feet at the water surface. The higher approach wall made little difference in the vortex action for the 150, 000-cfs gatecontrolled discharge. Although the flow approaching the right half of the outlet bays was smooth, the right approach wall was also raised to elevation 907 to provide a symmetrical structure. The higher right wall caused the flow to become turbulent and generally unsatisfactory; there was as much as 10 feet of drawdown along the right approach wall, Figure 7 4. The lower wall on the right side was more satisfactory for all flows.
The best flow condition was obtained with the left approach wall extended to elevation 907 and with the right wall terminated at elevation 875. However, it was decided that there was not sufficient flow improvements to warrant raising either approach wall above elevation 87 5 feet.
Flow velocity in approach channel. --Because it was planned to place a log boom across the approach channel 500 feet upstream from the outlet, Figure 7 5; flow velocity measurements were obtained in this area to assist iil the design of the boom. The velocities were measured for uncontrolled discharges of 75, 000, 150, 000, and 277, 000 cfs. Velocity traverses were obtained at 0. 6 flow depth and the average of 0. 2 and 0. 8 depths for 1.69, 000 cfs and at 0. 6 depth for 75,000 cfsl Figure 76. The 150, 000-cfs traverse at 0. 6 depth was extended into the area to the riqht of the approach channel, Figure 77. The flow in this area was in the form of a large eddy which formed in a natural depression of the topography. Although the flow pattern was similar. during the 7 5, 000-cfs discharge, the velocities were less than 1 fps and were not recorded.
The maximum flow velocity for 150, 000-cfs discharge ranged between 7. 4 and 8. 4 fps in the main portion of the approach channel. For 75,000 cfs, the velocities varied from about 6. 5 fps to a m!:iXimum o~ 7. 7 fps. Thus, the maximum variation in flow velocity in the channel was about 1 fps. Vertical velocity profiles were obtained for 7 5, 000, 150, 000, and 277, 000 cfs at Station 7+00 on the approach channel centerline and 78 feet either side of the centerline, Figure 78.
33

Bellmouth pressures. --Four piezometers were installed in the roof of Bay 8 in the 1: 78 scale model. Piezometers 1, 2, 3, and 4 were located in the same relative positions along the.centerline and left edge of the roof of Bay 8 as Piezometers 35, 34, 26, and 25, respectively, in the 1:48 scale sectional model, Figure 58. Pressures were recorded for discharges of 150, 000, 200, 000, 250, 000, and 277, 000 cfs on the 1:78 scale model and compared to similar measurements from the 1:48 scale sectional model, Figure 79. The observed pressures were generally lower in the 1:78 scale model; some of the differences can probably be attributed to the slightly different approach flow conditions.
Dischar.jfe capacity. --The discharge capacity of the outlet for uncontrolled ows was checked on the 1:78 scale model. The checked points compared very closely with corresponding points on the discharge curve prepared from the 1: 48 scale sectional model, Figure 67. The maximum difference between the two ratings was less than 1. 4 percent.
Outlet Chute
The flow in the chute downstream from the outlet was relatively smooth. At all discharges, a diamond-shaped pattern in the flow surface formed in the upstream portion of the chute and resulted from the flow merging at the ends of the piers, Figure 80. With a discharge of 277, 000 cfs, the flow overtopped the sidewalls from the end of the outlet to the PC of the vertical curve. The most severe overtopping occurred immediately downstream from the outlet, Figure 81a. The sidewalls were temporarily raised and water surface profiles for 150, 000- and 277, 000-cfs discharges showed that as much as 6. 5 feet should be added to the sidewall height near the upstream end of the chute.
The chute sidewall width and heights were modified to correspond to the latest design specifications and water surface profiles were recorded for discharges of 150, 000 and 277, 000, and plotted in Figure 82. The water surface in the chute fluctuated about 1 foot, and the highest point of the fluctuation was plotted. Profiles were measured along both walls; however, only the higher measured profile was plotted. The difference in water surf ace elevation along the two walls was usually less than 2 feet. The specification walls were overtopped for a distance of 300 feet downstream from the PT of the vertical curve at the 277, 000-cfs discharge, Figures 81b and c. These tests showed that the walls should be raised about 2 feet in this section of the chute.
Operation of various combinations of adjacent pairs of gates fully open were tested with the reservoir elevation at 900. The flow did not overtop the sidewalls and was equally distributed across the chute downstream from the vertical curve.
34

The measured flow depths were greater than the theoretical depths obtained by the energy equation (Bernoulli's theorem), because the model flow surfaces were relatively rougher than the surfaces in the prototype structure. Usually, this difference in relative rough-
. ness is accounted for in the model by foreshortening the length or increasing the slope of the chute. In this model, however, the geometry of the structure, and the importance of having the correct angle between the chute and the river channel, precluded this method of adjustment.
The model data were considered conservative since the flow depths were greater than the computed depths. However, the model did not indicate the extent of bulking due to air entrainment in the prototype. Usually 3 to 5 feet are added to the measured model.or computed depths to allow for bulking due to air entrainment.
Chute Flow Energy Dissipation
The drop in elevation from the invert of the outlet to the Feather River is about 640 feet. The outlet flows will attain a velocity of about 155 feet per second at the downstream end of the chute; thus, the energy in the flow entering the Feather River is equivalent to about 20 million horsepower for the maximum discharge of 277, 000 cfs. Considerable testing of many devices and configurations was done before an effective method was devised to contain this energy. Because of the tremendous amount of energy to be dissipated, the study was mainly confined to providing good energy dissipation for discharges up to 150,000 cfs and acceptable flow conditions in the river channel for discharges between 150,000 and 277,000 cfs. However, the outlet flow will not exceed 150, 000 cfs until the flood inflow reaches 440, 000 cfs, which is an extremely rare occurrence.
For purposes of the model study the tail water elevation in the Feath~r River at the outlet chute was maintained at elevation 225 for discharges up to 100, 000 cfs because of control by the Thermalito Diversion Dam. The natural Feather River channel will control the tail water elevation for discharges above 100, 000 cfs. The Oroville Powerplant will cease operation when the spillway discharge reaches 150,000 cfs and a corresponding tailwater elevation of 228. Other discharges and tailwater elevations that were used in the tests to develop an energy dissipator were 200,000 cfs and tailwater elevation 237; 250,000 cfs with tailwater elevation 243; 277,000 cfs with tailwater elevation 27~; and 292, 000 cfs with tailwater elevation 280. The model tailwater elevation was controlled at a point 1,400 feet downstream from the spillway chute centerline. Tailwater elevations were also measured at a point 900 feet upstream from the chute centerline to determine the upstream tailwater conditions when the outlet was operating.
35

Initial design. --Initially the spillway chute terminated at the Feather River with a long-radius curve leading to a horizontal flip bucket, Figure 83. Flow from this arrangement landed in the river causing considerable turbulence, crossed the river and traveled up the far bank, Figure 84. The flow reached elevation 450 on the left riverbank with a discharge of 277, 000 cfs, elevation 325 with 150, 000 cfs, and elevation 250 with 50, 000 cfs. Although a hill that reached elevation 280 was between the river and a railroad bed at about elevation 260 on the left bank, the railroad was still inundated by discharges greater than 125, 000 cfs. There was no stilling action at the point of jet impact because the trajectory of the high-velocity jet was nearly horizontal.
Jump-type basin. --For the first chute modification, the horizontal flip bucket was removed and the chute extended on a 0. 24995 slope down to Station 47+30, near the right riverbank. This entailed a con::;iderable amount of excavation and created, in effect, a short hydraulic jump basin wit..h a sloping invert.
The stilling action was much more effective and the flow crossing the river rose to elevation 325 with the 277, 000-cfs discharge, or 150 feet lower than with the initial arrangement, Figures 85!:i and b. With the 150, 000-cfs discharge, the flow climbed to elevation 280, or 45 feet lower than previously.
Left riverbank excavation. --It appeared that the stilling action would be further improved if an area were excavated along the left river-bank opposite the chute to provide a longer _stilling pool. About 30, 000 cubic yards of material was excavated from the left riverbank opposite the spillway chute. This cut extended about 100 feet into the bank, was about 200 feet wide, and ended in a vertical wall. The bottom of the cut was maintained at the same elevation as the river bottom {about 175).
The flow did not climb up the left bank as far but it struck the vertical face of the cut in the left bank and surged about 100 feet vertically upward with the 277, 000-cfs discharge, Figure 85c. The flow at 150,000 cfs was much less violent, Figure 85d, but the flow still rose about 50 feet vertically at the rock wall. A force of this magnitude against a wall of natural rock was undesirable.
There was sound rock on the left riverbank, and the outcrOP.S had a general strike direction parallel to the river and a dip of 7 5° toward the river. The solid rock extended up to the railroad bed, above which the rock was broken and unstable. The cut in the left bank was extended an additional 200 feet toward the railroad to take advantage of this sound rock. The end of the cut was excavated at a 7 5° slope extending from the railroad bed at elevation 27 5 down to the riverbed. This excavation extended 90 feet upstream and 170 feet downstream from the chute centerline, Figure 86a. For 150, 000 cf s, most of the energy was dissipated when
36
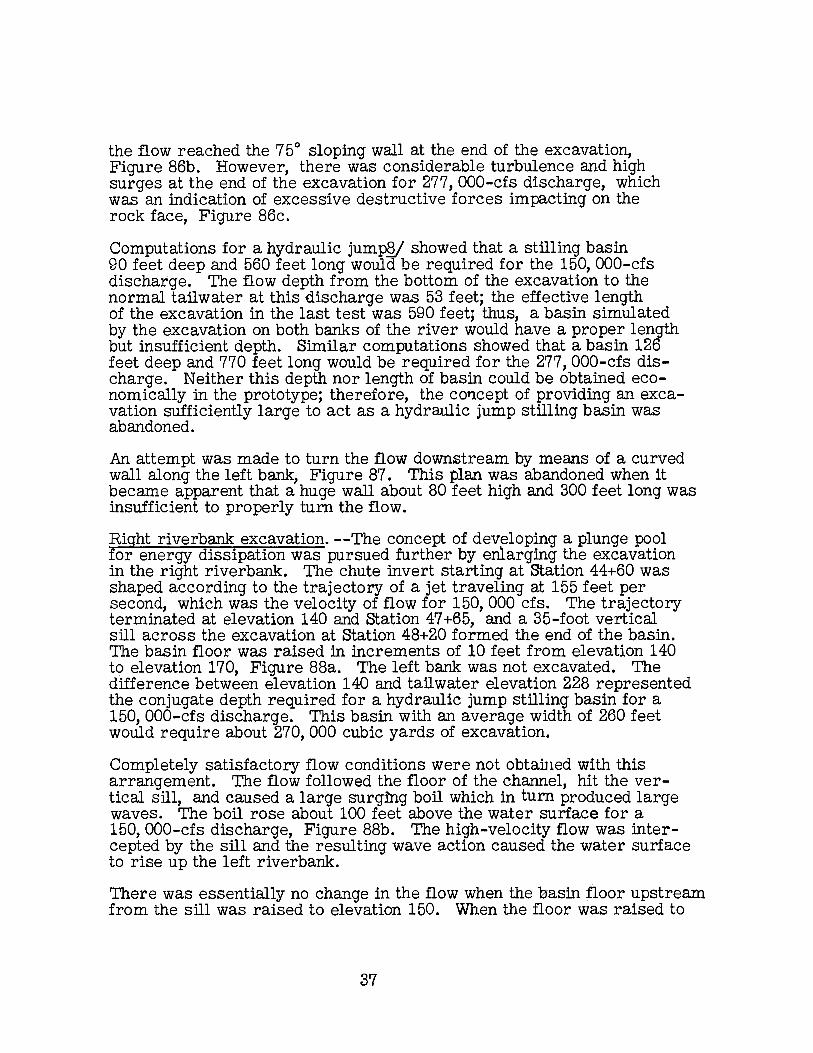
the flow reached the 75° sloping wall at the end of the excavation, Figure 86b. However, there was considerable turbulence and high surges at the end of the excavation for 277, 000-cfs discharge, which was an indication of excessive destructive forces impacting on the rock face, Figure 86c.
Computations for a hydraulic jump§/ showed that a stilling basin 90 feet deep and 560 feet long would be required for the 150, 000-cfs discharge. The flow depth from the bottom of the excavation to the normal tailwater at this discharge was 53 feet; the effective length of the excavation in the last test was 590 feet; thus, a basin simulated by the excavation on both banks of the river would have a proper length but insufficient depth. Similar computations showed that a basin 126 feet deep and 770 feet long would be required for the 277, 000-cfs discharge. Neither this depth nor length of basin could be obtained economically in the prototype; therefore, the co11.cept of providing an excavation sufficiently large to act as a hydraulic jump stilling basin was abandoned.
An attempt was made to turn the flow downstream by means of a curved wall along the left bank, Figure 87. This plan was abandoned when it became apparent that a huge wall about 80 feet high and 300 feet long was insufficient to properly turn the flow.
Right riverbank excavation. --The concept of developing a plunge pool for energy dissipation was pursued further by enlarging the excavation in the right riverbank. The chute invert starting at Station 44+60 was shaped according to the trajectory of a jet traveling at 155 feet per second, which was the velocity of flow for 150, 000 cfs. The trajectory terminated at elevation 140 and Station 47+65, and a 35-foot vertical sill across the excavation at Station 48+20 formed the end of the basin. The basin floor was raised in increments of 10 feet from elevation 140 to elevation 170, Figure 88a. The left bank was not excavated. The difference between elevation 140 and tailwater elevation 228 represented the conjugate depth required for a hydraulic jump stilling basin for a 150, 000-cfs discharge. This basin with an average width of 260 feet would require about 270,000 cubic yards of excavation.
Completely satisfactory flow conditions were not obtained with this arrangement. The flow followed the floor of the channel, hit the vertical sill, and caused a large surgmg boil which in turn produced large waves. The boil rose about 100 feet above the water surface for a 150, 000-cfs discharge, Figure 88b. The high-velocity flow was intercepted by the sill and the resulting wave action caused the water surface to rise up the left riverbank.
There was essentially no change in the flow when the basin floor upstream from the sill was raised to elevation 150. When the floor was raised to
37
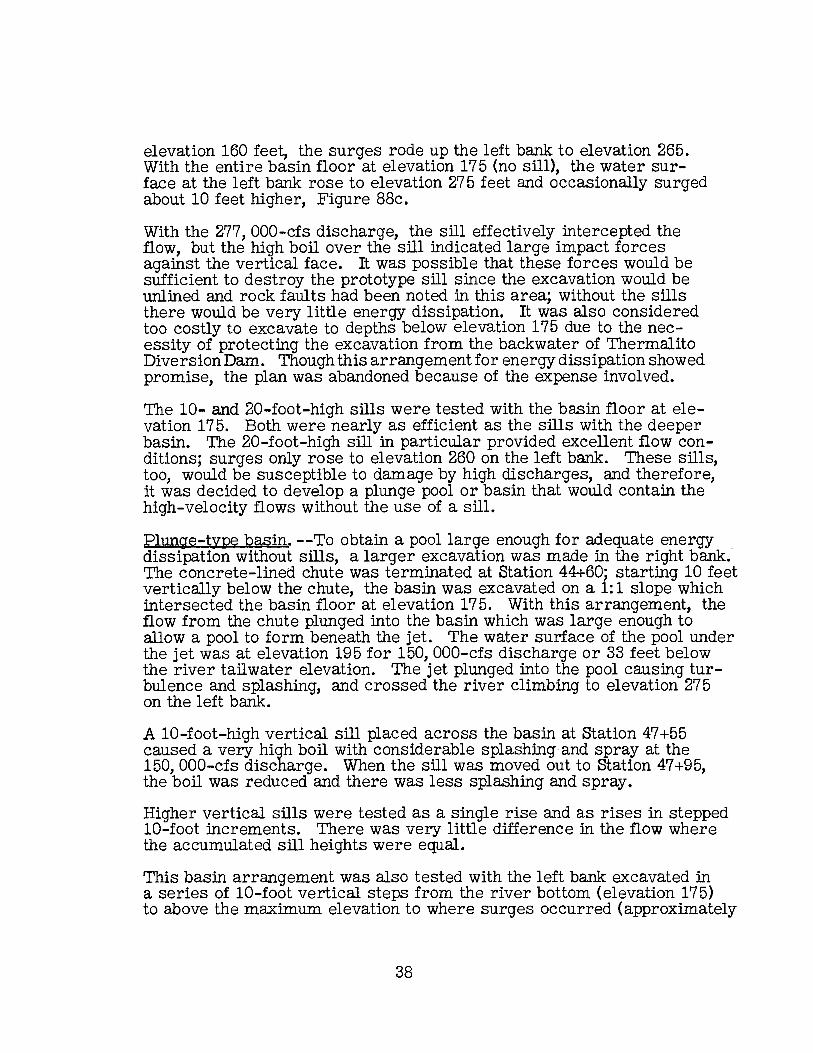
elevation 160 feet, the surges rode up the left bank to elevation 265. With the entire basin floor at elevation 17 5 (no sill), the water surface at the left bank rose to elevation 27 5 feet and occasionally surged about 10 feet higher, Figure 88c.
With the 277, 000-cfs discharge, the sill effectively intercepted the flow, but the high boil over the sill indicated large impact forces against the vertical face. It was possible that these forces would be sufficient to destroy the prototype sill since the excavation would be unlined and rock faults had been noted in this area; without the sills there would be very little energy dissipation. It was also considered too costly to excavate to depths below elevation 1 75 due to the necessity of protecting the excavation from the backwater of Thermalito Diversion Dam. Though this arrangement for energy dissipation showed promise, the plan was abandoned because of the expense involved.
The 10- and 20-foot-high sills were tested with the basin floor at elevation 175. Both were nearly as efficient as the sills with the deeper basin. The 20-foot-high sill in particular provided excellent flow conditions; surges only rose to elevation 260 on the left bank. These sills, too, would be susceptible to damage by high discharges, and the ref ore, it was decided to develop a plunge pool or basin that would contain the high-velocity flows without the use of a sill.
Plunge-type basin. --To obtain a pool large enough for adequate energy . dissipation without sills, a larger excavation was made in the right bank. The concrete-lined chute was terminated at station 44+60; starting 10 feetvertically below the chute, the basin was excavated on a 1: 1 slope which intersected the basin floor at elevation 17 5. With this arrangement, the flow from the chute plunged into the basin which was large enough to allow a pool to form beneath the jet. The water surface of the pool under the jet was at elevation 195 for 150, 000-cfs discharge or 33 feet below the river tail water elevation. The jet plunged into the pool causing turbulence and splashing, and crossed the river climbing to elevation 27 5 on the left bank.
A 10-foot-high vertical sill placed across the basin at Station 47 +55 caused a very high boil with considerable splashing and spray at the 150, 000-cfs discharge. When the sill was moved out to Station 47+95, the boil was reduced and there was less splashing and spray.
Higher vertical sills were tested as a single rise and as rises in stepped 10-foot increments. There was very little difference in the flow where the accumulated sill heights were equal.
This basin arrangement was also tested with the left bank excavated in a series of 10-foot vertical steps from the river bottom (elevation 175) to above the maximum elevation to where surges occurred (approximately
38

elevation 300). The stepped riverbank did not reduce the height to which the flow climbed the left bank.
Flip buckets. --Early in the energy dissipation studies, a flip bucket was placed across the full width of the chute at Station 42+40. (Stations refer to the downstream end of fli~ buckets.) The bucket angle was adjusted and tested from 30° to 50 above the invert, and the best flip angle was found to be 40°. This type of flip bucket did not provide satisfactory energy dissipation. The flow was very concentrated at impact, and could not be efficiently stilled by the shallow pool in the river. The water climbed the left bank to about elevation 260 at 150, 000 cfs, and to about elevation 360 for 277, 000 cfs, Figures 89a and b.
It seemed that more effective use could be made of the excavated area at the end of the chute if the spillway jet were made to land at a steep angle further out near the river. This could be accomplished by means of a flip bucket that would lift the flow above horizontal and direct it toward the middle of the excavated plunge pool area. The flip bucket studies were resumed to develop this means of energy dissipation. These studies were made with the 150, 000-cfs discharge and tailwater elevation 228.
Three 30-foot-wide flip bucket sections were equally spaced across the chute at Station 42+40 with a space adjacent to the sidewalls. The flip buckets were adjustable so that the vertical angle could be changed and the bucket lip could be rotated to provide a slope either toward or away from the chute centerline. This arrangement divided the flow such that 50 percent was lifted so that it was spread longitudinally and impinged at different angles, and the remaining flow followed the chute slope. The fl.ow was well dispersed with some spray. The best bucket angle was 40° upward and 15° laterally from the centerline as evidenced by adequate spreading and good distribution of the flow in the area of jet impact. The surging up the left riverbank reached elevation 270. A bucket lift angle of 25° concentrated the jet and increased the surging up the left bank. The same arrangement was tested with the buckets at Station 44+60. This location was too far down the chute and the jet struck the left riverbank with considerable force.
Different flip bucket widths and different angles of lift and lip rotation were tested at several locations on the chute, but the best flow conditions were obtained with the first arrangement described. A wedgesI-:taped solid sill shaped similar to a plow was tested at Stations 42+40 and 44+60, Figure 90a. Lift angles of 30° and 45° were tested. Either sill produced good lateral dispersion but poor longitudinal distribution, causing the surge up the left riverbank to reach elevation 290 to 310. A 20-foot.-wide slot was cut on either side of the centerline to allow some
39

flow to pass down the chute to increase the longitudinal distribution, Figure 90b. Flow conditions were not substantially improved.
These tests indicated that better flow dispersion in both lateral and longitudinal directions would be obtained if the flow were deflected with a number of smaller deflectors rather than a deflector that extended across the chute.
Chute blocks. --Three sizes of wedge-shaped blocks were tested with various arrangements on the chute. A block 44 feet long by 23 feet high by 10 feet wide provided the best deflection of the jet; the best configuration for dispersion was five blocks equally spaced at Station 44+60 and four blocks alternately spaced at Station 43+50, Figure 89c. This arrangement produced a well-dispersed jet which greatly improved the flow in the basin over any previous arrangement. The maximum water surface at the left bank was at elevation 260. This arrangement was also tested with a 26-foot-high sill placed across the plunge pool invert at Station 48+50. With the sill in place, the water surface at the left bank rose only to elevation 240, Figure 89c.
One side of the 44- by 23-foot blocks was flared outward 15° and placed such that the flared sides were on the outboard side of the chute. Four blocks were equally spaced at Station 43+50 and five blocks at Station 44+60. The center block in the lower row was flared on both sides; the blocks adjacent to the sidewalls were not flared. The flow was well dispersed both laterally and longitudinally with this arrangement, and the maximum water surface at the left bank rose to elevation 250.
The four blocks, with the 15° flared sides in the upstream row, seemed to deflect most of the flow; therefore, the blocks in the second row were removed. The four blocks in the upstream row, Station 43+50, were turned so that their sides were 23° away from the chute centerline. Although this arrangement adequately distributed the flow both laterally and longitudinally, the fl.ow was concentrated in the center and at third points in the basin, which could be attributed to too great an angle of block turn. The water surface at the left bank had a long-period fluctuation between elevation 240 to elevation 260.
The top corner of the block that was turned into the flow caused the flow sheet to separate, which added to the flow concentration. Chamfering this corner eliminated the separation, resulting in a more or less continuous sheet of fl.ow leaving the block. The flow conditions in the basin were not changed by this modification.
A third type of block was tested which was triangular in all planes. These blocks were 37 feet long by 22 feet wide by. 29 feet high. The two outside
40

blocks at Station 43+50 of the previous arrangement were replaced with these new blocks, Figure 90c. The blocks improved the flow dispersion and reduced the turbulence in the basin. The water surface at the left bank fluctuated between elevation 240 and 245. Four of these blocks placed at Station 43+50 turned the flow effectively but caused four high fins to form that concentrated the flow and caused excessive turbulence in the basin.
Six wedge-shaped blocks 44 feet long and 23 feet high and 6 feet wide were symmetrically spaced at Station 43+50 on the chute; the blocks were turned outwar.d 23° from the centerline. This arrangement produced excellent flow conditions in the basin. The water surface rose to elevation 240 at the left bank. These blocks, however, were too thin to be structurally sound enough to resist the forces of the highvelocity flow.
Several other arrangements and sizes of blocks (such as the "Pyramid" blocks, Figure 90d) were tested, but none showed any promise of providing better flow conditions than were obtained with the wedge-shaped blocks.
Chute end sill. --A solid end sill was placed on the chute that made the floor horizontal from Station 44+20 to 44+60. On top of the sill five 13-foot-high by 40-foot-long wedge-shaped blocks were evenly spaced with spaces at the sidewalls. This arrangement created extremely poor flow conditions in the basin, and surges rose up the left bank to elevation 300~ With 16- by 40-foot blocks on the sill, the flow was still too turbulent; the surges on the left riverbank rose to elevation 275 and constantly submerged the railroad bed. A row of five 23- by 44-foot blocks were added at Station 43+50, but poor flow conditions still persisted. Flow rose up the left bank to elevation 270 with surges to elevation 280. Twenty-three- by forty-four-foot blocks in both locations imprbved the flow appearance in the basin. The water surface at the left bank was at elevation 260 with surges to elevation 265. Considerable splashing and spray originated at the blocks.
A third row of five 23- by 44-foot blocks was added to the chute at Station 42+40. The flow in the basin was more turbulent and the left bank surges rose to elevation 270.
The end sill was removed, leaving only the upper two rows of blocks. The flow was still poor; the impact point of the jet shifted upstream and increased the turbulence in the basin and the downstream flow velocity in the river; surges reached elevation 27 5 on the left bank.
These tests indicated that a dentated end sill would not improve flow conditions.
41
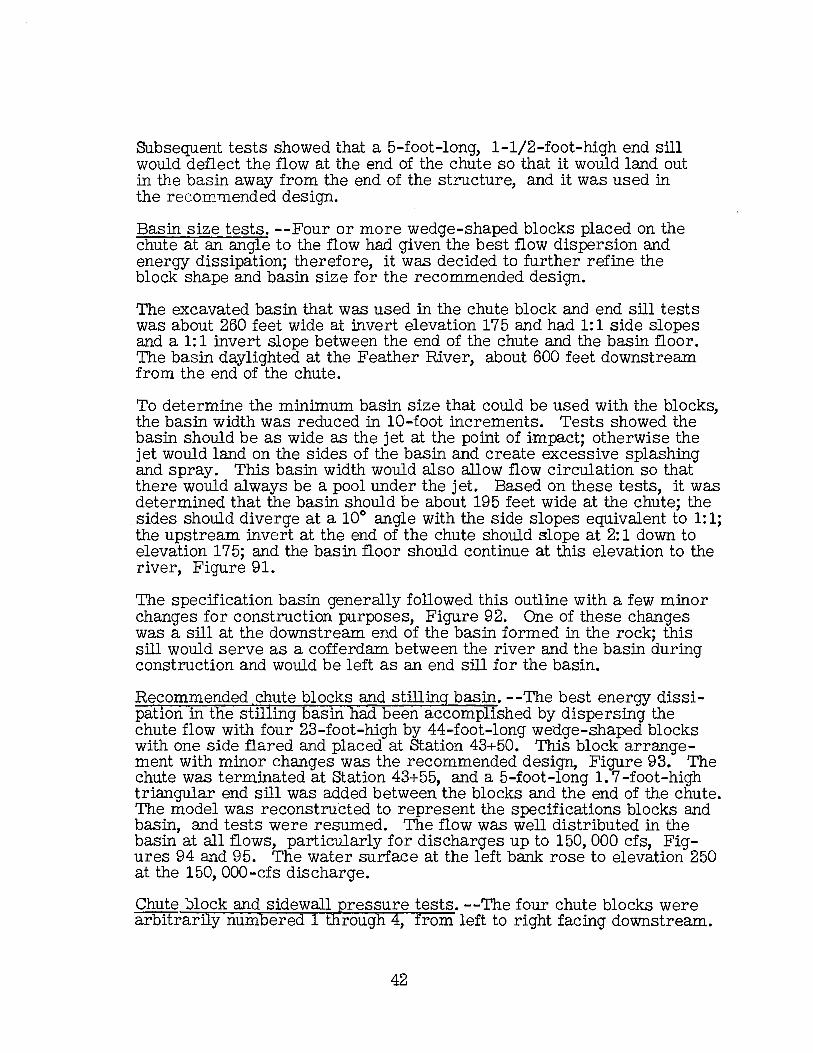
Subsequent tests showed that a 5-foot-long, 1-1/2-foot-high end sill would deflect the flow at the end of the chute so that it would land out in the basin away from the end of the structure, and it was used in the recommended design.
Basin size tests. --Four or more wedge-shaped blocks placed on the chute at an angle to the flow had given the best flow dispersion and energy dissipation; therefore, it was decided to further refine the block shape and basin size for the recommended design.
The excavated basin that was used in the chute block and end sill tests was about 260 feet wide at invert elevation 17 5 and had 1: 1 side slopes and a 1: 1 invert slope between the end of the chute and the basin floor. The basin daylighted at the Feather River, abo1J.t 600 feet downstream from the end of the chute.
To determine the minimum basin size that could be used with the blocks, the basin width was reduced in 10-foot increments. Tests showed the basin should be as wide as the jet at the point of impact; otherwise the jet would land on the sides of the basin and create excessive splashing and spray. This basin width would also allow flow circulation so that there would always be a pool under the jet. Based on these tests, it was determined that the basin should be about 195 feet wide at the chute; the sides should diverge at a 10° angle with the side slopes equivalent to 1: 1; the upstream invert at the end of the chute should slope at 2: 1 down to elevation 175; and the basin floor should continue at this elevation to the river, Figure 91.
The specification basin generally followed this outline with a few minor changes for construction purposes, Figure 92. One of these changes was a sill at the downstream end of the basin formed in the rock; this sill would serve as a cofferdam between the river and the basin during construction and would be left as an end sill for the basin.
Recommended chute blocks and stilling basin. --The best energy dissipation in the stilling basin had been accomplished by dispersing the chute flow with four 23-foot-high by 44-foot-long wedge-shaped blocks with one side flared and placed at Station 43+50. This block arrangement with minor changes was the recommended design, Figure 93. The chute was terminated at Station 43+55, and a 5-foot-long 1. 7-foot-high triangular end sill was added between the blocks and the end of the chute. The model was reconstructed to represent the specifications blocks and basin, and tests were resumed. The flow was well distributed in the basin at all flows, particularly for discharges up to 150, 000 cfs, Figures 94 and 95. The water surface at the left bank rose to elevation 250 at the 150, 000-cfs discharge.
Chute ~lock and sidewall pressure tests. --The four chute blocks were arbitrarily numbered 1 through 4, from left to right facing downstream.
42

Thirty-nine piezometers were installed in critical areas of a sheet metal block and in the left sidewall adjacent to the blocks, Figure 96. The piezometer locations were chosen to represent areas of high impact pressures and where subatmospheric pressures might occur. Pressures were observed in Blocks 1 and 2 for all discharges through 277, 000 cfs to detect any possible subatmospheric conditions. Pressures were recorded for seven representative discharges as shown on Figure 97. With the exception of pressures at Piezometers 20 and 21 in Block 1, all pressures were either near or above atmospheric. The highest pressure recorded was 180 feet of water (prototype) at Piezometer 15 for 277, 000-cfs discharge. Piezometer 15 showed consistently the highest pressure readings throughout all tests.
Extreme subatmospheric pressures occurred at a discharge of about 18, 500 cfs in the area around Piezometers 20 and 21. Pressures were measured for discharges from zero to 25, 000 cfs at Piezometer 20, Figure 98. The pressure dropped below atmospheric as flow started and reached a minimum of about 24 feet of water below atmospheric at 18, 500 cfs; higher discharges raised the pressure toward atmospheric and the pressure remained atmospheric from 25, 000-cfs up through 277, 000-cfs discharge. The pressures at Piezometer 15, in the high impact pressure area, were also recorded on Figure 98 for comparison. The pressures at these piezometers were identical in Blocks 1 and 2.
The subatmospheric pressures in the region around Piezometers 20 and 21 could be alleviated by aerating this area, Figure 99. Aeration was accomplished by disconnecting a piezometer and allowing air to enter through the piezometer opening; its effect on the other piezometers was then noted. The most effective aeration was obtained by supplying air through Piezometers 20 and 23, which were farthest upstream in this area.
Several other methods of aerating the region were also tested. A groove which simulated a 6-inch-diameter half round pipe embedded just below the top edge on the downstream side of the block was extended into the low pressure region. The groove filled with water and provided only intermittent aeration, which would allow areas on the chute floor adjacent to the low pressure region to remain subatmospheric.
The corner of the block that was subject to the severe subatmospheric pressure was modified so that there would not be an offset away from the flow. This was done by extending the sloping surface of the block until it protruded into the flow, Figures 100 and 102. Piezometers in locations similar to those in the block before the corner modification indicated that all pressures were nearly atmospheric or above, Figure 101.
43

Pressures in Block 2 were very close to those recorded for Block 1 for all discharges, except at Piezometer 12 where highly subatmospheric pressures occurred, Figure 103. The pressure at this piezometer began to drop below atmospheric at 1001 000 cfs, reached a minimum of 24 feet below atmospheric at about 190, 000 cf s, and at 200, 000 cfs began to rise, reaching atmospheric at about 250, 000 cfs.
Tests were continued on the chute block to improve the pressure conditions at Piezometer 12. Preliminary tests indicated that the pressure at this piezometer was a function of the angle of the chamfered surface with the top or s~de of the block. This angle was changed by varying the end height of the vertical side of the block and keeping all other block dimensions constant. Pressures were obtained at piezometers that were affected by these modifications, and it was determined that the best pressure conditions were obtained with a 16. 25-foot vertical height, Figure 104. Slight discrepancies occurred in the pressures observed in the wood and steel blocks; pressures observed on the steel block were considered reliable because ·the piezometers were more accurately placed.
The pressures on Blocks 3 and 4 were assumed to be identical to the pressures on Blocks 1 and 2, since the blocks are symmetrical about the chute centerline and the flow is essentially uniform across the width of the chute. ·
A test was also made at 150, 000 cfs with the outlet gates controlling the reservoir water surface to elevation 901 and pressures were recorded for Block 2. These pressures were generally from 2 to 4 feet higher than those recorded for the same discharges with the gates fully open. Those pressures that were atmospheric remained atmospheric.
Air demand was checked on the end and downstream side of the No. 2 chute block. To measure the airflow two half-inch {model) diameter air vents, shown as A and B in Figure 96, were connected by a flexible tube to a 2. 25-inch-diameter by 3-inch-long air chamber with removable orifice plates in one end. A range of four orifice plates from 1/16 to 3/8 inch were used. There was no airflow toward the chute block at any discharge.
Pressures were recorded along the chute sidewall adjacent to the blocks, Figure 105. The water-surface profiles along this area of the sidewall for 150, 000- and 277, 000-cfs discharges are also shown on the piezometer location drawing, Figure 96. The highest pressures recorded were at Piezometers 36 and 39. These piezometers are about 1. 5 feet above the chute floor, adjacent to and just upstream from the corner of the chute block. Pressures equivalent to about 40 feet of water or about four times hydrostatic pressure were recorded at 150, 000-cfs discharge. Pressures were equivalent to about 70 feet of water, or five times the hydrostatic pressure at 277, 000-cfs discharge.
44

Feather River erosion tests. --The flow from the plunge basin split at the left riverbank and part of it moved upstream. This upstream flow caused a large eddy to form that might interfere with the powerplant operation. A wall normal to the river was constructed on the left bank 370 feet upstream from the chute centerline, Figure 106. The wall was 170 feet long with its top at elevation 228. Tests were run at outlet discharges up to 277, 000 cfs to determine the effectiveness of the wall; a powerplant discharge of 13,000 cfs was flowing in the river· for all tests.
The wall turned the flow at 50, 000-cfs discharge and confined the eddy between the wall and the basin. At 7 5, 000 cfs the flow overtopped the wall and a mild eddy formed and extended about 150 feet upstream from the wall. The strength and size of the eddy increased at 100, 000-cfs discharge; when the flow was increased to 150,000 cfs, the flow over the wall became highly turbulent with a large eddy moving about 300 feet upstream along the right bank, moving rock about 8 feet in diameter.
The top of the wall was raised 8 feet at the left end and sloped down to a 3-foot increase in height on the right end. The higher wall eliminated the strong upstream eddy for all discharges up to 150,000 cfs. However, at 150,000 cfs, the flow along the wall caused a large amount of erosion along and just downstream from the wall, Figure 106. The erosion in this area was about 30 feet deep and took place in about 9 hours. This severe erosion precluded the use of the wall to· reduce the eddying action.
To determine what would happen to the overburden that would be removed by the water flowing along the left bank, a sedimentation test was performed by introducing sand at the edge of the water at the left bank. The. sand was placed along the bank or just under the. water surface opposite and upstream from the impact area. In a time period equivalent to about 18 hours prototype, 120,000 yards of sand was added to the model while the discharge was maintained at 150,000 cfs. The sand moved into a bar upstream and nearly blocked the river channel, but left a sufficient channel that the powerplant flow was not backed up, Figure 107.
Tailwater interference. --Tests were run to determine what effect the flood control outlet discharge would have on the Feather River tailwater elevations. The tests were made with and without 13, 27 5-cfs powerplant flow in the river and outlet discharges from 50, 000 to 150, 000 cfs. Tailwater elevations were measured at points 1,400 feet downstream (Station 2) and 900 feet upstream (Station 1) from the chute. The results are summarized in the following table:
45
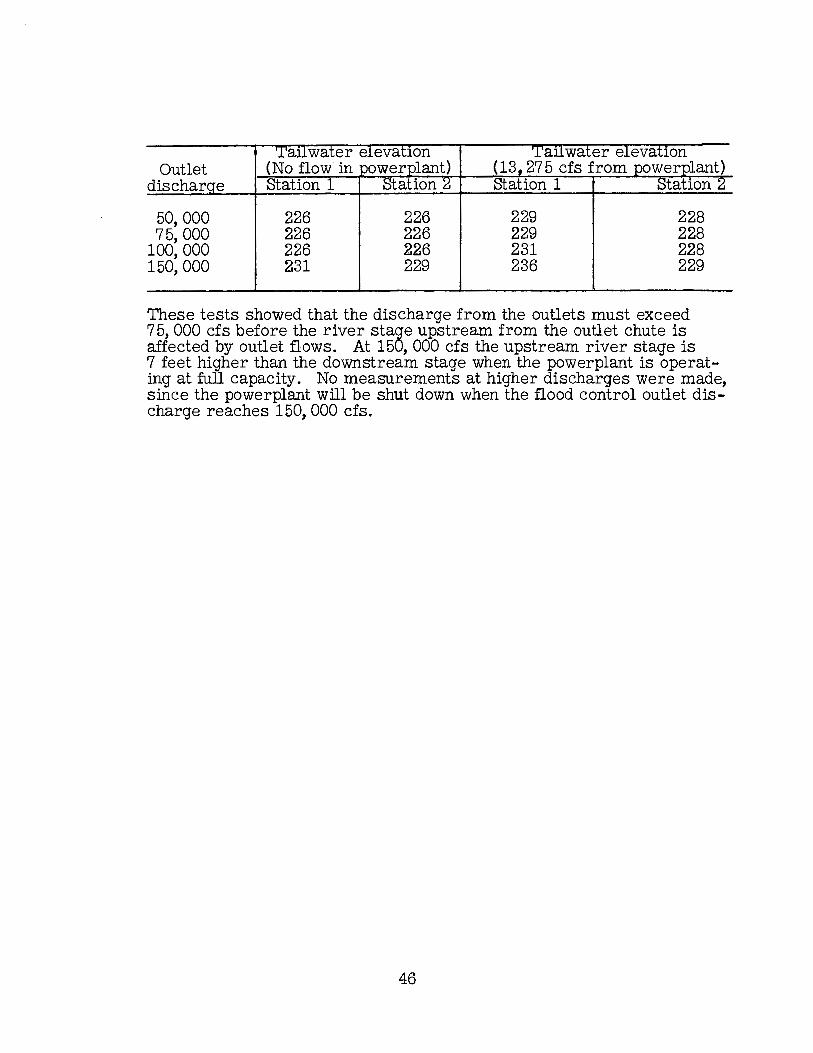
Outlet dischar e
50,000 226 226 229 228 75,000 226 226 229 228
100,000 226 226 231 228 150,000 231 229 236 229
These tests showed that the discharge from the outlets must exceed 7 5, 000 cfs before the river stage upstream from the outlet chute is affected by outlet flows. At 150, 000 cfs the upstream river stage is 7 feet higher than the downstream stage when the powerplant is operating at full capacity. No measurements at higher discharges were made, since the powerplant will be shut down when the flood control outlet discharge reaches 150, 000 cfs.
46

BIBLIOGRAPHY
1. "Hydraulic Model Studies of the Diversion Tunnels for Oroville Dam," Simmons, W. P., Report No. Hyd-502, 1963, U.S. Department of the Interior, Bureau of Reclamation
2. "Hydraulic Model Studies of the Draft Tube Connections and Surge Characteristics of the Tailrace Tunnels for Oroville Powerplant," Simmons, W. P., Report No. Hyd-507, 1963, U.S. Department of the Interior, Bureau of Reclamation
3. "Hydraulic Model Studies of the River Outlet Works at Oroville Dam, 11 Colgate, D., Report No. Hyd-508, 1963, U.S. Department of the Interior, Bureau of Reclamation
4. 11Hydraulic Model Studies of the Penstock Intake Control Structure for Oroville Dam, " Colgate, D., Report No. Hyd-509, 1963, U.S. Department of the Interior, Bureau of Reclamation
5. "Hydraulic Model Studies at Downpull Forces on the Oroville Dam Powerplant Intake Gates, " Bucher, K. G., Report No. Hyd-540, 1964, U. S. Department of the Interior, Bureau of Reclamation
6. "Hydraulic Model Studies of the Pressure Relief Panels in the Powerplant Intake Structure, 11 Colgate, D., Report No. Hyd-549, 1965, U.S. Department of the Interior, Bureau of Reclamation
7. "Entrances to Conduits of Rectangular Cross Section-Investigation of Entrances Flared in Three Directions and in One Direction, 11
Technical Memorandum No. 2-428, Report 2, June 1959, U.S. Army Engineer Waterways Experiment Station, Corps of Engineers, Vicksburg, Mississippi
8. 11Hydraulic Design of Stilling Basins and Energy Dissipators, 11 Peterka, A. J., Engineering Monograph No. 25, 1964, U.S. Department of the Interior, Bureau of Reclamation
47

T.21 N.
T.2ON.---
·, l!Jl,J...-t-11--r---
I
R.3E.
1 I I
--, -1-----1 I
' - r----' I
I I
I
---+---1 I I
---1-- -I I I
----1----1 I I
----1
R.5E.
FIGURE I REPORT HYD-510
I --- 1 ____ ,_
I
I I I ' I I I
- - _L __ ~1----+- -_ _: __ : I I I
EUREKAD PRO.JEC T ARE A
OROVILLE
I SACRAMENTO 41i
I I I --r-..: I I
I ---i--1
I : __ _j _____ _,_ __
I I I I I I ~ r --~:---v--r--t-1 1 1 I :
- - - - .J . - - - r _. - -- .; _ - - -:- . --· - 1 - -I I : ' I
I I I
OROVILLE DAM VICINITY MAP
0
SCALE OF MILES
SAN
LOCATION MAP
I r I
--....J.- ----+---·----! I
: I I
- -- --+ - •
I
I I I I '
- -f-- ---t---~ --~..: I I
----+--1 I
-----i--
A.6E.

\ . ~-LLl~ t \/
r • .,,>7_ - U:-,1. .1.-~ \
/ I
" " . c:, .,
f),p cc "--- "' / _) u f j % ----r~----- I \t'1~,-! / ~ ' - ~ --- """-:--.. _, I t\i_ \
I ~ ,_ \ ~,, '
flffiJ 11 1Jk?r:6?1 ; ; i '·~-:~_ \ - & (__~ ,_ \
___ , , FIGURE 2
REeoRT HYD-~IQ
Or/9ino/ ground 1,ne
J/or~s
£ SPILLWAY CHANNEL
TYPICAL SECTION
-----~ ----~ ' ',,
~ " ~
\ ~
Between Sta 44+1710 onQ lhe river bank ---·---·
-..,__ ·-. Sco/e:1;50·
--.______ 4-47.Sx.UA"IDmofic,,lly~/ / OJJera!~cl roo'/o/ oq/'e.s --, _..,.
( ~ 7 --_
I -er / '\ Irr~
1000 I I i
\ ( I Jv-\ !!/
f// I
·-----··
. "' ~~ \i
\ /~) PLAN -~
~ c:,
. ~
Scale: I,,, • ZOO'
Limifs ol' pc,rf/ollv lined secflon
& (
~\ ,,.----Joo-._____ ~ 'b ,/ ,~.,,~.,·--·~-..--,·- .,,. ~~ . , --- - -~-- ---
J_,." ~--- ',"-./'
'--.__/--...
' ' ~
Open cuf cha1ne/
BOOr~ 1; I
,:: I r----'----L_____ ---- ----'~=-i-J:::::'~ £.ep,tl' <:> ~---+--+----!..-
; - -"cl ,:-, ~~~-- - """'j::'::t:"'-:::-:::-j:~~~¾,~~'::E.~~~~:'._-~--J ~ j---~---------600
~ t
-~ i 400
~ lo,j
i - -- -- --L ----- . :::.2:.:_·:.::_,).. --- ~ 1
r---1,-;_,:-___ :;:~::,~ .. :-:-= .. -r~~-~-~--f~=:=:r~~t'.~~~~~~::=t~~~i:;gJ.=. zoo
0 JT'q oroo
_L _________________ ---r---t--+·----+-_j__j -·,-~---h.
I I I I I I I ~I I I I I I ~I I I I I!. L ----~-- ---/,5<1-t)O zo.,.oo 2$.,.00 ,o.,.oo Js,-oo 40.,-00 4s--roo
·--~---......,--... -~ .. -- ..... -
5.,.00 /0.,00
/ ,,-·~ .•.• . >"'··
4
L-& 4
DETAIL "z" _J
SECTION A-A
• ..... , ... _···----.. ... /1>-, No scol~
··,.,_
S:Q1.e81 ~ ~~ ---~~--.,
PROrll.£, Jcok, /"• ZOO'
........ ~ -~,."",
. .,_,_ ,., ~--- ...
-, &, "-,
\
\ Angle fo be clelerm,,-,ed by Tesfs \ - \
11:::.
&
I I '
FLIP BUCKET DET:AILS Scale 1'..20'
-------------~---------
·--...
/,!,
--- - >,-~-- ·-1- ,, ___ _
Soro"
DM-8. KOrANf Z. WILLIAM$
-•·-· ---...... ,,.
··------S$1'00
·-... ...,._,. __ r.,.._,....,..._,.~
Or1g/no/ ground line
&
SPILLWAY CHANNEL
TYPICAL SECTION U,10
Between Sta l6Tc;t::::::!J::!z to Sta. 44+(7.l0
Scole:J~-50'
:,_\
& Q•/50,000 C-~ $ 9•650, 000 c.~•-
Stal/on Wolt!r depl-n Ur11'"ngdepth in l'e~I- n /'Bet d-tf J/-l'ps
15+00.00 5 10 21 66
'ui1201 9 14 35 106 29-roo.oo 8 13 30 127
i-------:--:- ---se,oo.oo 7 12 24 153 44-rOQOO 7 /2 24 /(J,3
/• .. zo=-o-- 0~
l"•..1'tJ'-O"' "1 z:'-'f1'.ro
~ :!11:
--==='f-
~
~
r .. 200· q_so_~___E!!!_ ~ ~""
auaMrrn:D:
SCALE or FEET
STATE OP CAUl'ORNlA
Rl:SOURCES AGENCY OF CALIFORNIA DEPARTMENT OF WATER RESOURcq
DIVISION OF DESIGN AND CONSTRUCTION
ut-<OVILLE SPILLWAY GENERAL ARRANGEMENT PLAN, PROFILE AND SECTIONS
APPltOVl:D, DA~
APNIOYAL flECOMMIENDaD:
AppftOVAL fllECOMMIENDIED: ... 4iO~"EM-2 ShlEIETNO.
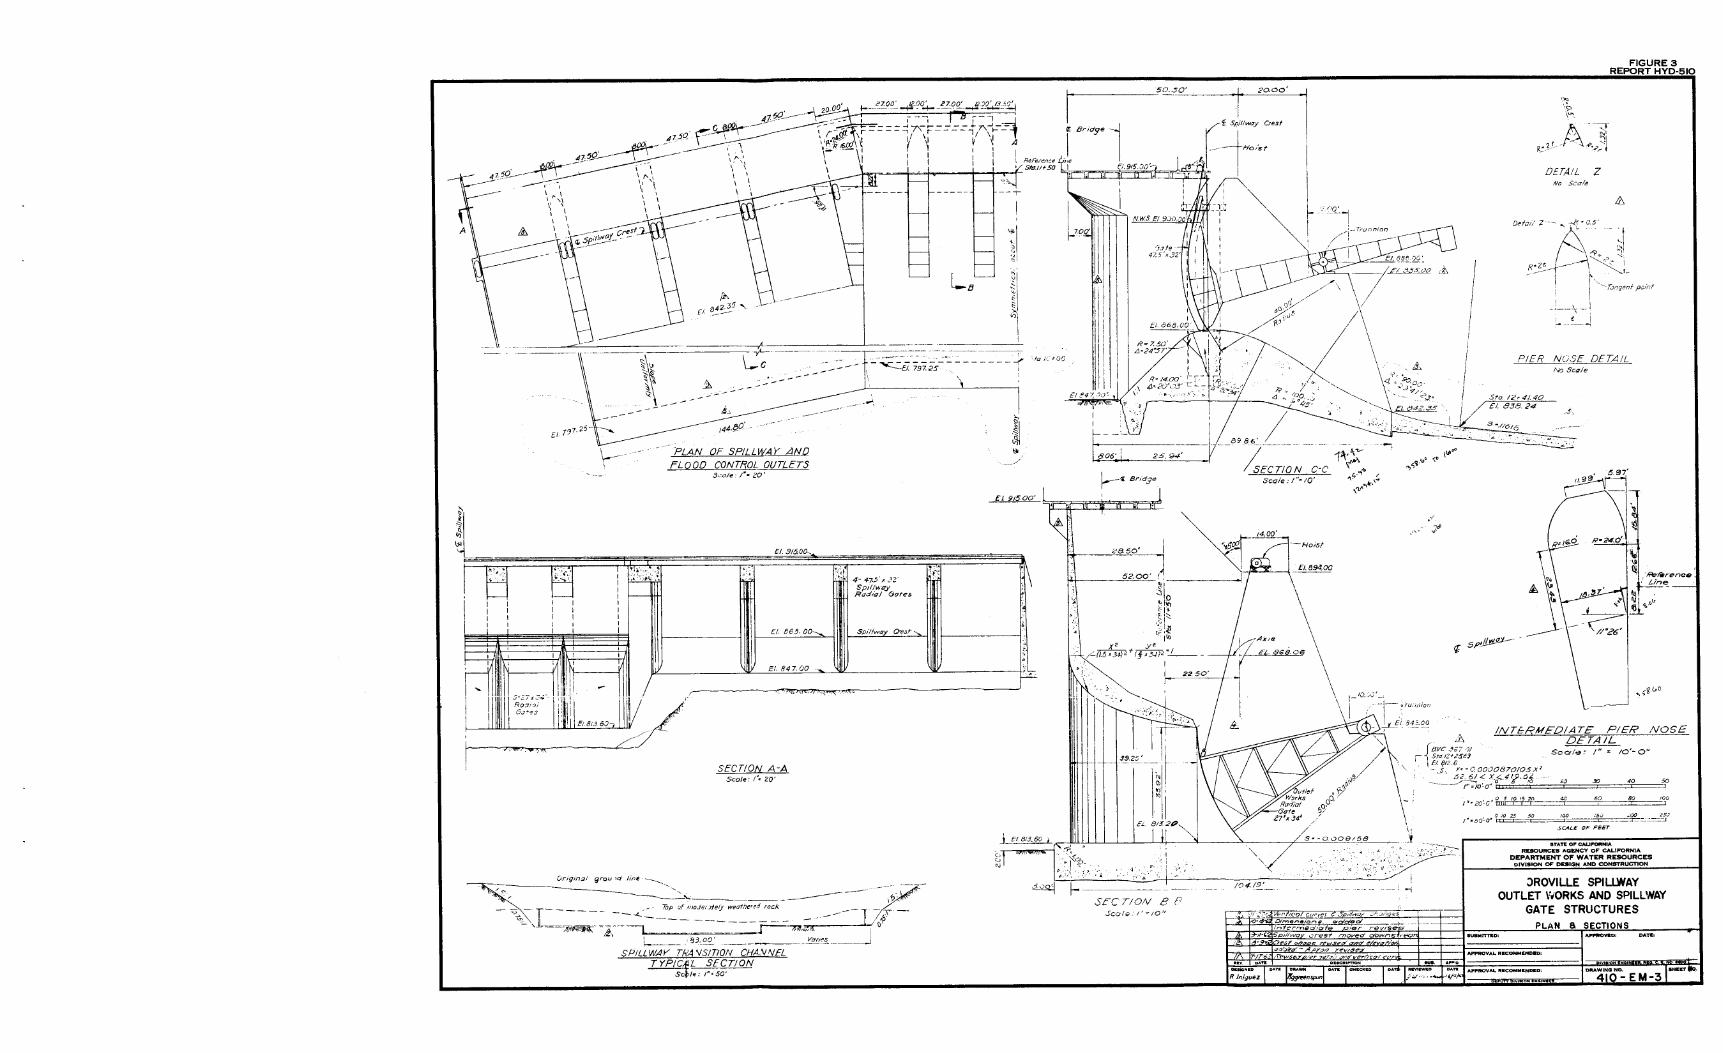
. . C a.()'.)_i_. 47a5.9~·_;,, 20~· I- 27.W _..,,_ -""' r-='1- - -~ ~ ---#"""- "'' ___,_, ,qe-----l"i-_.,,,.,,__-~ -~- \ !- ~J :; = - - ..r -, --~~~U:.'c:5.tj ---------------- ', . \ ' ' ',,,,,_. \, - - " 7'-' - - - ' . ==i'
' , ,,' •'-', '\~R!61Xf I 11 ,r----=--f7'.-'--\, , ',• •\ ', • , II / j { ,,-! '\ ', \ \ , j 1' I 1 ~ A
' ' ' ' ' ' I
' ' ' ' '
&,
-----I I I \ \-----------------
.. <I,Spitl-'of cr"!1J .-~-·
Lll
·---
~I ~I
ii ~I ~
" ;;,.
I I
+- t --- . . _/ ~~ . ----- \ \. ~~ Le ·_.:/ -~ii"'i9z2s _________ ,
;· ~ -------
\---1
Q - ------- ------- ·-", --- lh
PLAN OF SPILLWAY AND
FLOOD CONTROL OUTLETS 3i.::ale: ;",. 20'
" i Ila
I 50 . .50' I 20.00' I
It: Br,dge I ~'f Sp1l/way Crest
I --tHo,st Re Fe, ence ne sto.11,so~ F191o:,o·-~
·1a 1:_--,.00
' r:-tH1 11 I - - I
~
-- ___ft t} -~ 8. 0 C '
-/D ;,,-;~o • //\\ I -"~
k0
0?,,./ / uS ;
/ I'- / , I ~>( 4~_:00 ~· ----~
~,:,<-'s:: ~
~
8986._I __ __ __ _ --,
1------·<l Bridge
I 111,"-...... /SECTION C-C r,.
Scale:/'',,. 10' "'b,"l tc- ,.; \'i"'"' .
,., .. ,,,~.l.&r, -co\
f:I 91500'
'"' -.a i"'.
,;, A··-:i·
rl* ?f ~ ~ ,f'. ~i r-.--- ~.;>_,,
DETAIL Z No Sca/e
FIGURE3 REPORT HYD-510
ID.
__ ../l•OS _
Defm/ Z ~:; ··c . !
P :;;\ .,,
~,;,·.,. "i
Zt, L R" ----- I
---- l·",.T,.:H7oenf pvii;f
I . l
~ __ _:____,i
PIER NCSE DETAIL
Sta. /2,-41.40
/ £/. 83824
~616
No Sc,,ie
.s ..
5.97'
ra .'} \:II
-.::a:=. El. .91500~.
2850~ "-,! f!i:'¢ ! £1.894.00
--Holst
,,. )di
... '11\1
'!': ~ ~ .~·~ 4- 4-7,,5','(32·
SpJ//w<1y Rad/a/ Gores
E/865.00>, j\ffl\j Spillway O,,s.~
El. 847. 00
L .. ,_,,,,_ ·'II:' IIIV1/· . Ro'Yt:11 1: I j ,
I 11~1 I ,,.,, Ii 11"'" "' L/ ~,,~ .... ,"'
SECTION A-A Scale: /~:: 20'
~ Or,q,nc:1I grou>d i,1,e --.___·,,,,__ ~-------···;r·:~ .. ---
I-_ _ ~-- Top of "1o.ieutely weathered rocl<. _ _ --- __ _,_ -- I "' -
~- '----~?,>,~~ -k,----c--.B~·o;--:---r -· -?m(_:,· - 'o~~·
SPILL WAV TNA VS!TION CffA.VNEL
TYP/~1~, 1~~~T!ON
..... -.,,. ·fi'-·t
·",!;
·;~1
. 52.00' -~·1--~---
~ o ~I~ Q.1::::;:
}l
• /-. ,,;;,p•,,~;,::_i__ /.f ::·~eoo 11
~\~ I 22 so'
1:1~·--.:.~ '. I
3s.2s' I
ill
{
o.vc-:-,;7 ,J1 : Sta 12-t2S6) 1 El. f/12.6
INTt=RMED!ATE PIER NOSE DETAIL
Scale: / 11 = 10'-0"
· $. Y• - !J. 0000870/05 X' ~' 52. 61<'.. X<419,J5i.
.--,,...0/o:a·' ·o 3 ,o 2.:J -30 40 so
1''=zo~c"~ <1/J 60 ~o
·- .. '!1
EL 81320 , 01025 50
/~<>5'.'.'}-0# ~ ,oo i.SJ _'Q() 25.J
::::r=-.::..:~
11 I I I I I l I ~ "\:_ /4 \' SCALE OF FEET j E/81360 I llll1 ~ ~--0.009158 j_ r· , I / --~- STATEOPCALll'OIINIA
c #Jr\$.>ij\€ '."?~ '- ,. . . . . ,_ °.- ~ .• : !'~ RESOURCES AGENCY OF CALIFORNIA -~I : ~I-=:?...,_ . ·.; "" // '·.i .. :· . p- -,~ • •• • -~- • •• • ;;-:--- DEPARTMENT OF WATER RESOURCES !\J I> Z' • ~ . . v. 1 ''<, ;i . ,, V · • .-., >,./ DIVISION OF DESIGN AND CONSTRUCTION
4-.Se'Sl.'.j' . f- • • I ___ /04/9_'_ . ;. . / i ::>ROVILLE SPILLWAY -, OUTLET Vt10RKS AND SPILLWAY
SECTION BP Scole. 1'.,,..1oh GATE STRUCTURES
PLAN a SECTIONS SUBMITTKD: A...-WOYl:D: DATC,
f--fJ l'~~!,;fH''V,,SeYe,.-n .7&"1::-;:.?.;ov,:r1'"/co-/n'rf$ I-·• I----~ IAPPROVALR•cOMMllNDBD:
OltRG,Nl:D
R /ni'guez 'f'S/4 APPROVAL RECOMMENDED: 0
.. 4i0°.:, E M -~ aHEET
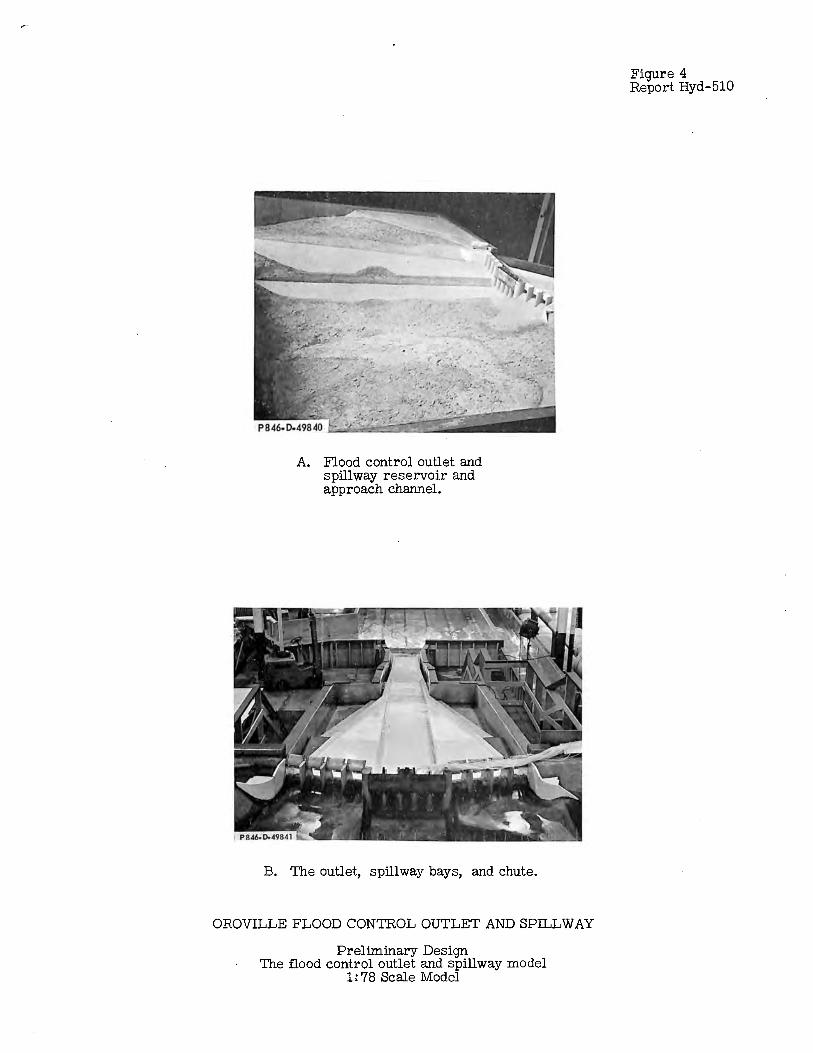
A. Flood control outlet and spillway reservoir and approach channel.
B. The outlet, spillway bays, and chute.
OROVILLE FLOOD CONTROL OUTLET AND SPILLWAY
Preliminary Design The flood control outlet and spillway model
1: 78 Scale Model
Figure 4 Report Hyd-510

Figure 5 . Report Hyd-510
Flow approaching spillway and flood control outlet.
Flow leaving spillway and flood control outlet. Note f:ins caused by impingement on spillway radial gate counterweights.
OROVILLE FLOOD CONTROL OUTLET AND SPILLWAY
Preliminary Design Combined discharge 650,000 cfs (250, OO~cfs outlet and
400, 000-cfs spillway) 1-:78 Scale Model

A. Smooth surface flow indicated by confetti pattern.
B. Surface flow at outlet entrance.
OROVILLE FLOOD CONTROL OUTLET AND SPILLWAY
Flow approaching outlej: . (Discharge 250, 000 cfs; reservoir elevation 900)
1 ? 7 8 Scale Model
Figure 6 Report Hyd-510

Figure 7 Report Hyd-510
A. Surface flow at outlet entrance.
B. Surface flow pattern indicated by confetti.
OROVILLE FLOOD CONTROL OUTLET AND SPILLWAY
Flow approaching outlet with 110-foot radius wingwalls (Discharge 250, 000 cfs; reservoir elevation 900)
1: 78 Scale Model

., .. ..
-r ' : : ,_
- 0 o.!= "' Q. .~
(_j______ ' ',,_<t. of Velocity measurements
at 625,000 cfs discharge.------------
0 10 20 30 40
SCALE - PROTOTYPE FEET
Stotion 10 + 71.50---,, -,
-0
"'
a' r,-15' -~ -g
I Typ;eo1 I I Station 10 + 11.50----, :
-~--:
;o 0 ...J ...
!
Station 11 + 21.50 __ ,,,,
;r©--0--@-/ '-<t. of Velocity measurements
at 150,000 cfs and 250,000 cfs discharge:-----,,,
... ,,,
',,\ ... \ '---<t. Outlet and spillway \
: I :
--0--®-1®---
OROVILLE FLOOD CONTROL OUTLET AND SPILLWAY
LOCATION OF VELOCITY MEASUREMENTS I : 78 SCALE MODEL
-...,
', ...... ____ _ ~--------/
( -<t. of Velocit ot 625,oo/cteo_surements s discharge.
0 NOTE
Indicates velocity meosureing station
"' "' ..,,.. o-"' G) -tC :,: :u -< l'I 0
.:,c 0

Figure 9 Report Hyd-510
Discharge 150,000 cfs through the outlet only.
Discharge 250, 000 cfs through the outlets only.
OROVILLE FLOOD CONTROL OUTLET AND SPILLWAY
Direction of approach flow for use in obtaining velocity distribution
1:78 Scale Model

a, U) a,
25
20 '
(/)
a.. 15 "--->I-(.)
0 10 ....I ILi >
5
0
' I ~ FLOOD CONTROL OUTLET AND
EACH SPILLWAY SECTION (FACING DOWNSTREAM)
I
---,~ -- LEFT SPILL WAY ~ J ----- ---r--. -----RIGHT SPILLWAY-, ---- -
~ --r - -.~ __,- .... -'i' I
FLOOD CONTROL OUTLET-'
100 80 60 40 20 0 20 40 60
DISTANCE (FEET FROM CENTERLINE)
NOTE: MEASUREMENTS TAKEN 30 FEET ABOVE INVERT
OROVILLE FLOOD CONTROL OUTLET AND SPILLWAY
VELOCITY TRAVERSES ( DISCHARGE 650,000 CFS) I :78 SCALE MODEL
---------
80 100
:u ITI ,, "'T1 0-:u G)
-f C
::c ::u -< fTl C 1-
UI 0
0

CD ~ ~ m CD 0-------<1 Velocities at Sta. 10+ 11.50 .,._ __ __, Velocities at Sta. 10+ 71.50 ~ ~
80
21 ~--, 60 lL l-
b. w-0 0: Zo <to I- _J <I> LL 40 0 _J
_J LLJ <( z oz - <(
~ 6 20 LLJ >
:;; o_
0
80
Et;: 60
LLJ.,... 0 0: zo <(Q I- _J <I> LL 40 oJ _J w <( z oz - <(
~ 6 20 LLJ >
'\\ I ' 4 I
\ I I
t \ I
) /
I
~ r I
I'
6 8 10 12 14 6 8 10 12 14 6
VELOCITIES (FPS) POSITION (D @
,\ i\ \ \ I ~ \ I
I \ J ~
I \ I I
\ t I 6
For positions, see location Plan, Figure e
R, I ~· 11 1
I I
H I
! Ii. I ~ ~
:\ I
:\ I \ \
I
\ r t \ I t \ I
I \ l I \ I !
I \ I LI
I I
\ I i
\ I
I \ I \ ' \ \ I
I \ f I
t \ I & .... & ' J
8 10 12 14 6 8 10 12 14 6 8 10 12 14 6
@ @ ®
\\ ;l \ l t\ i\ ~\ I \ I
I \ I
I \ I
t \ I 1 \ i \ I I \ I
6
I \ j I \ I
d I \ \
I \ ' I
~ \ I ' \ 4 I
6 ~ 11, b 't, ,,, 0 6 8 10 12 14 6 8 10 12 14 6 8 10 12 14 6 8 10 12 14 6 8 10 12 14 6
VELOCITIES (FPS) POSITION (l) @ ® @)
OROVILLE FLOOD CONTROL OUTLET AND SPILLWAY
@
VELOCITY PROFILES - 250,000 CFS DISCHARGE THROUGH OUTLET ONLY I : 78 SCALE MODEL
R\\
l\ ! \ t \ I I
\ I IJ. I
[\ I I
t \ &
8 10 12 14 16
®
I t ~ \ I
I\ I I
! \ I
I J I
\ I I
~ \ I l,
' 8 10 12 14 16
@
~G') -t C
::6 -~ !Tl C lo, -0
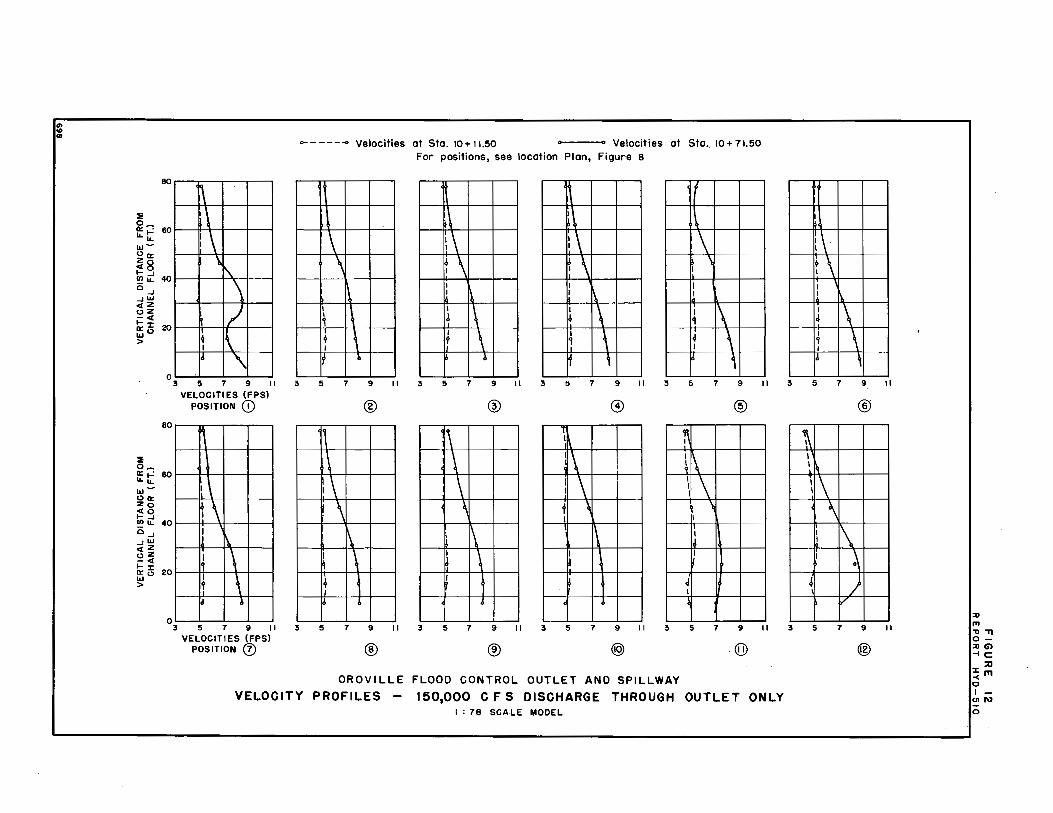
"' <O .. 80
:& ~...., 80 II. I-
II. ..,-Oct:
~8 l;; it 40 i5 .J .J l&I C( 2 oz j: ct a: :c 20 ..,o >
0
80
:& o_ a:: i-: 60 ...... l&I Oct: zo ~g u, 11. 40 0 .J .J l&I ct 2 oz -ct E i3 20 >
0
3 5 7 9 II VELOCITIES (FPS)
POSITION ©
I \
t \ I ! 't.
~ \ I \ t I
I a
3 5 7 9 11 VELOCITIES (FPS)
POSITION (!)
3
3
_____ .., Velocities at Sta. 10+11.50 ___ ..., Velocities at Sta •. 10 + 71.50
For positions, see location Plan, Figure e
' \ I
\ :\ :\ \ ~ I \
1: ' ' I
I
l I
l l I I ~ I,
I !
I 1 I , I \ f
I \ 4 I \ 1
t \ I
I \ t I \ 1 4 \ I
I I, ' 1 ~ ~ ' 5 7 9 II 3 5 7 9 II 3 5 7 9 11 3 5 7 9 II
® @ @) @
'1 '\ l I 'Ii
I
~ ' \ \ i\ I\ \ ,\ \ \
\ I t l I ' I
\ \ \ I I
;J I ' ~ '
I ' i ~
I ~
• I 4 I I
' ' l
5 7 9 II 3 5 7 9 II 3 5 7 9 11 3 5 7 9 11
® ® @) ([j)
OROVILLE FLOOD CONTROL OUTLET AND SPILLWAY
VELOCITY PROFILES - 150,000 CFS DISCHARGE THROUGH OUTLET ONLY I : 78 SCA-LE MODEL
: \ t \ I
l I d I
' I &
3 5
' I I I
\\ ' ~
I
! I
4 I
3 5
~
\ \ ~
7 9 II
®
\ ~ ) ,,,
7 9 II
@
::u
"' ,, .,, o::u G) -4c
::u ~"' C 1-
cn N> 0

Figure 13 Report Hyd-510
A. Flow emerging from flood control outlet
B. Large fins form downstream from blunt piers.
OROVILLE FLOOD CONTROL OUTLET AND SPiLLWAY
Operation of flood control outlet (Discharge 250, 000 cfs; gates fully open)
1: 78 Scale Model
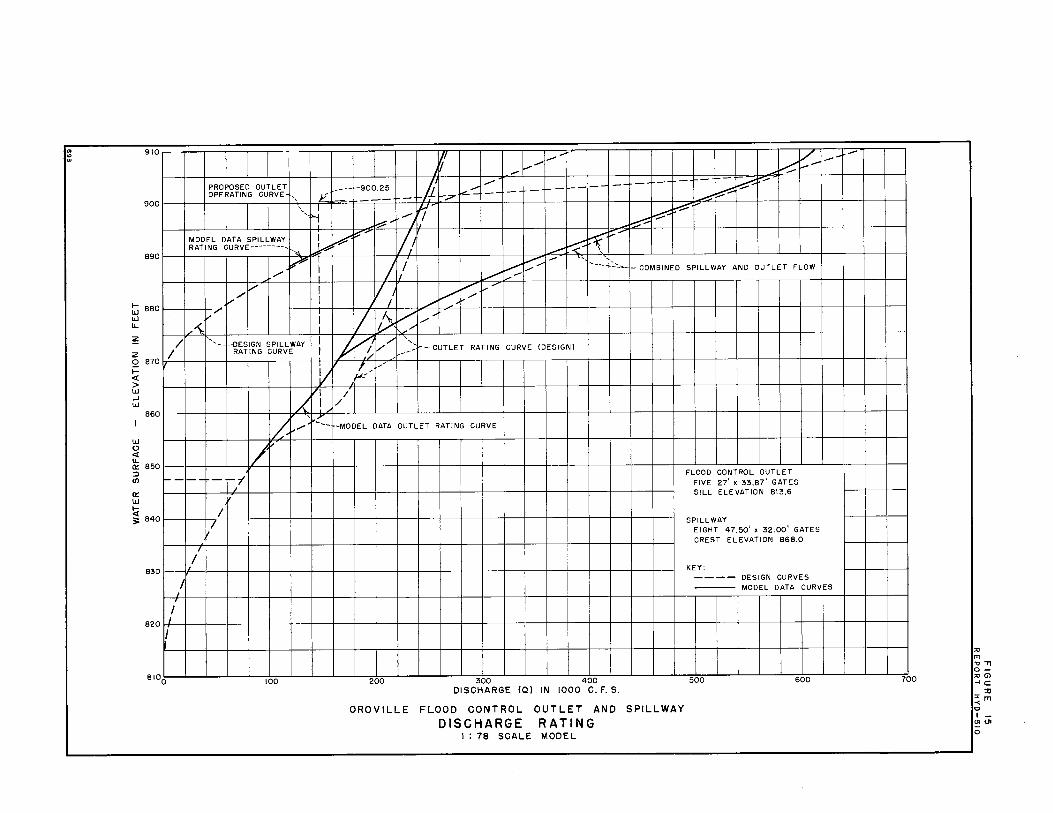
O>
"' .. J-910
900 )
) 890
t;i 880 IJJ LL.
/ z
z )/ 0 870 i= <t > IJJ ...J IJJ
IJJ 0 <t LL.
) 860
0:: 850 => (/)
a:: IJJ
~ :;: 840 )
830
820
--
I , ' I
I
I
8100
1 -
PROPOSED OUTLET OPERATING CURVE ,, ~
I ' ' I ' "i
MODEL DATA SPILLWAY I RATING CURVE--------,
'>\ ~
V I
! /
v I I.;/ I
1,- .... I
,,( I I
-, - --DESIGN SPILLWAY I
RATING CURVE I I
V ,/
'I I
/ ' l..(_
--· i,-
/r, -- - '--/ ,
~
I 1,/
I
I 'I
·--100
fl .,.,..., V --,1/ --v ,- V-v-
-900.25 lh .,.,... -- - -- - - - t;?:: ------ -.,, . .-:::: -- ---- - - .__ -
~ ,-_;;, ~
µ ~ --- I ~ ,,....- J " ~
# ~,
// ~ c;..-
? ~
J I ~--- -- ' v --- :_....._...._
I/ _.,,.- --- - COMBINED SPILLWAY AND OUTLET FLOW
[7 I V 1---=
V --' I /
17 />, ~ _.
.......
) L..-1 / ', / --- I>-- OUTLET RATING CURVE (DESIGN)
,/ , l- /
I /
-MODEL DATA OUTLET RATING CURVE
200
OROVILLE
300 400 DISCHARGE {Q) IN IOOO C. F. S.
FLOOD CONTROL
DISCHARGE OUTLET AND SPILLWAY
RATING I: 78 SCALE MODEL
FLOOD CONTROL OUTLET FIVE 27' x 33.87' GATES SILL ELEVATION 813.6
SPILLWAY EIGHT 47.50° x 32.00' GATES CREST ELEVATION 868.0
KEY: ---- DESIGN CURVES
MODEL DATA CURVES
- -500 -- -600
-
700
:u
"' "O..,, 0-:u G')
-iC ::0
~ fT1 0 I'" (JI
0

--.s:::.
C <(
II.I ::c
698
FIGURE 16 REPORT HYD-510
,,. ----RESERVOIR WATER SURFACE
I I I I I I I
901-------+-~: -I I
.s:::. I I I I
801-------+-r1 -
i 70 CENTERLINE
OF GATE OPENINGS
60
Q
A-v"2"'gti
WHERE: Q = DISCHARGE A = AREA (27 1 x 33.87') h = HEAD
20'-------J'-------J--------'-------1.-----' 0.60 0.70 0.80
COEFFICIENT OF DISCHARGE (Cd)
OROVILLE FLOOD CONTROL OUTLET AND SPILLWAY
OUTLET DISCHARGE COEFFICIENTS I :78 SCALE MODEL
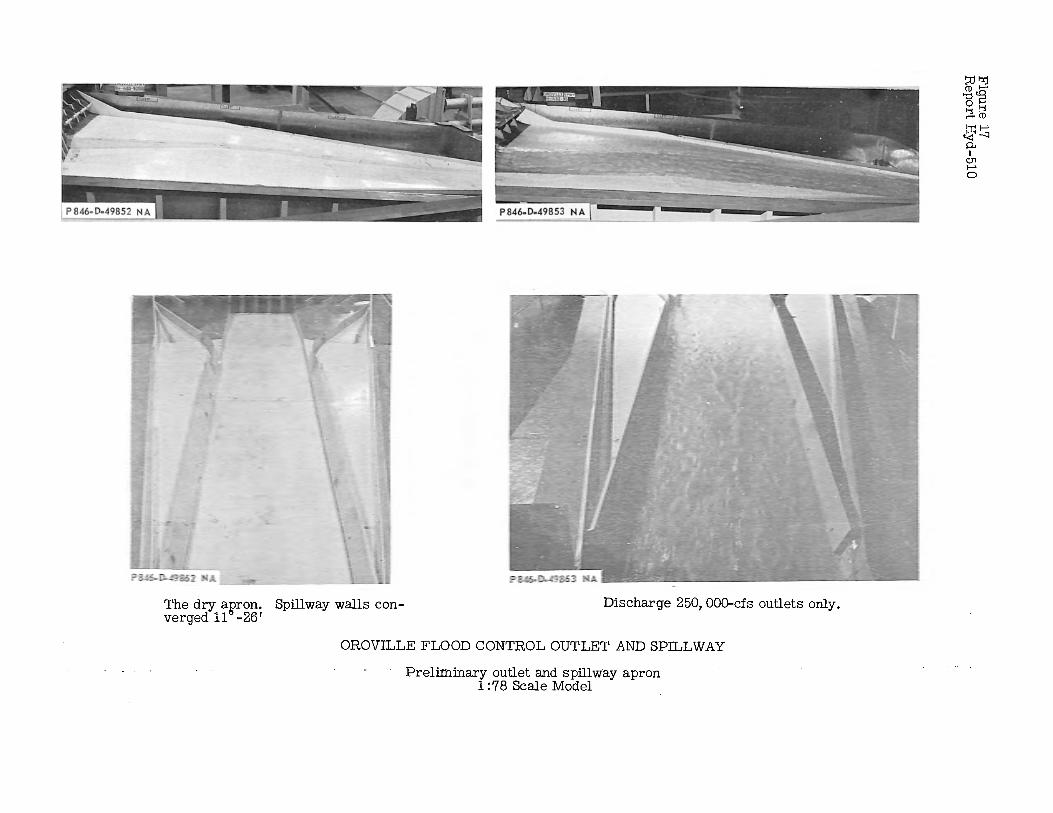
The dry aslron. Spillway walls converged 11 -26'
Discharge 250, 000-cfs outlets only.
OROVILLE FLOOD CONTROL OUTLET AND SPILLWAY
Preliminary outlet and spillway apron 1 :78 Scale Model
~~ 'gt§ ~~ ~~ p.. I
01 I-' 0

Discharge 250,000 cfs (150, 000-cfs Discharge ~20,1 000 cfs (259, 000-cfs outlets; 100, 000-cfs spillway). outlets; 370, OuO-cfs spillway).
OROVILLE FLOOD CONTROL OUTLET AND SPILLWAY
Flow in preliminary outlet and spillway apron 1: 78 Scale Model
~~ '8'§ 1-j 1-j ....- CD
~~ p.. I
01 I-" 0

Spillway apron level across a section perpendicular to wall.
Spillway walls converged 25°. Discharge 250, 000 cfs (outlets only); reservoir elevation 900 feet.
OROVILLE FLOOD CONTROL OUTLET AND SPILLWAY ' .
First change to outlet and spillway apron 1: 78 Scale Model
~31 'g'@ ~~ ~to 0.. I
01 I-' 0

Total discharge 250, 000 cfs (150, 00().. cfs outlet; 100, 000-cfs spillway)
OROVILLE FLOOD CONTROL OUTLET AND SPILLWAY
Flow on apron with first change
Total discharge 620, 000 cfs (250 000-cfs outlets; 370, 000-Cfs spillwayf reservoir elevation 910 feet.
~ 1-tj CD ,_..
'g'@ 1-i 1-i .-+ CD
~~ p.. I
c:.,, I-' 0
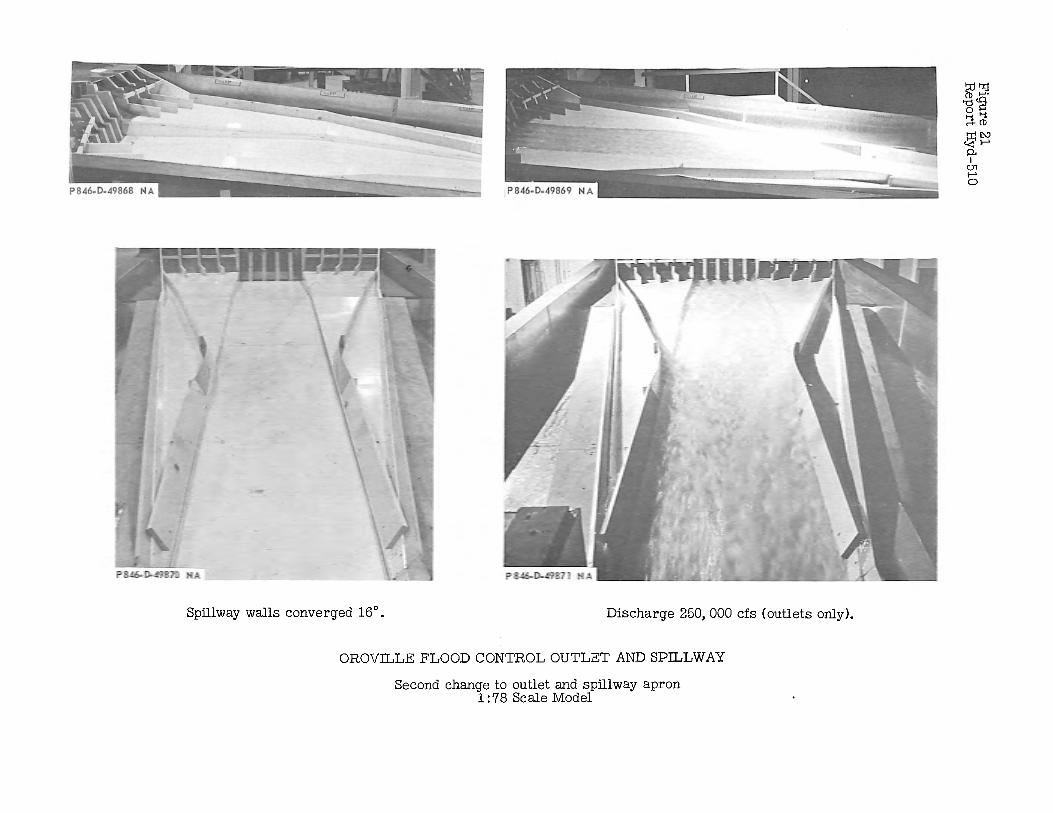
Spillway walls converged 16°. Discharge 250, 000 cfs (outlets only).
OROVILLE FLOOD CONTROL OUTLET AND SPILLWAY
Second change to outlet and spillway apron 1 :78 Scale Model
~:31 '"d~ 0 ~ ::i CD
~~ p.. I
C,)1 I-' 0

Total discharge 250,000 cfs (150, 000-cfs outlets; 100, 00(}-cfs spillway).
Total discharge 620, 000 cfs (250, 000-cfs outlets; 370, 000-cfs spillway).
OROVILLE FLOOD CONTROL OUTLET AND SPILLWAY
Flow on apron with second change
~:3! -g~ 1-j'°l M" (D
~~ p.. I
01 ....... 0


Total discharge 250,000 cfs (150, 000-cfs outlets; 100, 000-cfs spillway).
Total discharge 620,000 cfs (250, 000-cfs outlets; 370, 000-cfs spillway).
OROVILLE FLOOD CONTROL OUTLET AND SPILLWAY
~t-:cj (1) I-'•
'8~ :=t (1)
::r: ~ '<l ff>,. 0.. I 01
5

"-
~""' ....... ...... '-t·"·.::·.::·.::~~· ... ,
'
PIER 4 LEFT SIDE -TOP
A">----····;:.·,, -- ... ·L, ... ··/ .. · .,,,
/
:.:.·~~·:.:.-:;_·,.../'
·· ... ~ ..
PIER 5 RIGHT SIDE -TOP
. .:..· .. ...... ~ ......
·-.. -- ~i,,k:,,,,,~,,
12
10
PIER 6 LEFT SIDE -TOP
12
SIZE SCALE (PROTOTYPE FEET)
0 10
PRESSURE SCALE PROTOTYPE FEET OF WATER)
24
20
KEY: Disc ho rge per boy - Representing toto I dis charge --- 33.900 G.F.S. 169.500 G.F.S. ---- 41. 200 G.F. S. 206.000 G.F'.S. ---- 48.300 G.F.S. 241.500 G.FS. •••••••••• 56.400 G.F.S. (Boys 1.3 & 5 only)= 169,200 CFS Profiles toward center of boy 1nd1cote above atmospheric
ressures.
,,,, ',,
' ..... ........ ....... -----,.,,_ ···1··· ···.:::.::;.·.:, .. =· ·····~-...:..:.:.············ '-"------ ---
PIER 4 LEFT SIDE - 17 FEET ABOVE FLOOR
.•. ····•·· __ ,,,,,,
------- /
,, /
/
,,,, / _______ _,,,,,. -/ /
,," /
/
PIER 5
/ /
RIGHT SIDE - 17 FEET ABOVE FLOOR
'\. ~
-
.)\"'
''< · ·-.. ··---\ -->l~< ',,
..................... -...-...__-------Rod ius
24.0° (TYPk
PIER 6 LEFT SIDE - 17 FEET ABOVE FLOOR
12
FLOW ____ ,_
······.~.::-.::-.::.:.::-...
BAY 3 ROOF - RIGHT SIDE
' \ ··· .. ~, " ~· /
··.;-.. " .7/ ··~,.,.. .......... .~/ '·"-'················-:.;-------;
BAY 5 ROOF - LEFT SIDE
xi y2
5 /~,+(~)•=I
(Typ,col)
.................................. ~_}'(EL. 847,07 (Typical)
BAY 5 ROOF - RIGHT SIDE
·•. •. ··.
' ' ··· ...
' ' ' \
" , .... _ -----.. , ... ······ ., ...
BAY 3 ROOF - CENTER
<"'<:,(: ··... ', .........._
·. ' ··········· ....... :~.>.,..~·:
BAY 5 ROOF - CENTER
FIGURE 14 REPORT HY0-510
.,,-'i. Outlet and spillway
BAY NUMBER PIER NUMBER
,-Left intermediate pier Right intermediate pier-,_,
t1~-/ II I~ I ~ I lll__ i I I I ~: 1 1"
-~'i. Boys I: \.
2 3 4 2 3 4 5
-- PIEZOMETER LOCATIONS
LOCATION ELEVATION
5 6
OROVILLE FLOOD CONTROL OUTLET ANO SPILLWAY
PRESSURES IN BELLMOUTH OUTLET I : 78 SCALE MODEL
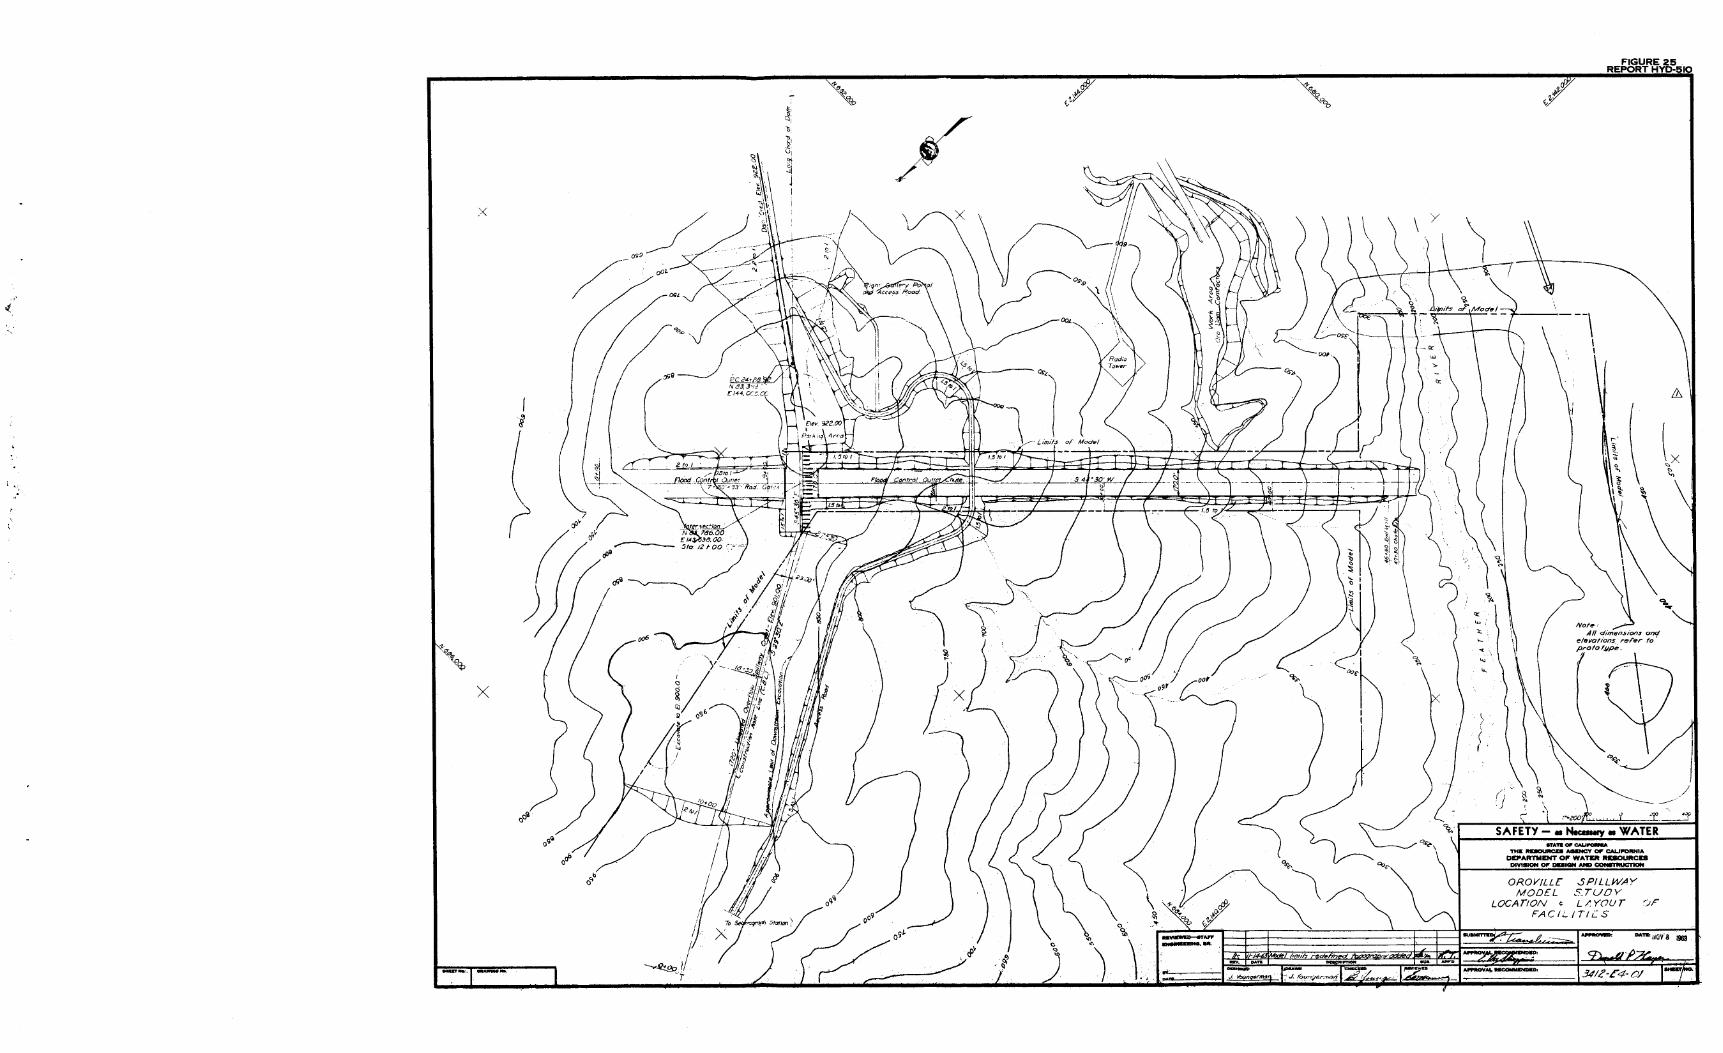
-.f.
;t'-'z~cr ~
)<
X
Orf,
5' c:,' I
1;
}' '-'1
~ .31 j I
":"~ "~
/ ~i'
l II fllt )
__ / 1/y;>,atian(·~-o-~~ 009/. 0_,,__)) ) \ \ \ •. ,_. l--
-· . _>'" PJ "' ) --
T . ~--- -r } • ... •- -------· . ··'- .. . _J_ ______ ~ ·C .• / (
a., ,,
0'% ,;~
~P"
FIGURE 25 REPORT l-!_'\'_D-510
~ -\-. - i ~ /-1 \ ~
... ; I 1,¥)11-s" ef\Moct:.! _ ,---- --\
I/ )
I I
Note
&
h \ lx ~ ¼
~ \!I 0 ' 1} \ i ,-; \ .
~
All d/mension.s and e/f!lvations rerer to' protot,ypt!. •
-- ----r} ' .', l. ·,
~ I ,~=·tr:.. . '! __ j". ___ "'f'
~ I SAFETY - - N-.,y .. WATER I 8TAft CW CAUPOIINIA
THI: IIE90UIICD ACl&NCY OP' CAUl'OIINIA DEl'ARTMl!NT 01" WATM IIDOUIICU
DIVISION OP' ... ICIN AND CONITIIUCTION
OROVILLE S Pl LLWAY MODEL S.TUDY
LOCATION ¢ L /'. YOU r 'jr FACIL/T/CS
- DA.ft: 1tOV' 8 1963

\ \
/i,1 I \ ~ \
1-
' 10
4ft
( \ o>>s_ '----. ~-<~ / / \ i , I
\ \ \
\_ \
\ \ \
\
', I ', .,,.--) I
'- .- I I . ',, ,,,.- I \ g --- / ------/---------\---~-
"'oo
/ \ I " I ', I "
~ ----. ·.
\ '~- - ' '·\.._ 6<,$~--
"·- ·.,_ ·--- -- - - '
~--/
\
\ \
\ \
\
\ I
\ .
\ \ \ \ ' \
\ -- I I A I I / 1 -~ . , l:-<l)lzz,1 11 r . "' \ ' \ __,\,
" T' 1 I 100' _ \ ~-/f ion ---
~ "'
C) ~
~ \ h channel D
Aro= -'°f1ev. 811.0~ ' -----t . .3
_ _ ~-~ 3412·£4
-o
\ c, 34/2·£4 -o.3 .
-<----~ -4----:----- .. ~4_'30' w-
?
<S>d' 0
\
\ -\
<S>> d',
~ 'l:?
8
+-~_J
~
-- Sta. 27+30
F
PLAN - OUTLET WORKS Scale _. I"• 50'
9),?.0
--------f,Outtet Works
X
"d?, ~"'·· "'I,~
Spillway Crest Elev..90!.0'
Original Elev. 897.5 Elev. 898, 50
gr
FIii wrapped~ around endwatl.
N ws Et•v. soao
SECTION A -A LEFT E_ND BUTTRE.5,_S Scale I"" 20'
r 50.6'
t £/ev. 922 O
~ EMBANKMENT-DAM
Not to scale
N W. S Elev. 900. 0
Onginal \.,fround line ;
~£/r.1v 856.27
/s
SECTION 8-8
.1
"' <X) . ;;, ,; ;:,
Symmefr,col obou/-t Approach channel
I
,vON - OVERFLOW S£C,TION SECTION G-G Nor to scale
Scale.- 1"~ 20'
-::::r--t ·--~---' B.YOU~ I--;: WILES
;;; Ii il; ii .,,
SECTION F-F Scale, J" • 50'
(:) ., . " "' ~ .,,
-~ ~ ? , ~ ~ ~
1,,,,,
50, so o so ioo rso zoo
c£:/:a:; .s-aund rock.
SCALE: OF FEET
SAFETY - • N-a.y • WATER IITA.ff OP~
TH. M:9DURCD ACIDICY OP' CALIPOIINIA DEPARTMENT 01" WATER RESOURCD
DM8ION 0, DaJJGN AND CONS11IUCTION
OROVILLE SPILLWAY MODEL STUDY
APPROACH CHANNEL AND FLOOD CONTROL OUTLET
GENERAL ARRANGEMENT 12:;J
_...,.

R•2.~ 6 • 46°
i •' ~I .I() ~1'2 ,,Is, . .,,I.'. -:itj
1_~1~ . i-- 150
Elev. 9zz,;t1 -1---··-1
, ___ __±[J.56_~
~-·-Ol.:?1E!N OF ELL!P,.3£ ,_.£J=.8Sti.27
Elev; B--18.31
-~
7 99' r-2QQ~ .. gz i~
'··~-~-t--rE/ey.{!1,9.21_-.,, ~1 ---,i·.··· .-.·.· ·-·. ·1·
'\ " ·,, ·,
',, .......
~.~ ~!/ ,,
'
2.•4' ~ ~ fte" a,;_;9~ 1 i: I ,
-~~~~;0/ -. . . . -~; . I . . ,. . .. ~ ~-,--,-~- '\,,
Ill Ill
71,_ 9_9'
SECTION 0-0 ,,J4t2 ·E4·02
Sea/~: t"~ JO'
' \
fle, ,.,,,jQ_
E/ev. 9ZZ 0
E_l~_y,__fJ..49.~I
£/ev. 8/0.50
UvmwaD---9TAPI' .,..,,.....NC1,a11.
' I
~~ i '
;?()CO"/
Vf-;,~7 ;\
VIEW £·£ 5412- E4- 02
Scafe:, .... 10'
r···- '5.0:/ -
(\ ! :,,
' ·~
\o·
=-:::_;;_J
\: \
I
SECTION B·B Pier Nose o~tat'I
No/' lo Sc-~/~
=--•D '----1 d2t'. ,0,,-,,
L ,::. ~1 -
\ I· I I
I' I
' I-
SECTION C·C 34_!2-E4-Q_2
Scale J" .. JO'
.FIGURE 27 REPQRT HYP-510
~Ll'I. 'i?_i'._0 -i--:
~:ncc~ ~-J EL£~ tJ56.i7 - -t~· --·- -
: . I V[RT!CAL \s<T,\.'""(• WALL I
Elcavaf~d r J( ,< L 1r1e
r~= 10' /0 0 L.J....1.LJ,1,1
,o '
lO I
>'.)
.. J 40
SAFETY - u Ncc.n.;y. WATER STAffOl'CALNIOIINIA
THE ftE80URCD AcaNCY OIi' CALll'OIINIA DEPARTIIIENT OF WATI!ft IISSOUIIICD
DIVl810N OF DDNIN AND CONSrMJCnON
OROVILLE SPILL WAY MODEL STUDY
FLOOD CONTROL OUTLET SECTION P DETAILS
- DAffs ~,l.V 6 19Ei,'.,

Figure 28 Report Hyd-510
A. Overall view of model. NJ all of symmetry not installed. )
B. View of model showing the approach conditions. Wall of symmetry installed. )
C. Bays 5, 6, and 7 (left to right). Note piezometer openings on bellmouth surfaces.
OROVILLE FLOOD CONTROL OUTLET
First modification of outlet 1 : 48 Scale Sectional Model

Figure 29 Report Hyd-510
A large constant vortex formed which alternated from Bay 6 to Bay 7. (119, 000-cfs discharge reservoir elevation 917. )
Separation of flow from the bellmouth roof occurred in Bays 6 and 7.
OROVILLE FLOOD CONTROL OUTLET
First modification of outlet The model without the wall of symmetry three-bay operation
1:48 Scale Sectional Model


Figure 31 Report Hyd-510
Discharge 150,000 cfs--water surface fluctuates above entrances.
Discharge 150,000 cfs--severe drawdown and turbulence at the bellmouth entrance.
Discharge 100,000 cfs--drawdown at Bay 7.
Discharge 75,000 cfs--contraction or drawdown occurred at the entrance of Bay 7.
OROVILLE FLOOD CONTROL OUTLET
First modification of outlet Outlet entrance flow conditions
1 : 48 Scale Sectional Model
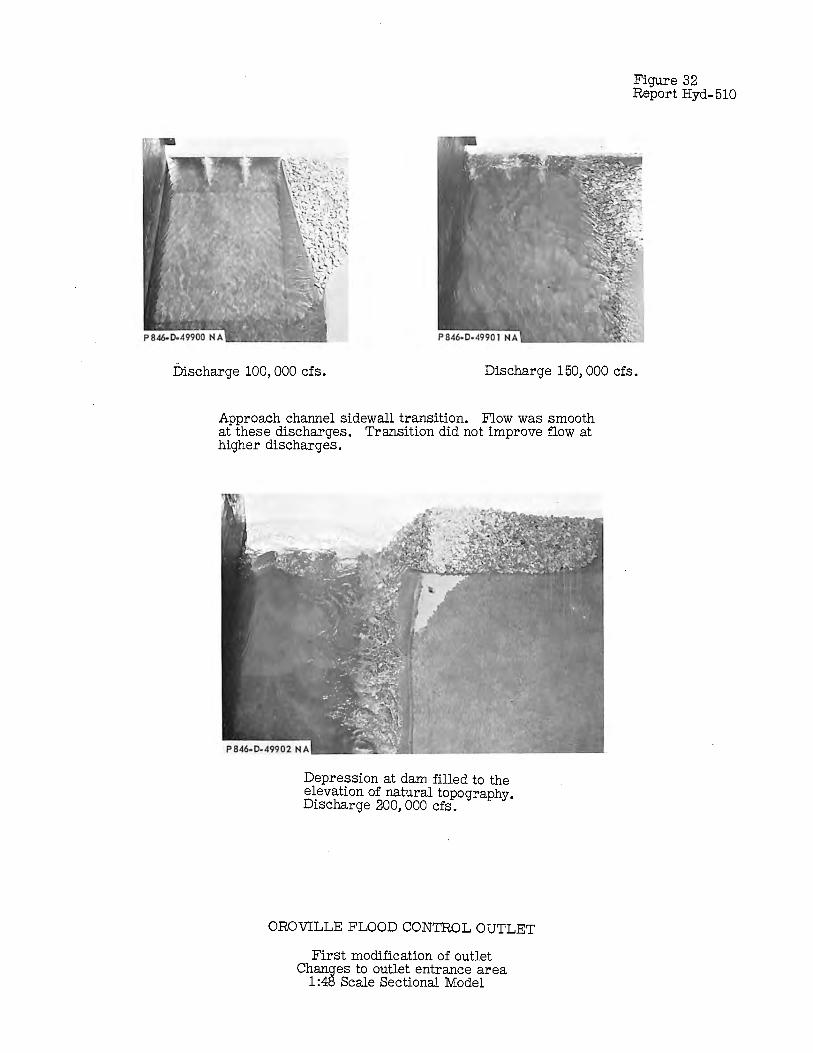
Figure 32 Report Hyd-510
Discharge 100,000 cfs. Discharge 150,000 cfs.
Approach channel sidewall transition. Flow was smooth at these discharges. Transition did not improve flow at higher discharges.
Depression at dam filled to the e~evation of natural topography. Discharge 200,000 cfs.
OROVILLE FLOOD CONTROL OUTLET
First modification of outlet Changes to outlet entrance area
1 :48 Scale Sectional Model

Figure 33 Report Hyd..,510
Discharge 277,000 cfs. Vertical wall extended from a point tangent to the bellmouth roof nose to above elevation 917. Smooth approach flow.
Flow was not affected by wall for discharge of 150,000 cfs.
Discharge 277, 000 cfs. Without vertical wall severe separation occurred in Bays 5 and 7. With the vertical wall added separation in Bay 5 was eliminated.
The flow through the bays was smooth except for the effects of drawdown in Bay 7.
OROVILLE FLOOD CONTROL OUTLET
First modification of outlet Vertical wall above outlet entrance
1:48 Scale Sectional Model
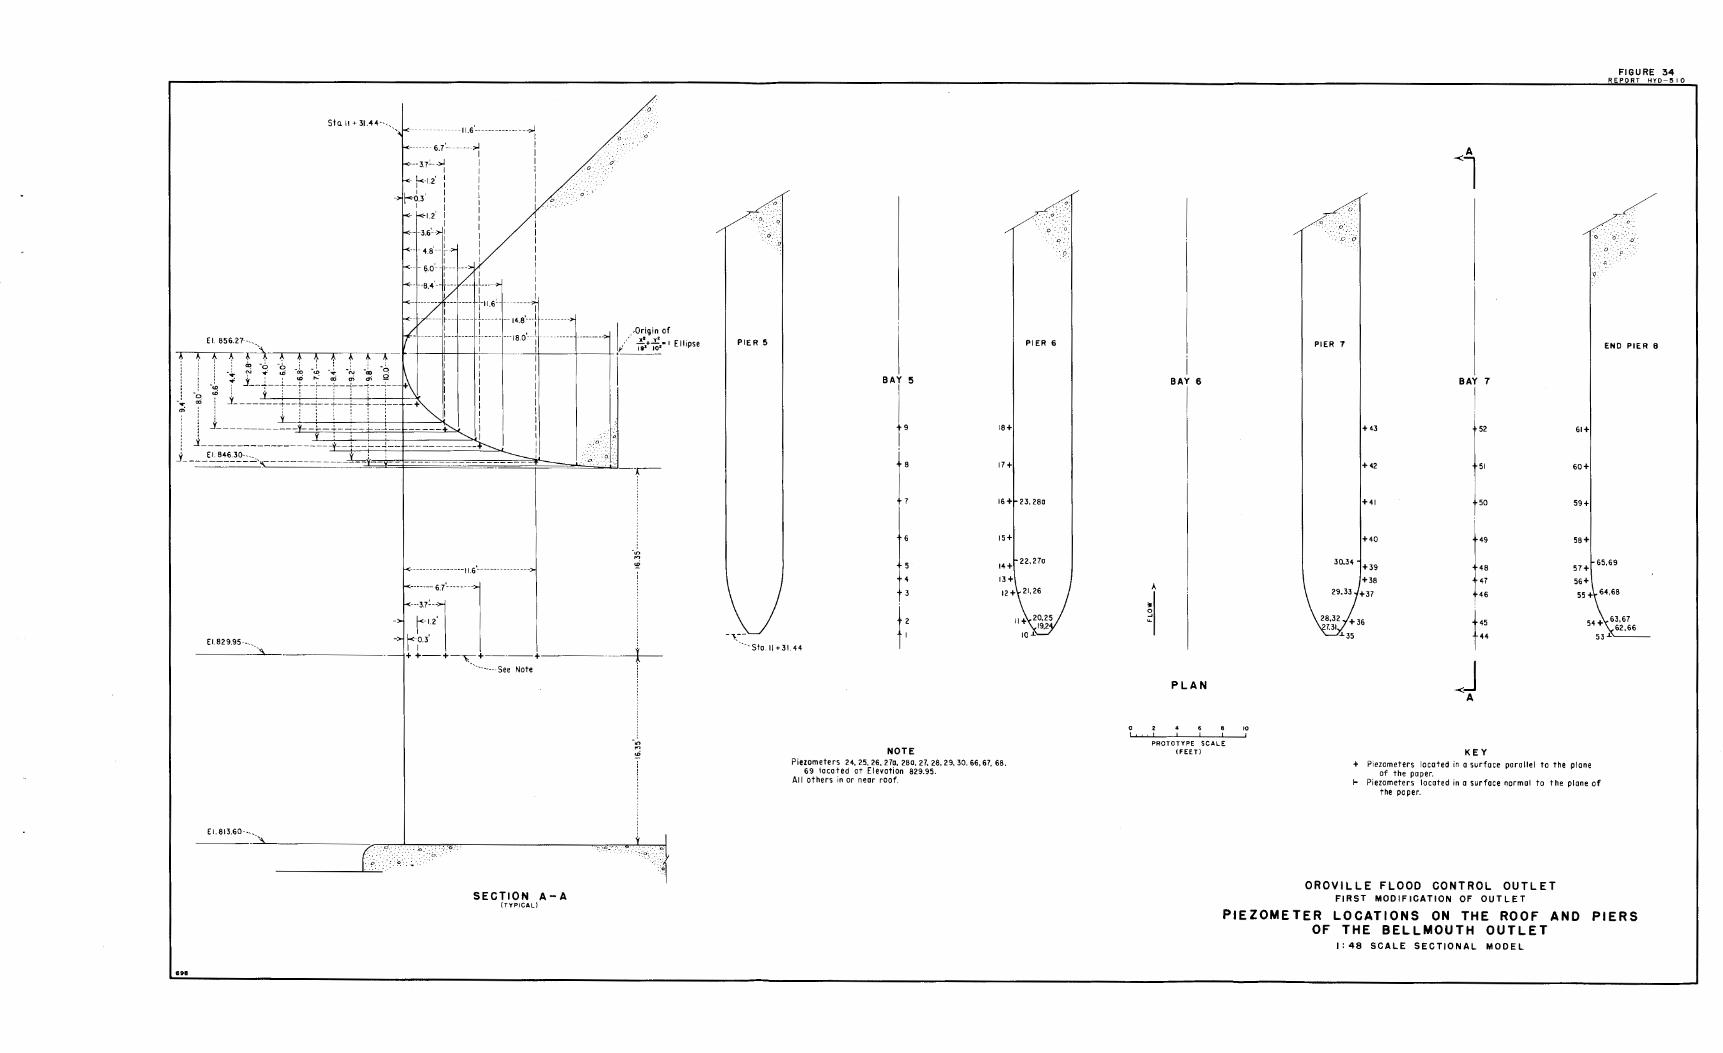
S1<1 11 + 31.44-- .•.
El. 856.27---. -~ AAAA,l.~~,l.~,l..f-f.l.
i ! f - ~ t -$ -~ -~ ~ ~ -~ -~ -~ , , : ..- : , , lD ,.._ oo m m -
· I l.6°--··--··----
6.7'- ------~ ---37c .. ,.J I
. I I
,. f-<·12' : I I I I
j-<-o.3' I I I I I
,_ k1.2' I :
·-1-3.6~ ~i : , I I
--•-49--,- I I I
--,. 6 o'--1--- --·
·+-a 4'--f--- --· _L_ I I
I ' . _____ ,r_~~~~-- r16
:- -14e·-+---------
.o
, I I ' I -l-------1:--------- -i------ ---1a.o---+ -- -
j I I .-Origin of
:' x1 vz
-,t---+--- I I ;,,•;;;,•' "''"' J -~ -~ 1-_~-:~:=t=t=:-_-r=r=~-::---; : i t i i : ! : : I ~
j________ y :- .;. ~ .;._ _:
j y + r- -i t ------+:::::::--,,,__ j_ __ El. 846 30:.::::.,.. _____________ L~-:--v--
Ei.829.95---
El.813.60-.., -,
•••
-·r-
·:g '£
r~;:T l , . + +-+~+---+---- X
·--..... __ See Note ·
SECTION A- A (TYPICAL}
.. ·.o ..
·,,, "' <D
PIER 5
·r 6
j:
NOTE
PIER 6
18+
17+
16 +f- 23,280
15+
14+1 22,270
13+
12+\-21,26
Piezometers 24, 25, 26,210, 28a, 27. 28, 29, 30, 66,67, 68. 69 located at Elevation 829.95.
Al I others in or neor roof.
BAY 6
A
3'
3 ...
PLAN
PROTOTYPE SCALE (FEET)
10
PIER 7
I
+43
+42
+41
+40
~7
I BAY 7
I
52
51
50
49
61+
60+
59+
58+
FIGURE 34 REPORT H_'{_!>_-51 0
ENO PIER 8
30,34 ~+39 48 57+' 65,69
56+ +38 I +37
47
46
f· 44
-<J A
KEY
55 +\- 64,68
54+~63,67 531<62,66
+ Piezometers located in a surface parallel to the plane of the pa per.
~ Piezometers located in a surface normol to the plane of the poper.
OROVILLE FLOOD CONTROL OUTLET FIRST MODIFICATION OF OUTLET
PIEZOME TER LOCATIONS ON THE ROOF AND PIERS OF THE BELLMOUTH OUTLET
I: 48 SCALE SECTIONAL MODEL
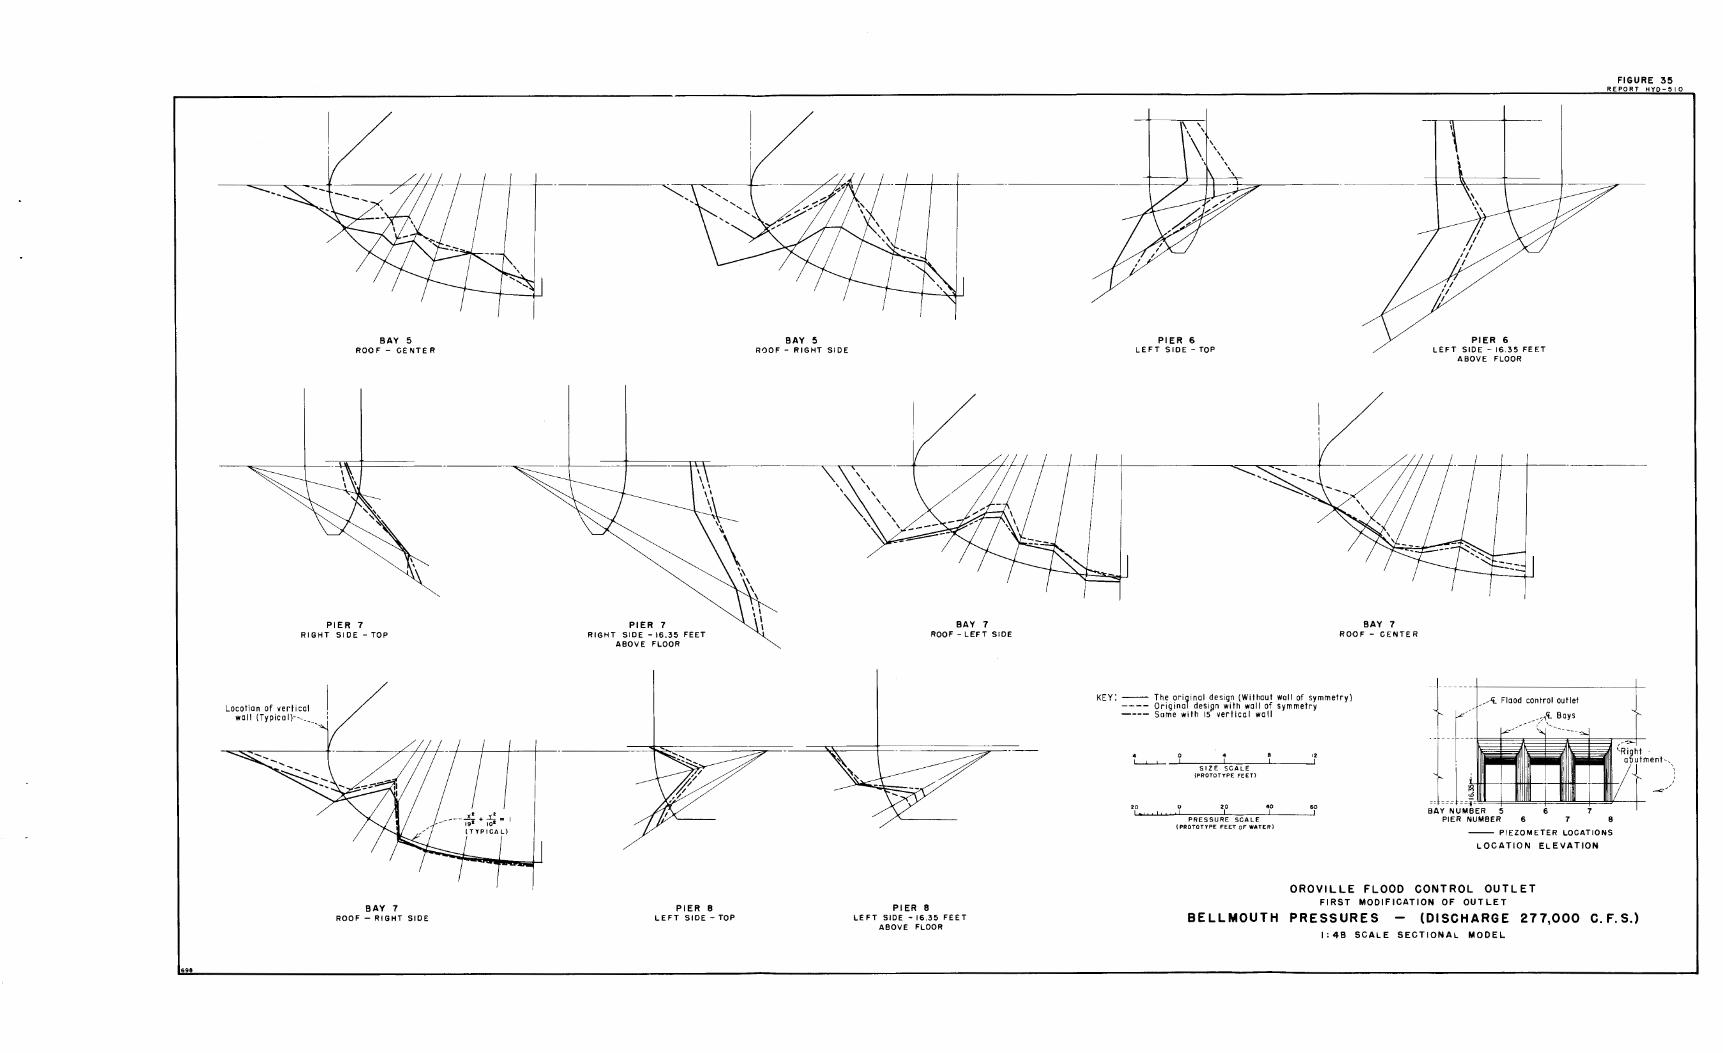
fill~
BAY 5 ROOF - CENTER
PIER 7 RIGHT SIDE - TOP
Locotion of vertical wall (Typical)------
,,.----- ,:: + ~ = I
( TYPICAL)
BAY 7 ROOF - RIGHT SIDE
" ',
PIER 7 RIGHT SIDE - 16.35 FEET
ABOVE FLOOR
PIER 8 LEFT SIDE - TOP
BAY 5 ROOF - RIGHT SIDE
PIER 8
BAY 7 ROOF - LEFT SIDE
LEFT SIDE -16.35 FEET ABOVE FLOOR
PIER 6 LEFT SIDE - TOP
BAY 7 ROOF - CENTER
PIER 6 LEFT SIDE - 16.35 FEET
ABOVE FLOOR
FIGURE 35 REPORT HYQ-510
KEY: -- The original design (Without wall of symmetry) ---- Original desi~n with wall of symmetry ---- Some with 15 vertical wall
,A. Flood control outlet
r_,-- ,,,-,<t. Bays
4 0 4 • L...L.J__ SIZE SCALE
(PROTOTYPE FEET)
20 0 20 40
PRESSURE SCALE (PROTOTYPE FEET OF WATER)
BELLMOUTH
,2
60
- ' ~ --- ....
., .. -U .. ~,-:~=-=-~~ --BAY NUMBER 5 6 7
PIER NUMBER 6 7 8
-- PIEZOMETER LOCATIONS
LOCATION ELEVATION
OROVILLE FLOOD CONTROL OUTLET FIRST MODIFICATION OF OUTLET
PRESSURES (DISCHARGE 277,000 C. F. S.) I: 48 SCALE SECTIONAL MODEL

lLI a. >-I-0 I-0 er: a.
er: IJJ I-<[
3:
IL. 0
I-IJJ I.LI IL. --ILi er: ~ (/) (/)
IJJ er: a.
698
FIGURE 36 REPORT HYD-510
40.----.-------r----r------.---~--~----r------T------i
30
20
10
0
-10
0
44
47
46
2 3 4
GATE CLOSURE IN FEET
44 Through 51 Center of roof in Bay 7. 55 a 64 Right Corner of roof in Bay 7. 64 Top left side of Pier 8 {Bay 7)
LOCATION OF PIEZOMETERS
OROVILLE FLOOD CONTROL OUTLET FIRST MODIFICATION OF OUTLET
BELLMOUTH PRESSURES VERSUS GATE CLOSURE 1:48 SCALE SECTIONAL MODEL

FIGURE 37 REPORT tlYQ-510
920
910
900
890 I-w w LL
z 880
z 0 j:: <t > w ...J 870 w w (.)
~ a: ::::::> 860 (/)
a: w I-<t 3
850
840
, ., 7~
I II'
/
! I
DESIGN RATING CURVE I ' ' \ I I I
~ I
I I I I I I
J I I
l
Y,' /' MODEL DATA
I --CURVE 'I _ _,. /4~ / ~/
11 I
11· . , /,c; ~
If fll
830 I
698
820 0
I I
100 200
DISCHARGE (Q) IN 1000 CFS
OROVILLE FLOOD CONTROL OUTLET FIRST MODIFICATION OF OUTLET
DISCHARGE CAPACITY 1:49 SCALE SECTIONAL MODEL
300

698
0
<(
90
80
70
60
w 50
:I:
40
30
20
~
~ i----
FIGURE 38 REPO'RT HYD- 510
I I I I I /' ,-RES. WATER SURFACE ....
I ELEVATION .. ' .. ~
.. I t - . _c;.:· -- -- Li --- o.'.-I - -I -- , I .:ii:'.' I -o·::.
J I ... ... I • '.c;:a· I .·:~-- I I :c :-9.·
I I ,;._·.·
I o\-.:_.,,y:: I • I fl I /"i OF GATE OPENING I v 'V - l
( Cd=
Q
A.J2gH I WHERE: ;; A = CROSS SECTIONAL AREA OF
PASSAGE AT GATE (FT.2 )
Q = DISCHARGE (CFS) H = HEAD IN FEET I I
I
V 11 I
/
V ,
FIRST MODIFICATION ,/ DESIGN RATING ---- --~ /
/ ,.
/ /~
~ ', V ,,,,"' ~If FIRST MODIFICATION
/ MODEL DATA ...,
~ .,,H' ... -...
~ ~
0.60 0.70
COEFFICIENT OF DISCHARGE - (Cd)
OROVILLE FLOOD CONTROL OUTLET FIRST MODIFICATION OF OUTLET
0.80
COEFFICIENT CURVE - FULL GATE OPENING 1:4e SCALE SECTIONAL MODEL

Symrne f,.;co/ about £ o,rrooct;, chonr;e/
SECTION A·A Scale.· /":% -10·
'--
---
X
--/ / --
~~-.
'
----,
I I
- I------+-+
gror,1r1a'
g .;,
I I I I
NWS £/~v 9000
2.2
11-------
:i0.6'
Pbrk/n9 ar~a Cler. 922 o
\ \
,._ p _,,,, ~
Trans.if ion ~ I\ Approach channel F-------z
I
D
£!•• B//.OA I C J Ill 111 £~~ ~A ' L-
\ (5 ~12-U"O:S ~ \ ' "' \ ~
\
PLAN - OUTLET WORKS Scale: /"::- 50'
El .. f22.~ 2
~I
-:Jj l======:e:i ~~
C.BLI
"Fill
/ 'l I,.
X Rock /me
-----t- _ ,er&: Outlet worlcs s-44·.xr·w
~ ~
Rock ,me
/
- ~ l
X
FIGURE39 REPORI HYD-510
/ 0
' I,.
l c· ... -- -----~-~ \,.---
~
...
EMBANKMENT -DAM r=M2Q:; .
,·
Cofch //ne Crest Elev. _ __!l?_2.0
~I . ~ ~ i l! "'
,,, "' .. - . ------- ~ .,____________ --... •..
SECTION 8-B Scale: /"% 40'
~ ~
~
Scafe, /"=-20'
ground
Elev.884.S
~ ~ ~ '>
. ) __ __,.,,
~ ::; ~ l,j
/1,.
' El~v 922.0
Berrn Ele~
on s~cf,on c;.c;,../ ~l · . · .. - ·:·--~ . . .. : ,, \ ·, .. 6 \
-------·--·--·------------·---·-~--~-~. /1,. ) _ __/
SECTION C-C Sco/e, I"• 20'
SECTION G·G SIMILAR
_ ... -- ·2· NY.-(DA• -8.Youn9.
reY13ttd-EleY!I. odd«/ - -..(M. YoW'J9"1"'MQl1
.;.,
<;:;· /"= 10'
/''., 20'
rs -to'
1"0 50'
END PIER DETAILS Sco/e:~ /"• 5'
10 0 /0 20 JO
20 0 2~ 40 60
40 0 fO 80 120
:ro 0 50 100 150
SCALE or FcEr
SAFETY - • NccaNry • WATER STATS OP CALll'OIINIA
THE RESOURCES AGENCY OP' CALIP'ORNIA DEPARTMENT OF WATER RESOURCES
DIVlelON OP' DDIGN AM:> CONSTRUCTION
OROVILLE SPILLWAY MODEL STUOY
40
80
/60
200
APPROACH CHANNEL ANO FLOOD CONTROL OUTLET
GENERAL ARRANGEMENT - _, OATS:
DIIAWING NO. I •Hllff NO.
3412 - E4-02

j £lev J:''t40
Elev8.!t.,.Z7
XZ yZ_ 79"'+7o"·- I
=1}<ff'., of)_ -
r IXl
i,.:,4'7
------· flev 922 /J
----'-M-"o_n~u_al M(.5 Elev. 900.o
Ill
__ _±_9.56'
---C',R,CJN OF ELL/P-::E -~£.Ju._85'6.27
~· /
/
•' ~i I
l>i()
~!? . ' ~I'-
½' l; 0 .oi:'--
~.Q___ R=/00' " - -·-~,. 111;1 I ' ·
AEP';m"t: ~fe;.J!t', .. • . '::-I \ • '\; . -I
7/, 91)'_ ---i---
l
SECTION 0-D ::.11z -E4-02
Sca/,r,: I"• 10'
Eley 8/Q.rQ
··~~·L, n I n I , I .
!
I
I~'~,
Elev, 84S'JI a \-r1 i --' I __
t\· \ r/ ~ 0L~20= o·,
1
! I Typ ..--- -;
I ,
l i
i I I i : 1\: . / I
I I I I I
I
\ I
D~~_l!!C .!!!'__ \ \~ ... -..- ,---
IISYlawao---eTA .... 11NGINl:.,..._,a11,
:. I
l
VIEW £-£ 5412- E4- 02
Sca/~: 1• .. 10'
~-0:'l'
' ~ 1'
,;o I : ! '\\!,_ I
- -"7{1:, ·'. 6Z_ t_ to __ C.8.l
\ i
I I
SECTION B ·B Pier Nose Detail
Nol lo Scc,le,
FIGURE40 REPORT HYD-510
c, /1- ~ I I ,: •
L - I I I / I
I I
~.-r·:.,_._~:_·;.- --" ·:· I
t I ··
' : ! / I I
I
I i I I
i ·1 • ;
I
I: I' I I I: 'I ·"''
/
,'I /1 / ,. / .-r11.·1·_·· /• _,. 1:' ,[--"-/
1"'1 / 11+ /,<, i ,,,,,-.7,:,\'c"'1r--
/ I l _ Es r,,_.n -f~.Y
R.:.(.,K L1rie
,,, ji_il
11!11-V 1,1 111
1 •
. . 'I I I
\ I 'f ___ _ ___ _!.JgL ,-. :....:=:....c~
'\ii'. '
_ _gi=v._g>/3 60
-- - .. 7"f71'<--rc,7--· .•
"-------SECTION F-F
I"= 10'
.?4!,Gr:£4-:.)~
Scale ,~ .. ,o'
/0 0 L.L1.l,l,T,I
,o
' 20
I .J:J
' ..,
- '
SAFETY - •• N-ry • WATER STAff OP CALll'OIINIA
THE RESOURCU AtKNCY OP' CAL.ll"ORNIA DEPARTMENT ~ WATER RIESOUIICl!II
DIVISION OIi' DDIGN AND CON9TIIUCTION
OROVILLE SPILL WAY MODEL STUDY
f'LOOD CONTROL OUTLET SECTION t DETAILS
FEBu• - DAff:

A. Second modification--approach wingwall installed; depression filled to elevation 864; face of gravity dam placed adjacent to the outlet; and the 7. 73-foot vertical face placed over the outlet •.
B. Close up view showing Bays 5, 6, and 7 with the vertical wall over the entrance and the approach wingwall.
OROVILLE FLOOD CONTROL OUTLET
Second modification of outlet 1 :48 Scale Sectional Model
Figure 41 Report Hyd-510

Figure 42 Report Hyd-510
Discharge 150,000 cfs-..free flow
Discharge 150, 000-cfs controlled flow. 20-foot diameter vortex centered over Bay 7.
Discharge 277, 000-cfs free discharge only small vortices form at this discharge but emerging flow remains turbulent.
OROVILLE FLOOD CONTROL OUTLET
Second modification of outlet Flow at entrance and exit 1 :48 Scale Sectional Model

A. Discharge 150, 000 cfs. Reservoir elevation controlled to 899 feet. Vertical wall above entrances extended to above the water surface.
B. Discharge 150,000 cfs. Reservoir elevation controlled to 899 feet. Approach flow was improved by a 15-foot high vertical wall over the outlet entrances.
OROVILLE FLOOD CONTROL OUTLET
Second modification of outlet Effect of vertical wall above outlet entrances
1 :48 Scale Sectional Model
Figure 43 Report Hyd-510

Figure 44 Report Hyd-510
Pier extensions over the sloping face of the buttress dam section.
Pier extensions 16 feet upstream and raised above the maximum water surface.
Combination of the two extensions shown above.
Discharge = 150, 000 cfs. Reservoir elevation 900.
Discharge= 250,000 cfs. Reservoir elevation 899.
OROVILLE FLOOD CONTROL OUTLET
Second modification of outlet Test of pier extensions at outlet entrances
1 :48 Scale Sectional Model

FIGURE 46 REPORI HYD-510
30--..---,-----.---,----r------r------r---,.---~-.....---r----r-----r-~---,
.... LL.I 20 a.. >-.,_ 0 .,_ 0 a:: 10 a..
a:: LLI .,_ <[
3= 0
LL 0
.,_ LLI LLI LL - -10
lLJ a:: :::> en en lLJ a:: -20 a..
-30 160
698
180
47 52
51
50
200 220 240
D I S C H A R G E ( 1,0 0 0 C. F. S. )
NOTE For Piezometer locations,
see Figure 34.
(Outlet modification one.>
All gates full open.
OROVILLE FLOOD CONTROL OUTLET SECOND MODIFICATION OF OUTLET
BELLMOUTH PRESSURES 1:48 SCALE SECTIONAL MODEL
260 280

A. The model with all topography to the right of the approach channel lowered to elevation 864. o.
Figure 45 Report Hyd-510
B. Strong vortex over outlet, discharge 250,000 cfs.
C. Intermittent strong vortex over outlet, discharge 277,000 cfs.
OROVILLE FLOOD CONTROL OUTLET
Second modification of outlet Revised approach topography
1 :48 Scale Sectional Model

698
w a.. >I-0 l
FIGURE 47 REPORT H YD - 510
o 101---+------:~;__--+---+----+----+-----,r--+---+----t---+---+---+---t
a: a..
a: w I<[
~
IL. 0
I-w w IL.
w a: ::::, Cl)
en w 0: a..
.~-+---+---+----l52
0
-10 51
47
-20
64
56 -301---+---+----+-----+----+------if---+---+---+-----+-----5=5=--~
160 180 200 220 240 260
DISCHARGE ( 1,000 C.F.S.)
NOTE For Piezometer locations,
see Figure 34
(Outlet modification one.l
All gates full open.
OROVILLE FLOOD CONTROL OUTLET SECOND MODIFICATION OF OUTLET
BELLMOUTH PRESSURES WITH 15-FOOT VERTICAL WALL
1:48 SCALE SECTIONAL MODEL
280

FIGURE 48 REPORT HYO ~___§J_0_
I 92O.----..----...-----,----........ ---......-----o
]! '
69B
1--------------------1--.... /-'~ft'.-L FIRST MODIFICATION ,,/ I I
910 DESIGN CURVE---- / Q_
/,/ I I
p./ 9OO1----+----+----+-----+-----l-1'------I ho
/;' ,... 8 90 1-----+------'------4------1-_-t.;_,__-4------1 ~ FIRST MODIFICATION r,/ :!:I MODEL DATA t:::.-- ------- - _ I
~ ~t~, .::: 88 0 t----+----+----..+------,,-W.---',-----'------1 z I) 1 '-SECOND M0DIF-. 0 // MODEL DATA 0
! /I ...J 8 70 1----------+-------,....,---------+------1
~ ti 0
~ ~7
::::> 8 6 0 l-----+-----4---~Jf(
~ L,~ i /2~~
85Ql-----+----,NL-+-----+-----+-----+-------I
//' 84Qt----~l/ ___ -+----+-------,f----+-------I
/ 8301--/ __ / ---------+----820 __ l _______ __._ _______ ~~-------
0 100 200
DISCHARGE (Q)IN 1000 CFS
OROVILLE FLOOD CONTROL OUTLET SECOND MODIFICATION OF OUTLET
DISCHARGE CAPACITY 1:40 SCALE SECTIONAL MODEL
300

Ol ID (X)
t-LIJ LIJ 1.1..
z 0 -I-<l I-<l > LIJ ....I laJ
a:: -0 > 0:: laJ (/)
laJ a::
920 I I I I
910
900
890
880
~ ~
~\)\,, 870
860
850
840
I I I I I I I All gates equally open
830 /
/ 820"7
01O0~-~~-4~-~o-~:;--'*o-ii;---~,-±~--;~---:::h:-----=b:---=-~-_JL_J __ J 20 40 60 80 100 120 140 160 180 200 220 240 260 280 300 DISCHARGE (1,000 C.F.S.)
OROVILLE FLOOD CONTROL OUTLET SECOND MODIFICATION OF OUTLET
DISCHARGE OPERATION CURVE 1:48 SCALE SECTIONAL MODEL
::ti fTI ""O .,, o::u G) -I C
:::c :::0 -< l"l'I 0 ,~ (JI (D
0

FIGURE 50 REPORT HYD-510
I I I I I I
90 t-------1r------1 RES. WATER SURFACE EL:--,"'-,.
"'f'!!!!~~""!!!!!!!!!!!!!!!!!!!!!!!!!!'""==~-' t ~--:::::::
BOi---t---t----,r-------i
I I I I I
1(~ii1Ev . -~:·.-:c', _._: .. ,_ .. I I.:·.-·.· : .·-o.· ·<;>·.:
,-o:
I • :·!I)"···:
I 1 ,'l OF GATE OPENING
1 o t----,,----,,----,----1 v r -'--llf+II+--'-- - -----
____,,,.............._ _____ _
,, I
I )
'I I /I I
4/ I II • ii I
Z Cd= A~2gH _, 60 t----,r----,,------1----1 WHERE :
Q /J 0
c(
A = CROSS SECTIONAL AREA OF PASSAGE AT GATE (FT.2 )
Q = DISCHARGE (CFS) H = HEAD IN FEET
/ii LLl 50
I N -·FIRST MODIF. I I MODEL DATA
V l~
'I I~
698
FIRST MODIFICATION---- / /£_ SECOND MODIF. DESIGN RATING ~y ~'/- MODEL DATA
401---t---t----,.----,.----,.------1-------1---=~---t---,----,----t-----t
/v /'
201-----,--------,-----+---+---+---+---+---f'~-+--+--+--+--+----I
0.60 0.70
COEFFICIENT OF DISCHARGE - (Cd)
OROVILLE FLOOD CONTROL OUTLET SECOND MODIFICATION OF OUTLET
0.80
COEFFICIENT OF DISCHARGE - FULL OPEN GATES 1:48 SCALE SECTIONAL MODEL
•
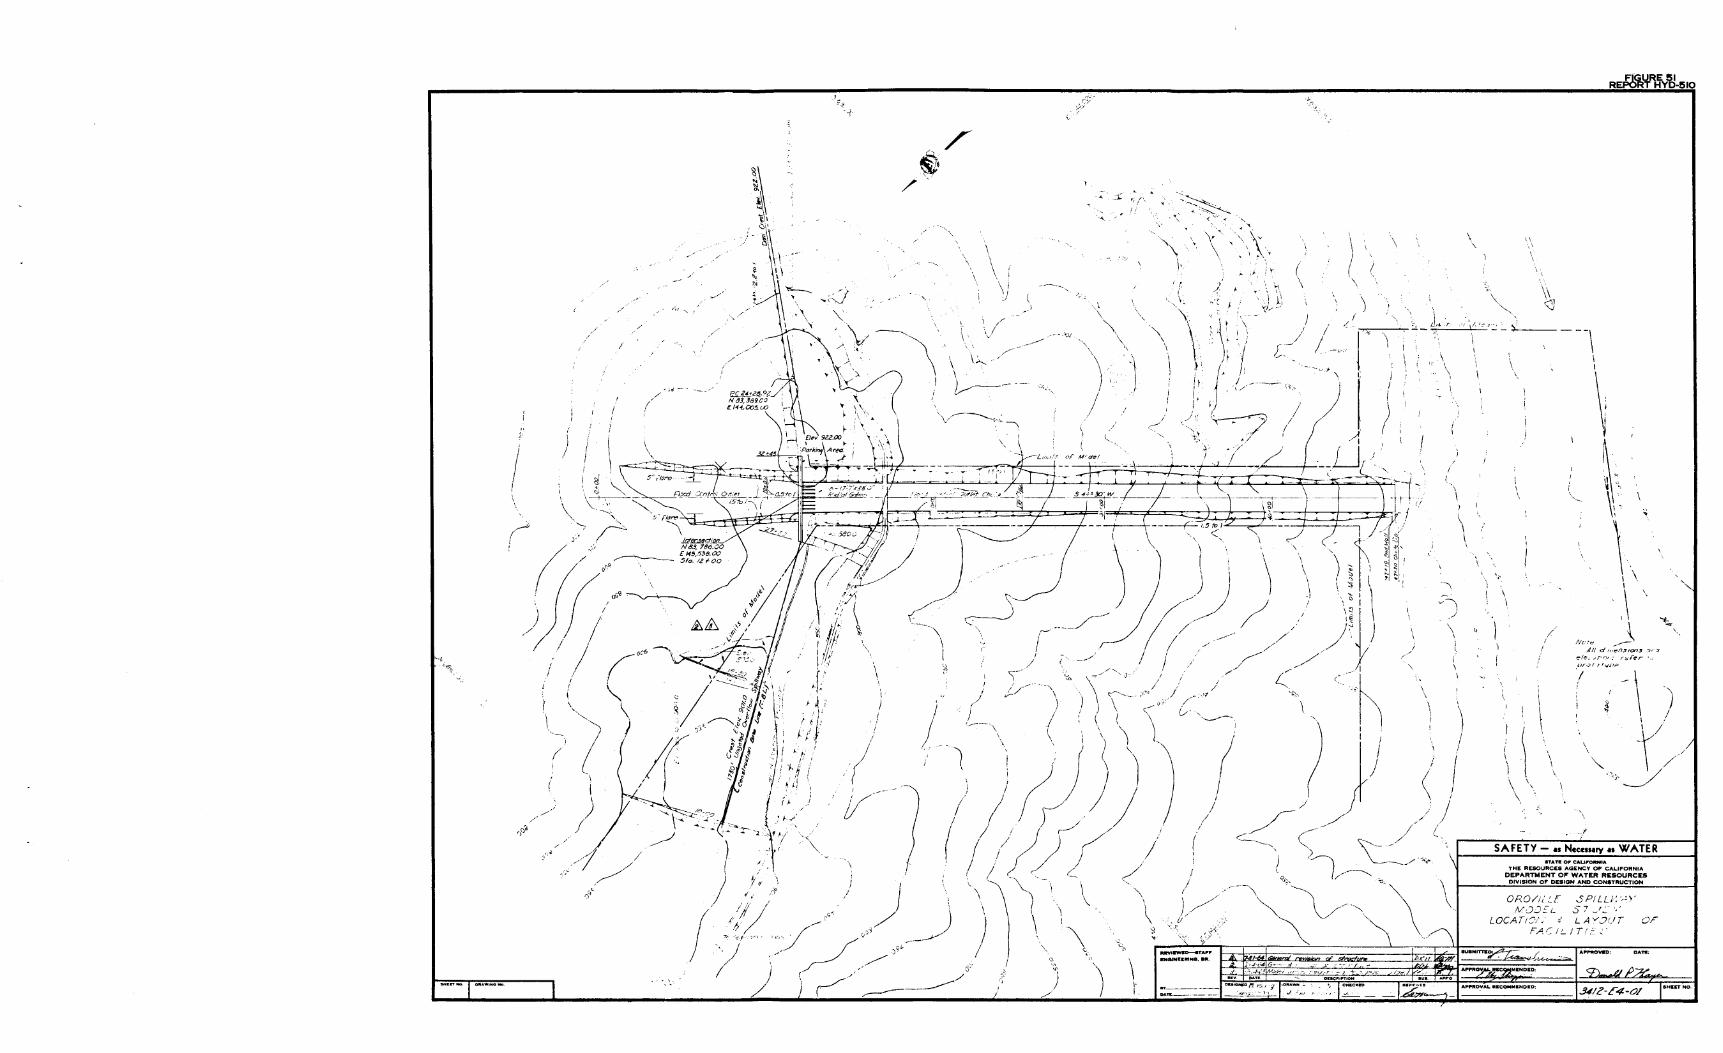
( .--"
···t--i~
r§}
I
r
\
(
.,,,.,,,,,:
/
-' ,,, "
/
/
- ;d - ~- .. -
(/
I . I I
i I \ ~I .,,,
\' -....... ,
( __ oc6 -...,. _
\ .. ,,, )
( \
I I
) j
\ \ )
1,{ / / /
,, / ,C
0"
\ ; \\~\
1?. '1 I ~ I '""---
-'" _/
1. ':"~
-r
... ;(/
/ i
/'
,,
\ \ \
i,
... :J.:
.... _
\i ---~~ j (
", /"\ ii
' --~ ."I'< "--~;-.(" '-
,;,. /t'
"\ \~,· ,,:'\,,,. \ ' '
\ ~ ' ."' \ ·,.. \ ..
; '
l ). J. "I'" \ '~\
( \ \
\
'\ '
-/,v.:,, --~ I /
\ .. /
)
,,, -~ ~
\
'', '·,~ \. ·. ?\~.' :) J,i: j /1 \ ,/11~ 1 J," r. -- --~;J, \ -- ,,
'\ \
,,, \ ~' /) I , \' \ ' ' " '",,..
\ \;.__ ' /
\
· , I ) . --v., '', I ( I ~· -,f ': (, ' : ', -- -- u , \ 1: ' ,· -')
/ ,-'
If. j I --- . ·. ,.
:: ',~1-_G-I I A >;, ,/ . . I
1, ' - - rt,=:::::l ~· =::· ' ) / - / __ LJ~ ,. · - ·21 - ~~d t:'¼0j- +i § i1z1 ~;fr+.··· · r;=1;;
1---{'-•><• ;:: ~t • ~f \ \ , \ -. \ . , < - ~ !1 ~I'
V. ) ) ) \ ./ l I I H:
-- /~/ / ' \li\ -\ r_/r I/ / /- /i J I 1-" I I' / / y ') / , - t / _./ _.,,,. I "\
i ' / J> \, ) \-~: \ [.,! / z,, ' h \ j / \ .. J ) )\ \ \ \ ~( ! i ) :. (II JI) I ' t
(. ;1 / )'),., ,/ I -< C "' //
' ~ ~.\,, "" .\ ... \;,---...,,___ (.'<.,
~
'
/;
'\
' \\
\
i---- --
,,
\
\
I (
\ \
-, ~--,
_ _;
\
I /
.· 1 / I < ) ,,/ ; \ 1//----. ,::-.:__,,_ \11~ ': \ \ J/ ,~~'- "\ \
/ '\ \ ':c" .. ...--...... '' ------r-,--;--~---~--,-
.Q 4 I /- 5r.
\
\ \
\
'i,'.
\ '--,
'_\ ,,
\\ (j
FIGURE !51 ~E!"Q_BT 1-!YD-!510
/, '~ , ..
\ ,c
\ \
\, \
!
---\ I I
\ i
i' ' C,
11 u
~'.~
\ ,\ ,\ \
/Ve.•'=' ,,...--
~
All d ,,,ens,on.s ?-' :7
ele. ,1/"•n,: 1:::c-lt'!r •,
_or,?IJ,.<./ilr""
'i_;,,
l -\ J I /
/
',
'
\ \ \ -1' I ' /
\
'
\ j
'" / ' :, \-~
SAFETY - •• Necessary 11 WATER STATa OP' CAUP'OIINIA
THE RESOURCES AGENCY OF CALIFORNIA DEPARTMENT OF WATER RESOURCES
DIVISION OF DESIGN AND CONSTRUCTION
OP0/1,:_r SPILL/'.>"' /VO:J~L 57 -':_ ','
L0CATI::':', LAV:Jt_!T OF FA CI!_ IT t ,0 ; ,
:! -~, ~) \ :~,4.;.:~i:,~:; ~/~~--~ -~-;,/~~;,~.~:·~· -,,_,,_. <) ) \• BY-------~~;;;;;Sl~~D:3-~.~~-'~/ ;:;;,,OillA'.;:~ -~. ~',. ~cM,~Ckm~~~~~~~==½.:~~'/~:Z-~£4-::!::•a::!1/~0H~HT~NO.
/ I. ~Tl:.-·---- ,u·,~,_,1_ J. -~,, f ., ..,,_

Wrop-Araulld Se::f10t1 -------~
I :)/ ~1 .£. Wrap-Around I Section
I I
I '< I -. I
I !
_, ..... ,-... ........
,[ !.5
____ r._c,o=_af Outlet Works - £/~v; 922. Oc,O'---------~~---i -- - TT- ,--7 -r
I I I
I B'p/er I 1 , ,cente~n(y I
5p1er..,..:. __ I 1
I typ '
Elev. 901. 00
1 FIGURE 52 REPORT HYD-510
Trw of Wmq _Wall- £/e.,,-.87f(OO~-----'--. i , I ' I
~------------l +-------,,/'Ts JI
2.2.-1
I
I 05
_Approach Channel -£/~v tJ!!. 0
'I!
/
- J 05
g ~ 2 "'
17'·7" All Open,;-,t)S J -'--.(3-17'-7•,,33'-0" Radio/ Got~·o
UPSTREAM ELEVATION
Serv,ce Deck
_)
I
Scale· I" ·20'
Spdl,roy Chutti Equation of &Iii
r~ ,-
33'·0'.\_ - I ~-=--=-c 4;il'"V. 856.99
Radio I Go~ TrunniQI? ;~-Elev. 848 . .SO
i------ --------·- ---------~-J?~-~ -·-·--- --- JY! +-;;:~I _--2Q:-g·
I
,,___,
Note Tic~ marks show tocat,on of gate trunnions See S~tion A-A tor dera,ts.
A~ Channel·Elev.~l',.....-- V s•-00185 \. I !:X'ii/'14\, =ti l
I I
I
\ '; I I ~--~=~~==-.-----------~--------<..0-v~,....,. -_ I /OJy ,S;
·--v~rricot Fact!- gl :.O/t;'-'oy
"' ~ 1 ~u!Af:ead slor- l'deep Jt:2' wide o. _ I <\i
m w1"9 walls only. 9\ ~ ~ O
"' ~ ~
"' ----1- £quat1on of el!,pr;cof porr,on of wing woJI:
1---'==,;i..---<l ....t!...2+...r.! ,:/ 50 2 30 2
SECTION A-A 9cale · t• •20'
I
--{ ~ _ 50 Flore /.5:/ 0.5-1 0.6:/ 1.5:/ ~_6_c_cr £---1 --+-j
c_~--~1 I PLAN
\ Seal~: 1"•20'
--~ a
Q
-+
DETAIL Typicol Pier Nos~ Curvarure
Seal,:- :J" •I'
t'• I'
1"•20'
p 10
20 20 40 60
SCALE OF FEET
SAFETY - • N--,y • WATER •TATI: OI'" CAUl'OIINIA
THE RESOURCES AGENCY OP' CALll'OIINIA DEPARTMENT OF WATER RESOURCES
DIVISION OF DESIGN AND CON9TIIUCTION
OROVILLE SPILLWAY OUTLET WORKS
DETAILS
I _A ... I I I 1 1 1-...... 11NC1..-mttNC1.•1t. - ... ,.,
.., ____ _ ~ l1e;: R~drr,.-n ,-J Youn.2.~rmon J.~man
APPIIO¥AL MCOlll!DtaaD.
1cuc•n .....-.OVAL~:
'j:'i2'.'."'t:4-03
,. 80
--

OROVILLE FLOOD CONTROL OUTLET
Third modification of outlet 1:48 Scale Sectional Model
Figure 53 · Report Hyd-510
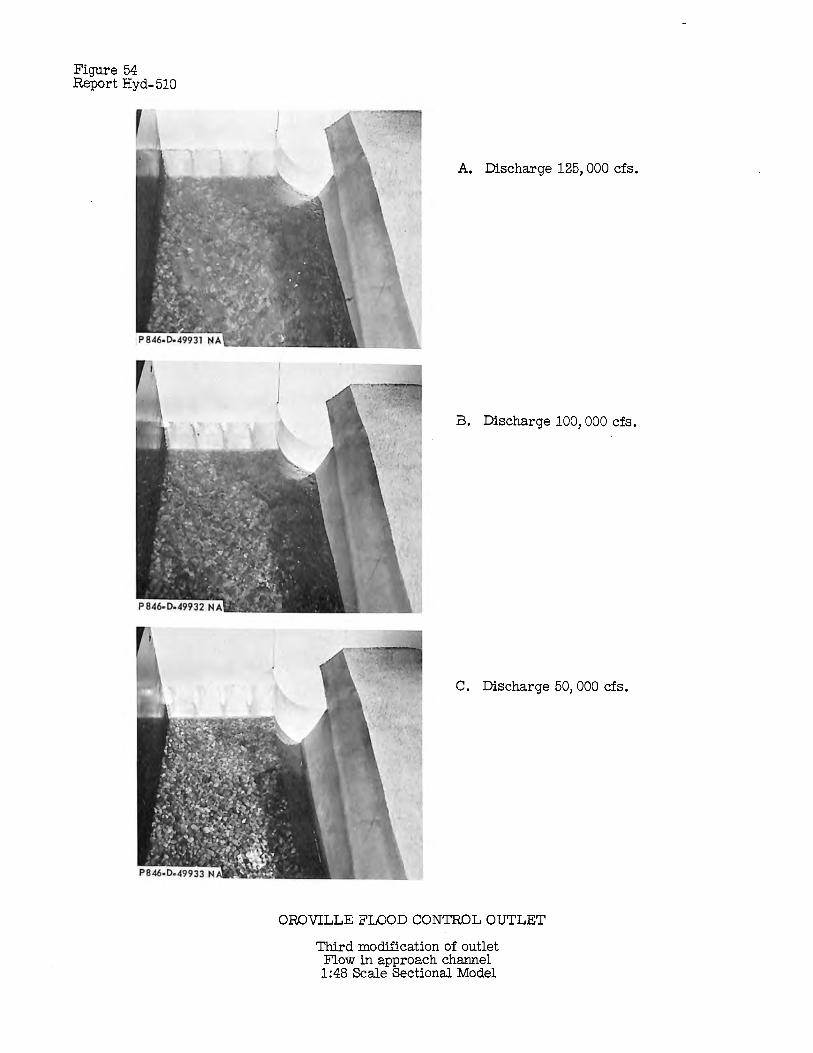
Figure 54 Report Hyd-510
A. Discharge 125,000 cfs.
B. Discharge 100,000 cfs.
C. Discharge 50,000 cfs.
OROVILLE FLOOD CONTROL OUTLET
Third modification of outlet Flow in approach channel 1:48 Scale Sectional Model
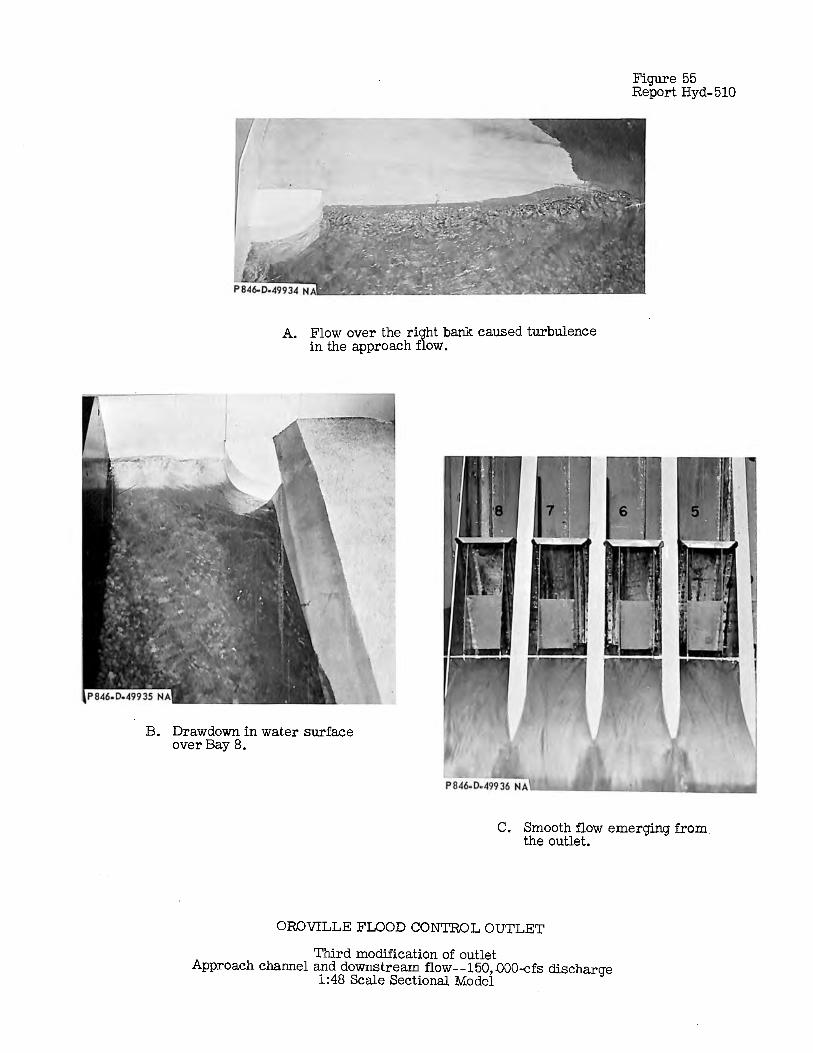
A. Flow over the right bank caused turbulence in the approach flow.
B. Drawdown in water surface over Bay 8.
Figure 55 Report Hyd-510
C. Smooth flow emerging from. the outlet.
OROVILLE FLOOD CONTROL OUTLET
Third modification of outlet Approach channel and downstream flow--150,.000-cfs discharge
1 :48 Scale Sectional Model
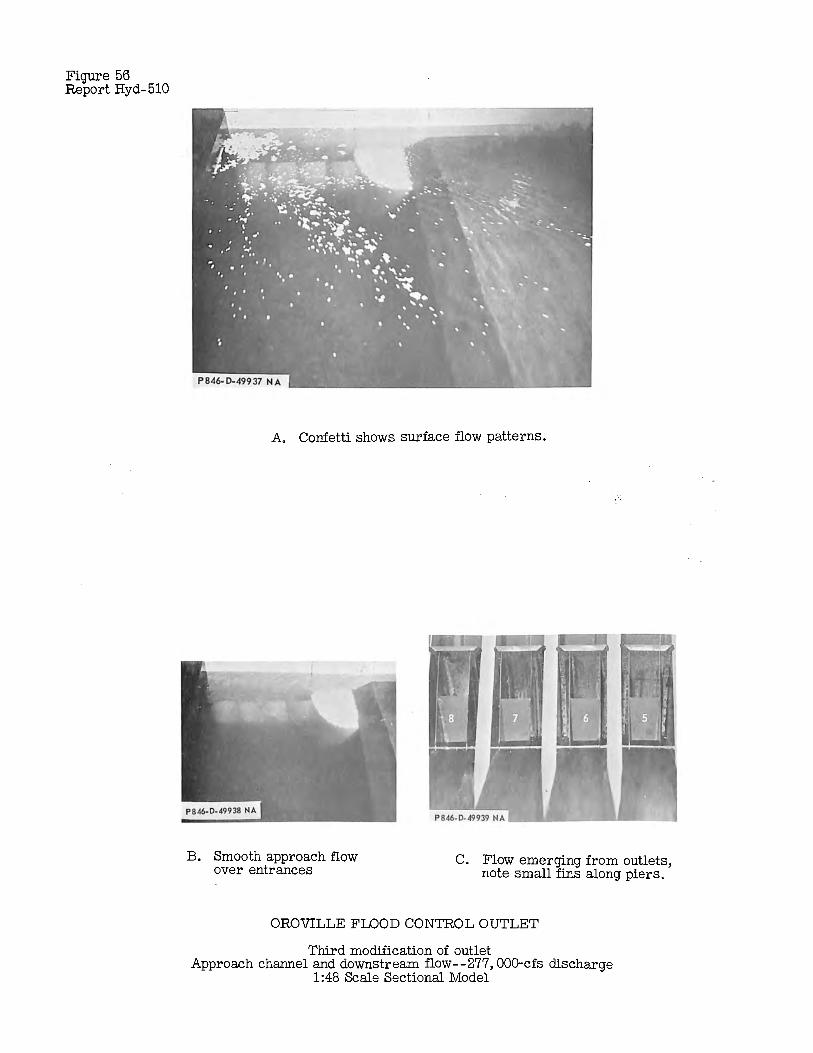
Figure 56 Report Hyd-510
A. Confetti shows surface flow patterns.
B. Smooth approach flow over entrances
C. Flow emerging from outlets, note small fins along piers.
OROVILLE FLOOD CONTROL OUTLET
Third modification of outlet Approach channel and downstream flow--277, 000-cfs discharge
1 :48 Scale Sectional Modei
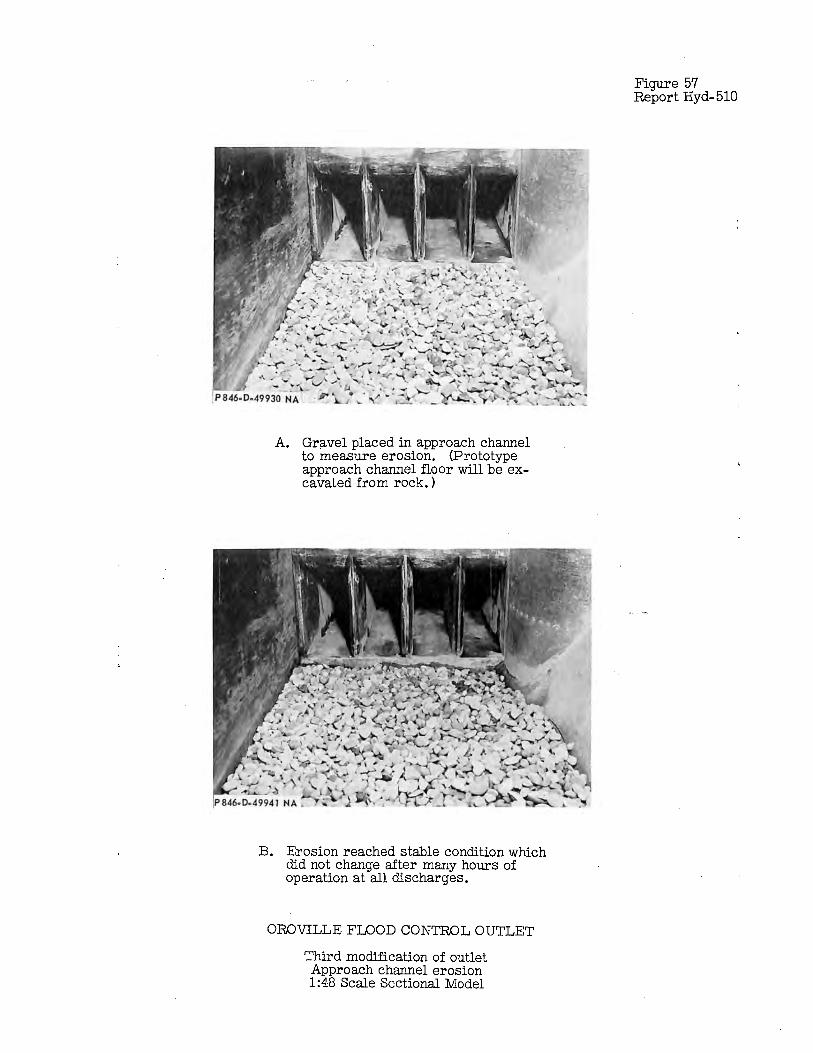
A. Gr~vel placed in approach channel to measure erosion. (Prototype approach channel floor will be excavated from rock. )
B. Erosion reached stable condition which did not change after many hours of operation at all discharges.
OROVILLE FLOOD CONTROL OUTLET
Third modification of outlet Approach channel erosion 1:48 Scale Sectional Model
Figure 57 Report Hyd-510

698
FIGURE 58 RF.PORT HVO-5IO
PIER 9 - RIGHT END PIER 47·---. I
I I I I I I I :6·,'\TL-
37 38 39 40 41 42 43 44 45
29 I
ft. Bay 8 28 -30 31 32 33 34 35 36 I I I I I I
I 35a~-_J f'--49
I I
,--26a I
19 20 21 22 23 24 25 26 \ 27 I I I I I I I
5--48 PIER 8
~ Bay 7 ------·--------------------
I 170~ 1 --51 (Elev. 851.9)
.._----------------1I~--1-I --+I --+I ---~--1-1-~ 10 II 12 13 14 15 16 17',, '18
PIER 7
'l--50 (Elev. 829.7)
Ct. Bay 6 __________ -4_-42 _ _._3 __ 41----15~---6~__.1 _ __.8__.~_9......__
---8a
I
.__ ____________ P_1E_R_a __________ ~_ I FLOW
-<----
~ Bay 5 -------------------- ------1--
PIER 5
NOTES P!ezometers 46 and 47 are 16.35ft. above the floor. P1ezometers 48 and 49 are on floor. Piezometer No. 50 at· elevation 829.7 below No. 11. Piezometer No. 51 at elevation 851.9 below No. 18. All other piezometers are located in the roof of
the bellmouth.
OROVILLE ~LOOD CONTROL OUTLET THIRD MOOIFI.CATION OF OUTLET
PIEZOM ETE R LOCATION PLAN 1:48 SCALE SECTIONAL MODEL
1-t---------Station 12+00
WALL OF SYMMETRY--------_..,,.=,
SCALE (FEET)

698
FIGURE 59 REPORT HYD-510
( +) (-)
(+) (-)
0 r--
0 <X>
0
"' "' 0
<D
"'
KEY: Piezometer locations (All on roof)
BAY NUMBER 6
... "' "' ... ... ... in .; ,,; "' "' "' "' in .f' "' "' "'
BAY NUMBER 8
20
"' "'
<i' 0 m <X> ... "' "' (\J ...: 0 en "' "' "' "' r<f l\J ...: 0 "' "' "' "'
0 20 40
PRESSURE SCALE Centerline of bay _____ Right corner of bay _____ Left corner of bay
( PROTOTYPE FEET OF WATER)
See piezometer location plan figure SB
4 0
OROVILLE FLOOD CONTROL OUTLET THIRD MODIFICATION OF OUTLET
4
SIZE SCALE (PROTOTYPE FEET)
8
BELLMOUTH OUTLET PRESSURES - DISCHARGE 277,000 C.F. S.
1:48 SCALE SECTIONAL MODEL
0
r--"' ar "' ai
60
12

l,c:lcatlon Piez0111et-er- No. r ~
Centerline l!aY;_ 6 Pressures (Prototzye Feet)
3 4 5 0 1 8 Ba 9 10 ll 12 13 14 15 Right side Bay 6
l.'6' l.7 17a iB' Left side Bai, 8
1.2. 20 21. 22
~ t:rj (D , .....
'8<§ 1--j 1--j c+ (D
~8 0.. I 01 f-' 0
2~
Free flow Q.=277,000 cfs Reservoir el=907
-0.5 -5.3 -4.8 .7.2 .7.7 -8.2 -8.2 -11.5 -12.0 +16.3 "9.l •l.0 -2.4 .7.2 -7.2 -15.8 -18.7 -19.7 -3.8 +26.9 -3.8 -8.6 -6.7 -ll.0 -12.5
Free flow Q=2}4,000 cfs Reservoir elc891
o .3.4 -2.9 -4.8 -4.8 -4.8 -3.4 -4.8 +16.8 +7.7 -0.5 -1,0 -4.8 -4.8 •ll,0 -8.6 -4.8 +23.0 .3.4 -6.2 -4.8 -7,2 -7,7
9-in. gate closure Q.=254,ooo c:rs -teo.2 +7. 7 +10.1 +1.9 +1.0 o +o.5 -3.4 .3.4 +25.0 +20.6 "9.6 +7.2 +2.4 +2.4 -6.7 .9.1 .9.1 +1.4 +29.8 +25.8 +15.8 +12.0 +7.2 -f?,3 Reservoir el.=907
3-in. gate closure Q=,268,500 cfs +4.3 -2.4 -2.4 •5•3 .5.3 -6.2 -4.8 -10.0 +17.3 +10.1 +1.0 0 -4 •. 8 -5.8 -13.9 -13.0 -14.9 +27.8 +4.3 -2.4 -1.9 -6.7 .7.2 Reservoir el.=907
L:ication P:1.ezcineter -l'l'o. 2l;
l.e:rt side liaz. 8 25 26 26a 27 2B' ~ 22
Centerline l!az.l!. 3l 32 33 it_ 3L~~a 2ri 3.I i'S 3.2
Right side Bay 8 4.Q.~ _li.1 -- ~42 lµj'. 4.:l !2.Q 2,1
Free t'J.ow Q=r277,000 cfs Reservoir ela907
-15.4 •25,0 -31.7 •13,9 +18.7 .7.7 -ll.0 .9.6 -13.4 -15.4 -15.8 -16.3 -20,2 -18.7 +1.9 -2.4 .7.2 -6,7 -8.2 -9.l -8.2 -10.6 -12,5 +31.7 +26.4 -0.5
Free flow Q:,234 ,ooo cfs Reservoir elc89l
-10.1 -17.8 -19.2 +20.2 -4.3 -6.2 -5.3 .7.2 -8.2 -1.1 -1.1 -10.1 +13.0 -1.4 -4.3 -3.4 .3.8 -4.3 -2.9 .3.8 -7-7 +13.0
9-in. gate closure Q.=254,ooo c:rs +1.9 .7.7 -12.0 o +26.9 +27.4 +14.9 -19.6 -t5.3 +e.4 +1.4 o -5-3 -5.8 +13.0 +26.4 +16.3 +12.0 -19.1 -t6. 7 +7.2 +4.8 +1,9 +}4.6 +32.2 +4.3 Reservoir el"'907
3-in, gate closure Q.=268,500 cfs -10.1 -20.6 -23.0 +22.6 +2,4 .3.8 -3.8 -6.7 .9.6 .9.1 -9.6 -15.8 +7.2 +7.2 -1.0 -1.4 -6.2 -4.8 -3.4 .5.3 -7-7 +32.2 Reservoir el.=907
NOJ!ES: P:l.ezaneters l'l'o. 8s., 17a, 26a, and 35a are at elevation 850.0; P:l.ezaueter No. 50 is at elevation 829.7 below P:l.ezaneter No. 17; P:l.ezaneter No, 51 is at elevation 851.9 below P:l.ezaneter l'l'o. 18.
OROVILLE FLOOD COllTROL OUl'Ll!:.r Third Modification of Outlet
Bell.mouth Pressures 1:48 Scale Sectional Model
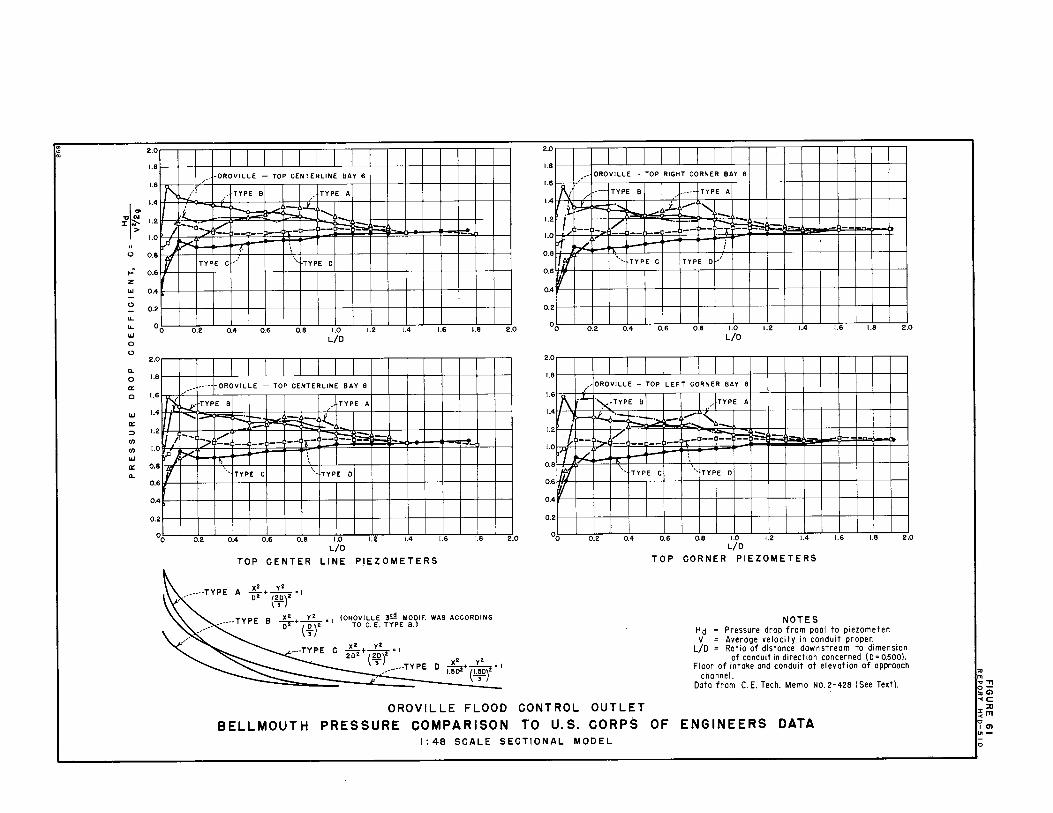
O>
:::
"' " "'
2.0
1.8
1.6 'I' I
;1,,.../
.-L I 1.4
:l: ~ 1.2 i--1.0
0 0.8
c! v, Iv ._:- 0.6 ·~ z
"' 0
""---'' ;,-
/ ·OROVILLE - TOP CENTERLINE BAY 6
, TYPE B , TYPE A
,_,. ~...L. • ....... ~-=
,<-. ---;,, - --~-- ,,..- -- ~- - -- --~
TYPE C ,-' \ ·TYPE D
2.0
1.8
1.6
1.4
1.2
1.0
0.8
0.6
0.4
0.2 I
,-- OROVILLE - TOP RIGHT CORNER BAY 6
J\i TYPE B ----- TYPE A
' . ·, . j_ -' J.:,- -I.,.) ~ -. .,_ , __
1-- --~-- -Ti ---- --/.~- ... i
ti • ••• TY PE C TYPE D ,/
- - -
lL
lL
0.4
0.2
00 - -0.2 .. 0.4
. 0.6
. . 0.8 1.0
L/D .
1.2 1.4 1,6 . -1.8 2.0 00 0.2 - . 0.4 0.6 0.8 1.0 L/D
1.2 1.4 1.6 1.8 2.0
"' 0 0
Q.
0 0:: 0
"' 0::
2.0
1.8 I
1.6
1.4 ) I
,,,-- ----- OROVILLE - TOP CENTERLINE BAY 8
.._;, TYPE B , TYPE A
- . z_ -::> 1.2 (/l
(/l 1.0
/ -/-- )-:;, __ , r-' -- )-- - . _, -- -- --
"' ' !,ii
) 0:: 0.8 Q.
0.6
0.4
0.2
00
y ._,,.
~
- -0.2
' TYPE C
- . 0.4 - -0.6 - -0.8
\, TYPE
. -1.0 L/D
0
. -1.2 .. 1.4
TOP CENTER LINE PIEZOMETERS
. -1.6 . -1.8
_ .. -···TYPE A x2 y2 -+--'I o• (¥,)'
8 ...1!.!_+_r!..._ • 1 {OROVILLE 3!:l! MOOIF. WAS ACCORDING o• (-t)' TO C. E. TYPE B.)
x2 y2
D 1.so•• ('-~D)' 0 I
OROVILLE FLOOD
BELLMOUTH PRESSURE COMPARISON
2.0
1.8 I
1.6
1.4
; J\ I
1.2
1.0
. t '11
0.8
0.6
I
Jf/ 't I 0.4
0.2 I
2.0 00
, OROVILLE - TOP LEFT CORNER BAY 8
·- ''x ,Y
-- --./
. 0.2
TYPE B -- TYPE A
·-==~- -·, '""> - --- -l/ - ~ , __ -,.,.- )-- -- --__ , -- -- --~-
' TYPE C • TYPE 0
. . 0.4 0.6 0.8 1.0 1.2 1.4
L/D TOP CORNER PIEZOMETERS
NOTES
. . 1.6
.. 1.8 2.0
Hd = Pressure drop from pool to piezometer. V = Average velocity in conduit proper.
L/D = Rotio of distance downstream to dimension of conduit in direction concerned ( D = 0.500).
Floor of intake and conduit at elevation of approach channel.
Dato from C. E. Tech. Memo NO. 2·428 ( See Text).
CONTROL OUTLET TO U.S. CORPS OF ENGINEERS DATA
I: 48 SCALE SECTIONAL MODEL
,, "' " ,.. o-
1~~ :,: ;:u -<rrt ,0 I 0) u,-
0

Location Piezaneter No.
Q=9,375 cfs WS=847.9 ft
Piezaneter Pressures {Protot: Feet of Water
1 2
' Centerline :ea.z
4 5 6 7 8 8e. 9 10 ll - ~2 l) ~ 11i 15 Right side :Bay
16 17
~ ~- ~ ~ ~ ~ ~ ~ ~ ~ ~ ~ ~ ~ ~ ~ NS ~
~l;:j (D I-'•
'8~ ~(D
p:1 o:i «: t,..:> p. I ai I-' p
17a 18 *50 :,1
NS NS 12.5 0.5
Q=9,Y75 cfs WS=863.5 ft
17.3 16.3 15.4 14.4 13.9 12.5 ll.5 10.l 9.4 7.2 17.3 16.3 15.8 14.4 13.9 12.5 ll.0 10.l 9.110.l 30.2 9.6
Q=9,375 cfs wS=874.8 ft
QmJ.8, 750 cfs wS=:86;.5 ft
Q•l8, 750 cfs wS=874.8 ft
Q-18,750 cfs wSa890.o ft
Q=J.8, 750 cfs ws-900.0 ft
B<m:S:
27.8 27.4 26.4 25.4 24.5 23.0 22.1 20.6 20.6 17.8 27.8 27.4 26.4 25.4 24.5 23.0 21.119.7 20.6 17.8 4o.8 20.2
-1.0 -2.4 -2.4 -2.9 -2.9 -2.4 -1.0 +1.0 +2.9 -f5.3 +1.0 -2.0 -2.0 -2.9 -2.4 -4.; -3.4 -1.4 2.9 -f5.3 16.3 2.9
21.619.7 15.4 13.0 u.5.10.6 u.5 12.5 1;.9 15.8 21.619.216.3 1;.4 12.0 9.6 9.110.114.9 11.; 28.8 10.6
37.9 37.4 ;4.1 ;o.7 28.8 27.4 27.8 28.3 29.3 31.2 37.9 ;5.0 35.0 31.7 29.3 26.9 25.4 25.4 29.3 32.2 43.7 28.3
48.o 47.5 44.6 41.3 39.4 37.9 37.9 37.9 42.2 40.8 49.0 46.6 45.6 42.2 39.8 36.5 ;5.5 35.5 39.8 41.8 53.3 ;6.o
*Piezaneter Bo. 50 located 16.35 feet above the floor of Bay 6 and 3.6 feet from the nose of Pier 7. **P.l.ezaneter Bo. 51 located 38.29 feet above the floor of Bay 6 and at the nose of Pier 7. (See P.l.ezometer
Location Plan, Figure 58.)
Key: Q • discharge
WS • reservoir water surface elevation BS • not submerged (about 4 feet of draw.own in the bay)
OROVILLE FLOOD CON'l'ROL Ol1rLEr Third Modification of OUtlet
P.l.ezometer Pressures--Only Bay 6 Operating 1148 Scale Section Model

+2
it w I-ct
== lJ. 0 I-w w lJ.
w a. >-1-:: 0 I- +20 0 0: a. 0
w -20 0: ::J U) U)
w 0: a. +20
0
-20
+20
0
24 (PIEZOMETER NUMBERS) AVG. PRESSURE -14
~~~,;,,
25 AVG. PR. -24
26· AVG. PR. --26 0
33 AVG. PR. -12 -2
34 AVG. PR. -16 -4
35 AVG. PR. -19 +1
TIME IN SECONDS (PROTOTYPE)
Figure 63 Report Hyd- 510
+11
+20
+14
+12
A, Discharge 277,000 cfs B. Discharge 150,000 cfs C, Gates closed 3 feet Res, W, S, El. 907 Res, W. S, El. 863 Disch. 218,000 cfs W, s. El. 907
Note: Avg, pr. shown in feet of water.
OROVILLE FLOOD CONTROL OUTLET Third Modification of Outlet
Dynamic pressure records
1:48 Scale Sectional Model

Figure 64 · ~~?rt Hyd-510
Type of operation
Discharge
. . . • • • . .
.. m,ooo cfs: . . Reservoir . .
elevation 9(11 . . . • . .
Discharge . . 150.,000 cfs: . .
Reservoir • . elevation . . 863.5 . . . . . .
Discharge . . (approxi- .
• mately) . . 218.,000 cfs: . .
Reservoir . . elevation . • 9(11 . .
Gates • . closed . . 10 % . . . .
Piezometer: number* . . . .
24 . • 25 . . 26 • . 33 .
• 34 . . 35 . .
. . 24 . . 25 . . 26 33 . . 34 . . 35 • . . . . . 24 . • 25 . . 26 . • 33 . . 34 • . 35 . .
• . . . • • . . : . . . .
Average . Maximum . Minimum . . . . pressure: pressure : pressure: . . . .
-13.7 . -12.5 • -14.9 . . • . -24.5 . -22.1 . -28.1 . . . . -26.3 • -22.7 . -29.9 . . -12.5 • - 5.3 . -24.5 • . . . -16.1 - 8.9 . -28.1 . . . -19.1 . -13.1 . -29.9 . . . . . . • . . • . . . . - 2.9 . - ·o.5 • - 4.1 . . • . - 4.1 . - 1.7 . - 6.5 . . . . + 0.1· . + 3.7 . - 3.5 . . - 1.7 . + 1.9 . - 4.1 . . • • - 4.1 . - 1.7 . - 6.5 • . + 1.3 . + 3.7 . - 3.5 . . . . . . • . . . . . . . . . +19.9 . +21.0 . +18.7 . . ":;1.2.7 +15.1 • +10.3 . +10.9 . +13 • .'.3 • + 8.5 . . • . +19.9 . +25.9 . +13.9 . . . . +13.9 . +19.9 . - 4.1 • . +12.1 . +18.1 . + 3.7 . • . . . . • . . . . . . . . . . . . . . . . . . . . .
• . . . . . • . . . . .
*~ee Piezometer Location Plan Figure 58.
OROVILLE FLOOD CONTROL OUTLET Third Modification of Outlet
Summary of Dynamic Pressures on Bellmouth Roof 1:48 Scale Sectional Model
Frequency cps
1.0 2.2 2.1 3.9 1.5 2.0
1.3 2.4 1.8 4.6 1.4 1.5
+1.1 +1.s +1.8 +4.5 +1.4 +1.7

Piezometer: Pressures (Pro~ot:ll2e Feet) number . With 8-foot pier: With 5-foot pier .
1 +3.8 +6.2 2 +1.0 -1.4 3 +1.9 -1.4 4 -1.4 -3.8 5 -0.5 -3.8 6 . -0.5 -4.8 . 7 +1.4 -5.8 8 . -1.9 -8.6 . 9 +28.8 . +22.1 .
10 +14.4 +13.4 11 +4.8 +1.9 12 +3.4 +0.5 13 . -1.4 -4.3 . 15 . -2.9 -12.0 . 16 . -9.6 -12.9 . 17 --11.0 -9.6 18 +37.4 +33.l 24 -7 .7 . -13.9 . 25 -16.3 -24.0 26 -17.8 -31.7 33 -6.2 -18.7 34 -6.7 -15.4 35 -14.4 -23.5
Discharge 277,000 cfs
See piezometer location plan Figure 58
OROVILLE FLOOD CONTROL OUTLET Third Modification of Outlet
Pressures on 5- and 8-foot-wide Piers 1:48 Scale Sectional Model
Figure 65 Report Hyd-510

FIGURE 66 REPORT H YD- 510
920
910
900
890 .... UJ UJ IL.
z 880
z 0 .... ~ UJ
870 ..J UJ
UJ 0
rt a:: :::) 860 (/)
a:: UJ .... <(
3 850
840
f--1~ I i1
FIRST MODI Fl CATION 01-
//e DESIGN CURVE--_ .....
1~1.1/ ' ' ' '
11/ /J~:' :'/
//;/ FIRST MODIFICATION v1-1 MODEL DATA Cl.-- ' 'J.. - --Jl'' '- A J : . \
SECOND MODIFICATION I,;' '-THIRD MODIF. MODEL DATA o--, APPROVED DESIGN
MODEL DATA 13
~{j-.
£) p'
~< ;
/ JI
.,, f-°
830 I
698
820 0
I I
100 200
DISCHARGE (Q) IN 1000 CFS
OROVILLE FLOOD CONTROL OUTLET THIRD MODIFICATION OF OUTLET
DISCHARGE RATING 1:49 SCALE SECTIONAL MODEL
300
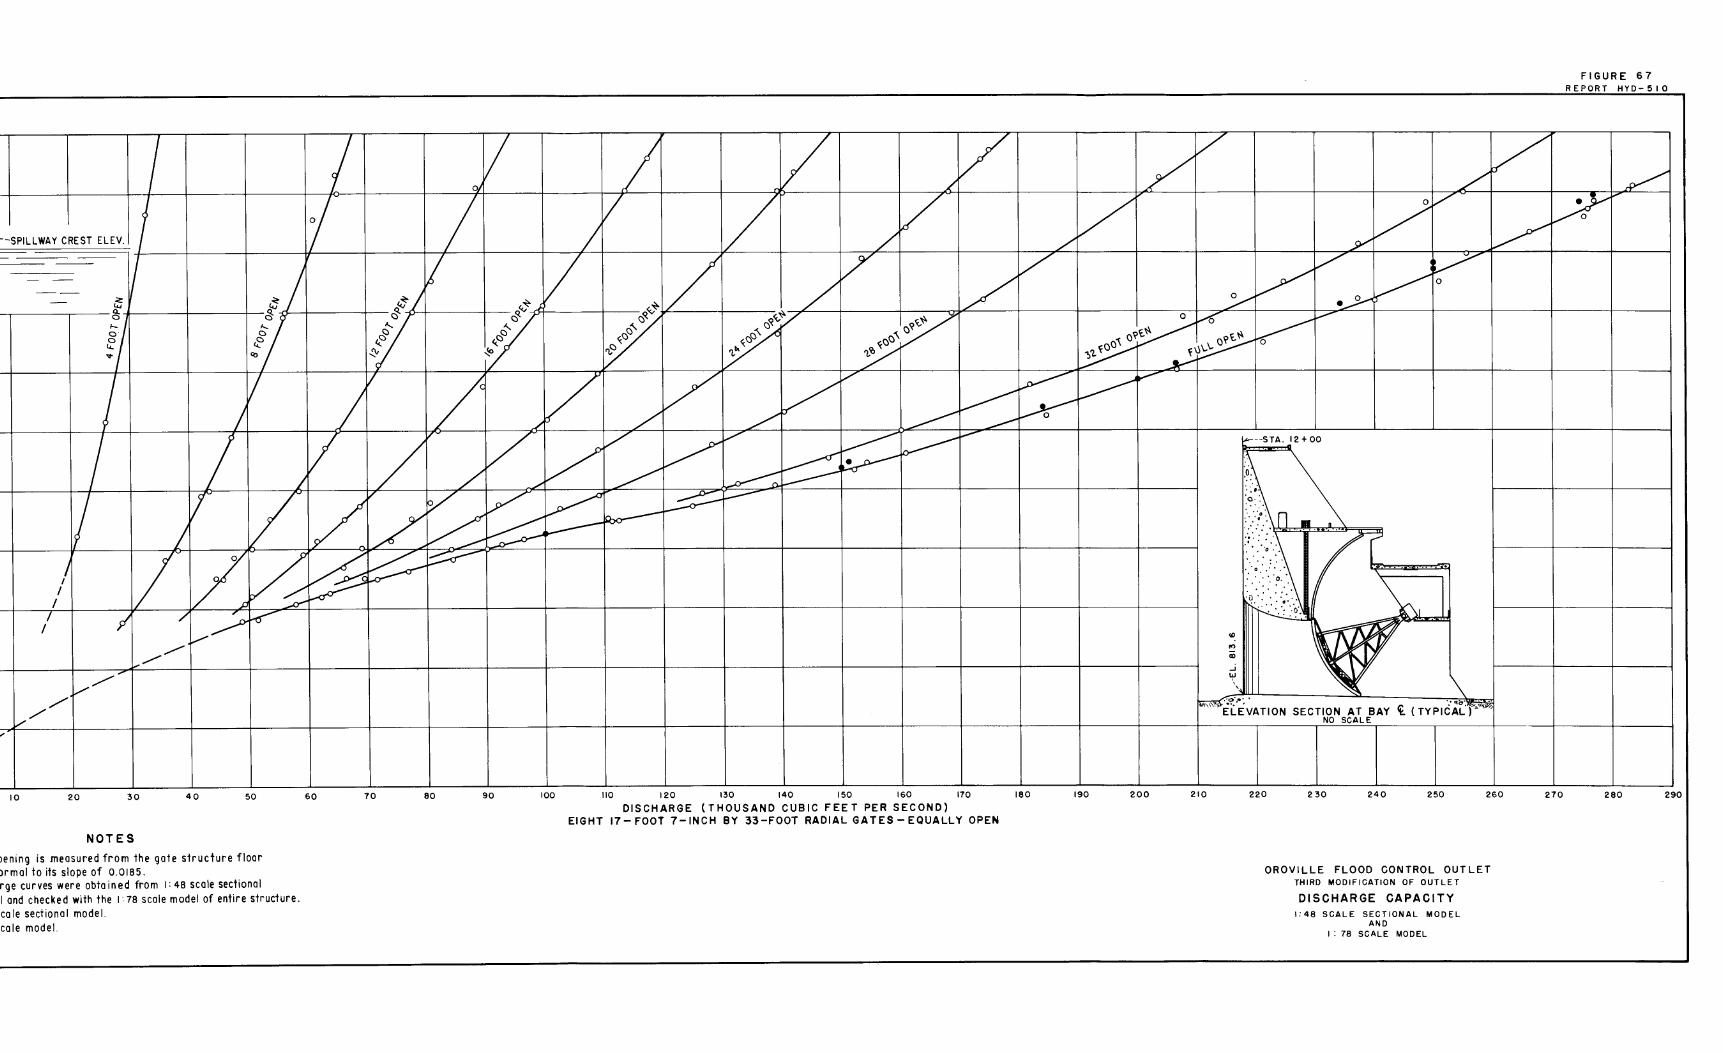
j I oj_ V I V V - ~ -lL
="'.'_LlWAY CREST ELEV. I ("
--
~
~1
f~
C)
«: ~
I l V
/rY- J/1 v-1
:¥------~--- -~r..-~-,,'L_~+---~~::-:------=~L.:::____+---t---1=--~1=/o,,,cc..~r===~r ~~
:\ ~~~
'l-""
I l I /1 Vy y I I V
l LI-_ _LU
I l VA _
,,
I I
I I
7 I
,........,v v/
10 20
;-v-I /' 1-___;,y
v /"' /.,,.
30 40 50
NOTES
Jening is measured from the gate structure floor ormol to its slope of 0.0185. rge curves were obto ined from I: 48 scale sectional I and checked with the 1: 78 scale model of entire structure. ,co le section a I mode I. ,cole model.
60 70 80 90 100 110 120 130 140 150 160 170 180
DISCHARGE (THOUSAND CUBIC FEET PER SECOND) EIGHT 17-FOOT 7-INCH BY 33-FOOT RADIAL GATES-EQUALLY OPEN
190 200
U)
"' CX)
_j
4' ',
1,,,---STA. 12+00
fo. ::·,. ·o-'.
-~·.·.-:-~o· :_
-~9r1~
· .. ~ ·. ·.' :o·. ·. ~ ... : ...... . ·o .... 0 0• •••
k."·_·. ·.o·)J 1i~I
~
~1
V j"'"'\~t"~~ATION
\ SECTION AT BAY ~ ( TYP12'..iCf~,,~7i,i
NO SCALE
210 220 230 240 250 260
OROVILLE FLOOD CONTROL OUTLET THIRD MODIFICATION OF OUTLET
DISCHARGE CAPACITY 1:48 SCALE SECTIONAL MODEL
AND I : 78 SCALE MODEL
270
FIGURE 67 REPORT HYD-510
~
280 290

0
<(
VERTICAL FACE OF THIRD r - - - - - - - - - - - - - - -
90
I MODIFICATION- --~ RES. WATER-,
801----+------+----+-----1
701----+------+----+-----1
601----+----+---+-----I
I SURFACE EL. ' - -- -- .. ,:· : -=-----=-==- -: : .
- - ·"-I .·._-· I ,-MODIF. )·· I\20NLY 0 :_·
1, I 1 ·:,:·
:i::: JI .-·D. I\ I
a Cd= A"2gH
WHERE: A = CROSS SECTIONAL AREA OF
PASSAGE AT GATE (FT.2 )
Q = DISCHARGE (CFS) H = HEAD IN FEET
Fl GURE 68 REPORT HY D - 5 I 0
FIRST MODIF. MODEL DATA
w 501-----1-------+----+-----1--+----+----+---+-----l#---+-41--l---l+--+--~-~-----1
:::c
698
FIRST MODIFICATION----DESIGN RATING
- --THIRD MODIF. APPROVED DESIGN MODEL DATA
-SECOND MODIF. MODEL DATA
201---+---+---+---l--+---+---+---+---l--+---+---+---+---l----l
0.60 0.70
COEFFICIENT OF DISCHARGE - (Cd)
OROVILLE FLOOD CONTROL OUTLET THIRD MODIFICATION OF OUTLET
0.80
COEFFICIENT OF DISCHARGE - FULL OPEN GATES 1:48 SCALE SECTIONAL MODEL

16
Por Gof6 S~tt ~lai!.F" A-3BIO-I
Service
Bulkhead Gate G1.1ide
Chute Woll
I I ~ I 1'--l---lk.''~ >~ -~ c:w;aa \ "'.. ·:> .-.~ B1.1lkhead Gofe Sill Plafe 4 · -
.... ·.·
.Groc.,f cur'TOin
------ Controcfion Joinf
( Monotifh 2 7) (MonolilJ 26)
A-385-1 ~c;ate,.,{"•t'
Zservice bridge ~
B1.1lkheod Gate
01.1ides
5.n:"..,/- cvrh/17
Contraction Joint
I ( Mono/ill> 25)
~ >.._---7 Pipe Bridge Railing
Sfee/ Pier No-3e
81.1/khead Gafe Sill Plate Sill Plofe
-5cote:,f"• I'
( Monolith 24)
Deck
.shown)
raofin9
ln-3p•cfion Walkway
Chute .Stab
FIGURE 69
REPORT HYD-510
-+--++HJ---Le-f't Approach Wall /9h t Approach .. Wall IU..lJ.
A- 385-2
SECTION D-D
A-3B5-! Scale: :JJ."· t'
.J." 10 0 10 20 50 40 52:• 1'
SCALE 0/F FEET
SAFETY - a~ a WATER STATE 0, CALIP'OIINlA
THE ft[IOUIICl:I All:NCY DEPARTME!ff 01' WATER IIUOURCD
DIVl9l0N OP' DIDION AND CONSnlUCTION
STATE WATER FACILITIES OROVILLE DIVISION
OROVILLE DAM SPILLWAY FLOOD CONTROL OUTLET
GENERAL ARRANGEMENT ELEVATION AND SECTIONS
. ..,..,........., . ..,. ~=R "'e/i'h,eu@I I 11:NOINDIIINCI. •it. L I I ~_IIK~IINDll:D:
~ D. Bowe:s -·~ OM- 8. T. Kofanl CN.CKIID
_E. Okomofo I J. Pardee E. Menueill. 16-
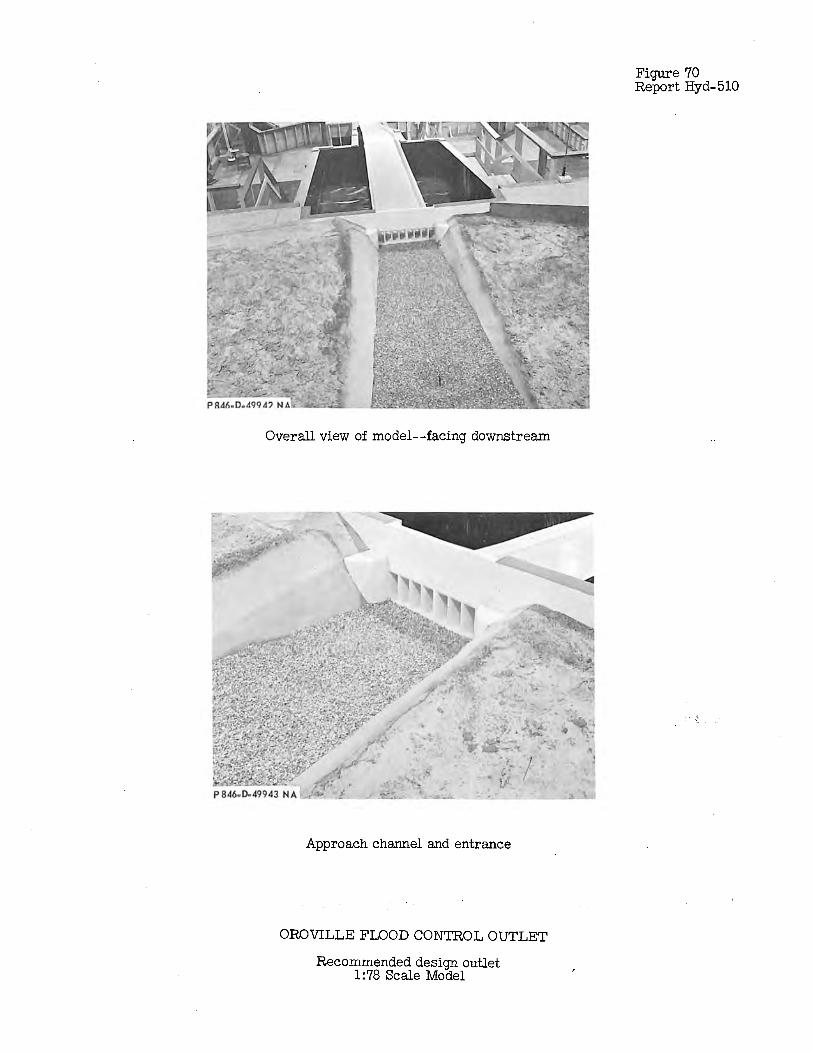
Overall view of model--facing downstream
Approach channel and entrance
OROVILLE FLOOD CONTROL OUTLET
Recommended design outlet 1:78 Scale Model
Figure 70 Report Hyd-510
.. - ':. . '\.;

Discharge 50,000 cfs.
Discharge 200,000 cfs.
Discharge 150, 000 cfs.
Discharge 277,000 cfs.
OROVILLE FLOOD CONTROL OUTLET
Flow at outlet structure 1:78 Scale Model
~~ g~ c+ CD
~~ 'r' 01 ..... 0

Regions of low-flow velocity indicated by shaded areas.
OROVILLE FLOOD CONTROL OUTLET
Bellmouth entrances . 1 :78 Scale Model
.Figure 72 Report Hyd-510

Figure 73 Report Hyd-510
Discharge 277, 000 cfs without _approach wall extension on left side.
Discharge 150, 000 cfs; reservoir elevation controlled to 901 feet without approach wall extension.
Discharge 277, 000 cfs with left wall extension.
Discharge 150,000 cfs; reservoir elevation controlled to 901 feet -with left wall extension.
OROVILLE FLOOD CONTROL OUTLET
Flow with and without approach wall extension on the left side
1:78 Scale Model
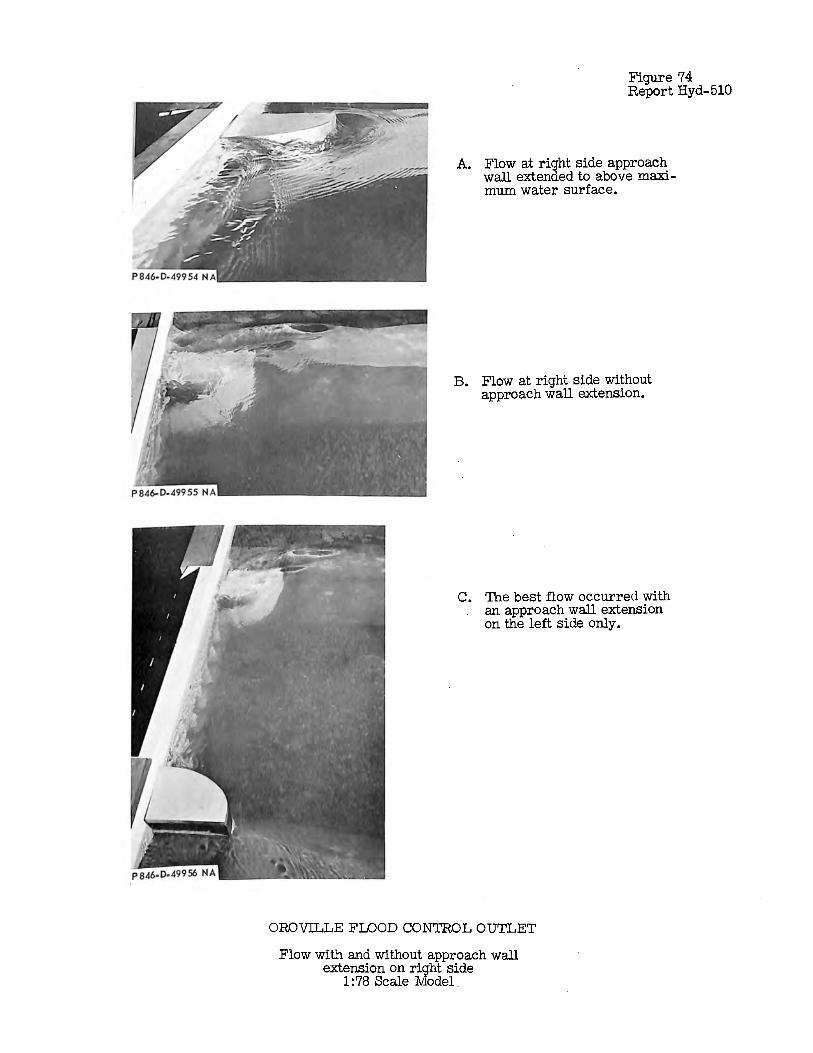
Figure 74 Report Hyd-510
A. Flow at right side approach wall extended to above maximum water surface.
B. Flow at right side without approach wall extension.
C. The best flow occurred with an approach wall extension on the left side only.
OROVILLE FLOOD CONTROL OUTLET
Flow with and without approach wall extension on right side
1:78 Scale Model.

<S>_,
"' !On Min. D 109 10;~ lon9 . \ P1-;~~:1c--;----A"o 7 x 1.9 Sta,nlttss sl~ttl fin•
Drill 111
0 ho!•
• I
' ~ jn Stainless ste•I bolt through l09
wifh washers onol nut.
I fAnch~J~:Sf J 1 :Kd ~,- ?L --- =====~·~==;.;::===
,~ 1.S rainless Sft!lel:____,__;;,> ~ I" D 6 x 37 Galv. deep
thimble sea towlnf! how.:,er.
~
-"' ::::
Approach C,,ann•I"":> 1 I
·" ~
Oefol/ I~ P!Osfic Floors Se• D•tai/
L •
LOG BOOM
PLAN Scole: I" • SO'
1" 5-foinlecs---,_ •tee/ U bar
t ~
- 5 w;,. rop• cl,'ps
~ r I A
_j
4'-0· I ANCHOR PLAN (TYP}
Scole: /" • 1 1
/" Sta/nl•.s:,
SECTION A-A
r-------... scole: in- t' =vr I °A--=3J 1-3 I
DETAIL B Scale: fn•/ 1
7•19 Stainlt,ss s'le•f tin~.
3, ~hi;;:,;;";'•33 steel .3 w,re rope c~ c:=:::;;;::::::
2",,,
<l
1" Stainle!J:, ~feel thimble
.5 Win• rope clips ':', __ _
DETAIL C
Scole: In:: /1
[";J,'-o"
~
--r;e rod washer.s, eye and nuts shall bit slain/~:!-' .steel.
'(,'
ala ' '
---- "' "'
See Note I
PLASTIC FLOAT DETAIL (TVP) (IO RE~'D.)
Scale: I 11 • I'
To onohor
''"'
8"
PLASTIC FLOAT .SYMBOL DETAIL 5colt!: 6""' I'
IISVIKWl:D---aTAl'I" aNGIINU:IIINCI, P,
~ 7lw.1l.lL
OU .. N_
P. Sulll~on -.,,._._ £. Tun.stall ·--£ Menu•z.
NOTE
FIGURE 75
REPORT HYD-510
Float shall bt!I o-f" f"oc,rn f"llleol plastic type having high Impact crool< resistant sur-f"ace.
2. Lo9 ~oom A_ha/1 btl paid ,or und•r confraef pay dern~.
I" • I' • • • SCALE OF_ INCHES
i". ,. 0 I • • • • • 1• •I'
r • ao·~ 1 111 1 7 •• 100 , .. I I I
SCALE OF FEET
SAFETY - a N-ry a WATER IITA'n OIi' CALll'OIINIA
THE REaOUIICD ACIDICY DD'AlnMENT OP' WATl!II RDOUIICD
DIYIIIION 01" DDIGN AND CON9TIIUCTION
STATE WATER FACILITIES OROVILLE DIVISION
OROVILLE DAM SPILLWAY
MISCELLANEOUS LOG BOOM

a, co CXI
--fl)
a: 11.'. ->-I-0 0 ...I Ill >
10.0
9.0
8.0
7.0
6.0
/j lb..__ ~
V
~
I 5.0
4.0
3.0
2.0
1.0
Ws --, .. I / ' 7 '\ !d~.6d ·~
....
CHANNEL SECTION Note, Each data point was
100 second overage
- -v,,........ I,"'"' kl'
-
) rY' • A
"" .
I I I
-cL...J1'""" ~ -._....,_
.. A A
I I
,t ..
Velocity@ 0.6d for 150,000 CFS ( For continuation
see next page),, ' ' - ....., - ~ \
;: -
~ . . - - -
~r.. . . ""'-Q
Average Vel. for 1,7Z>--6
~ \ / ,/' 0.2 and 0.8d I /
for 150,000CFS. ; I , ·-I
\ (CONT'D)-, 'Velocity @ 0.6d "}IJ:_J for 75,000 CFS. ~i..--
l'"
.... ~~ 0 ..Ji= <(::::,-we> u a::UJO c:(a::uJ
~>
~ -EDGE OF EDGE OF ,~~ ~HANNEL CHANNE;:.:
i60 140 120 100 80 60 40 20 0 20 40 60 80 100
DISTANCE IN FEET FROM CHANNEL CENTERLINE AT STAT'ION
OROVILLE FLOOD CONTROL OUTLET
VELOCITY TRAVERSES I :75 SCALE MODEL
120 140 160 180 200
7+00
;u ITI
" ,, .e··-::u G)
-I C: :0
!ITI C 1---i (Jla,
0

en <0 10.0 a,
9.0
8.0
7.0
en o.. 6.0 IL. ,-VELOCITY AT 0.6 DEPTH FOR )(
0
>- 5.0 ~
0 0 ...I 4.0 ILi >
3.0
2.0
1.0
0
As _,.
L~ -... ~
180 200 220
150,000 CFS DISCHARGE. 0:: - a..
r'----.. a.. <X ALL FLOW BEYOND THIS POI NT
"-I'-... ;= >- >- EXTENDING TO THE SHORE LINE 0 0 I- WAS IN AN UPSTREAM DIRECTION . ...I <X 0 -
'"' ILi (.) THE MAXIMUM VELOCITY WAS
~ LL ILi
LL 0 ILi 0::
0 ~ ABOUT I F.P.S. ...1<X men 0:: >
"-- <X - ILi
"' 1-:x: I- 0 cnl- z o:: - >-z 2 w w T
• :::::,_ o N I ---1<---->-j
I ' I I
\ I I I
' I \ I I ,, I ,: I
I
240 260 280 300 320 340 360 380 400
DISTANCE IN FEET FROM APPROACH CHANNEL CENTERLINE AT STATION 7+00
OROVILLE FLOOD CONTROL OUTLET
VELOCITY TRAVERSE 1:78 SCALE MODEL
::0 ITI "tJ 'Tl o::0 G') -I C ::i::: :::0 -< [Tl
0 I ......
UI ......
0

90
80 . ~ I r
a:: 0
70 0 _J LL
_J~ 60 WI-Zw Zw <(LL :I: 50 Ow
a.. W>->1--Oo 40 IDI--<(Q
a:: za..
30 o-
, ~ J I i
t l I j>
I:
H i I I I I I
h H I ! , I
I-<( > w 20 _J w
~ I I
t I I
10 ~
j /
ill -J [,.6
0o 2 4 6 8 10 VELOCITY (f.p.s.)
150,000 c.f.s. DISCHARGE - RES. W.S. ELEV. CONTROLLED TO 901 FT.
a:: 0 0 _J LL
_J~
60
50
WI-
~ ~ 40 <(LL :I: Ow
w~ 30 >1--0o ID I-<( ~ 20 za.. a~ I-
~ w _J w
10
ll. ci.
~ ' ~ l T ,
~1 f I I
j ........ -:P ----_..o- -
4 6 8 VELOCITY (f.p.s.)
150,000 c.f.s. FREE DISCHARGE RES. W. S. ELEV. 863
2 10
KEY ----- 78 Feet left of center --- Center of approach channel --- 78 Feet right of center
90
80
, 70
60
50
40
30
20
10 J
'i I I l I I
y I
I
I + I
y f i : I r i I
i
l i ! I I
t I I r 1 I It V :1 I ~
FI GU RE 78 RE PORT HYD - 510
_J~~ 0 o 2 4 6 8 10
60
50
40
30
20
10
VELOCITY (f.p.s.) 277,000 c. f. s. FREE DISCHARGE
RES. W.S. ELEV. 907
\~ il r,
........ -# _,, _ --:::------0 o 2 4 6 8 10 VELOCITY (f.p.s.)
75,000 c. f.s. FREE DISCHARGE RES. W. S. ELEV. 846
NOTE Profiles taken at Sta. 7 + 00 Each point 100 sec. average.
OROVILLE FLOOD CONTROL OUTLET
698
VERTICAL VELOCITY PROFILES IN APPROACH CHANNEL I :78 SCALE MODEL

Figure 79 Report Hyd-510
Pressure (Prototype Feet of Water)
1:68 Scale SectiQnal Model . 1:78 Scale Model . Piezometer No, . Pressure . Piezometer No, . Pressure • . . Discharge zn,000 cfs . . . .
35 . -15 . 1 . . -19 . . . 34 - 9 . 2 -19 . 26 . -19 . 3 . -26 . . . 25 . -18 . 4 . -26 . . .
Discharge 250j000 cfs . . . . 35 . - 8 1 -10 . 34 • - 4 • 2 . - 8 . . . 26 . .,;.17 . 3 . -24 . . . 25 . -14 . 4 . -23 . . .
Discharge 200,000 cfs . . . . 35 .
- 3 . 1 . - 2 . . •
34 • - 2 . 2 . - 2 . . • 26 - 6 . 3 . - 8 . . 25 - 8 . 4 . - 9 . .
Discharge 150,000 cfs . . . . 35 - 2 . 1 - 1 . 34 - 1 • 2 • - 1 . . 26 . - 2 . 3 . - 1 . . . 25 . - 2 . 4 - 5 . • . . . . . .
Note: Piezometers 1,2,3, and 4 in 1:78 model correspond to piezometers 35,34,26, and 25, respectively, in the 1:48 scale sectional model.
OROVILLE FI.OOD CONTROL OUTLET
Comparison of Bellmouth Pressures
1:78 Scale Model
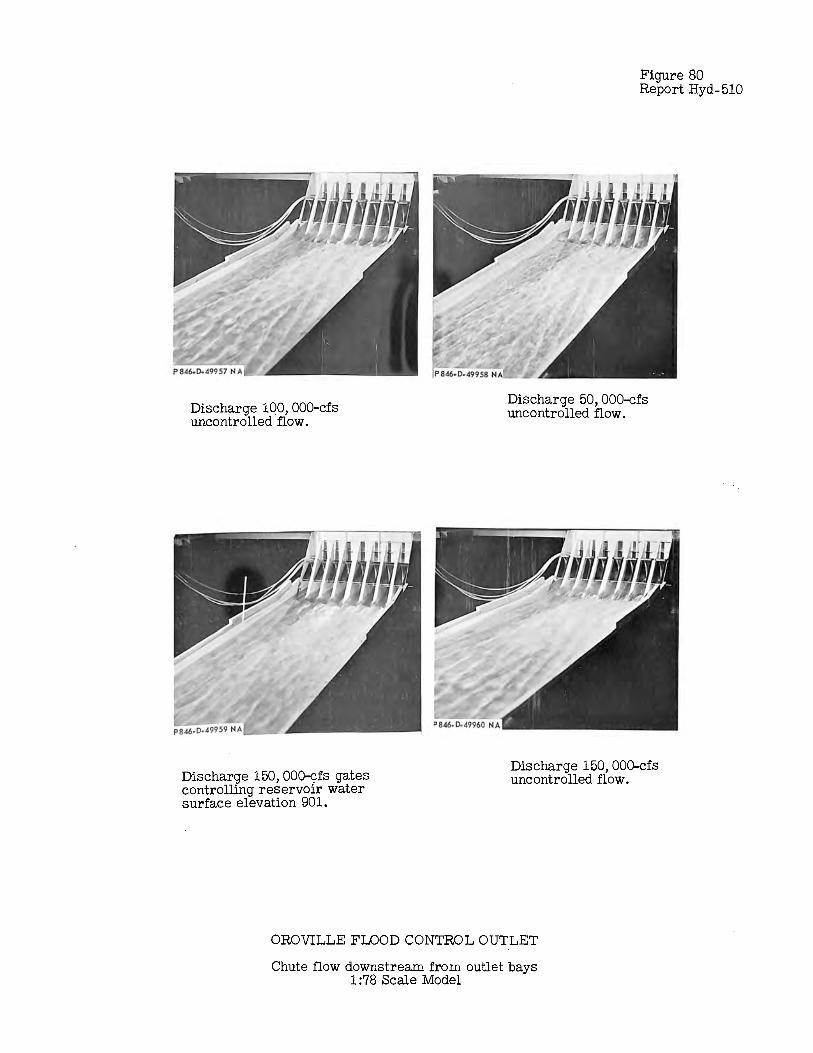
Discharge 100, 000-cfs uncontrolled flow.
Dischar~e 150, OO~fs gates controlling reservoir water surface elevation 901.
Figure 80 Report Hyd-510
Discharge 50, 000-cfs uncontrolled flow.
Discharge 150, 000-cfs uncontrolled flow.
OROVILLE FLOOD CONTROL OUTLET
Chute flow downstream from outlet bays 1
1 :78 Scale Model

Figure 81 Report Hyd-510
A Flow overtopped sidewalls at • 277, 000-cfs discharge. Final
outlet installed in initial chute. STA. 33f00 STA. 32+00 STA. 3ll-00
B. Chute rebuilt to specification drawing. Flow still overtopped sidewalls at 277, 000-cfs discharge between Stations 31+00 and 33+00. ··
STA. 34+00 STA. 33+00 STA. 32+00 STA. 3H·00
C. Flow also overtopped sidewalls at 292, 000-cfs discharge between Stations 31+00 and 34+00 with the chute rebuilt to specifications.
OROVILLE FLOOD CONTROL OUTLET
Flow in chute 1 :78 Scale Model

15+00
STATION IN FEET
FIGURE 82 REPORT HY_Q-510
20+00 25+00 30+00 35+00 40+00 45+00 ----------------------r------------------------r- 900
.-----TOP OF SIDEWALL
--- -- 800
CHUTE INVER
, roo
----------------------l------------------------+-----------------------t-----------------------t-------"'-,;;:--'""'<---"'~--- 600
EXPLANATION
Profile for 150,000 cfs. discharge Profile far 292,000 cfs. discharge
NOTES
Chute and sidewalls shown according ta Drawing No. A-3B9- 2 Sheet 48 of California Department of Water Resources Specification Number 65-09.
The maximum difference in vertical hight between sidewall profiles was two feet, the greater height being shown.
' 500
--------------------+--------------------t---------------------+--------------------+--------------------t--------------------....:,,..d-'"-,;:~..,.-------------------l400
---------------------,5-+Lo_o ____________________ ....,.2""0..J+Lo""o,----------------------::2""5.J+""o"o:---------------------30...J.+_0_0 _____________________ 3_5_+.L...o-0 _____________________ 4_0_+._o_o ________________ .::,.. ____ 4_5.J+~~o
STATION IN FEET
OROVILLE FLOOD CONTROL OUTLET
WATER SURFACE PROFILES AT CHUTE SIDEWALLS I : 78 SCALE MODEL

Overall view of chute.
Flip bucket at end of chute.
OROVILLE FLOOD CONTROL OUTLET
Initial chute and flip bucket 1 :78 Scale Model
Figure 83 Report Hyd-510

Figu.re· 84 Report Hyd-510
Discharge 50,000 cfs.
Discharge 150,000 cfs.
Discharge 277,000 cfs.
OROVILLE FLOOD CONTROL OUTLET
Flow in river from initial flip bucket 1:78 Scale Model

A. No left bank excavation. Discharge 277,000 cfs.
B. No left bank excavation. Discharge 150, 000 cfs.
C. Left bank excavated 100 feet. Discharge 277,000 cfs.
D. Left bank excavated 100 feet. Discharge 150, 000 cfs.
OROVILLE FLOOD CONTROL OUTLET
Flow with straight chute and left bank excavation 1:78 Scale Model
Figure 85 Report Hyd-510
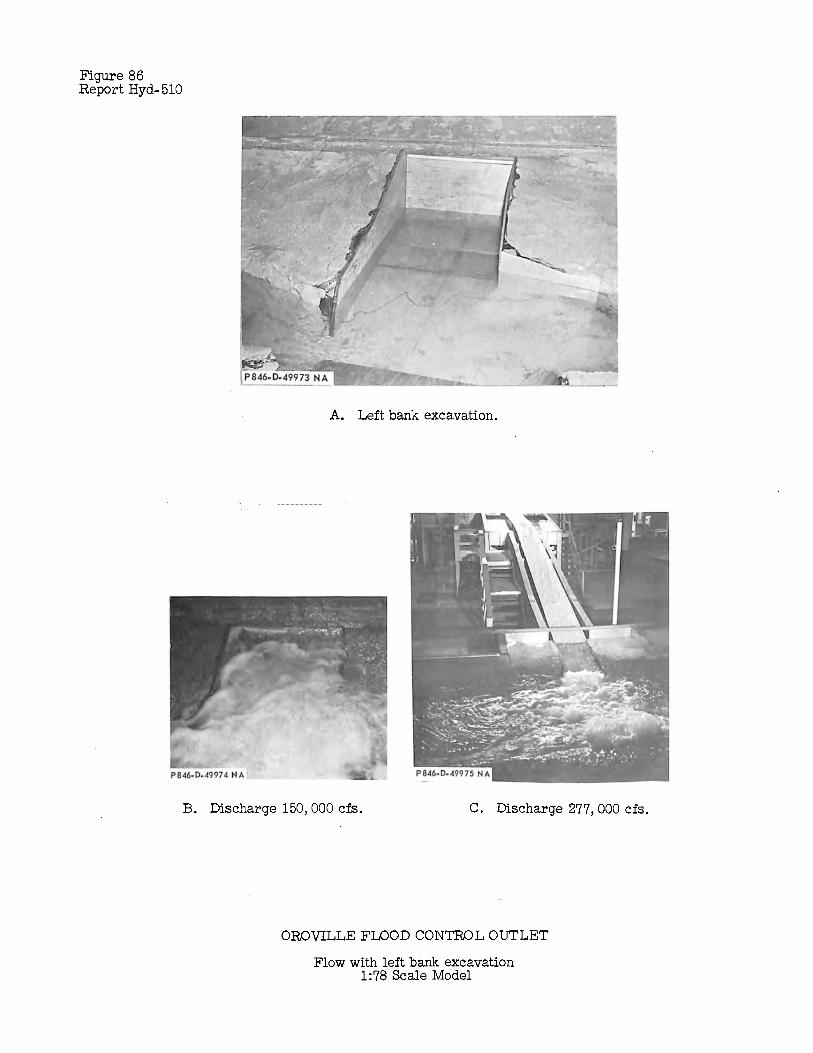
Figure 86 Report Hyd-510
A. Left bank excavation.
B. Discharge 150, 000 cfs. C. Discharge 277, 000 cfs.
OROVILLE FLOOD CONTROL OUTLET
Flow with left bank excavation 1:78 Scale Model
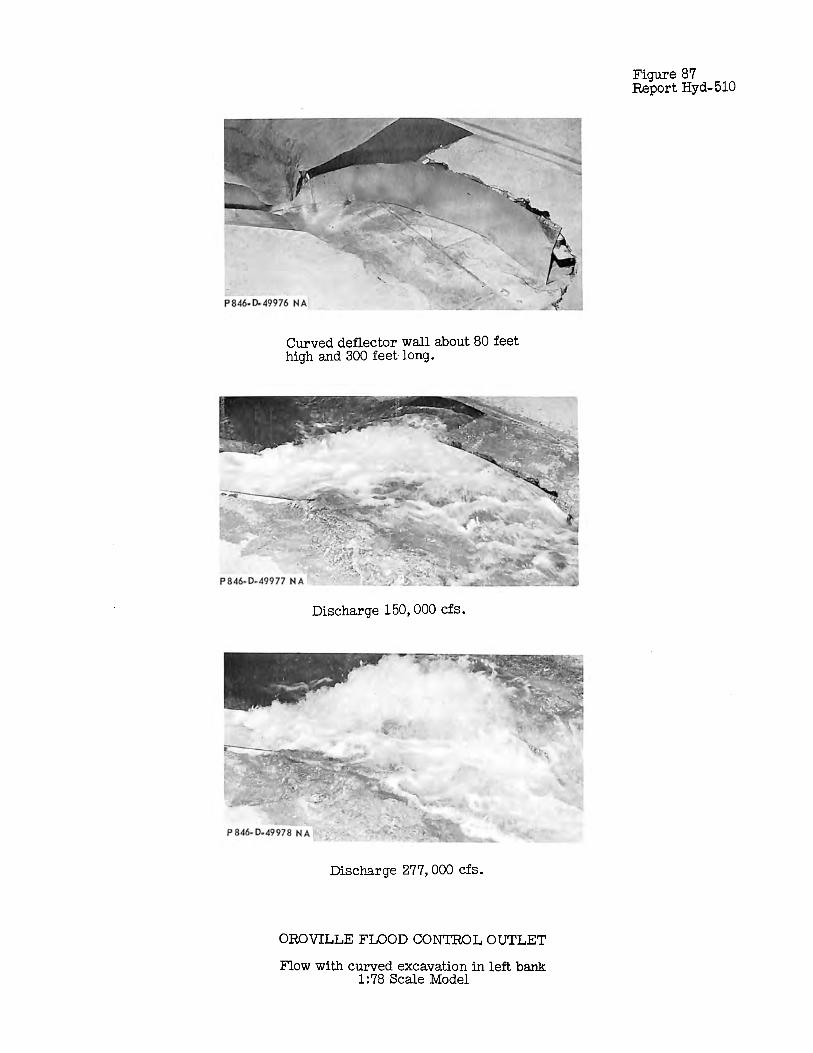
Curved deflector wall about 80 feet high and 300 feet long.
Discharge 150, 000 cfs.
Discharge 277,000 cfs.
OROVILLE FLOOD CONTROL OUTLET
Flow with curved excavation in left bank 1:78 Scale Model
Figure 87 Report Hyd-510

Figure 88 Report Hyd-510
A. The basin with trajectory apron and 10-foot sill.
B. Discharge 150, 000 cfs.
C. Same as B except basin floor raised to elevation 175.
OROVILLE FLOOD CONTROL OUTLET
Flow in basin with trajectory apron at end of chute 1 :78 Scale Model

A. Discharge 277, 000 cfs, 40° flip bucket installed at Station 42+40.
B. Discharge 150, 000 cfs, 40° flip bucket installed at Station 42+40.
C. Excavated basin with two rows of 23- by 44-foot chute blocks added. Discharge 150,000 cfs.
OROVILLE FLOOD CONTROL OUTLET
Flip bucket and chute blocks for flow dispersion 1:78 Scale Model
Figure 89 ·. Report Hyd-510

Figure 90 Report Hyd-510
A. 'Ihe "Plow. 11 B. 'Ihe slotted "Plow. "
C. Triangular blocks at ends of first row blocks.
D. 'Ihe "Pyramid" blocks.
OROVILLE FLOOD CONTROL OUTLET
Arrangements tested for flow dispersion 1 :78 Scale Model
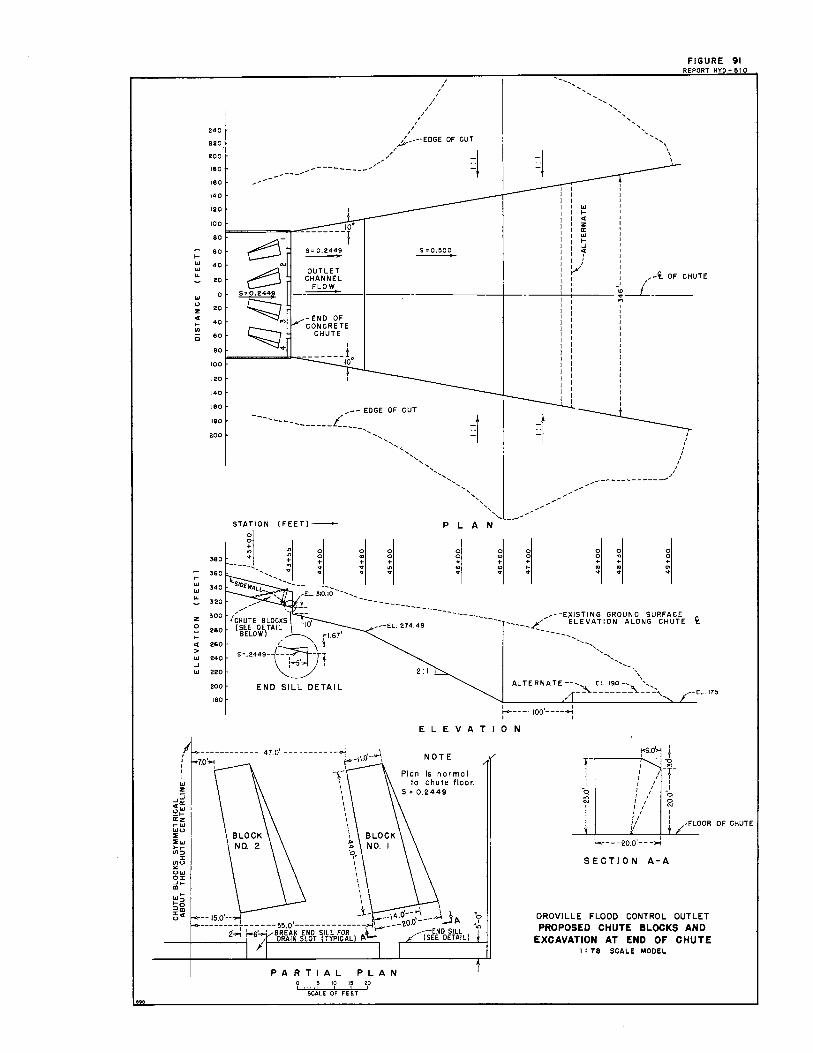
240
220
200
180
160
140
120
100
80
60 .. l&I l&I
40 .. 20
l&I 0 u
20 z C
40 .. ., i:i 60
80
100
120
140
160
180
200
380
.. 360
l&I 340 ., .. 320
z 300
0 280 ..
C 260 > l&I 240 .J ., 220
200
180
I I
I
I I
I
/ I
I I
I
FIGURE 91 REPORT HYO - 910
.... ------------------ ___ _,,,/,?--·•= ~ "~1
OUTLET CHANNEL
--~
-END OF CONCRETE
CHUTE
S =0.500 -l&I .. C z a: l&I .. .J 1-1
v' --'t OF CHUTE
---------+-- ___ _.--. ____ -c:_i_ ____ _ ..,
___ EDGE OF CUT ~ _______________ /: ---- :t :t ------..,,'
STATION ( FEET! -
_Jj___ l .... ..........
0 0 + ... ..
..................
0 0 .. 0 + + .. ., ... ..
-::;L~;~~Q-... ._ ... , .,,..,-... j_ ...... __
/~~UTE BLOCKS •10, (SEE OETAIL
BELOW) -{-~--\_tl.67'
S•.2449- ~~~::Jf END SILL DETAIL
-.... ,,,____ / ' I ............ , ........ -
',,,_ ----------', ... _____ .,
p L A N
0 0 0 0 0 0 0 .. 0 0 "' 0 + + + + + + .. .. .. m m ., ... ... .. .. .. ...
--------------------- ---E)(ISTING GROUND SURFACE -----L/ ELEVATION ALONG CHUTE i -----.........
---------, ---- •,
\ ALTERNATE--f:;',.. EL.190-~, ',,..,_
,, ..........
~---· 100·----~ I I
ELEVATION
--EL. 175
IJ1.o .. ---------' • I I I
l&I z
_,:::; <(: I
!:? .. a:z ..... l&IU :E
47.0' -----------...: I
-r I I I I I I I
NOTE
Is normal ta chute floor.
S • 0.2449
r!:?~.L l-r-----;., I~ I / /-l-: I I I
- I I I
~ : / -~ I I I L'I.I
:El&I ,.. .. a,:,
:,: ~u .,., o:i:: .J>-111 .. ' kl:, >-o =>111 ~c
I I I I ... ... ~-
\ I I I I I I I
I 1- 4 o'--,,J, 'J --15.0--~ - --1 · o•---...4 A :? ------;:n:;~~.:"a5,;,JKENO-SILLFOR-,-~er---?.0·---,-S-EEENDDESTILALIL) ':'
---+-----;' I' DRAIN SLOT (TYPICAL ,..
PARTIAL PLAN 15 10 18 20
SCALE OF FEET
I I/ I I I I I 1 '/ I ,FLOOR OF CHUTE
~---20.0'---,..j
SECTION A-A
OROVILLE FLOOD CONTROL OUTLET PROPOSED CHUTE BLOCKS AND
EXCAVATION AT END OF CHUTE I : 78 SCALE MODEL
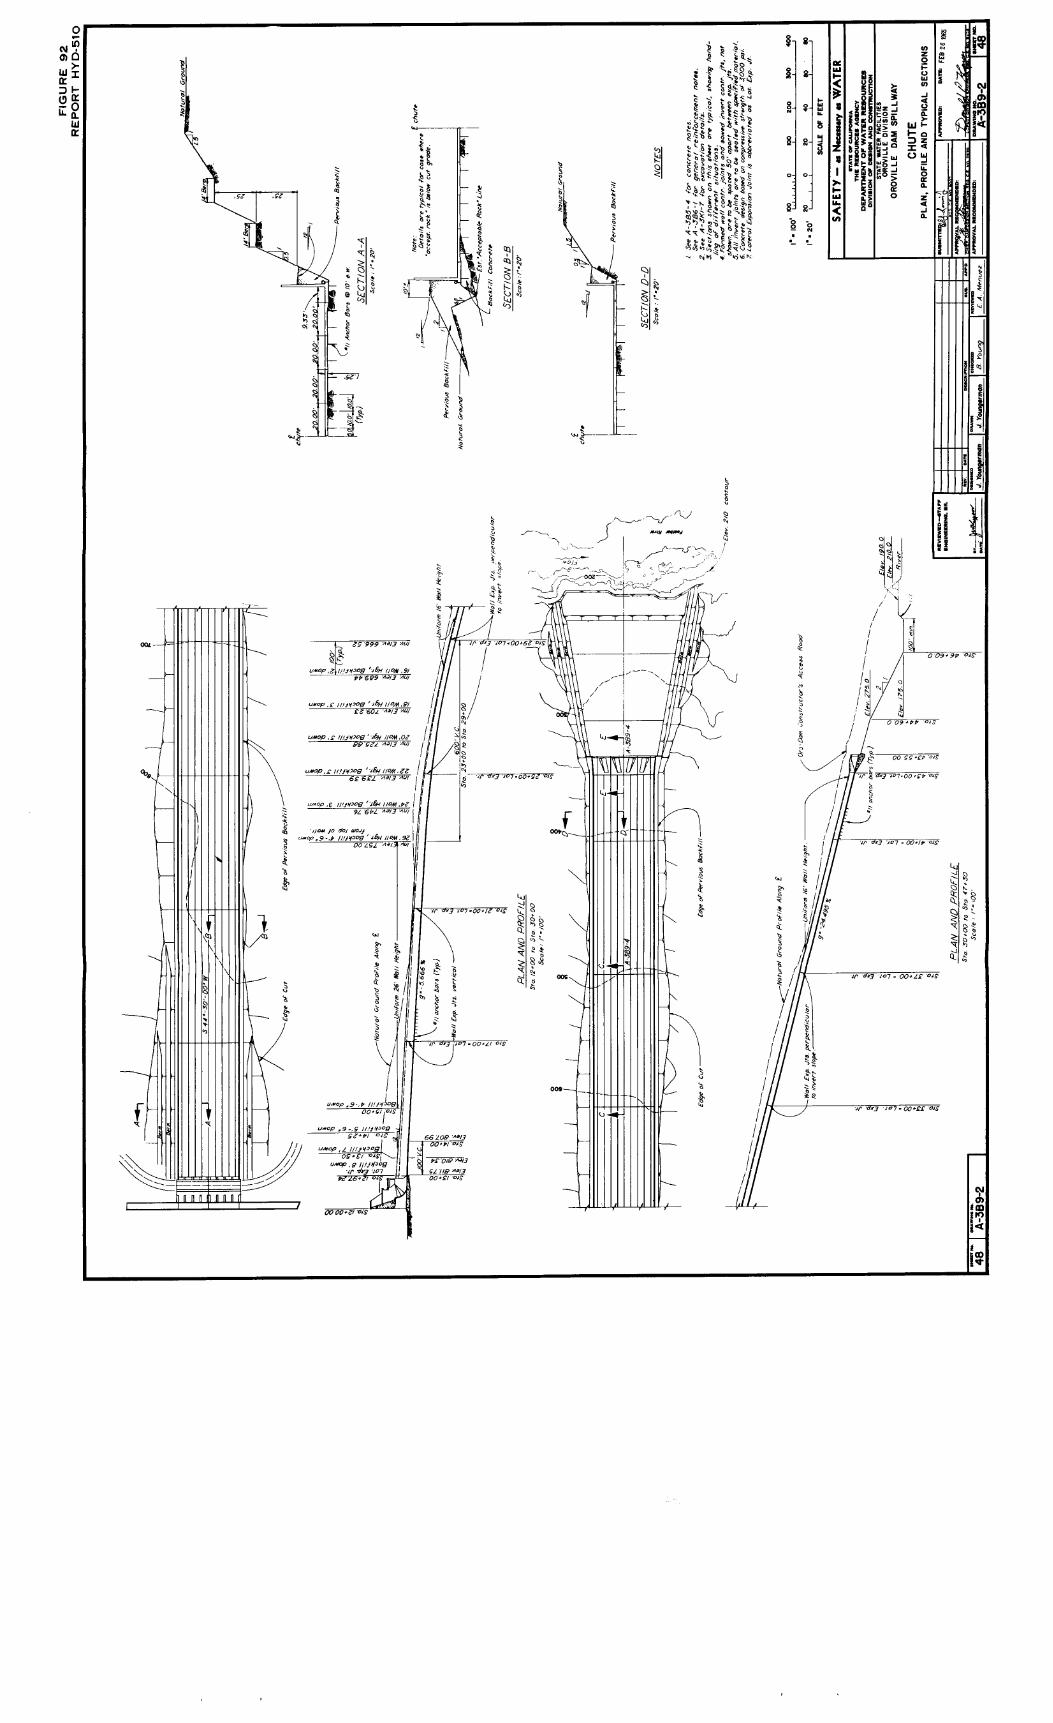
I
I
,/,',11, , C /1V9009 '14, /1044,91 I 0 re-604 .A.I3 40/ I
I O N
,./.0f) .£ //!!4009''16// 1/41403 I 2, 0 6
99'222 4013 Au/ I 0 0 9
‘,../' , £ i I, ,i'l "9 '7611 11041,22 I ot 1.1
62 6£1 4013 Au/ I
0̂ `°P .6 /11,1009 '149 110,11.P2 I 92602 4013 4011
041oP .9 -.1, 11.1.11100 3 '44i /1 411 , 921 • 110.41 JO do, tow.,
00Ls2 ,,,/,./
22'999 4013 6i/ n, lr 3 107.00.62
04.0P ,2 //.,J9 09 '161.1 // 041,91 96 699 4,13 AO
Cv
6,
J t90 "Vmai
n n 11 00'00.2/'O1$
Jr aY3 107-000/Z 013
1.1410/0 111411.09 001gIrS
,41,0P /11.#110019 $e,fr/ 01$ I
1.1̂ 10/0 //1.1.40.13 0g4C1 '0491
ohmic ,9 wpfoog .1p olp3 407
6026.21 049 00•£/'019
vi
10 0,3 +07 -00.41 01.9
66109 4.13 00•91.1.5'
922/9 4-1/3
22119 1140
O
4r whg 107 - 00322 015'
Wu
k
3 07 - 00,1"T 0.19
PLA
N A
ND
PR
OF
/LE
Ch m
r re) ga
rvo
SE
CT
ION
8-5
SEC
T/O
N 0
-, 0
IJJ
8
g- 'Alt
I—LL-
6 a-
SA
FETY
— a
s
0— 0 —
r a
029.96 01$
0 09 ,99 OJS
▪ 00 23.£6 019
r 6'1 v07.00 •cf,
'107 - 00./0'049
I
CC-4
es.
c(0
eL

~e,i/A
,Thie dimW1a1on to bl! le.. them o, ~I lo ~'
Sym. about t Chut.
SECTION C-C TYPICAL ANo-lOR BAR ARRANGEMENT
A-389-2 Sc:alt!>• 1• =- 10'
---Lon9itud1"nal Expon~10n J01i?fs
20~0"
Confracf1on .Joir1te
40•-o•
u A-389-6
VIEW F -I=
40'-0"
PLAN 01= rEl<MINAL STRUCTURli Se.a/e:i"=I'
0 ~ym. al:>Ouf C Chut. i)
A _,........_ /
/ / //
/ /
/ //
/ /
///
1>~. ~' ,·:
-<
5(,- I -A-3B9-4
' ' ' ' ' '
7
() -' ~
/ /
/ / /
/ / / /
///
-< ' ' ' '
Lon'I/Juol,na/ Con/-racftQn
' ' '
ELEVATION G-G DOWNSTl<EAM ELEVATION
$col•: °3"• I'
9'-4"
14'-4'
I I I I I I I
' '
S.al•r ne Shtt#f -
Tc. or wall baSt! slab 1 1/
7 <<~," Exp Jf. Mat'/.
@Polyethyle ~
t I,, (
~--r ~- _J
\nl 1 ,I,~ '-: ~
TYPICAL DETAIL SLAB EOG£ EJf~NSION JOINT
Scale, I"=/'
~~ ~ N §n!M\lhfi\
TYPICAL DETAIL ~ EXR4NS!ON JOINT
Scale•!"•!'
"-
~ f
4"p~rf" vc P lateral .vdh 5elecf gra~I bac.1<fil/----
#5 Z'- 4"~ I~ Wrap this / --!:::_6"
end only 1o p,el"l!>nt bond J f"Exp.Jt.M"'l'l
DETAIL A LATERAL EXPANSION JOtNr
Seal•: I"• I'
TYPICAL DETAIL LONGITUDINAL INVERT CONTRACTION JOINT
Sca/9-,/'• I'
Bond !3realt:.
DETAIL M
A-389-'- A-.3B9-'°" A-389-~
NI LI 1--------- Top ol Woll /.l"nzonfal---------<
K7 __!_oe._____r::»'" _!!_o~; ~h':!_ "1-"Q11
EJ{pan.s,on Joi'nt
5=,i., 12"• I' G--, ~7
ti\"' ._' -----=--i--=r---.. ~ "
r _I
FIGURE 93
REPORT HYD-510
Slab Re/nl'or~,,,.nf •~ Ii> 12 ~w.
Jf11 bar qrou- /r,lo ( N X) holt!
DETAIL B A.NCHOR 4'41'
Seol•·l"-1'
-; I I
.Slab Ex~ Jf. $/?Qwn
4" ~~ V.C: P laft!'ral
A-3B9-.S
End Wadi
~" p,l'V V.C.P OutFa,I/, ~ Sect.lie'--'?, A-389-! Fo,.. olrfa/1..5.
17'1!5
SECTION E-E TERMINAL STRUCTU>?£
A-SB9-2 !Sc01/•:J"- /'
, () ,I
~
/n!l'f!trJ 9,odtt line r~f,nded·
I I I I I I I I I I I I I I I I I
5'-0''
G__J
TYPICAL DETAIL WALL EXPANSION .JOINT
So::tJ.• l"•I'
NOTES I. n1ndkatn contract pay ife~. 2./f(ymenf shall be madHnder the ~llow/nq coni;poy
.structural concre-~ 'f!j, ce,,,,enf 27 pczzolan 28 re,i?forcement ~~ dr1J/!n9 h .s and plo, onchor bars @
3. All r!>i"n(orcement to be 3• clear vnle-ss otherwittnoted
4. Concrete de.sign strength in compre.s.slon is ,JOCO psi.
10 0 ,o 70 "° "' 1·· 10'
t• I' ,o 0 10 70
a"• I' • 0 • ,o
0 • • 1•• I' SCALE OF FEET
12"• I' &CAL.9 01= INCH&•
SAFETY - a N-aiy a WATER STATII: OJI' CAUl'OIINIA
THE RESOURCD AGIENCY DEPARThlENT OF WATER RUOURCD
DrYISION OF DDICIN AND CONSTltUCTION
STATE WATER FACILITIES OROVILLE DIVISION
OROVILLE DAM SPILLWAY
TERMINAL STRUCTURE CONCRETE ANO DETAILS
"° IS
•
4
===-= t--+--+--------------+--lf----1..,...ITTSD:~Jcl- ........... DA,., FEB 26 \965
.... , .... ,.. ~ _... IDMwti
.J. rc,vnqermon B. Ii?. Bo~z B. Vounq £. A. M_t!'_nu~~ APPROVAL UCOMMKNDaD

The chute blocks and basin.
Discharge 50,000 cfs.
Discharge 100,000 cfs .
The model operating at 150, 000-cfs discharge tailwater surface elevation 228 feet.
OROVILLE FLOOD CONTROL OUTLET
The recommended chute blocks and plunge basin 1 :78 Scale Model
Figure 94 Report Hyd-510

Figure 95 Report Hyd-510
Discharge 150,000 cfs; tailwater surface elevation 228 feet.
Discharge 200,000 cfs; tailwater surface elevation 237 feet.
Discharge 277, 000 cfs; tailwater surface elevation 270 feet.
Discharge 292) 000 cfs; tailwater surface elevation 380 reet.
OROVILLE FLOOD CONTROL OUTLET
Operation of recommended chute blocks and plunge basin 1:78 Scale Model

•••
i 19
PLAN "'"" B
FIGURE 96 REPORT HYO- 510
Sta. 43t55
CHUTE BLOCK PIEZOMETER LOCATIONS
27 ~........_ I -rT- ; -;-..,,, _L i30 , 1 ·, -r
-•- I I -..,. I ' i ~
''·l,3 / I "1 I I a --7 I / ' I I -6
Sta. 43 + 55-,,, I / '=+----<~wS-227000 CFS -----r-___ ' I
131 WS-150,000 CFS--- -_'/.---- - , --------~--
i---037 134 r :38 -1--, --d" 1-0 - 135 i '<.ct, I -r--7 -..,.
I I ---r- I
I I I - I I o
-----r-1-~ ~ ,-.. I
I ~ I ·.., I / I 7 --, a,
: 0.39 from _ ,..C'i1 ' -~ f i top edge--.i 3 11 4 ~ 29 • __ i 1 j ~ :
"',-.. .i - a,
I lri b~9 136! ~: -l~-1-'--=tt---_-o~ _li I
23,24,25,2• r="----~",,2'-'=---"''¥-'-T - -;;; d
SECTION A-A
~1
-~I , i -~ , . , ·r· -_,.j 370 f.,--- - 14.43 -----j 4.10 ~--
SECTION 8-8 SIDEWALL PLEZOMETER LOCATIONS
LEFT WALL
fJ IJ!~ \1 LOCATION PLAN
NOTE Piezometers were in block 2. Pressures for block I were obtained by placing
a wall between blocks I and 2 and extending it sufficiently upstream to obtain proper flow conditions ot the block. Pressure data for blocks 3 and 4 assumed similar to data for blocks I and 2. Drawing Scale Ji''• 1'-0"
OROVILLE FLOOD CONTROL OUTLET LOCATIONS OF CHUTE BLOCK AND SIDEWALL PIEZOMETERS
PLAN AND SECTIONS I : 78 SCALE MODEL
I I
y

Figure 97 Report Hyd-510
Piezometer: NQ. . .
1 . . 2 3 . . 4 . . 5 6 7 8 . . 9 . .
10 . . 11 12 13 . . 14 15 . . 16 . . 17 18 . . 19 . . 20 . . 21 . . 22 . . 23 . . 24 . . 25 . . 26 . . Zl . . 28 29 . . 30 . .
Pressure (Prototype Feet of Water)
Discharge (;thousand cfs} 18.2 . 20 . 72 . lOQ . 120 . : . . . • . • 21 . 67 . 74 . 81 . 104 . • . . 16 . 52 57 . 63 88 . . 19 . 59 66 . 71 . 96 . . . 16 52 . 57 . 63 84 . . 12 . 36 . 43 45 58 . .
5 . 10 12 . 12 . 16 . . . 5 . 16 . 16 18 . 21 . . . 0 . 8 . 9 . 10 . 18 . . . . 0 0 . 0 . 0 0 . . 3 . 50 . 60 • 69 . 101 . . . . 3 . -2 . -2 . 0 21 . . . 0 0 . 0 . 0 • 3 . . . 3 . 5 . 5 . 6 . 15 . . . . 0 . 0 . 0 . 0 : 0 . . .
31 . 94 . 100 . 110 • 140 . . . . 4 . 45 . 56 66 . 99 . . . 3 6 . 6 . 6 . 11 . . • 0 . 4 4 3 . 0 . . 0 . 0 0 . 0 0 . .
-24 . 0 0 . 0 . 0 . . . -22 . 0 . 0 . 0 . 0 . . . . -4 . 0 . 0 0 . 0 . . . -9 . 11 10 . 11 . 14 . . . -7 . 0 . 0 0 . 3 . . . -3 . 0 . 0 . 0 . 0 . . . . -2 0 . 0 . 0 • 0 . . . 0 . 0 0 . 0 . 0 . • . 0 . 0 . 0 . 0 • 0 . . . • 0 . 0 . 0 . 0 0 . . . 3 . 4 • 2 . 2 • 9 . . . .
200 . Z/7 . . . . . . 120 . 144 . . . 100 . 118 . . . 110 122 . . 100 . 116 . . . 71 93 . . 20 . 29 . . . 26 . 34 . . . 23 . 34 . . 3 . 13 . . 120 . 152 . .
40 . 81 . . -2 . 3 . . . 26 55 . . 0 4 . . 156 • 180 . . . 120 . 156 . . 18 . 43 . . 0 -4 .
0 . 0 . . 0 . 0 . . . 0 . 0 . . . 0 0 . . 20 . 28 . . . 4 . 5 . . . 0 . 0 . . . 0 . 0 . . . 0 . 0 . . . 0 . 0 . . . 0 . 0 . . . 11 . 11 . . Notes: Tests were run on Block No. l; data assumed applicable to Block No. 4. Pressures for 18,500 cfs are the same for Blocks No. 1 and 2 and assumed applicable to Blocks No. 3 and 4. For piezometer locations, see Figure 96.
Minus sign indicates pressures below atmospheric--others are above atmospheric.
OROVILLE FLOOD CONTROL OUTLEr Chute Block Pressures--Blocks No. 1 and 4
1:78 Scale Model


Figure 99 Report Hyd-510
Pressure
All
(Prototype Feet of Water)
: Piezometer : Piezometer : Piezometer Piezometer piezometers No. 23 No. 20 :No. 20 and 23 No, connected :disconnected :disconnected :disconnected
20 -23 -22 21 -20 -18 . -6 . 0 . . 22 -4 -2 0 0 23 -9 0 24 -9 -6 . +3 0 . 25 -3 0 0 . 0 . 26 0 0 0 0 . .
Note: For piezometer locations, see Figure 96. A disconnected piezometer allowed air to enter at that point. Minus sign indicates pressures below atmospheric.
OROVILLE FLOOD CONTROL OUTLET
Effect of Aeration on Pressures at Corner uf Chute Block
1:78 Scale Model

0 (\J
I I I I I
I _J ____ _
-.------o -r-
, I
rt) I
(,\J =rt)
: I : ·10 I I I I I
--f-----I -;~--
FIGURE 100 REPORT HYD-510
• I - • I 21 ° 59~ ~I~ =I~ ----i-
, v m ---, , ---~*-J* I ---~=---~---- I ~\-~--X ---,- t..1m _+ • ,-~ -- --100 26- ., - ------- -- - I 1 =I~
1 I ~ m i I \='_-_--_-_~-:.__j_ I I II I I II t<-------2-0 ---->;<-------2-0 -----~
1 CHUTE FLOW
DETAIL A scALE 3/4 " c 1'- o"
PLAN
-<i A
7
I 1 DIRECTION
J_J __ !--------------iL....:::!lo. I : k---------------44' - o"----------------->l I j
-< A ELEVATION SECTION A-A
SCALE 111 = 12 1-0 11
OROVILLE FLOOD CONTROL OUTLET
MODIFIED CHUTE BLOCKS - RECOMMENDED I :78 SCALE MODEL

Figure 101 Report Hyd-510
Pressure (Prototype Feet of Water)
Piezometer Nos. . Discharge (thousand cfs) . (Modified Block) . 120 200 . Z77 . . . .
1 . +3 0 . -4 . . 2 . +3 0 -2 . 3 . +2 . -2 . +2 . . . 4 . -12 -6 . +12 . . 5 . +2 +18 +53 . 6 +12 . +34 . +72 . . 7 +3 +2 . 0 . 8 +7 . +7 . +9 . . 9 +58 +67 +83
10 . +58 . +68 +83 . . 11 0 . +2 +4 . 12 +40 +5 0 13 0 . 0 . 0 . . 14 . +100 . +120 +140 . . 15 +83 +100 +130 . . . .
Notes: Tests were run on Block No. 2; data assumed applicable to Block No. J. For piezometer locations, see modified chute block drawing, Figure 100. Model pressures between +0.025 foot and -0.010 foot were recorded as zero.
OROVILLE FLOOD CONTROL OUTLET Pressures on Modified Block (Protrusion
at Upstream Corner)
1:78 Scale Model
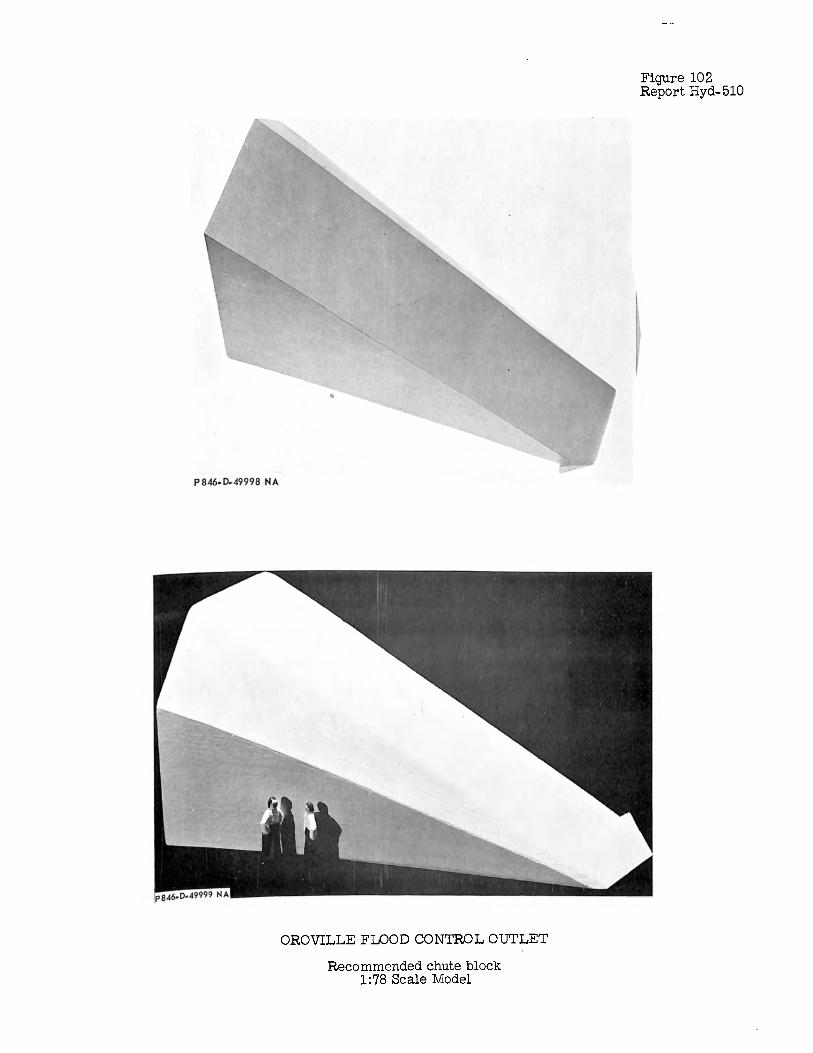
P846.0..49998 NA
OROVILLE FLOOD CONTROL OUTLET
Recommended chute block 1:78 Scale Model
Figure 102 Report Hyd-510

Figure 103 Report Hyd-510
iezometer No,
1 2 3 4 5 6 7 8 9
10 11 12 13 14 15 16 17 18 19 20 21 22 23 24 25 26 Z'1 28 • 29 JO
. .
. . . . • . . . . . . . . . . . . . . . . . . . . . . . . . . . . . . . . . . . . . . .
Pressure (Prototype Feet of Water)
Discharge (thousand cfs) 50 75 . 100 150 . . . 67 74 81 103 51 57 6,3 .. 84 . 58 65 71 91 . . . . 50 . 57 63 84 . . . ,38 . 44 . 49 : 68 . . . . 16 . 17 18 22 . 22 . 23 . 25 Z'1 . . . . 11 . 16 . 19 . 29 . . . . . 0 0 . 0 . 0 . .
47 . 58 . 68 . 97 . . • . . -2 . -2 . 0 . 16 . . . 0 0 . -4 . -17 . . .. . 5 . 5 . 5 . 9 . . . 0 0 0 0 . .
93 104 113 139 . . 43 . 55 . 64 95 . . . .
5 5 5 8 . . 4 4 . 3 . 0 . . . . 0 . 0 0 . 0 . . 0 0 . 0 . 0 . • . . 0 . 0 . 0 0 . . . . 0 . 0 0 . 0 . . . .
11 12 . 12 . 17 . . 0 0 0 . 0 . 0 0 0 . 0 . . . 0 0 0 0 . . 0 . 0 . 0 . 0 . . . . .
-2 0 . 0 . 0 . . 0 0 0 . 0 . . . 3 . 3 . 4 5 . . . . . . . .
200 . zn . 121 145 104 128 lCll 129 101 126
84 103 26 . 30 . JO 34 33 35 9 . 26 .
12•2 . 150 . 40 79
-24 0 21 . 51 . -4 . -8 .
158 . 183 . 122 156 16 41 -2 . .. s . 0 . 0 . 0 . 0 . 0 0 0 0
25 . 37 . 4 . 6 . 0 . 3 . 0 0 0 0 0 . 0 . 0 . 0 . 8 . 15 . . .
Notes: Tests were run on Block No. 2; data assumed applicable to Block No. 3. For piezometer locations, return to initial numbering system, see Figure 96. Minus sign indicates pressures below atmospheric--others are above atmospheric.
OROVILLE FLOOD CONTROL OUTLET Chute Block Pressures--Blocks No. 2 and J
1:78 Scale Model

PIEZ. NO.
I 2 3 4 5 6
I 2 3 4 5 6
I 2 3 4 5 6
I 2 3 4 5 6
I 2 3 4 5 6
I 2 3 4 5 6
PRESSURE (PROTOTYPE FEET)
FIGURE 104 REPORT HYD-510
DIMENSION DISCHARGE (THOUSAND C.F.S.) "A" 150 200 277
+I -5 -12 12.0 FT. -I -9 -20
-2 -8 -10 WOOD +20 +34 +47 BLOCK +55 +79 +103
+36 +60 +78
+12 +5 -6 14.5 FT. +14 +8 -2
+15 +14 +13 WOOD +9 +27 +33 BLOCK +27 +56 +71
+33 +66 +86
-5 -9 -16 14.5 FT. -5 -9 -16
-7 -II -5 STEEL +12 +27 +40 BLOCK +27 +52 +·75
+40 +63 +92
+I -2 -5 15.6 FT. +2 -2 -6
+0 +5 +7 WOOD -8 +2 -4 BLOCK- +15 +39 +76
+10 +34 +66
0 -2 -8 19.5 FT. - - -
+a +16 +41 STEEL -17 -24 0 BLOCK - - -
+16 +40 +79
+3 0 -4 16.25 FT. +3 0 -2
+2 -2 +2 STEEL -12 -6 +12 BLOCK +2 +18 +53
+12 +34 +72
OROVILLE FLOOD CONTROL OUTLET
CHUTE BLOCK PRESSURES FOR VARIOUS CORNER END HEIGHTS 1:78 SCALE MODEL
698

Figure 105 Report Hyd-510
Pieigmeter Ng 1
31 32 33 34 .35 36 .37 .38 39
. . . . • • . . . . . . . . . . . .
Pressure (Prototype Feet of Water)
Discharge (thousand cfs) 20 . 72 . lQO . 120 2QO . . . . . . . 0 . 0 . 0 0 . 0 . . . 0 . 0 . 0 . 12 . 23 . . . .
10 . 17 21 . 33 . 39 . . . 0 . 0 . 0 . 5 . 20 . . . . 0 . 0 . 5 21 .37 . .
11 . 17 . 21 . JS . 52 . . . . 0 . 0 . 0 4 . 16 . . . 0 . 0 • J • 16 33 . . .
12 • 18 . 21 • 40 55 . . . . . . . . .
. 277 . . . . 4 . . 29 . 46 . 41 . . 54 .
• ff/ . . 40 . . 53 . 71
Note: For piezometer locations, see Figure 96. All pressures were above atmospheric. of the chute.
A 5-foot-long sill was placed at the end
OROVILLE FLOOD CONTROL OUTLET
Sidewall Pressures
1: 78 Scale Model

Figure 106 · Report Hyd-510
A. Initial wall was 170 feet long with the top at elevation 228. Dye shows region of high velocity flow. Discharge 150,000 cfs.
B. Enlarged wall was 190 feet long. The top sloped from elevation 236 at the river bank to elevation 231. Wall prevented 150, 000-cfs discharge flow from moving upstream as shown by dye.
OROVILLE FLOOD CONTROL OUTLET
C. Either wall produced erosion in the streambed.
Flow and erosion in the river with wall on left bank 1 :78 Scale Model
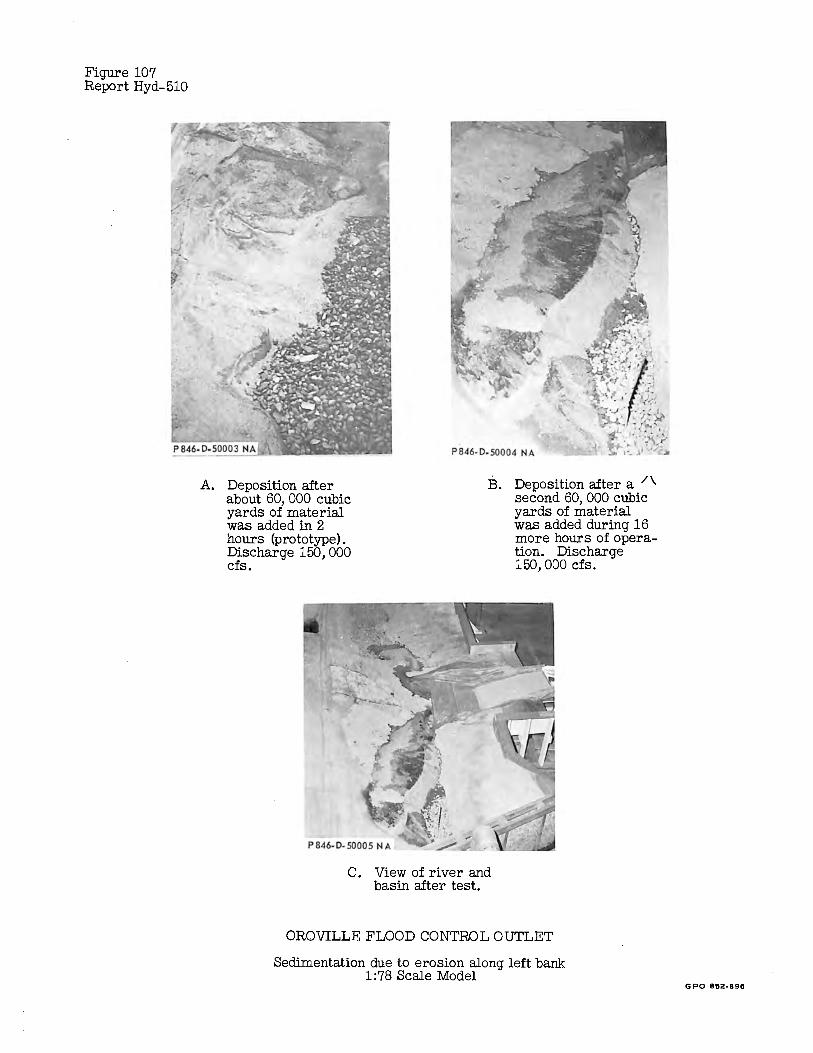
Figure 107 Report Hyd-510
A. Deposition after about 60, 000 cubic yards of material was added in 2 hours (prototype). Discharge 150,000 cfs.
B. Deposition after a /\ second 60, 000 cubic yards of material was added during 16 more hours of operation. Discharge 150, 000 cfs.
C. View of river and basin after test.
OROVILLE FLOOD CONTROL OUTLET
Sedimentation due to erosion along left bank 1:78 Scale Model
GPO 862-896
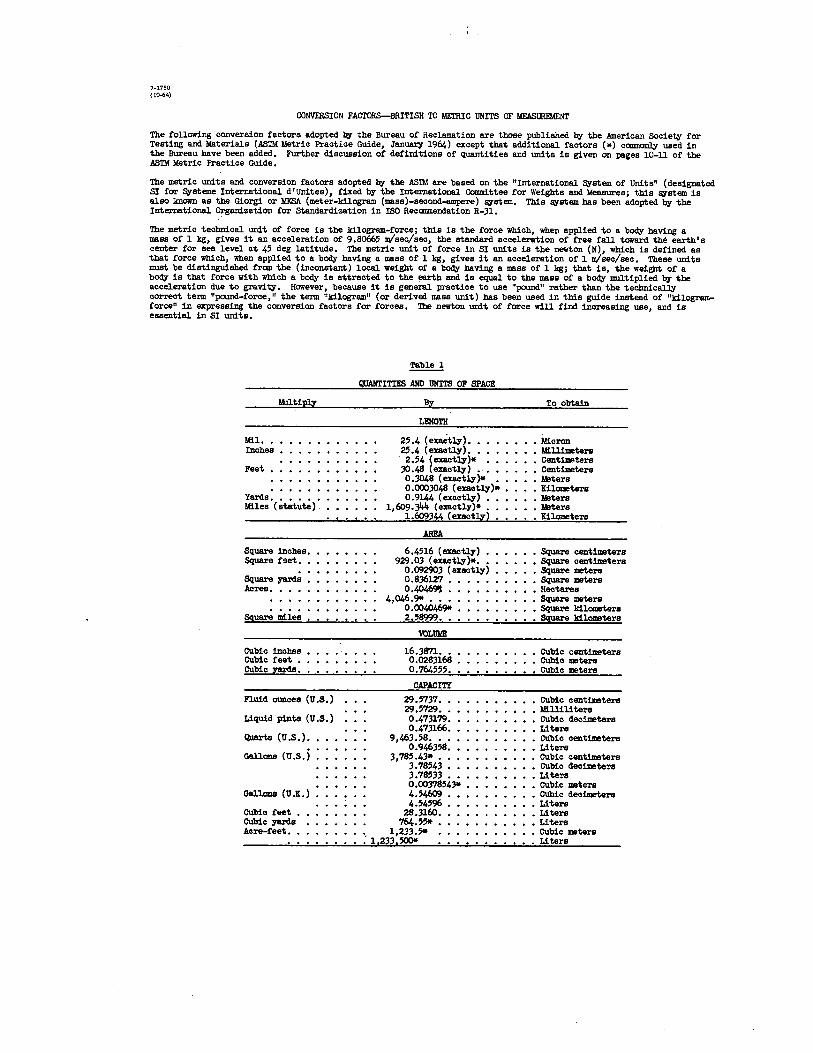
7-1750 (10-64)
CONVERSION FACTORS-BRITISH TO METRIC UNITS OF MEASURl!MENT
The following conversion factors adopted b,y the Bureau of Reclamation are tbose published b,y the American Society tor Testing and l\faterials (.ASTM Metric Practice Guide, JBn11B17 1964) except that additional factors (*) OQIIIDQDly used in the Bureau have been added. Further discussion or definitions or quantities and units is given on pages 10-11 of the ASTM Metric Practice Guide.
The metric units and conversion factors adopted b,y the .AS'lM are based on the "International 8,ystem or Units" (designated SI tor 8,ysteme international d 1Unites), fixed b,y the International Ccmmittee tor Weights and Measures; this system is also kn0m as the Giorgi or Ml!SA. (meter-kilogram (mass)-second-ampere) system. This system has been adopted b,y the International Organization for standardization in ISO RecClllllendation R-31.
The metric technical unit or force is the kilogram-force; this is the force which, when applied to ab~ having a mass or l kg, gives it an acceleration or 9.80665 ID/sec/sec, the standard acceleration or tree tall toward the earth's center tor sea level at 4S deg latitude. The metric unit or force in SI units is the newton (N), which is defined as that force which, when applied to ab~ having a mass or l kg, gives it an acceleration of l ID/sec/sec. These units must be distinguished :l'rom the (inconstant) loeal weight or ab~ having a mass of l kg; that is, the weight or a ~ is that force with which a ~ is attracted to the !IBrth and is equal to the mass or a b~ multiplied b,y the acceleration due to gravity. However, because it is general practice to use "pound" rather than the technically correct term "pound-force," the term "kilogram" (or derived mass unit) has been used in this guide instead or "k:l.logrami'orce" in expressing the conversion factors tor forces. The newton unit or force will find increasing use, and is essential in SI units.
Mil. IDohes
Feet.
161ltip].y
Yards ••••• Miles (statute) .
Square inches. Square feet.
Square yards Acres ••••
Sg.uare ml.las
CUbic inches Cubic feet • Cubic zuds.
nuid OIJIICSB (U,S.)
Liquid pints (U,S.)
Quarts (U,S.),
Oal.l.ons (U.S.)
Oal.l.ons (U ,K.)
Cubic feet • Cubic yards Acre-teat.
~
QIIANTITIES AND UNITS OF SPACE
25,4 (e:nctl1') •• 25.4 (exactl1') •• 2. 54 ( exactl1' )* •
30 .48 ( ezactl1') •.• 0,3048 ( exactly)* • • 0,0003048 (exactl1'l* • o. 9144 ( ezactl1') • • •
1,609.3" (exactly)* ••• 1,609344 (ezactg) ••
6,4516 (ezactl1') • 929.0:3 (exactly)* ••
0,09290:3 (euctl1') 0.8:36127 • , 0.40469'S ••
4,046.9* , ••• 0.0040469* • 2.58999 ••
16.:3871 ••• 0,028:3168 • 0.764555 ••
CAPACIT!'
29.57:37 •• 29.5729 •• 0,47:3179. 0,47:3166,
9,463.58 ••• 0,946:358.
3,ffl.4:3* •• 3,7854:3 • :3.785:3:3 ••• 0,00:37854:3* , 4.54609 • 4.54596 •
28.:3160. • 764.55* • ., 1,2:3:3.5* • 1.2:3:3.500*
To obtain
• Micron • Millimeters • Centimeters • Centimeters • MBters • Kilometers • MBters • llll'ters • Kilometers
• Square centimeters • Square ceatiaters • Square meters , Square meters • Hectares • Square meters • Square kilometers • Sg.uare lcl.loDrters
• Cubic centimeters • Cubic meters • Cubic meters
• Cubic centimeters • Milliliters • Cubic decimeters • Liters • Cubic centimeters • Liters , Cubic centimeters • Cubic decimeters • Liters • Cubic meters • Cubic decimeters • Liters • Liters • Liters • Cubic maters • Liters

Mllti~
Grains (117,000 lb) , , , Trey ounces ( 480 grains) • 0unces (avdp) • • • • Pounds (avdp) , , , , Short tons (2,000 lb)
.!!l. MASS
64,79891 (exac~). '.31,1035 ••• , • , 28.3495 ••••• , , 0,45359237 (exact~)
907.l.85 •• • 0. 907J.8S •
Long tons (2.~ lb) ,11016,05 ,
Pounds per square inch
Pounds per square foot
0unces per cubic inch , , • Pounds per cubic root • • ,
Tans (J.aog) per cubic v,rd •
Ounces per gallon (U,S,), Ounces per gallon (U.K,), Pounds per gallon (U.S.~. PIDl!l4s per glll._lO!!_lU.K, •
Inch-pounds
Foot-pounds
Foot-pounds per inch Ounce-inches
Feet per seccmd
Feet per year • Ml.lea per hour
Feet J!!!!:. secgnd'2
CUbic feet per second ( asoand-t'eet) , , , , • , , , , , • ,
CUbic feet per minute • , • , • Gallcms (U .s. ) par minute • • •
FORCELAREA
0,070307 , 0,689476 • 4,88243 ,
47.8803 • ,
MASS/VOLUME (DENSITI)
1,72999 • 16,0185 • ·• ·0,0160185 l~
MASSLCAPACITI
7,4893 • 6,2362 •
119.829 • 99,779 •
BENDING _Mll,!l!NT _Q_R TORQDE
~:~:fx'J.06' 0,138255 • , • 1,35582 X 10⁷ 5,4431 ••••
72,008 • , ••
~I'l'Y 30,48 (exact~) •• 0,3048 (exao~)* 0,965873 X lQ-btt , 1,609344 (exact~) 0 144704 (exactly)
ACCELERATION* 0. :l0/,8lt • • •
FLOW
0,028317*. 0,4719 •• 0,06309 ,
~
QUANTITIES AND UNITS OF MECHANICS
To obtain
• Ml.lligrema , Grams • Grams • Kilograms • Kilograms • Metric tons • KiJ.ograme
• Kilograms per square centimeter • Newtons per square centimeter • Kilograms per square meter .N~_l!!!...!!!1\1&;'8~
• Grams per cubic centimeter Kilograms per cubic meter Grams per cubic centimeter Grams par cubic centimeter
• Orama per liter • Grams per liter , Orama per li tar , Grams per li tar
, Meter-kilograms • Centimeter-dynes • Meter-kilograms , Cant:lmeter-dynes • Centimeter-kilograms per centimeter • Gram-centimeters
, Centimeters per aeccmd • Meters per ssocmd • Centimeters per ssocmd • Kilometers per hour • Meters par aeccmd
• Meters par aeccmd!
, Cullie meters per aeccmd • Liters per second • Li tera per second
Multi~
Pounds
Br:!. tiah therllal ,mi ts ( Btu) ,
Btu per pound. Foot-pounds.
Horsepower , , Btu per hour • Foot-pounds per seccmd
Btu in ,/1,r rt2 deg F (k, thermal conductivity)
Btu rt/1,r rt2 deg F • • Btu/1,r rt2 deg F ( C, thermal
ccmductence) , • , • • , •
Deg F hr rt2/Bi,;_ (R; ii;,,,,;..i resistance) , • , • • • • • •
Btu/lb deg F (c, heat capsoity), Btu/lb deg F • , • • • , , , • , Ft2/l,r ( thermal dit't'uaivi ty)
Grains/bl' rt2 ( water vapor trenamission), , • , , ,
Perms ( permeence) • • , • • • Perm-inches (permeability) •
!411 til!1Y, CUbic feet per square foot per
d~ (seepage) , • , • • , , Pound-seconds per square foot
By
FORCE*
0,453592* , • , 4,4482* •••• 4,4482 X lQ-5* ,
WORK AND MBAX*
• 0.252* , •• , , • 1,055.06 ••• , , • , 2,326 (exac~).
l,15~Q2,t_.~~
POWER
745,700 ••••• 0.293071 • , • l,355~
HEAT TRANSFER
1,442 • o.~. 1,4880*
0,568 4,882
1.761 • 4,1868 • 1,000* • 0.2581 , , 0 ,Q9_29()1t-'-
WATER VAPOR TRANSMISSION
16.7 • 0,659 1,67
~ OTHER QJJANTITIFS AND UNITS
.!!Z.
304.8* •••
(viscosity) • • • • • , • • • • • 4,8824* ••••• 0,02903* (exac~) 5/9 exact~. 0,03937 ••
Square feet per second (viscosity) Fahrenhei-t degrees (ohenge)* , Volts per mil. • • • , , • • • Lumens per square foot ( t'oot-
cendlee) Ohm-circular mils per foot Ml.llicur:1.es per cubic foot Ml.lliamps per square toot Gallana per square yard Pounds per inch,
10,764 •• 0,001662 •
35,:3147* • 10,7639* •
4,527219* 0 ,J. 7858't_,_
Kilograms Newtons !?l!!!,s
To obtain
• Kilogram calories • Joules , Jmles per gram • Joules
, Watts , Watts , Watts
• Ml.lliwatts/cm deg C , Kg cel/1,r m deg C ,Kgcel!iV'hrm2degC
, Milliwatts/cm2 deg C • Kg eel/bl' m2 deg C
• Deg C cm2/milliwatt , J/g deg C , Cai/p-em deg C • cm2tsso -~
, Grama/24 hr m2 • Metric perms ~_Metri_c.J!!rm-centimeters
To obtain
, Liters per square meter per d~
• Kilogram second per square meter • Square meters per second • Celsius or Kelvin degrees (change)* • Kilovolts per millimeter
• Lumens per square meter • Ohm-square millimeters per meter • Millicur:1.es per cubic meter • Millillllq>S per square meter , Li tars per square meter • KiJ.ograme per centimeter
GPO 845-237


![arXiv:1610.07458v1 [cs.SI] 24 Oct 2016 · tweet < 0 A user tweets else r 1 = r 1 - R tweet If r 1 - R retweet < 0 A user retweets else r 1 = r 1 - R retweet Update time: time += -log(r](https://img.pdfslide.net/doc/110x75/5f83580801a519623c220261/arxiv161007458v1-cssi-24-oct-2016-tweet-0-a-user-tweets-else-r-1-r-1.jpg)