Embed Size (px)
Citation preview

Copyright 2006-2014 American Business Analytics & Research, LLC, www.shadowstats.com
HYPERINFLATION 2014—GREAT ECONOMIC TUMBLE 2014 ShadowStats Hyperinflation Report — Second Installment
No. 617: SPECIAL COMMENTARY
April 8, 2014
__________
Economic Reality versus Illusion:
No Recovery, Just Plunge, Stagnation and Renewed Plunge
Re-Intensifying Downturn Already Underway
Confluence of Negative Surprises, Including New Business and Systemic Woes,
Should Hit U.S. Dollar and Spike Inflation
Hyperinflation to Intensify Unfolding Depression
Gold as a Store-of-Wealth and Safe-Haven Remains Primary Hedge
for Maintaining Purchasing Power of Wealth and Assets
__________
Opening Comments—Second Installment
Individuals Must Protect Themselves, Act in Their Own Best Interests.
This second and final installment to Hyperinflation 2014, is designed to be read in conjunction with the
First Installment, where page, graph and table numbers here all follow in sequence from the earlier
piece. Subtitled The End Game Begins, the first missive focused on the nature of the long-range
insolvency, extreme-monetary policies and systemic and economic instabilities of the United States, and
the rapidly deteriorating global confidence in the U.S. government and U.S. dollar, which would lead to
massive dumping of the U.S. currency and the early stages of a U.S. hyperinflation in 2014.

Shadow Government Statistics — Hyperinflation 2014—Second Installment, No. 617, April 8, 2014
Copyright 2006-2014 American Business Analytics & Research, LLC, www.shadowstats.com 54
The Second Installment— subtitled Great Economic Tumble—focuses on the nature of underlying U.S.
economic activity and on possible preventative and hedging actions that individuals and the government
can take versus the developing crisis.
The U.S. economy never recovered from its collapse through 2008 into 2009. Instead, it stagnated at a
low level of activity, and now it is turning down anew. A flailing U.S. economy will become a major
factor behind global markets pummeling the U.S. dollar, as well as the resurrection of the systemic and
financial crises of 2007 and 2008, which never were resolved by the U.S. government and Federal
Reserve, only kicked down the road like the proverbial can. All these factors likely will be confluent
triggers of the hyperinflation.
Where the federal government appears loathe to address the long-term sovereign-solvency issues that
might have prevented a hyperinflation, or to take actions that could help to mitigate the financial,
economic, social and political turmoil that would accompany such a catastrophic event, it falls to the
individual to take actions to protect his or her wellbeing and self-interests and those of family, friends,
business, etc.
Chapter 6—Overview and Executive Summary, for the Second Installment, begins on page 57.
Best wishes to all! — John Williams
__________
Contents – Second Installment
Opening Comments—Second Installment .............................................................................................. 53 Individuals Must Protect Themselves, Act in Their Own Best Interests. .................................................. 53
Chapter 6—Overview and Executive Summary—Great Economic Tumble ................................ 57 Renewed Downturn Should Burst the Bubbles of Statistical Illusion and Political Deception. ....... 57 Official Version of Recent Economic History. ..................................................................................................... 57 The Alternate, Real-World Version of Recent Economic History. ............................................................... 58 Fed Chair Yellen Discusses an Unusual “Recovery.” ......................................................................................... 58
Graph 22: Headline Real GDP................................................................................................................................................. 59 Graph 23: ShadowStats Corrected Real GDP ................................................................................................................... 59 Graph 24: Labor-Force Participation Rate ....................................................................................................................... 60 Graph 25: Employment-Population Ratio ........................................................................................................................ 60
New Quantitative Easing Remains a Threat to the Dollar. ............................................................................. 61 Handling a Hyperinflationary Great Depression. .............................................................................................. 61
Chapter 7—American Economic History—Hype versus Reality ..................................................... 63 Economic and Systemic Crises in Historical Perspective. .............................................................................. 63
Table III: Standard History of the U.S. Economy ............................................................................................................ 64 Table IV: Alternate Version of U.S. Economy ................................................................................................................... 67
Shadow Government Statistics — Hyperinflation 2014—Second Installment, No. 617, April 8, 2014
Copyright 2006-2014 American Business Analytics & Research, LLC, www.shadowstats.com 55
Table V: U.S. Merchandise Trade Deficit by Country .................................................................................................... 70 Graph 26: Merchandise Trade Balance .............................................................................................................................. 71 Graph 27: Average Weekly Earnings (1967 Dollars)—CPI-W versus ShadowStats Alternate .................. 72
Chapter 8—Underlying Economic Fundamentals Show Renewed Downturn ........................... 74 Structural Liquidity Issues in the Current Numbers. ....................................................................................... 74
Graph 28: Household Income Dispersion ......................................................................................................................... 74 Graph 29: Annual Median Household Income (1967 Dollars)—CPI-U versus CPI-U-RS .............................. 76 Graph 30: Annual Median Household Income (1967 Dollars) ................................................................................. 76 Graph 31: Median Household Income Index (Monthly) ............................................................................................. 77
Income, Credit and Willingness to Spend. ............................................................................................................ 77 Graph 32: Consumer Credit Outstanding ......................................................................................................................... 78
Already Down, Economy Continues to Bottom Bounce and Slides Anew. ................................................ 79 Graph 33: Real M3 versus Formal Recessions ................................................................................................................ 79
Historical Perspective on the Headline Economic Data. ................................................................................. 80 Graph 34: Year-to-Year Change Monthly Payroll Employment ............................................................................... 80 Graph 35: Year-to-Year Change Monthly Real Retail Sales ....................................................................................... 81 Graph 36: Year-to-Year Change Monthly Industrial Production ............................................................................. 81
Chapter 9—A Gallery of Plunge and Stagnation: It’s All in the Inflation Numbers ................... 82 Economic Reporting Free-of-Inflation, and Inflation-Corrected. ................................................................ 82 The Government’s Inflation Games. ....................................................................................................................... 82 The Economy Has Yet to Recover. ........................................................................................................................... 83 Inflation-Independent Series. .................................................................................................................................. 83
Graph 37: Payroll Employment Level ................................................................................................................................. 84 Graph 38: ComparativeUnemployment Rates ................................................................................................................ 84 Graph 39: Inverted ShadowStats Alternate Unemployment .................................................................................... 85 Graph 40: Employment-to-Population Ratio ................................................................................................................... 85 Graph 41: Consumer Confidence .......................................................................................................................................... 86 Graph 42: Consumer Sentiment ............................................................................................................................................ 86 Graph 43: Indexed Housing Starts Beginning 2000 ..................................................................................................... 87 Graph 44: Housing Starts Post-World War II .................................................................................................................. 87
Corrected, Inflation-Dependent Series. ................................................................................................................ 88 Graph 45: Real GDP Level, Official Version ...................................................................................................................... 90 Graph 46: Corrected Real GDP Level .................................................................................................................................. 90 Graph 47: Indexed Headline Real Retail Sales ................................................................................................................ 91 Graph 48: Corrected Headline Real Retail Sales ............................................................................................................ 91 Graph 49: Indexed Headline Industrial Production Level ......................................................................................... 92 Graph 50: Corrected Industrial Production ..................................................................................................................... 92 Graph 51: Real New Orders for Durable Goods .............................................................................................................. 93 Graph 52: Corrected Real New Orders for Durable Goods ........................................................................................ 93
Chapter 10—Hyperinflationary Great Depression and How to Handle It ................................... 94 Move Towards Hyperinflation Accelerated by Current Fed and Government Actions. ...................... 94 Lack of Physical Cash. .................................................................................................................................................. 95 Possible Short-Term Electronic Relief for Individuals. ................................................................................... 97 Barter System. ................................................................................................................................................................ 97 Current Inflation and Investments. ........................................................................................................................ 98
Graph 53: Asset Class Performance in Various Inflation Environments ............................................................. 99 Financial Hedges and Investments. ........................................................................................................................ 99
Graph 54: Real (CPI-U Deflated) Gold and Silver Prices (2000 to Date) ........................................................... 100
Shadow Government Statistics — Hyperinflation 2014—Second Installment, No. 617, April 8, 2014
Copyright 2006-2014 American Business Analytics & Research, LLC, www.shadowstats.com 56
Graph 55: Real (CPI-U Deflated) Housing Prices (2000 to Date) ......................................................................... 101 Graph 56: Real (CPI-U Deflated) Interest Rates (2000 to Date) ........................................................................... 102 Graph 57: Year-End DJIA, Current versus Constant Dollar .................................................................................... 103 Graph 58: Log-Based, Year-End DJIA, Current versus Constant Dollar ............................................................. 104 Graph 59: Real (CPI-U Deflated) Dow Jones Industrial Average and S&P 500 (2000 to Date) ............... 104
Possible Official Actions and Responses/External Risks. ........................................................................... 105 Closing Comments—Other Issues. ....................................................................................................................... 108 Political Considerations. ......................................................................................................................................... 108 For Those Outside the United States. .................................................................................................................. 108 Common Sense. ........................................................................................................................................................... 108
__________
Shadow Government Statistics — Hyperinflation 2014—Second Installment, No. 617, April 8, 2014
Copyright 2006-2014 American Business Analytics & Research, LLC, www.shadowstats.com 57
Chapter 6—Overview and Executive Summary—Great Economic Tumble
Renewed Downturn Should Burst the Bubbles of Statistical Illusion and Political Deception.
The official story of U.S. economic activity of the last seven or eight years—one of plunge, full recovery
and new economic expansion in business activity—is a statistical illusion created by government
statistical bureaus understating the pace of inflation in recent years. As will be discussed, underlying
reality is an economy that plunged, stagnated at a low level of activity, and now is turning down again.
Both official- and alternate-economic reporting are assessed in terms of U.S. historical perspective in
Chapter 7. Official headline data are reviewed in Chapter 8 as to signals for an imminent, renewed
quarterly downturn in headline GDP reporting, and as evidence that a post-2007 economic recovery
could not have taken place. In Chapter 9, current U.S. economic activity also is assessed from the
standpoint of economic indicators that either are independent of inflation reporting, or are otherwise
have been distorted by the use of understated inflation in deflating the respective series.
Growth in most economic measures, such as the gross domestic product (GDP), is estimated on a
deflated basis, net of the effects of inflation. When a series is deflated by an inflation rate that is
understated, the result is inflation-adjusted or ―real‖ growth that is overstated. A major cause of the
overstatement of headline real GDP growth has been the use in recent decades of hedonic-quality
adjustments in estimating GDP-related inflation.
Hedonic-quality adjustments to prices are nebulous estimates of the impact of quality changes on
inflation, which cannot be quantified directly and are not recognized by the consumer. The hedonics are
estimated by econometric models that have little or no relationship to real-world activity. At present,
those elements artificially are spiking headline annual real GDP growth by about two-percentage points.
These issues are discussed more extensively in Chapter 9 of this installment; in Definitions and
Background to the Hyperinflation Reports, pages 6 to 8 of the First Installment; and in the Public
Comment on Inflation.
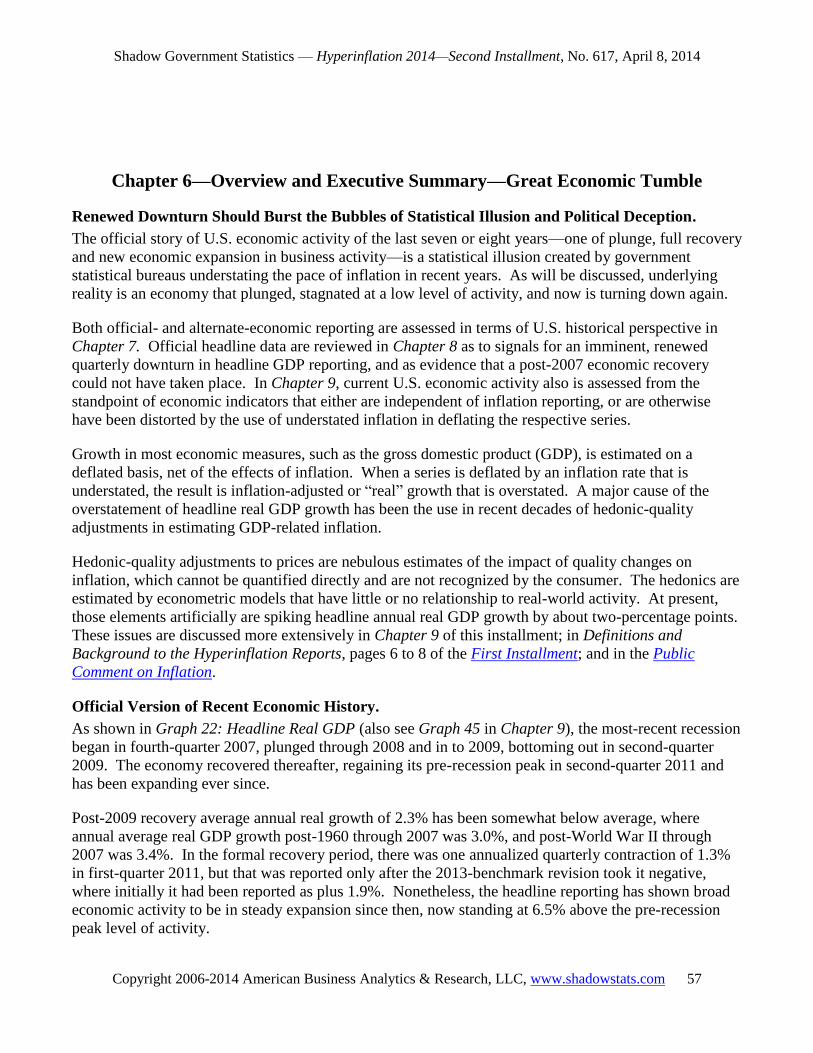
Official Version of Recent Economic History.
As shown in Graph 22: Headline Real GDP (also see Graph 45 in Chapter 9), the most-recent recession
began in fourth-quarter 2007, plunged through 2008 and in to 2009, bottoming out in second-quarter
2009. The economy recovered thereafter, regaining its pre-recession peak in second-quarter 2011 and
has been expanding ever since.
Post-2009 recovery average annual real growth of 2.3% has been somewhat below average, where
annual average real GDP growth post-1960 through 2007 was 3.0%, and post-World War II through
2007 was 3.4%. In the formal recovery period, there was one annualized quarterly contraction of 1.3%
in first-quarter 2011, but that was reported only after the 2013-benchmark revision took it negative,
where initially it had been reported as plus 1.9%. Nonetheless, the headline reporting has shown broad
economic activity to be in steady expansion since then, now standing at 6.5% above the pre-recession
peak level of activity.
Shadow Government Statistics — Hyperinflation 2014—Second Installment, No. 617, April 8, 2014
Copyright 2006-2014 American Business Analytics & Research, LLC, www.shadowstats.com 58
Anecdotally and as suggested by national polling, however, a broad economic recovery has not been
recognized widely by the general public. Historically, such a circumstance is a solid indicator that
something is wrong with the official numbers. Further, as discussed in Chapter 8, the underlying
economic fundamentals needed to fuel an economic recovery, and to support broad economic growth,
have not been and are not in play. There is no chance that economy has recovered as advertised.
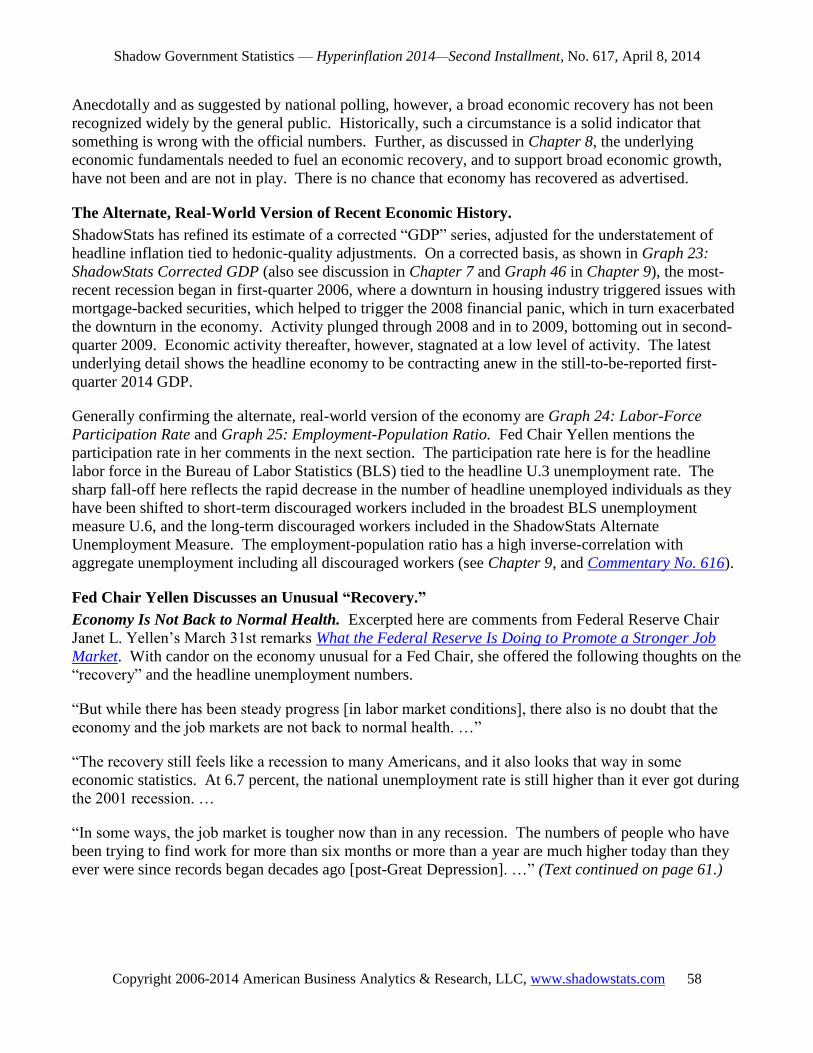
The Alternate, Real-World Version of Recent Economic History.
ShadowStats has refined its estimate of a corrected ―GDP‖ series, adjusted for the understatement of
headline inflation tied to hedonic-quality adjustments. On a corrected basis, as shown in Graph 23:
ShadowStats Corrected GDP (also see discussion in Chapter 7 and Graph 46 in Chapter 9), the most-
recent recession began in first-quarter 2006, where a downturn in housing industry triggered issues with
mortgage-backed securities, which helped to trigger the 2008 financial panic, which in turn exacerbated
the downturn in the economy. Activity plunged through 2008 and in to 2009, bottoming out in second-
quarter 2009. Economic activity thereafter, however, stagnated at a low level of activity. The latest
underlying detail shows the headline economy to be contracting anew in the still-to-be-reported first-
quarter 2014 GDP.
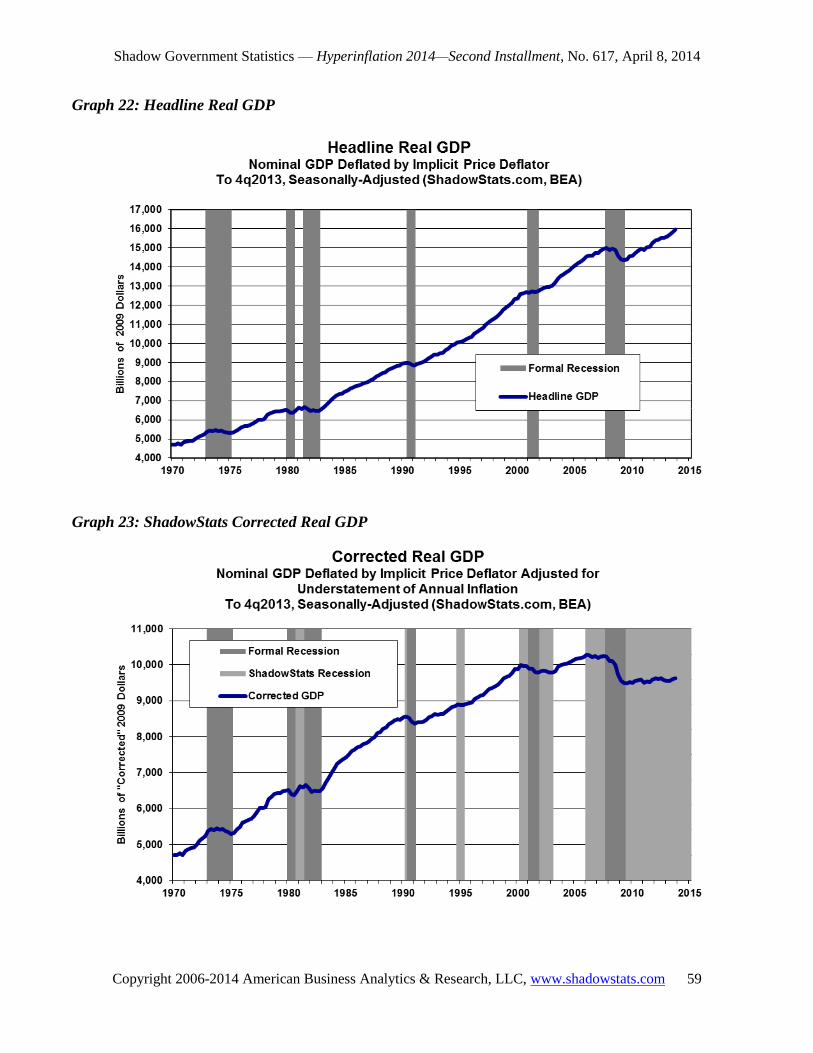
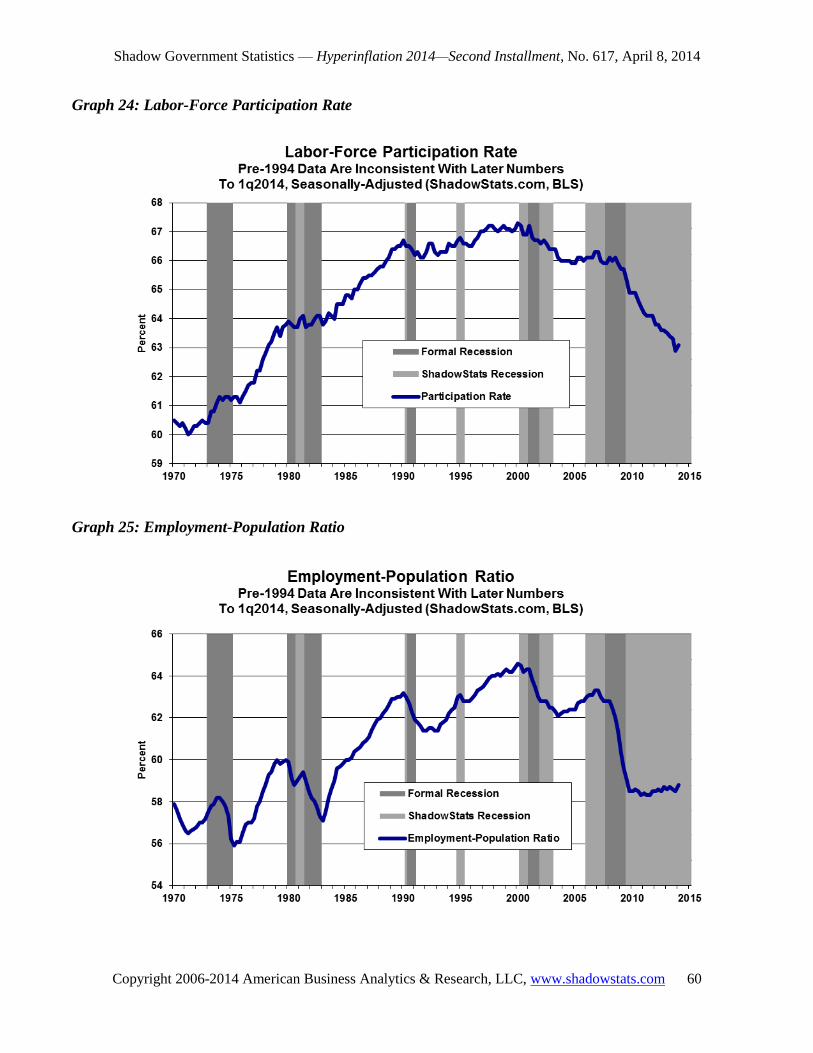
Generally confirming the alternate, real-world version of the economy are Graph 24: Labor-Force
Participation Rate and Graph 25: Employment-Population Ratio. Fed Chair Yellen mentions the
participation rate in her comments in the next section. The participation rate here is for the headline
labor force in the Bureau of Labor Statistics (BLS) tied to the headline U.3 unemployment rate. The
sharp fall-off here reflects the rapid decrease in the number of headline unemployed individuals as they
have been shifted to short-term discouraged workers included in the broadest BLS unemployment
measure U.6, and the long-term discouraged workers included in the ShadowStats Alternate
Unemployment Measure. The employment-population ratio has a high inverse-correlation with
aggregate unemployment including all discouraged workers (see Chapter 9, and Commentary No. 616).
Fed Chair Yellen Discusses an Unusual “Recovery.”
Economy Is Not Back to Normal Health. Excerpted here are comments from Federal Reserve Chair
Janet L. Yellen’s March 31st remarks What the Federal Reserve Is Doing to Promote a Stronger Job
Market. With candor on the economy unusual for a Fed Chair, she offered the following thoughts on the
―recovery‖ and the headline unemployment numbers.
―But while there has been steady progress [in labor market conditions], there also is no doubt that the
economy and the job markets are not back to normal health. …‖
―The recovery still feels like a recession to many Americans, and it also looks that way in some
economic statistics. At 6.7 percent, the national unemployment rate is still higher than it ever got during
the 2001 recession. …
―In some ways, the job market is tougher now than in any recession. The numbers of people who have
been trying to find work for more than six months or more than a year are much higher today than they
ever were since records began decades ago [post-Great Depression]. …‖ (Text continued on page 61.)
Shadow Government Statistics — Hyperinflation 2014—Second Installment, No. 617, April 8, 2014
Copyright 2006-2014 American Business Analytics & Research, LLC, www.shadowstats.com 59
Graph 22: Headline Real GDP
Graph 23: ShadowStats Corrected Real GDP
Shadow Government Statistics — Hyperinflation 2014—Second Installment, No. 617, April 8, 2014
Copyright 2006-2014 American Business Analytics & Research, LLC, www.shadowstats.com 60
Graph 24: Labor-Force Participation Rate
Graph 25: Employment-Population Ratio
Shadow Government Statistics — Hyperinflation 2014—Second Installment, No. 617, April 8, 2014
Copyright 2006-2014 American Business Analytics & Research, LLC, www.shadowstats.com 61
(Text continued from page 58) Yellen went on to note that ―… evidence of slack in the labor market has
been the behavior of the participation rate—the proportion of working-age adults that hold or are
seeking jobs. Participation falls in a slack job market when people who want a job give up trying to find
one. When the recession began, 66 percent of the working-age population was part of the labor force.
Participation dropped, as it normally does in a recession, but then kept dropping in the recovery. It now
stands at 63 percent, the same level as in 1978, when a much smaller share of women were in the
workforce. Lower participation could mean that the 6.7 percent unemployment rate is overstating the
progress in the labor market. …
―Participation rates have been falling broadly for workers of different ages, including many in the prime
of their working lives. Based on the evidence, my own view is that a significant amount of the decline
in participation during the recovery is due to slack …‖
New Quantitative Easing Remains a Threat to the Dollar.
Counter to earlier comments by former Fed Chairman Ben S. Bernanke that there was little the Fed
could do to reduce the unemployment rate, Ms. Yellen also offered that further Fed actions could and
would be used to help reduce the unemployment rate and to address imbalances in the labor market.
Where the Fed’s current options to provide new stimulus to the economy are nil, this sounds like a lead-
in to the end of tapering and the beginning of a renewed expansion in quantitative easing (QE3). With
three rounds of tapering, or cutbacks in QE3, in place, the new Fed Chair has established the Fed’s and
her credibility in being able to pull back on the easing.
As was the case with QE3 under Bernanke, however, any expanded easing going forward really will be
aimed at propping banking-system stability and liquidity, not at stimulating the economy, again, where
the Fed lacks tools at present to do so. The expressed faux purpose of any expanded easing to boost the
economy will continue to be no more than political cover for the Fed’s monetary activity, as it has been
for at least the last five years. Any move towards expanded QE3 should have extremely deleterious
effects on the U.S. dollar’s value in the global markets.
Handling a Hyperinflationary Great Depression.
It is in this environment of rapid fiscal deterioration and related massive funding needs that the U.S.
dollar remains open to a rapid and massive decline, along with a dumping of domestic- and foreign-held
U.S. Treasuries. The Federal Reserve would be forced to monetize further significant sums of Treasury
debt, triggering the early phases of a monetary inflation. Under such circumstances, current multi-
trillion dollar deficits would feed rapidly into a vicious, self-feeding cycle of currency debasement and
hyperinflation.
With the economy already in or near depression, hyperinflation kicking in quickly would push the
economy into a great depression, since disruptions from uncontained inflation are likely to bring normal
commercial activity to a halt.
What happens next is anyone’s speculation. How long would a hyperinflation last before the
government brought its fiscal house into order and established a sound currency? I would be surprised if
the hyperinflation crisis lasted beyond a year or two, since the system is not positioned to handle the
crisis well and pressures for rapid resolution would be extremely strong. All that depends, however, on
what evolves out of what otherwise would be highly unstable political, economic, financial and social
environments. Accordingly, the best individuals can do is to take actions to protect themselves and their

Shadow Government Statistics — Hyperinflation 2014—Second Installment, No. 617, April 8, 2014
Copyright 2006-2014 American Business Analytics & Research, LLC, www.shadowstats.com 62
families, through the worst of foreseeable circumstances, both in terms of personal safety and in terms of
the purchasing power of pre-crisis assets.
The primary hedge for preserving the purchasing power of one’s wealth and assets remains holding
physical gold and silver, and getting assets outside the U.S. dollar and the United States.
A discussed in Chapter 10, a U.S. hyperinflationary great depression would be extremely disruptive to
the lives, businesses and economic welfare of most individuals living in the United States. Such severe
economic pain could lead to extreme political change and/or civil unrest.
What is discussed here remains well shy of a comprehensive overview of all possible issues, but rather
at least raises some questions and touches upon some likely consequences. No one can figure out better
than you the peculiarities of this circumstance and how you, your family and/or your business might be
affected and best be protected. Using common sense remains the best advice I can offer.
Shadow Government Statistics — Hyperinflation 2014—Second Installment, No. 617, April 8, 2014
Copyright 2006-2014 American Business Analytics & Research, LLC, www.shadowstats.com 63
Chapter 7—American Economic History—Hype versus Reality
Economic and Systemic Crises in Historical Perspective.
History does tend to repeat itself. Nonetheless, where current economic and financial conditions have a
number of parallels in history, the underlying structural problems for the economy and unprecedented
debt leverage in the financial system that have been unwinding for almost seven years in what likely will
become the greatest economic and financial calamity in U.S., if not global, history.
The following historical list of U.S. economic contractions provides rough estimates of timing and
depth, along with brief description of causes. The list of traditional recessions generally is based on a
variety of sources (see Sources) and reflects one of a number of versions of the pre-1860 environment.
The list is subject to refinement. Major financial panics are mentioned, where they also were associated
with business contractions. The notable official-version exception is the 1987 stock market crash, which
is discussed later in the alternate-recessions table. Table III covers what is close to the standard history
of the U.S. economy, while Table IV shows the ShadowStats-alternate version of recent economic
history, with detail covered in the text following (see also Graphs 22 and 23 in Chapter 6).
Recession, Depression and Great Depression. [The definitions here are excerpted from the First
Installment, Definitions section, page 9.
Definitions of Broad Economic Activity:
Recession: Two or more consecutive quarters of contracting real (inflation-adjusted) GDP,
where the downturn is not triggered by an exogenous factor such as a truckers’ strike. The
NBER, which is the official arbiter of when the United States economy is in recession, attempts
to refine its timing calls, on a monthly basis, through the use of economic series such as payroll
employment and industrial production, and it no longer relies on the two quarters of contracting
GDP rule.
Great Recession: A popularized term for describing the unusually-deep and protracted formal
recession from December 2007 through June 2009, the most severe contraction in the U.S.
economy since the Great Depression of the 1930s. The ShadowStats contention remains that the
referenced downturn is ongoing and deeper than formally described.
Depression: A recession, where the peak-to-trough contraction in real growth exceeds 10%.
Great Depression: A depression, where the peak-to-trough contraction in real growth exceeds
25%.
Economic Recovery: The period following the trough of an economic downturn, once that
―recovery‖ has exceeded the pre-recession or pre-downturn peak in activity, is considered
recovery. Once the economy is moving above its pre-recession high, it is in expansion, and a
Shadow Government Statistics — Hyperinflation 2014—Second Installment, No. 617, April 8, 2014
Copyright 2006-2014 American Business Analytics & Research, LLC, www.shadowstats.com 64
renewed downturn would be considered a new recession (a double-dip recession in the event of a
particularly short-lived recovery). If the economy falters before regaining its pre-recession high,
it remains in recession.
Economic Boom: Real year-to-year growth in the GDP exceeding 4% would be considered
booming activity. Average annual growth in the last 40 years has been 2.7%. Average
annualized quarter-to-quarter growth has been 2.8%, with any given quarter’s annualized growth
rate surrounded by a 95% confidence interval of +/- 3.5%.
Table III: Standard History of the U.S. Economy
United States of America - Economic Contractions, 1784 to Date
by Administration, Duration, Depth and Causes
Pre-Constitution; Timing/Duration: 1784 to 1789, 48 months; Peak-to-Trough Contraction: Severe;
Nature: Structural/Liquidity. Background: Post-Revolution, no Constitution, no central authority, lack
of sound money, excessive trade deficit.
Jefferson/Madison; Timing/Duration: 1807 to 1810, 24 months; Peak-to-Trough Contraction: 20%;
Nature: Exogenous. Background: European war blocked shipments of goods to the U.S.
Madison/Monroe; Timing/Duration: 1815 to 1821, 60 months; Peak-to-Trough Contraction: 15%;
Nature: Structural/Liquidity. Background: Post-War of 1812. Debt excesses led to currency inflation,
then debt/liquidity collapse and severe deflation.
Van Buren/W. H. Harrison/Tyler; Timing/Duration: 1837 to 1843, 60 months; Peak-to-Trough
Contraction: 25%; Nature: Liquidity/Structural. Background: Excess debt and currency inflation fueled
by speculative lending out of England. U.S. crop failure and English banking crisis led to debt/liquidity
collapse.
Polk; Timing/Duration: 1847 to 1848, 12 months; Peak-to-Trough Contraction: 4%; Nature: Exogenous.
Background: Post-Mexican War. Effect of severe European depression was offset partially by raised
expectations from discovery of gold in California.
Buchanan-I; Timing/Duration: Jun 1857 to Dec 1858, 18 months; Peak-to-Trough Contraction: 12%;
Nature: Liquidity. Background: Banking crisis and liquidity collapse.
Buchanan-II/Lincoln-I; Timing/Duration: Oct 1860 to June 1861, 8 months; Peak-to-Trough
Contraction: 10%; Nature: Structural. Background: Tied to secession movement.
Lincoln-II/A. Johnson; Timing/Duration: Apr 1865 to Dec 1867, 32 months; Peak-to-Trough
Contraction: 13%; Nature: Structural/Liquidity. Background: Post-Civil War, retirement of greenbacks
and English Panic.
Grant-I; Timing/Duration: June 1869 to Dec 1870, 18 months; Peak-to-Trough Contraction: 5%;
Nature: Structural/Liquidity. Background: Secondary downturn following Civil War, "Black Friday"
panic from Gould & Fiske's efforts to corner the gold market.
Grant-II/Hayes; Timing/Duration: Oct 1873 to Mar 1879, 65 months; Peak-to-Trough Contraction:
15%; Nature: Liquidity/Structural. Background: Over-building of railroads, over-extension of debt,
Shadow Government Statistics — Hyperinflation 2014—Second Installment, No. 617, April 8, 2014
Copyright 2006-2014 American Business Analytics & Research, LLC, www.shadowstats.com 65
foreign funding collapse with Vienna Panic of 1873, collapse of savings banks, fear of currency
debasement tied to elimination of silver backing.
Arthur/Cleveland-I; Timing/Duration: Mar 1882 to May 1885, 38 months; Peak-to-Trough
Contraction: 12%; Nature: Liquidity. Background: French Panic of 1882, collapse of commodity prices,
silver and stock panics of 1884.
Cleveland-II; Timing/Duration: Mar 1887 to Apr 1888, 13 months; Peak-to-Trough Contraction: 4%;
Nature: Liquidity. Background: Government paid off debt, forcing reduction of circulating banknotes.
B. Harrison; Timing/Duration: Jul 1890 to May 1891, 10 months; Peak-to-Trough Contraction: 3%;
Nature: Liquidity. Background: Baring Panic in England, forced liquidation of foreign holdings of U.S.
stocks.
Cleveland-III; Timing/Duration: Jan 1893 to Jun 1894, 17 months; Peak-to-Trough Contraction: 16%;
Nature: Liquidity. Background: Failure of Reading Railroad triggered panic.
Cleveland-IV, McKinley-I; Timing/Duration: Dec 1895 to Jun 1897, 18 months; Peak-to-Trough
Contraction: 15%; Nature: Liquidity/Inventory. Background: Lack of confidence in currency system.
McKinley-II; Timing/Duration: Jun 1899 to Dec 1900, 18 months; Peak-to-Trough Contraction: 4%;
Nature: Liquidity. Background: German stock market panic of 1899.
T. Roosevelt-I; Timing/Duration: Sep 1902 to Aug 1904, 23 months; Peak-to-Trough Contraction:
10%; Nature: Liquidity/Inventory. Background: Temporary layoffs, "Rich Man's Panic" of 1903/04.
T. Roosevelt-II; Timing/Duration: May 1907 to Jun 1908, 13 months; Peak-to-Trough Contraction:
15%; Nature: Liquidity/Exogenous. Background: San Francisco earthquake and conflagration (1906),
March 1907 panic and banking crisis.
Taft-I; Timing/Duration: Jan 1910 to Jan 1912, 24 months; Peak-to-Trough Contraction: 5%; Nature:
Exogenous. Background: Increasing government regulation of railroads and trusts.
Taft-II, Wilson-I; Timing/Duration: Jan 1913 to Dec 1914, 23 months; Peak-to-Trough Contraction:
13%; Nature: Exogenous/Liquidity. Background: Collapse of foreign markets, loss of foreign liquidity
as World War I broke out, U.S. stock market closed.
Wilson-II; Timing/Duration: Aug 1918 to Mar 1919, 7 months; Peak-to-Trough Contraction: 5%;
Nature: Structural. Background: Post-World War I, overproduction of war goods, not enough jobs.
Wilson-III, Harding-I; Timing/Duration: Jan 1920 to Jul 1921, 18 months; Peak-to-Trough
Contraction: 9%; Nature: Inventory/Liquidity. Background: Commodity inflation/deflation, sugar
scandal.
Harding-II, Coolidge-I; Timing/Duration: May 1923 to Jul 1924, 14 months; Peak-to-Trough
Contraction: 4%; Nature: Inventory. Background: Inventory-related lay-offs.
Coolidge-II; Timing/Duration: Oct 1926 to Nov 1927, 13 months; Peak-to-Trough Contraction: 2%;
Nature: Inventory/Liquidity. Background: Real estate bust, bank failures, automobile over-production.
Hoover; Timing/Duration: Aug 1929 to Mar 1933, 43 months; Peak-to-Trough Contraction: 33%;
Nature: Structural/Liquidity. Background: The Great Depression. Collapse of debt excesses from 1920s
and liquidity crisis, extreme income variance, overbuilding, stock crash, banking collapse, industrial
restructuring as long-term aftershock of Panama Canal construction and World War I end, permanent
job losses.
Shadow Government Statistics — Hyperinflation 2014—Second Installment, No. 617, April 8, 2014
Copyright 2006-2014 American Business Analytics & Research, LLC, www.shadowstats.com 66
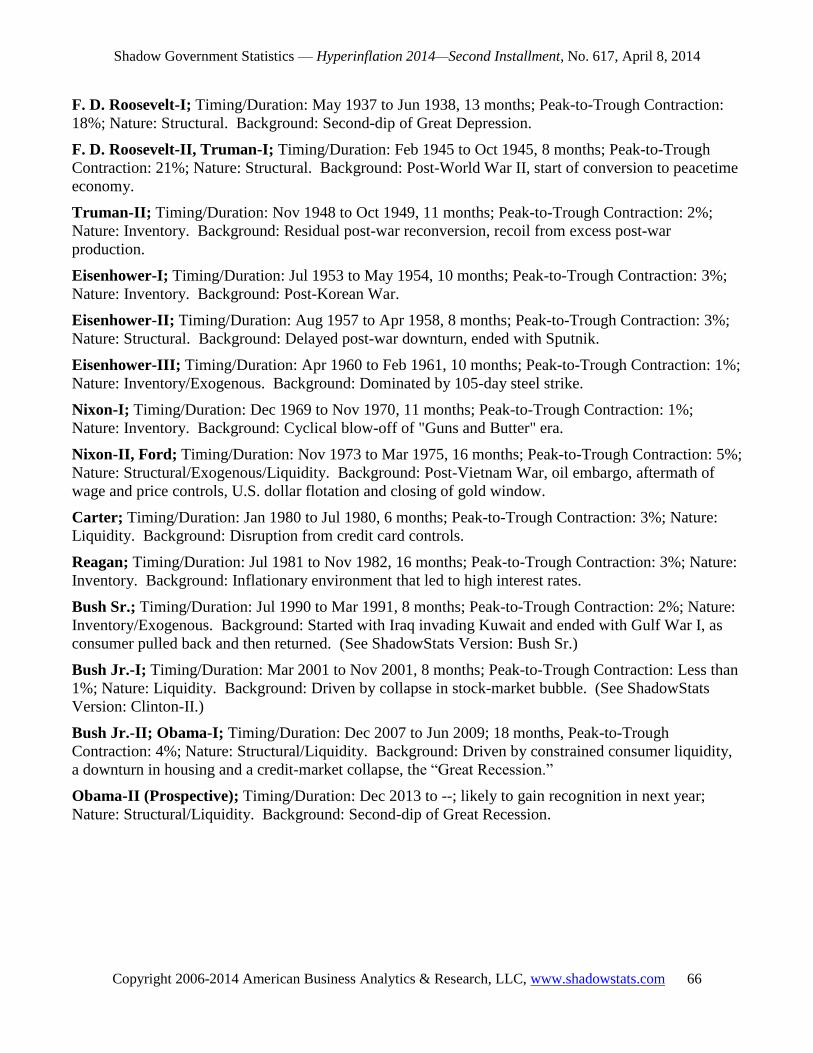
F. D. Roosevelt-I; Timing/Duration: May 1937 to Jun 1938, 13 months; Peak-to-Trough Contraction:
18%; Nature: Structural. Background: Second-dip of Great Depression.
F. D. Roosevelt-II, Truman-I; Timing/Duration: Feb 1945 to Oct 1945, 8 months; Peak-to-Trough
Contraction: 21%; Nature: Structural. Background: Post-World War II, start of conversion to peacetime
economy.
Truman-II; Timing/Duration: Nov 1948 to Oct 1949, 11 months; Peak-to-Trough Contraction: 2%;
Nature: Inventory. Background: Residual post-war reconversion, recoil from excess post-war
production.
Eisenhower-I; Timing/Duration: Jul 1953 to May 1954, 10 months; Peak-to-Trough Contraction: 3%;
Nature: Inventory. Background: Post-Korean War.
Eisenhower-II; Timing/Duration: Aug 1957 to Apr 1958, 8 months; Peak-to-Trough Contraction: 3%;
Nature: Structural. Background: Delayed post-war downturn, ended with Sputnik.
Eisenhower-III; Timing/Duration: Apr 1960 to Feb 1961, 10 months; Peak-to-Trough Contraction: 1%;
Nature: Inventory/Exogenous. Background: Dominated by 105-day steel strike.
Nixon-I; Timing/Duration: Dec 1969 to Nov 1970, 11 months; Peak-to-Trough Contraction: 1%;
Nature: Inventory. Background: Cyclical blow-off of "Guns and Butter" era.
Nixon-II, Ford; Timing/Duration: Nov 1973 to Mar 1975, 16 months; Peak-to-Trough Contraction: 5%;
Nature: Structural/Exogenous/Liquidity. Background: Post-Vietnam War, oil embargo, aftermath of
wage and price controls, U.S. dollar flotation and closing of gold window.
Carter; Timing/Duration: Jan 1980 to Jul 1980, 6 months; Peak-to-Trough Contraction: 3%; Nature:
Liquidity. Background: Disruption from credit card controls.
Reagan; Timing/Duration: Jul 1981 to Nov 1982, 16 months; Peak-to-Trough Contraction: 3%; Nature:
Inventory. Background: Inflationary environment that led to high interest rates.
Bush Sr.; Timing/Duration: Jul 1990 to Mar 1991, 8 months; Peak-to-Trough Contraction: 2%; Nature:
Inventory/Exogenous. Background: Started with Iraq invading Kuwait and ended with Gulf War I, as
consumer pulled back and then returned. (See ShadowStats Version: Bush Sr.)
Bush Jr.-I; Timing/Duration: Mar 2001 to Nov 2001, 8 months; Peak-to-Trough Contraction: Less than
1%; Nature: Liquidity. Background: Driven by collapse in stock-market bubble. (See ShadowStats
Version: Clinton-II.)
Bush Jr.-II; Obama-I; Timing/Duration: Dec 2007 to Jun 2009; 18 months, Peak-to-Trough
Contraction: 4%; Nature: Structural/Liquidity. Background: Driven by constrained consumer liquidity,
a downturn in housing and a credit-market collapse, the ―Great Recession.‖
Obama-II (Prospective); Timing/Duration: Dec 2013 to --; likely to gain recognition in next year;
Nature: Structural/Liquidity. Background: Second-dip of Great Recession.
Shadow Government Statistics — Hyperinflation 2014—Second Installment, No. 617, April 8, 2014
Copyright 2006-2014 American Business Analytics & Research, LLC, www.shadowstats.com 67
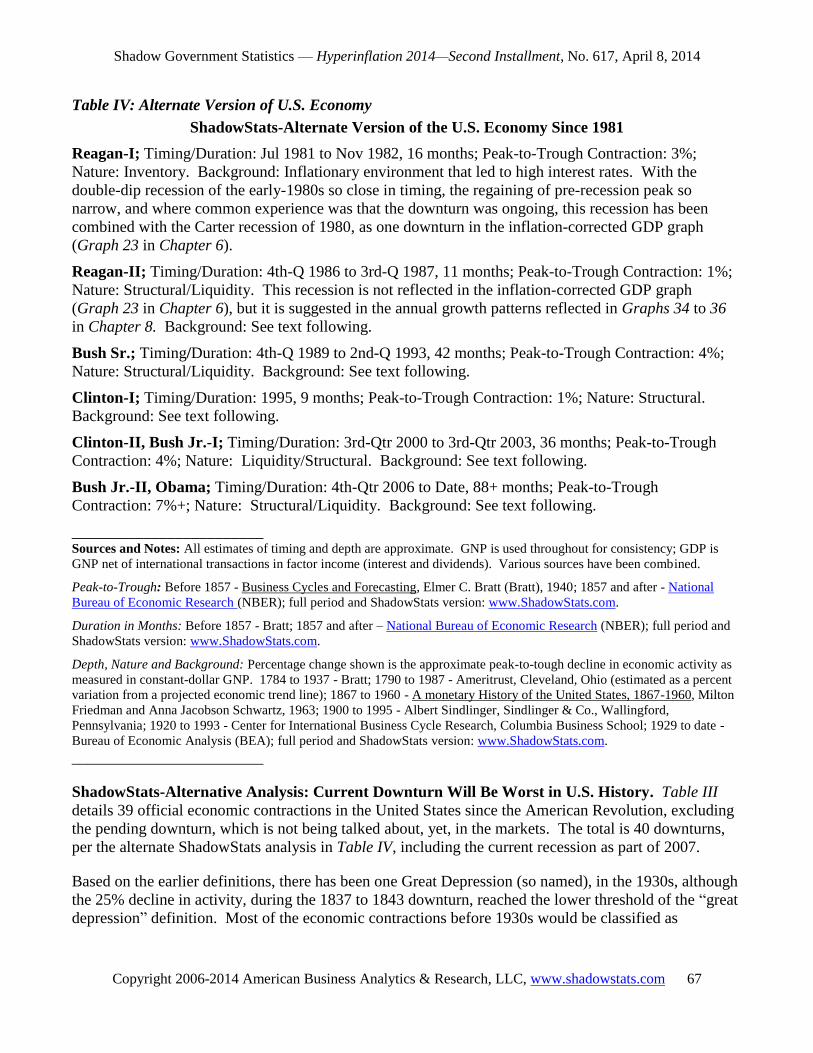
Table IV: Alternate Version of U.S. Economy
ShadowStats-Alternate Version of the U.S. Economy Since 1981
Reagan-I; Timing/Duration: Jul 1981 to Nov 1982, 16 months; Peak-to-Trough Contraction: 3%;
Nature: Inventory. Background: Inflationary environment that led to high interest rates. With the
double-dip recession of the early-1980s so close in timing, the regaining of pre-recession peak so
narrow, and where common experience was that the downturn was ongoing, this recession has been
combined with the Carter recession of 1980, as one downturn in the inflation-corrected GDP graph
(Graph 23 in Chapter 6).
Reagan-II; Timing/Duration: 4th-Q 1986 to 3rd-Q 1987, 11 months; Peak-to-Trough Contraction: 1%;
Nature: Structural/Liquidity. This recession is not reflected in the inflation-corrected GDP graph
(Graph 23 in Chapter 6), but it is suggested in the annual growth patterns reflected in Graphs 34 to 36
in Chapter 8. Background: See text following.
Bush Sr.; Timing/Duration: 4th-Q 1989 to 2nd-Q 1993, 42 months; Peak-to-Trough Contraction: 4%;
Nature: Structural/Liquidity. Background: See text following.
Clinton-I; Timing/Duration: 1995, 9 months; Peak-to-Trough Contraction: 1%; Nature: Structural.
Background: See text following.
Clinton-II, Bush Jr.-I; Timing/Duration: 3rd-Qtr 2000 to 3rd-Qtr 2003, 36 months; Peak-to-Trough
Contraction: 4%; Nature: Liquidity/Structural. Background: See text following.
Bush Jr.-II, Obama; Timing/Duration: 4th-Qtr 2006 to Date, 88+ months; Peak-to-Trough
Contraction: 7%+; Nature: Structural/Liquidity. Background: See text following.
________________________ Sources and Notes: All estimates of timing and depth are approximate. GNP is used throughout for consistency; GDP is
GNP net of international transactions in factor income (interest and dividends). Various sources have been combined.
Peak-to-Trough: Before 1857 - Business Cycles and Forecasting, Elmer C. Bratt (Bratt), 1940; 1857 and after - National
Bureau of Economic Research (NBER); full period and ShadowStats version: www.ShadowStats.com.
Duration in Months: Before 1857 - Bratt; 1857 and after – National Bureau of Economic Research (NBER); full period and
ShadowStats version: www.ShadowStats.com.
Depth, Nature and Background: Percentage change shown is the approximate peak-to-tough decline in economic activity as
measured in constant-dollar GNP. 1784 to 1937 - Bratt; 1790 to 1987 - Ameritrust, Cleveland, Ohio (estimated as a percent
variation from a projected economic trend line); 1867 to 1960 - A monetary History of the United States, 1867-1960, Milton
Friedman and Anna Jacobson Schwartz, 1963; 1900 to 1995 - Albert Sindlinger, Sindlinger & Co., Wallingford,
Pennsylvania; 1920 to 1993 - Center for International Business Cycle Research, Columbia Business School; 1929 to date -
Bureau of Economic Analysis (BEA); full period and ShadowStats version: www.ShadowStats.com. ________________________
ShadowStats-Alternative Analysis: Current Downturn Will Be Worst in U.S. History. Table III
details 39 official economic contractions in the United States since the American Revolution, excluding
the pending downturn, which is not being talked about, yet, in the markets. The total is 40 downturns,
per the alternate ShadowStats analysis in Table IV, including the current recession as part of 2007.
Based on the earlier definitions, there has been one Great Depression (so named), in the 1930s, although
the 25% decline in activity, during the 1837 to 1843 downturn, reached the lower threshold of the ―great
depression‖ definition. Most of the economic contractions before 1930s would be classified as
Shadow Government Statistics — Hyperinflation 2014—Second Installment, No. 617, April 8, 2014
Copyright 2006-2014 American Business Analytics & Research, LLC, www.shadowstats.com 68
depressions. All business downturns since World War II—as officially reported—have been recessions,
so far.
The current economic contraction is beyond halfway towards being classified as a ―depression,‖ based
on the ShadowStats definitions and GDP accounting. Depression status likely will be attained by year-
end 2014. As the Great War became World War I with the advent of World War II, so too may the
Great Depression of the 1930s become Great Depression I. When the current crisis reaches its full,
terrible potential, with an eventual hyperinflation that collapses normal commerce, it well may become
known as Great Depression II, supplanting its current nomenclature as the Great Recession. As with the
two world wars, Great Depression II would have had its roots in Great Depression I.
Structural Changes and Liquidity Problems Dominate Economic History. A review of the various
downturns since 1784 makes a strong case for the repetitive nature of history. Major economic and
financial market upheavals usually reflect a confluence of factors, often structural or liquidity-related in
nature. In the latter case, an economic downturn already was well underway before the defining panic
of a liquidity crisis. Indeed the underlying economic and liquidity problems usually were well in play
before a panic, which then would exacerbate the economic downturn, sometimes in a self-feeding cycle.
Leading up to the Great Depression, for example, the U.S. manufacturing sector had been in structural
contraction as result of the loss of production after World War I and after the completion of the Panama
Canal. The U.S. economy already was in contraction prior to the 1929 stock crash, but despite the
structural downturn in the industrial sector, the financial markets were booming, with debt excess built
upon debt excess leveraging stock prices to historic levels, with income variance at an historic high level
that would not be exceeded until 1987.
It was the liquidity implosion that followed the stock-market and financial panic, and banking collapse,
in combination with the structural change, that enabled the scope and depth of the Great Depression.
The present downturn had its roots in a structural change dating back several decades, with the current
contraction starting well in advance of the ongoing systemic-solvency and financial-market crises,
which have exacerbated the downturn. The current financial crises, in turn have their roots back in the
Great Depression.
Structural Change Tied to Trade Losses. Starting with the explosive growth in the U.S. trade deficit
in the 1970s, and the accelerating loss of the U.S. manufacturing base to offshore facilities that followed,
the U.S. economy entered a long-term structural decline that continues today and that has provided the
base for many of the U.S. economic difficulties since the 1980s (see the consumer liquidity comments
and graphs in Chapter 8).
At fault here are a variety of factors, ranging from the post-World War II success of the United States as
the world's dominant economy and dynamo for global economic activity, to trade policies of recent
decades that have been extremely detrimental to the U.S. economy and to those making a living in the
United States.
In the post-World War II era through the early-1970s, when the United States ran regular trade
surpluses, there were two markets for global manufacturers, the United States and the rest of the world.
In the late-1960s and 1970s, before beginning my economic consulting business, I was active in a family
company in the import and export trade, primarily importing chainsaws to the United States from what
Shadow Government Statistics — Hyperinflation 2014—Second Installment, No. 617, April 8, 2014
Copyright 2006-2014 American Business Analytics & Research, LLC, www.shadowstats.com 69
then was West Germany. Though overly simplified, the following comments reflect some personal
perspectives of the time.
In the days of surplus, with the exception of food producers and companies such as Boeing and IBM, too
few U.S. manufacturers ignored or did not take global markets seriously. More than adequate sales
volume could be generated at home without undertaking the trouble of learning the languages and
customs of potential foreign buyers, or having to produce low volume special products that met the
particular needs of foreign markets.
In contrast, European manufacturers had to sell beyond their borders in order to gain economic scale.
The rest of the world never did quite catch on to the U.S. consumers’ addiction to disposable products
and the concept of planned obsolescence, where automobiles, for example, became stylishly obsolete in
three years. Instead, European manufacturers often had to provide a higher quality manufactured
product for their customers than was available from U.S. manufacturers. Asian manufacturing at the
time generally was noted for its low cost as well as generally low quality.
Not only did the competitors of many U.S. manufacturers dominate sales outside the United States, but
also their often higher-quality products began to find broad markets within the United States,
irrespective of higher prices and a near-perpetual weakening of the U.S. dollar. Eventually, quality
improved for the lower cost Asian products, which also led to significant market gains in the United
States and the rest of the world.
Of course, much of the shift in U.S. manufacturing offshore resulted from careful long-term strategies
by U.S. competitors to accomplish just that. ―Long-term‖ here refers to decades, not to two-year
election cycles or quarter-to-quarter profit reporting cycles common in U.S. political or business circles.
In the late-1970s and early-1980s, China eagerly was buying up as much as it could of available
―antiquated‖ labor-intensive plant and equipment in the United States. China had the labor needed for it.
In a tragic 1989 explosion, the USS Iowa lost one of its large guns. At that time, the U.S. no longer had
the machining capabilities to replace the gun, but China did.
As U.S. manufacturers began losing domestic market share to imported goods, a number sought lower-
cost production offshore. Such was intensified by the effects of free-trade agreements that tended to
shift manufacturing to under-employed, lower cost labor markets, such as Mexico. These shifts have
been exacerbated up to present.
The Problem with “Free Trade.” Aside from issues that ―free trade‖ agreements entered into by the
United States have been anything but, there is a basic flaw in the theory as to the benefits of free trade in
today's real-world economies.
Assume two economies are at full employment, it is argued, and that there is no trade between two
countries, where the first nation produces product A more efficiently than the other, and where the
second country is a more efficient producer of product B. If free trade is opened between the countries,
then the first country will tend to end up making all the product A and the other country all the product
B. In this simple system, open trade would result in more total production of A and B than existed
before, with everyone being better off.

Shadow Government Statistics — Hyperinflation 2014—Second Installment, No. 617, April 8, 2014
Copyright 2006-2014 American Business Analytics & Research, LLC, www.shadowstats.com 70
In the real world, however, there is a problem with the underlying assumption that the involved
economies are at full employment. Such rarely is the case, and it was not the case when the U.S.,
Canada and Mexico entered into the NAFTA agreement. When the involved trading partners do not
have full employment, the advantage and the production tends to move to the low-cost producer.
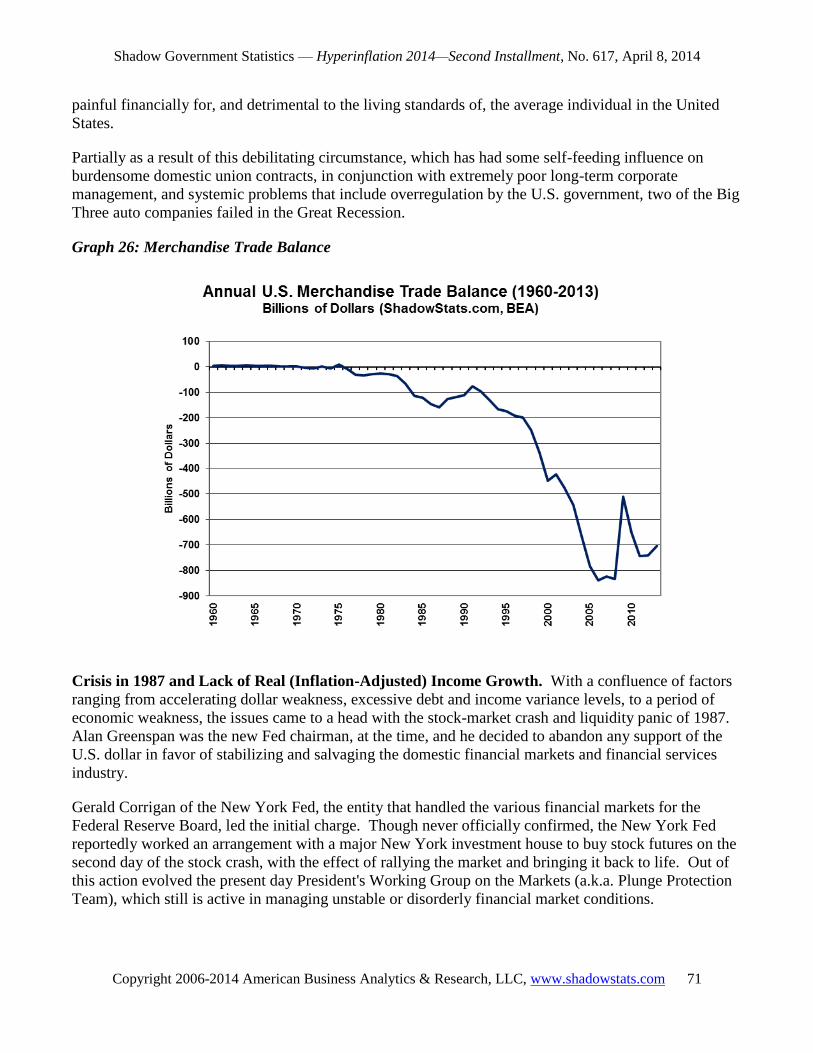
As to NAFTA, the U.S. started the treaty in 1994 with roughly balanced trade, a small surplus with
Mexico and a small deficit with Canada. For the calendar year 2013 deficit with the two trading
partners was $86.0 billion. The total merchandise trade deficit for 2013 reflected an ongoing loss in
excess of 10 million manufacturing jobs, versus a system that otherwise had a neutral trade balance.
Table V: U.S. Merchandise Trade Deficit by Country
U.S. Merchandise Trade Deficit by Country
Top Six Deficits in 2013 Versus 2012
Billions of U.S. Dollars
Sources: ShadowStats, Census Bureau
Country or
Rank Trade Area 2013 2012
Total 688.7 729.6
1 China 318.4 315.1
2 Japan 73.4 76.4
3 Germany 67.2 59.9
Euro Area 104.0 100.0
4 Mexico 54.3 61.6
6 Canada 31.7 31.4
NAFTA 86.0 93.0
5 Saudi Arabia 32.8 37.7
OPEC 68.1 99.0
Not so coincidentally, 1994 was the year the Clinton Administration's Bureau of Labor Statistics defined
away millions of ―discouraged‖ workers: unemployed individuals who had given up looking for work
because there were no jobs to be had. Previously used in broader unemployment rates measures, the
discouraged worker category had been unlimited in terms of how long a person had been discouraged.
In 1994, the category was restricted to only those who had been ―discouraged‖ for less than a year.
Accounting for the earlier, broader historic measure, the ShadowStats Alternate Unemployment
Measure (see Graphs 38 and 39 in Chapter 9) held at 23.2% in March 2014, versus 6.7% in the headline
U.3 unemployment rate published by the Bureau of Labor Statistics, and the broader U.6 measure at
12.7%, which includes the narrower, short-term discouraged-worker category.
The effect of the ―free trade‖ policies has been to redistribute the productive wealth of the United States
to the rest of the world. While this may be a happy circumstance for the rest of the world, it is extremely
Shadow Government Statistics — Hyperinflation 2014—Second Installment, No. 617, April 8, 2014
Copyright 2006-2014 American Business Analytics & Research, LLC, www.shadowstats.com 71
painful financially for, and detrimental to the living standards of, the average individual in the United
States.
Partially as a result of this debilitating circumstance, which has had some self-feeding influence on
burdensome domestic union contracts, in conjunction with extremely poor long-term corporate
management, and systemic problems that include overregulation by the U.S. government, two of the Big
Three auto companies failed in the Great Recession.
Graph 26: Merchandise Trade Balance
Crisis in 1987 and Lack of Real (Inflation-Adjusted) Income Growth. With a confluence of factors
ranging from accelerating dollar weakness, excessive debt and income variance levels, to a period of
economic weakness, the issues came to a head with the stock-market crash and liquidity panic of 1987.
Alan Greenspan was the new Fed chairman, at the time, and he decided to abandon any support of the
U.S. dollar in favor of stabilizing and salvaging the domestic financial markets and financial services
industry.
Gerald Corrigan of the New York Fed, the entity that handled the various financial markets for the
Federal Reserve Board, led the initial charge. Though never officially confirmed, the New York Fed
reportedly worked an arrangement with a major New York investment house to buy stock futures on the
second day of the stock crash, with the effect of rallying the market and bringing it back to life. Out of
this action evolved the present day President's Working Group on the Markets (a.k.a. Plunge Protection
Team), which still is active in managing unstable or disorderly financial market conditions.

Shadow Government Statistics — Hyperinflation 2014—Second Installment, No. 617, April 8, 2014
Copyright 2006-2014 American Business Analytics & Research, LLC, www.shadowstats.com 72
The Fed did everything it could to forestall a further day of reckoning that loomed because of ever-
increasing trade and fiscal imbalances, along with an increasing dependence on foreign capital for the
liquidity of the U.S. markets. Due to Greenspan papering over these issues for two decades, the basic
problems intensified, remaining at uncontainable levels. These issues now have collapsed the basic
stability of the U.S. financial system and threaten the very existence of the U.S. dollar as the world’s
reserve currency.
Graph 27: Average Weekly Earnings (1967 Dollars)—CPI-W versus ShadowStats Alternate
As the structural economic changes have intensified, and what had been higher-paying production jobs
disappeared, the average U.S. household has found it increasingly difficult to make ends meet, as
discussed and graphed in Chapter 8. Real average weekly earnings today (government numbers using
CPI-W) remain well below where they were in 1970 (Graph 27, preceding). Even as households moved
from one-worker to two-or-more-worker families, and from one to two jobs per worker, the average
household still could not stay ahead of inflation. Deteriorating real median household incomes in recent
years (using government inflation numbers) has continued, falling below levels seen in the late-1960s,
early-1970s, as seen in the government's annual poverty report (Graph 30 in Chapter 8) and in annual
income data reported by the Internal Revenue Service.
The difference between growth in income and growth in consumption was made up in debt expansion,
as directly fostered by Alan Greenspan's policies. Unconstrained debt growth, however, ultimately was
and is unsustainable.
Shadow Government Statistics — Hyperinflation 2014—Second Installment, No. 617, April 8, 2014
Copyright 2006-2014 American Business Analytics & Research, LLC, www.shadowstats.com 73
Without sustained growth in inflation-adjusted income, there cannot be sustained economic growth.
Aware of that, Greenspan helped to fuel a stock-market bubble, which had the short-lived result of
fueling wealth-effect consumption. When that bubble burst and helped to trigger the 2000 recession, he
tried the same gimmick with home prices. Such enabled increased home equity lending, but the bubble
burst there, and such helped to bring the problems with mortgage backed securities to the surface, which
exacerbated the recent plunge in economic activity.
Great Depression Liquidity Solutions Led to Current Liquidity Problems. As discussed previously
in Chapter 3 of the First Installment, when the U.S. banking system collapsed in the early 1930s, the
money supply followed, and that condition helped the depression of the time deteriorate into a
deflationary great depression. The gold standard of the day acted as a regulator of money supply and
prevented the extreme government spending that President Franklin Roosevelt hoped to use as a tool to
counter the depression. Such was a factor in Roosevelt’s abandoning the domestic gold backing of the
U.S. dollar and basing the U.S. financial system on a fiat currency and what I call the ―debt standard,‖
using the full faith and credit of the U.S. government to pay its obligations with money that it created.
It took twelve administrations following Roosevelt to push the debt standard to its limits, eventually
taking on excessive obligations the U.S. government knew it never could honor. In the private sector,
debt was leveraged upon debt in order to help sustain fundamentally unsustainable economic growth. It
was the ultimate failure of the debt standard when the economy and markets collapsed in 2008. There is
nothing beyond the debt standard that can be used to revitalize the system, despite Administration and
Fed hype to the contrary. The long-delayed day of reckoning is near.
Shadow Government Statistics — Hyperinflation 2014—Second Installment, No. 617, April 8, 2014
Copyright 2006-2014 American Business Analytics & Research, LLC, www.shadowstats.com 74
Chapter 8—Underlying Economic Fundamentals Show Renewed Downturn
Structural Liquidity Issues in the Current Numbers.
Before getting into the inflation-related distortions, or lack of same, in the headline popular economic
numbers, as discussed in Chapter 9, it is worth considering headline economic data that explain why the
economy has not recovered and cannot recover, at present, and the data that are signaling an imminent
renewed downturn in economic activity.
U.S. consumer liquidity is structurally impaired. Not only do consumers lack inflation-adjusted, or real
income growth, they also lack the ability and willingness to offset their shortfall in income with
meaningful growth in debt. Where personal consumption accounts for 68% of the GDP, the U.S.
economy cannot grow meaningfully until structurally-impaired real household income and liquidity
fundamentally turn around.
The U.S. economy is in a deepening structural change that has resulted from U.S. trade, social and
regulatory policies driving a goodly portion of the U.S. manufacturing and technology base offshore, as
discussed in the previous chapter. As a result, a large number of related, high paying jobs have
disappeared for U.S. workers.
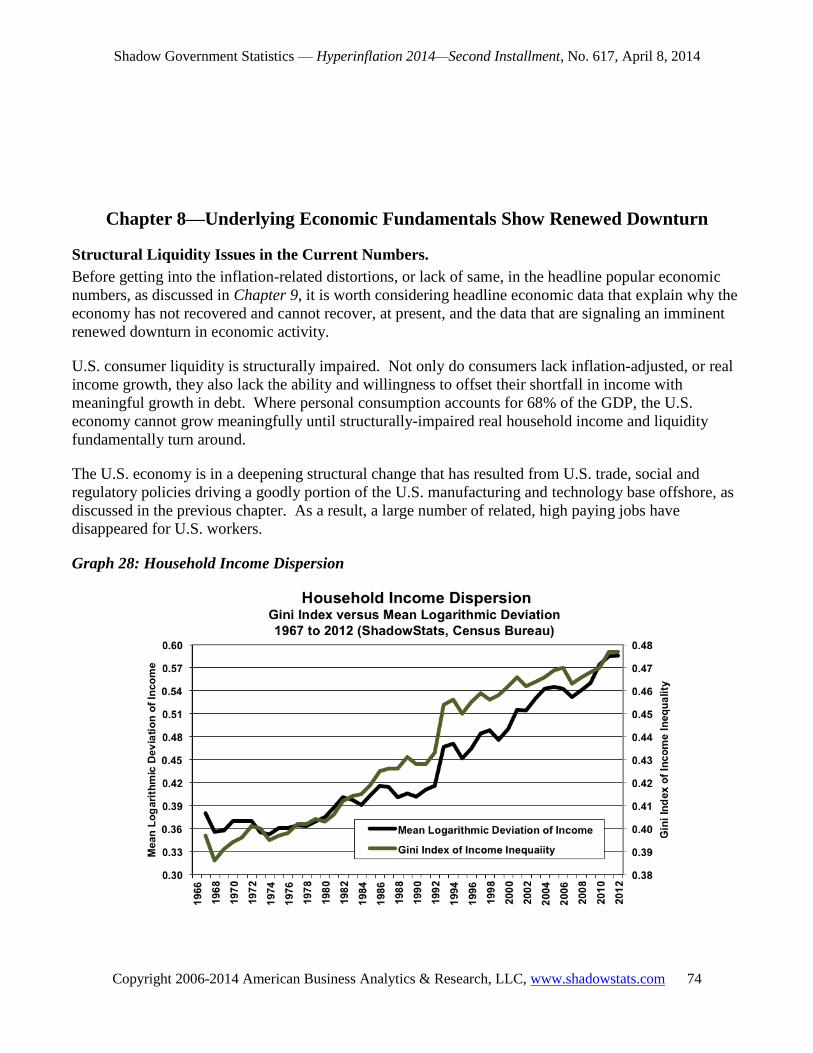
Graph 28: Household Income Dispersion
Shadow Government Statistics — Hyperinflation 2014—Second Installment, No. 617, April 8, 2014
Copyright 2006-2014 American Business Analytics & Research, LLC, www.shadowstats.com 75
The gradual deterioration in inflation-adjusted wages and household income has resulted in a record
level of the variance or dispersion in household income, as shown in Graph 28, and that has negative
longer term economic implications. Variance in income is low when the distribution of income levels is
heavily concentrated in the middle, and it is high when more of the income distribution is pushed into
the extremes of high- and low-income levels, with a weaker middle-income range.
A person earning $100,000,000 per year is not going to buy that many more automobiles than someone
earning $100,000 per year. The stronger the middle class is, generally the stronger will be consumption
and the economy.
Historically, extremes in income variance have been followed by financial panics and economic
depressions, which then tend to redistribute income towards the middle. Income variance today is
higher than it was coming into 1929 and 1987, and it is nearly double that of any other ―advanced‖
economy. At a near-term peak in 2006, the measure dipped as systemic crises broke in 2007. Yet, U.S.
income dispersion moved higher again, into the most-recent reporting of 2012, at or near historic highs.
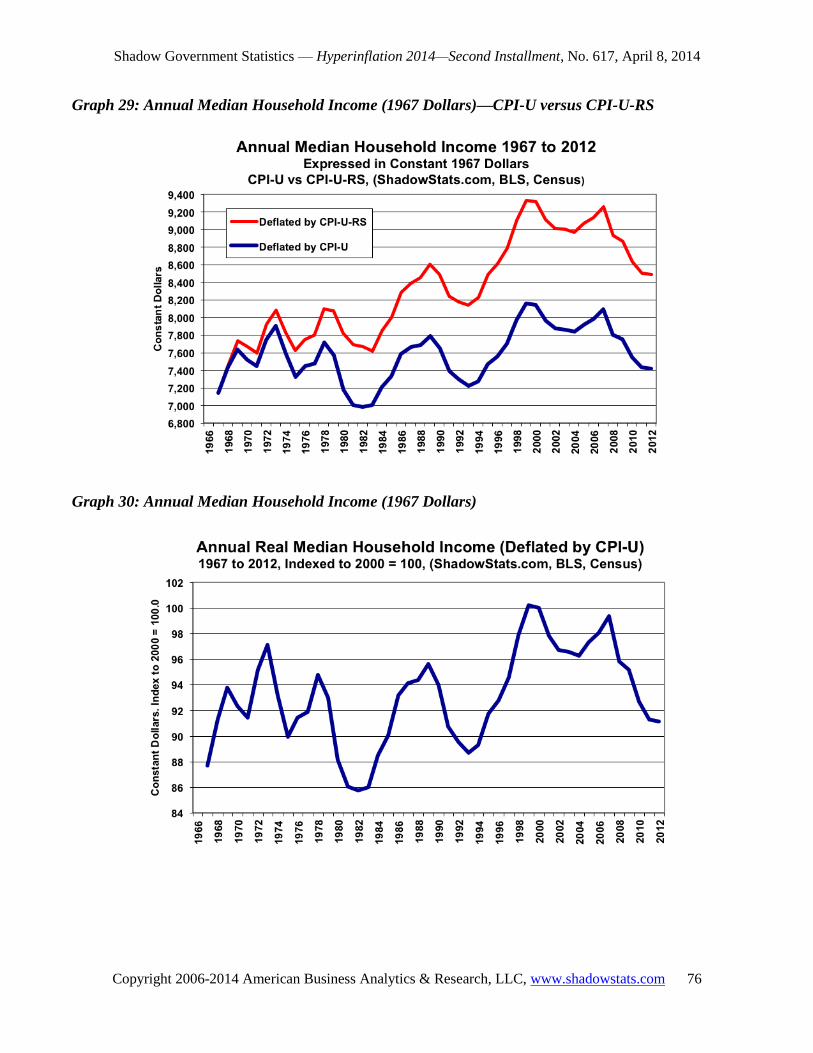
Graphs 29 to 31 show various measures that reflect officially-reported weakness in inflation-adjusted
income. Graph 29 reflects real median (the middle measure instead of average) U.S. household income
over the years. The bottom dark-blue line (also plotted individually in Graph 30) shows income
deflated by the regular CPI-U, a measure somewhat broader than the CPI-W used in the wage plot in
Graph 27 (Chapter 7). Those inflation-adjusted numbers show that median household income never
recovered its pre-2001 recession peak and stood below its level of 1969, as of 2012. Even deflated by
the CPI-U-RS (current methods) used in Census Bureau reporting—discussed below—the pre-2001
recession peak also has not been recovered. The BLS uses the CPI-U or CPI-W for deflating its official
income series; the Census Bureau has been playing games with the CPI-U-RS. I know no other use of
the ―RS‖ series in major economic reporting.
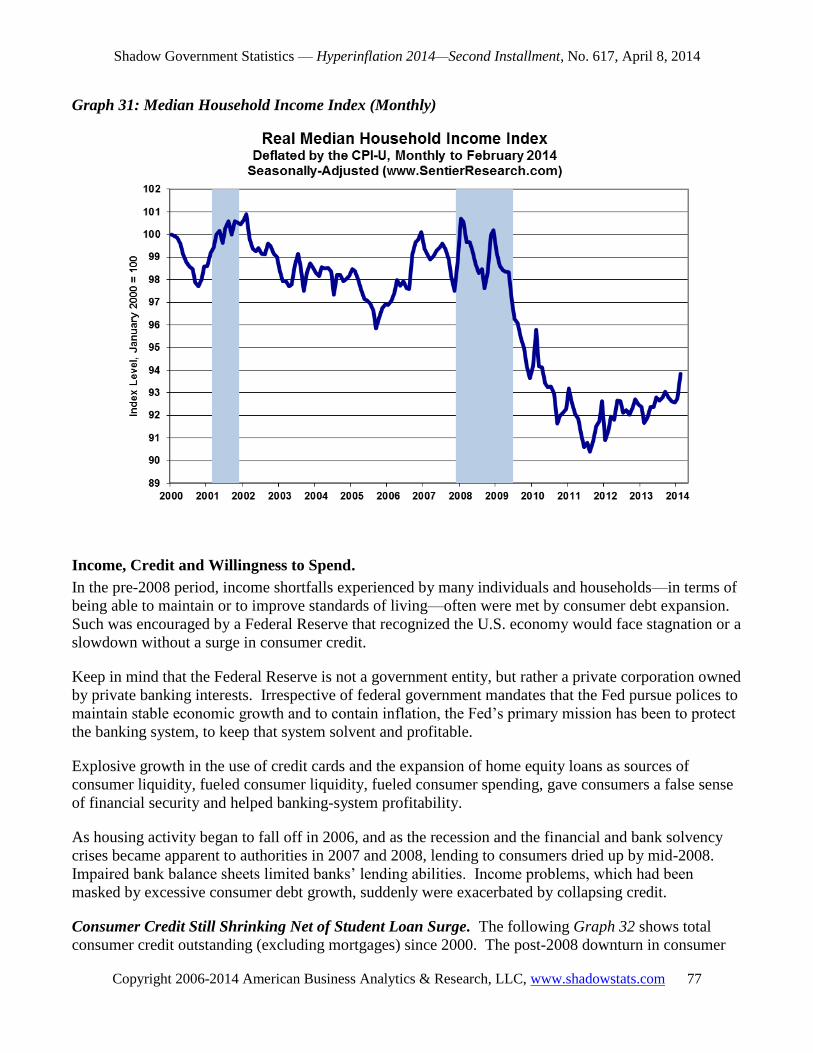
Graph 31 reflects the monthly series on real median household income, as calculated and published by
www.SentierResearch.com. The series is a seasonally-adjusted monthly index, deflated by the CPI-U.
The income index plunged through 2008 into 2011, and it has been bottom-bouncing near its cycle low
ever since. There is nothing here to support the concept of, let alone the possibility of an economic
recovery.
The broad point on inflation-adjusted U.S. consumer income is that it is inadequate to sustain growing,
inflation-adjusted economic activity. In the absence of income growth, debt expansion can act as a
short-term prop for the economy, but that is not available at present. The system is in the throes of a
solvency crisis, with banking system solvency and lending still impaired, with the consumer in an
unprecedented liquidity squeeze, constrained by shrinking income and by limited credit.
Shadow Government Statistics — Hyperinflation 2014—Second Installment, No. 617, April 8, 2014
Copyright 2006-2014 American Business Analytics & Research, LLC, www.shadowstats.com 76
Graph 29: Annual Median Household Income (1967 Dollars)—CPI-U versus CPI-U-RS
Graph 30: Annual Median Household Income (1967 Dollars)
Shadow Government Statistics — Hyperinflation 2014—Second Installment, No. 617, April 8, 2014
Copyright 2006-2014 American Business Analytics & Research, LLC, www.shadowstats.com 77
Graph 31: Median Household Income Index (Monthly)
Income, Credit and Willingness to Spend.
In the pre-2008 period, income shortfalls experienced by many individuals and households—in terms of
being able to maintain or to improve standards of living—often were met by consumer debt expansion.
Such was encouraged by a Federal Reserve that recognized the U.S. economy would face stagnation or a
slowdown without a surge in consumer credit.
Keep in mind that the Federal Reserve is not a government entity, but rather a private corporation owned
by private banking interests. Irrespective of federal government mandates that the Fed pursue polices to
maintain stable economic growth and to contain inflation, the Fed’s primary mission has been to protect
the banking system, to keep that system solvent and profitable.
Explosive growth in the use of credit cards and the expansion of home equity loans as sources of
consumer liquidity, fueled consumer liquidity, fueled consumer spending, gave consumers a false sense
of financial security and helped banking-system profitability.
As housing activity began to fall off in 2006, and as the recession and the financial and bank solvency
crises became apparent to authorities in 2007 and 2008, lending to consumers dried up by mid-2008.
Impaired bank balance sheets limited banks’ lending abilities. Income problems, which had been
masked by excessive consumer debt growth, suddenly were exacerbated by collapsing credit.
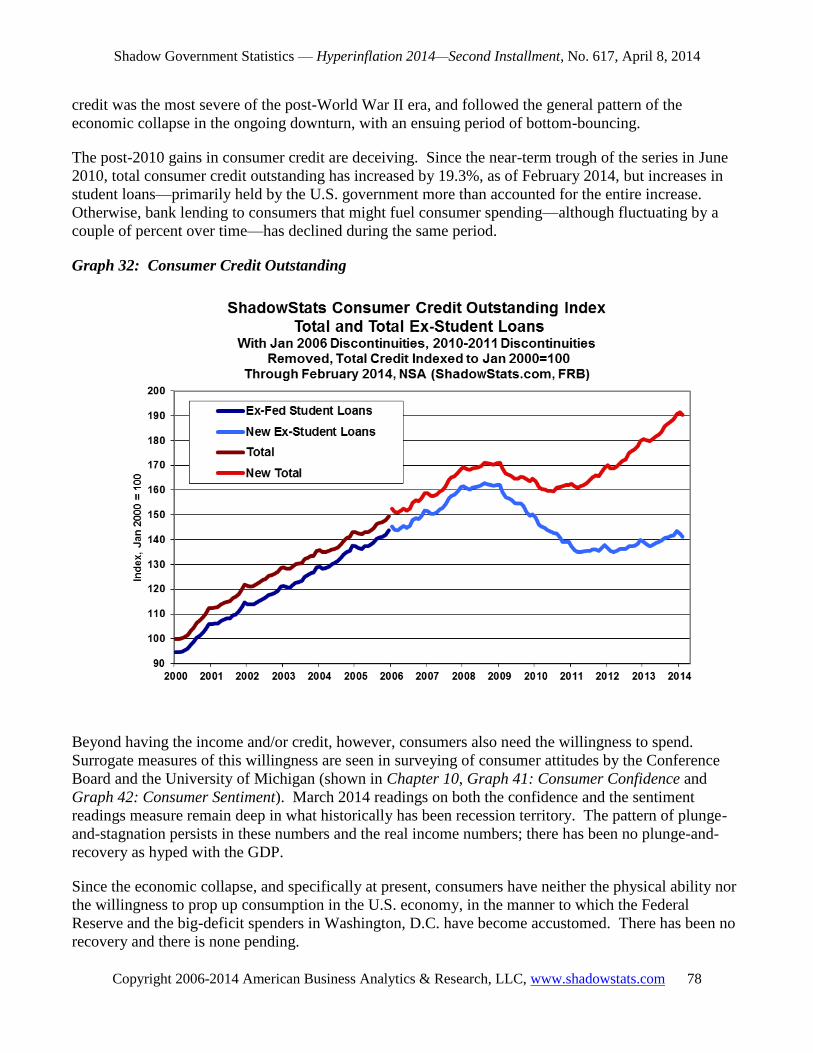
Consumer Credit Still Shrinking Net of Student Loan Surge. The following Graph 32 shows total
consumer credit outstanding (excluding mortgages) since 2000. The post-2008 downturn in consumer
Shadow Government Statistics — Hyperinflation 2014—Second Installment, No. 617, April 8, 2014
Copyright 2006-2014 American Business Analytics & Research, LLC, www.shadowstats.com 78
credit was the most severe of the post-World War II era, and followed the general pattern of the
economic collapse in the ongoing downturn, with an ensuing period of bottom-bouncing.
The post-2010 gains in consumer credit are deceiving. Since the near-term trough of the series in June
2010, total consumer credit outstanding has increased by 19.3%, as of February 2014, but increases in
student loans—primarily held by the U.S. government more than accounted for the entire increase.
Otherwise, bank lending to consumers that might fuel consumer spending—although fluctuating by a
couple of percent over time—has declined during the same period.
Graph 32: Consumer Credit Outstanding
Beyond having the income and/or credit, however, consumers also need the willingness to spend.
Surrogate measures of this willingness are seen in surveying of consumer attitudes by the Conference
Board and the University of Michigan (shown in Chapter 10, Graph 41: Consumer Confidence and
Graph 42: Consumer Sentiment). March 2014 readings on both the confidence and the sentiment
readings measure remain deep in what historically has been recession territory. The pattern of plunge-
and-stagnation persists in these numbers and the real income numbers; there has been no plunge-and-
recovery as hyped with the GDP.
Since the economic collapse, and specifically at present, consumers have neither the physical ability nor
the willingness to prop up consumption in the U.S. economy, in the manner to which the Federal
Reserve and the big-deficit spenders in Washington, D.C. have become accustomed. There has been no
recovery and there is none pending.

Shadow Government Statistics — Hyperinflation 2014—Second Installment, No. 617, April 8, 2014
Copyright 2006-2014 American Business Analytics & Research, LLC, www.shadowstats.com 79
Neither the federal government nor the Federal Reserve can address easily the fundamental structural
problems tied to consumer liquidity. Stimulus efforts have been limited to one-time or otherwise short-
lived efforts to provide temporary boosts to consumer disposable income. Until income growth picks up
sustainably relative to inflation, and/or credit is flowing freely enough to boost willing consumption,
there is no chance for sustained economic growth or economic recovery in the United States.
Already Down, Economy Continues to Bottom Bounce and Slides Anew.
Near-Term Economic Activity. As discussed in the regular ShadowStats Commentaries, the U.S.
economy remains in a structural recession/depression that is going to get a great deal worse. Due to the
NBER calling a formal end to the 2007 recession as of June 2009, and the formal recovery that has
followed in headline GDP reporting, the ongoing difficulties and renewed downturn here likely will be
recognized as a double- or multiple-dip downturn. As was discussed in the prior chapter on historical
economic perspective, the contraction in business activity so far in the extreme downturn since
2006/2007 is the most severe and protracted since the first down-leg of the Great Depression in the
1930s. As the hyperinflation breaks and the regular domestic commerce become severely impaired, the
downturn likely will evolve into the worst great depression in U.S. history.
Graph 33: Real M3 versus Formal Recessions
Shown in Graph 33, inflation-adjusted, year-to-year change in broad money supply (M3) historically
has generated a reliable signal in advance of recessions, or, in the case where a recession already is
underway (as in the 1973 and 2007 recessions), a pending intensification of the downturn. The lead-
time usually is six-to-nine months. Some recessions start without a money contraction, and upturns in
money do not always lead economic upturns, but whenever real, broad systemic liquidity is in
contraction, the economy always will follow. The downturn signal is generated when the inflation-
Shadow Government Statistics — Hyperinflation 2014—Second Installment, No. 617, April 8, 2014
Copyright 2006-2014 American Business Analytics & Research, LLC, www.shadowstats.com 80
adjusted annual money growth (which adjusted for the velocity of money is the theoretical equivalent of
real GDP) first turns negative.
In the current circumstance, a full downside signal last was generated in December 2009. M3
subsequently rebounded, but again generally has turned lower, although not yet into the negative-growth
signal area. Where the reliable M3 signal only is on the downside, what appears to be reflected here is
an unprecedented period of economic non-recovery, a protracted period of economic stagnation or
bottom-bouncing that once again is set for a renewed decline.
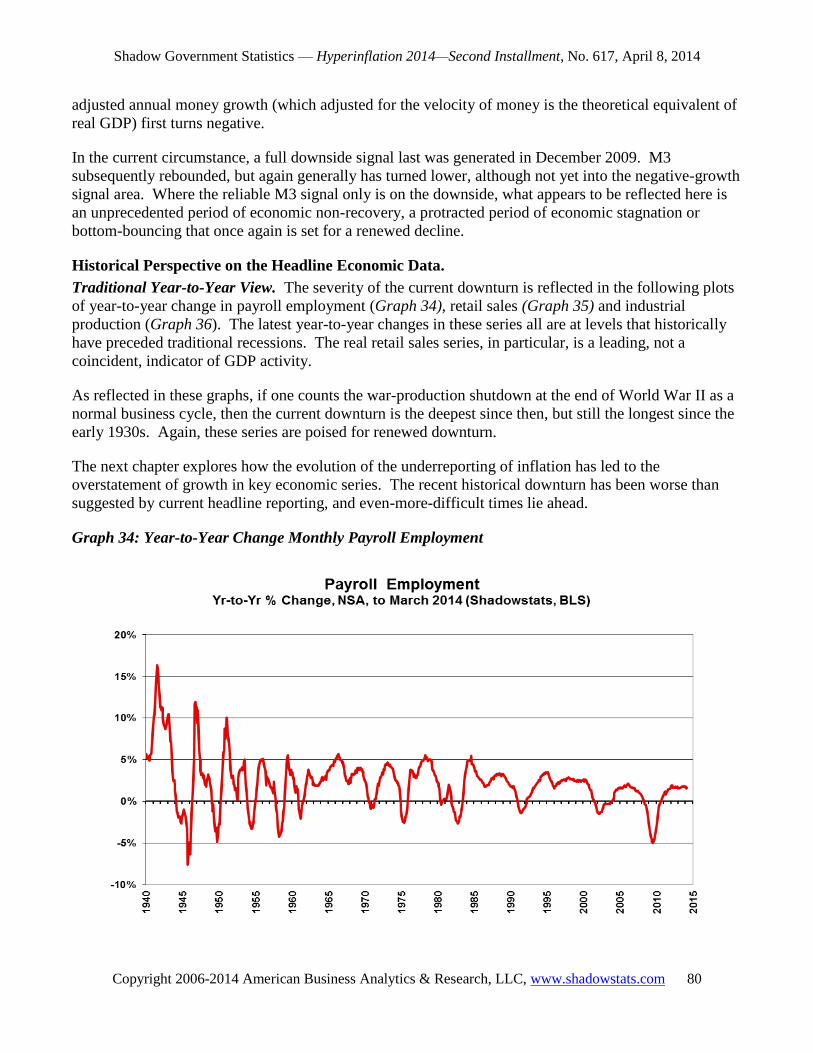
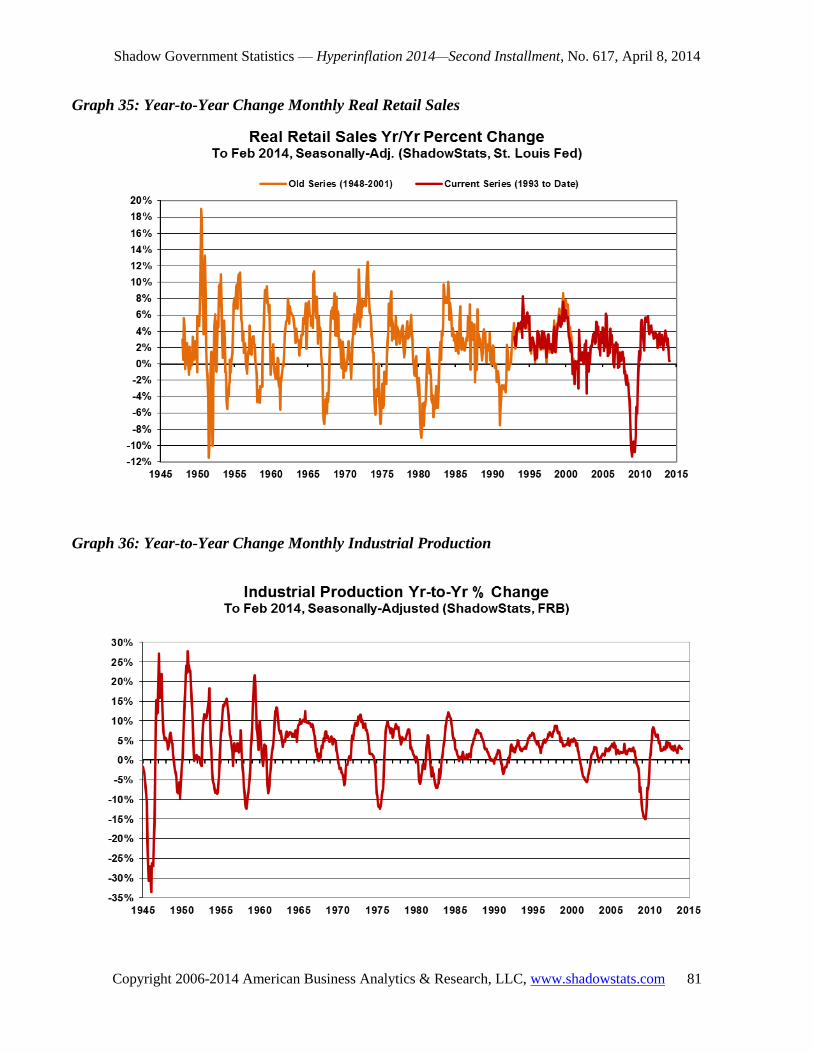
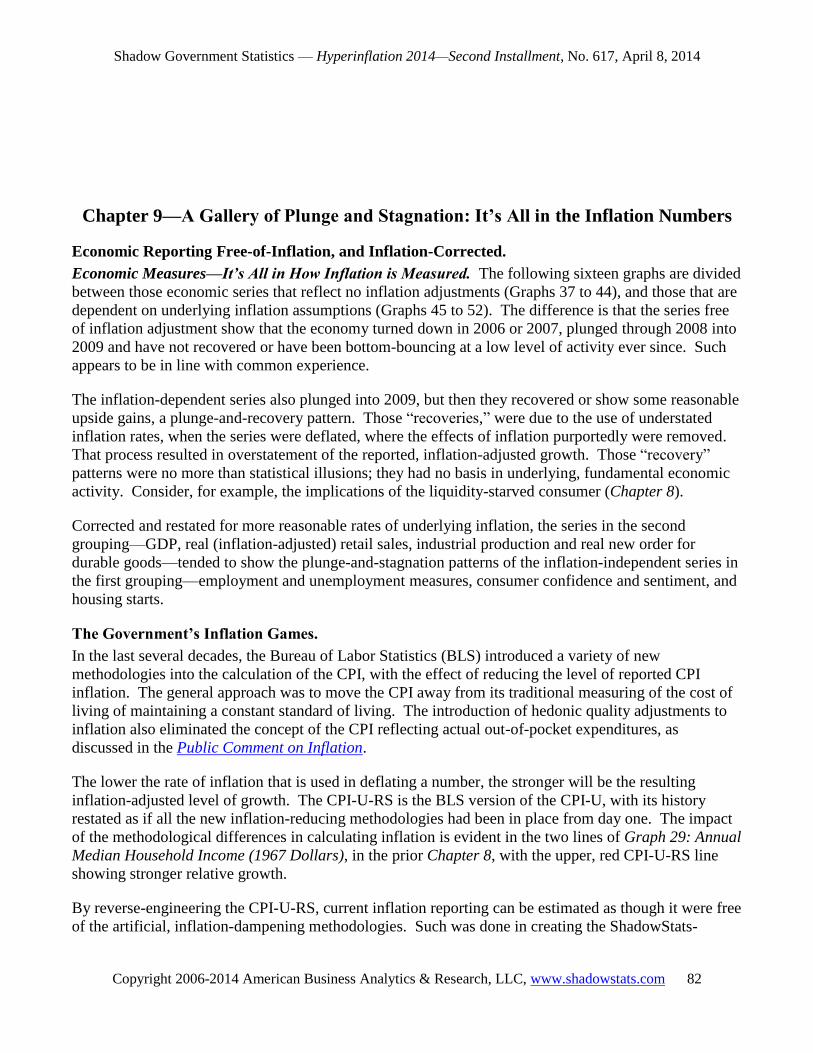
Historical Perspective on the Headline Economic Data.
Traditional Year-to-Year View. The severity of the current downturn is reflected in the following plots
of year-to-year change in payroll employment (Graph 34), retail sales (Graph 35) and industrial
production (Graph 36). The latest year-to-year changes in these series all are at levels that historically
have preceded traditional recessions. The real retail sales series, in particular, is a leading, not a
coincident, indicator of GDP activity.
As reflected in these graphs, if one counts the war-production shutdown at the end of World War II as a
normal business cycle, then the current downturn is the deepest since then, but still the longest since the
early 1930s. Again, these series are poised for renewed downturn.
The next chapter explores how the evolution of the underreporting of inflation has led to the
overstatement of growth in key economic series. The recent historical downturn has been worse than
suggested by current headline reporting, and even-more-difficult times lie ahead.
Graph 34: Year-to-Year Change Monthly Payroll Employment
Shadow Government Statistics — Hyperinflation 2014—Second Installment, No. 617, April 8, 2014
Copyright 2006-2014 American Business Analytics & Research, LLC, www.shadowstats.com 81
Graph 35: Year-to-Year Change Monthly Real Retail Sales
Graph 36: Year-to-Year Change Monthly Industrial Production
Shadow Government Statistics — Hyperinflation 2014—Second Installment, No. 617, April 8, 2014
Copyright 2006-2014 American Business Analytics & Research, LLC, www.shadowstats.com 82
Chapter 9—A Gallery of Plunge and Stagnation: It’s All in the Inflation Numbers
Economic Reporting Free-of-Inflation, and Inflation-Corrected.
Economic Measures—It’s All in How Inflation is Measured. The following sixteen graphs are divided
between those economic series that reflect no inflation adjustments (Graphs 37 to 44), and those that are
dependent on underlying inflation assumptions (Graphs 45 to 52). The difference is that the series free
of inflation adjustment show that the economy turned down in 2006 or 2007, plunged through 2008 into
2009 and have not recovered or have been bottom-bouncing at a low level of activity ever since. Such
appears to be in line with common experience.
The inflation-dependent series also plunged into 2009, but then they recovered or show some reasonable
upside gains, a plunge-and-recovery pattern. Those ―recoveries,‖ were due to the use of understated
inflation rates, when the series were deflated, where the effects of inflation purportedly were removed.
That process resulted in overstatement of the reported, inflation-adjusted growth. Those ―recovery‖
patterns were no more than statistical illusions; they had no basis in underlying, fundamental economic
activity. Consider, for example, the implications of the liquidity-starved consumer (Chapter 8).
Corrected and restated for more reasonable rates of underlying inflation, the series in the second
grouping—GDP, real (inflation-adjusted) retail sales, industrial production and real new order for
durable goods—tended to show the plunge-and-stagnation patterns of the inflation-independent series in
the first grouping—employment and unemployment measures, consumer confidence and sentiment, and
housing starts.
The Government’s Inflation Games.
In the last several decades, the Bureau of Labor Statistics (BLS) introduced a variety of new
methodologies into the calculation of the CPI, with the effect of reducing the level of reported CPI
inflation. The general approach was to move the CPI away from its traditional measuring of the cost of
living of maintaining a constant standard of living. The introduction of hedonic quality adjustments to
inflation also eliminated the concept of the CPI reflecting actual out-of-pocket expenditures, as
discussed in the Public Comment on Inflation.
The lower the rate of inflation that is used in deflating a number, the stronger will be the resulting
inflation-adjusted level of growth. The CPI-U-RS is the BLS version of the CPI-U, with its history
restated as if all the new inflation-reducing methodologies had been in place from day one. The impact
of the methodological differences in calculating inflation is evident in the two lines of Graph 29: Annual
Median Household Income (1967 Dollars), in the prior Chapter 8, with the upper, red CPI-U-RS line
showing stronger relative growth.
By reverse-engineering the CPI-U-RS, current inflation reporting can be estimated as though it were free
of the artificial, inflation-dampening methodologies. Such was done in creating the ShadowStats-

Shadow Government Statistics — Hyperinflation 2014—Second Installment, No. 617, April 8, 2014
Copyright 2006-2014 American Business Analytics & Research, LLC, www.shadowstats.com 83
Alternate Consumer Inflation Measure (based on 1980 methodologies, and also based on 1990
methodologies), as plotted in Graphs 1 and 2, in the Definitions section of the First Installment.
The Economy Has Yet to Recover.
Is the U.S. economy booming anew, or is it still bottom-bouncing in a deep contraction that has
extended to 88 months? The differences in published data that support one or the other extreme
circumstance are tied to how the government handles inflation estimates, with the more-troubled
economy the likely reality. In line with common experience, I contend that the U.S. economy has been
in trouble since at least 2000, when it entered a recession that dragged into 2003. Business activity then
began collapsing again in 2006, hit a bottom in 2009 and has been bottom-bouncing since (see Graphs
23 and 46). The outlook for the U.S. economy remains bleak, with continued bottom-bouncing
deteriorating into a renewed downturn. Using real GDP data corrected for the government’s
understatement of inflation used in deflating the series, there have been 88 months of recession so far, in
the current downturn, which is more than double the 43 months officially estimated for the first down-
leg of the Great Depression.
The happier, official version of U.S. business activity is that the economy went through a shallow
recession between March 2001 and November 2001, with a much deeper downturn beginning in
December 2007 and ending in June 2009. Since then, U.S. economic activity has recovered fully and
now comfortably exceeds pre-2007 recession levels.
As discussed in Chapter 7 and Chapter 8, the chances are nil that the U.S. economy is in full recovery,
following its plunge in activity through 2008 into 2009. Following are the details of the various series.
Inflation-Independent Series.
Payroll Employment. Consider Graph 37 of payroll employment. Where employment traditionally has
been considered a coincident indicator of economic activity, payroll levels suggest the 2001 recession
ended in 2003, not 2001, and that the 2007 recession still is not over. Although there has been an
official rebound in payroll activity taking it to near its pre-recession high, part of that is due to a
gimmicked benchmark revision, as discussed in Commentary No. 616, but the move meaningfully
lagged the GDP activity.
Unemployment and Related Measures. As discussed in the Overview and Executive Summary, Chapter
7 and Commentary No. 616, the ShadowStats-Alternate Unemployment Measure (Graph 38) remains
close to the series high, reflecting no economic recovery. The inverted plot of the ShadowStats measure
(Graph 39) and a highly correlated plot of the employment-to-population ratio (Graph 40) both reflect a
pattern of plunge-and-stagnation.
Consumer Confidence and Sentiment. Graph 41 of consumer confidence and Graph 42 of consumer
sentiment both reflect the 2001 recession crashing into 2003, with no full recovery. The current
downturn begins before the end of 2007, and basically has been bottom-bouncing at ongoing, historic
recession levels. The pattern here, again, is one of plunge-and-stagnation.
Housing Starts. Graphs 43 and 44 show plunging activity starting in 2006 and running into 2009, with
bottom-bouncing in the post-plunge era, again, plunge-and-stagnation.
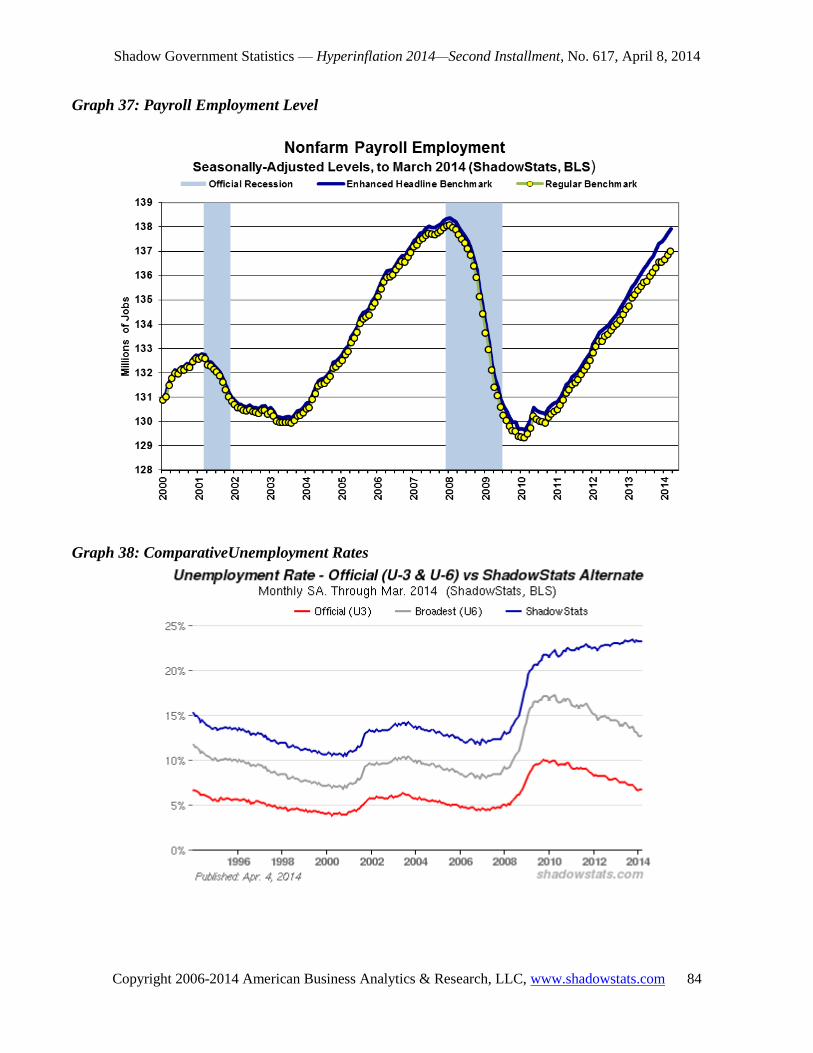
Shadow Government Statistics — Hyperinflation 2014—Second Installment, No. 617, April 8, 2014
Copyright 2006-2014 American Business Analytics & Research, LLC, www.shadowstats.com 84
Graph 37: Payroll Employment Level
Graph 38: ComparativeUnemployment Rates

Shadow Government Statistics — Hyperinflation 2014—Second Installment, No. 617, April 8, 2014
Copyright 2006-2014 American Business Analytics & Research, LLC, www.shadowstats.com 85
Graph 39: Inverted ShadowStats Alternate Unemployment
Graph 40: Employment-to-Population Ratio

Shadow Government Statistics — Hyperinflation 2014—Second Installment, No. 617, April 8, 2014
Copyright 2006-2014 American Business Analytics & Research, LLC, www.shadowstats.com 86
Graph 41: Consumer Confidence
Graph 42: Consumer Sentiment
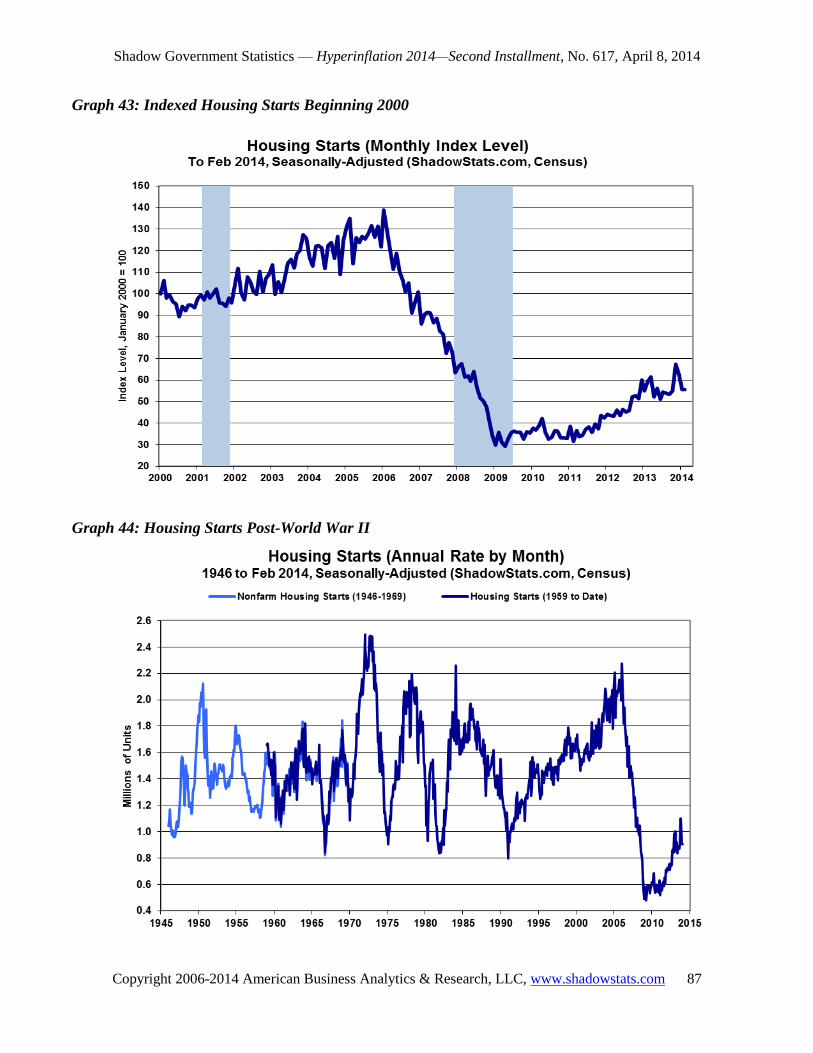
Shadow Government Statistics — Hyperinflation 2014—Second Installment, No. 617, April 8, 2014
Copyright 2006-2014 American Business Analytics & Research, LLC, www.shadowstats.com 87
Graph 43: Indexed Housing Starts Beginning 2000
Graph 44: Housing Starts Post-World War II
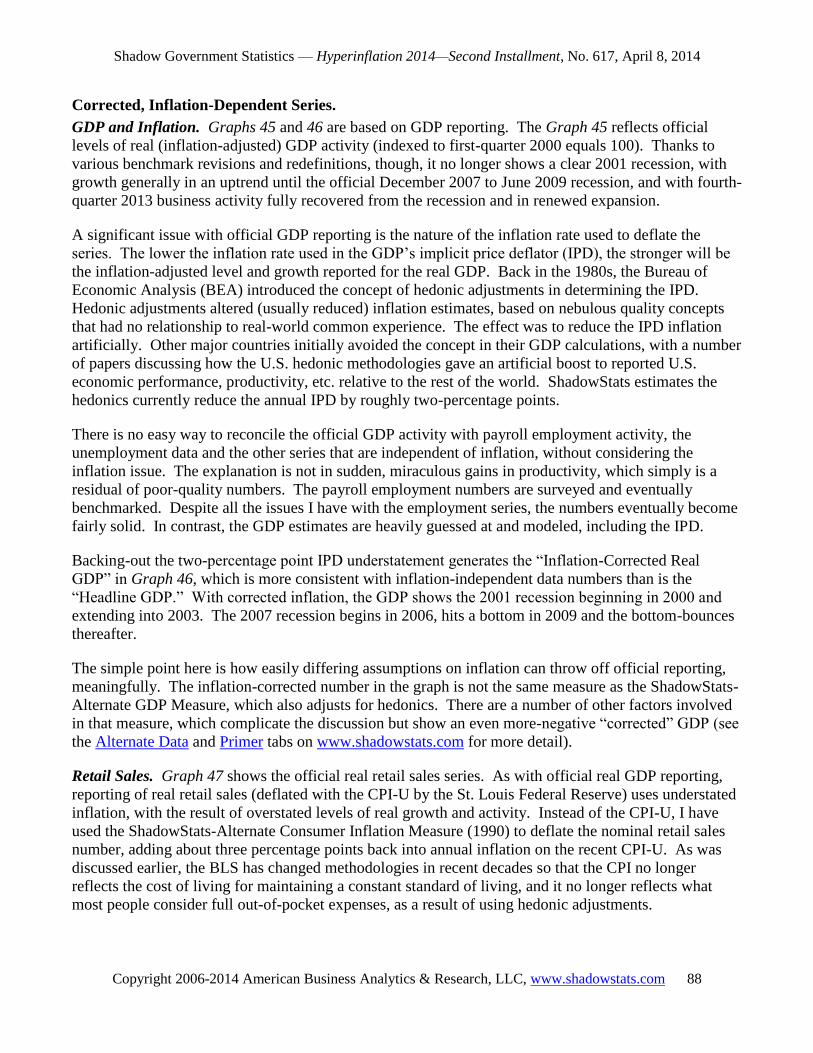
Shadow Government Statistics — Hyperinflation 2014—Second Installment, No. 617, April 8, 2014
Copyright 2006-2014 American Business Analytics & Research, LLC, www.shadowstats.com 88
Corrected, Inflation-Dependent Series.
GDP and Inflation. Graphs 45 and 46 are based on GDP reporting. The Graph 45 reflects official
levels of real (inflation-adjusted) GDP activity (indexed to first-quarter 2000 equals 100). Thanks to
various benchmark revisions and redefinitions, though, it no longer shows a clear 2001 recession, with
growth generally in an uptrend until the official December 2007 to June 2009 recession, and with fourth-
quarter 2013 business activity fully recovered from the recession and in renewed expansion.
A significant issue with official GDP reporting is the nature of the inflation rate used to deflate the
series. The lower the inflation rate used in the GDP’s implicit price deflator (IPD), the stronger will be
the inflation-adjusted level and growth reported for the real GDP. Back in the 1980s, the Bureau of
Economic Analysis (BEA) introduced the concept of hedonic adjustments in determining the IPD.
Hedonic adjustments altered (usually reduced) inflation estimates, based on nebulous quality concepts
that had no relationship to real-world common experience. The effect was to reduce the IPD inflation
artificially. Other major countries initially avoided the concept in their GDP calculations, with a number
of papers discussing how the U.S. hedonic methodologies gave an artificial boost to reported U.S.
economic performance, productivity, etc. relative to the rest of the world. ShadowStats estimates the
hedonics currently reduce the annual IPD by roughly two-percentage points.
There is no easy way to reconcile the official GDP activity with payroll employment activity, the
unemployment data and the other series that are independent of inflation, without considering the
inflation issue. The explanation is not in sudden, miraculous gains in productivity, which simply is a
residual of poor-quality numbers. The payroll employment numbers are surveyed and eventually
benchmarked. Despite all the issues I have with the employment series, the numbers eventually become
fairly solid. In contrast, the GDP estimates are heavily guessed at and modeled, including the IPD.
Backing-out the two-percentage point IPD understatement generates the ―Inflation-Corrected Real
GDP‖ in Graph 46, which is more consistent with inflation-independent data numbers than is the
―Headline GDP.‖ With corrected inflation, the GDP shows the 2001 recession beginning in 2000 and
extending into 2003. The 2007 recession begins in 2006, hits a bottom in 2009 and the bottom-bounces
thereafter.
The simple point here is how easily differing assumptions on inflation can throw off official reporting,
meaningfully. The inflation-corrected number in the graph is not the same measure as the ShadowStats-
Alternate GDP Measure, which also adjusts for hedonics. There are a number of other factors involved
in that measure, which complicate the discussion but show an even more-negative ―corrected‖ GDP (see
the Alternate Data and Primer tabs on www.shadowstats.com for more detail).
Retail Sales. Graph 47 shows the official real retail sales series. As with official real GDP reporting,
reporting of real retail sales (deflated with the CPI-U by the St. Louis Federal Reserve) uses understated
inflation, with the result of overstated levels of real growth and activity. Instead of the CPI-U, I have
used the ShadowStats-Alternate Consumer Inflation Measure (1990) to deflate the nominal retail sales
number, adding about three percentage points back into annual inflation on the recent CPI-U. As was
discussed earlier, the BLS has changed methodologies in recent decades so that the CPI no longer
reflects the cost of living for maintaining a constant standard of living, and it no longer reflects what
most people consider full out-of-pocket expenses, as a result of using hedonic adjustments.
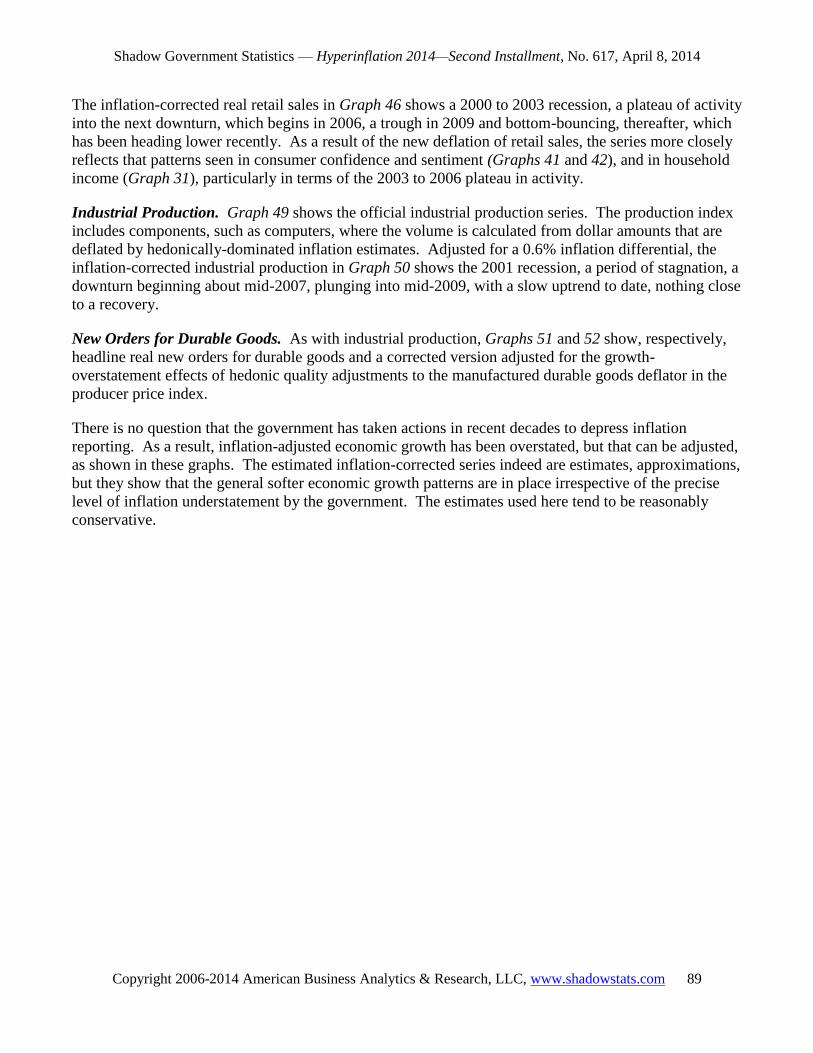
Shadow Government Statistics — Hyperinflation 2014—Second Installment, No. 617, April 8, 2014
Copyright 2006-2014 American Business Analytics & Research, LLC, www.shadowstats.com 89
The inflation-corrected real retail sales in Graph 46 shows a 2000 to 2003 recession, a plateau of activity
into the next downturn, which begins in 2006, a trough in 2009 and bottom-bouncing, thereafter, which
has been heading lower recently. As a result of the new deflation of retail sales, the series more closely
reflects that patterns seen in consumer confidence and sentiment (Graphs 41 and 42), and in household
income (Graph 31), particularly in terms of the 2003 to 2006 plateau in activity.
Industrial Production. Graph 49 shows the official industrial production series. The production index
includes components, such as computers, where the volume is calculated from dollar amounts that are
deflated by hedonically-dominated inflation estimates. Adjusted for a 0.6% inflation differential, the
inflation-corrected industrial production in Graph 50 shows the 2001 recession, a period of stagnation, a
downturn beginning about mid-2007, plunging into mid-2009, with a slow uptrend to date, nothing close
to a recovery.
New Orders for Durable Goods. As with industrial production, Graphs 51 and 52 show, respectively,
headline real new orders for durable goods and a corrected version adjusted for the growth-
overstatement effects of hedonic quality adjustments to the manufactured durable goods deflator in the
producer price index.
There is no question that the government has taken actions in recent decades to depress inflation
reporting. As a result, inflation-adjusted economic growth has been overstated, but that can be adjusted,
as shown in these graphs. The estimated inflation-corrected series indeed are estimates, approximations,
but they show that the general softer economic growth patterns are in place irrespective of the precise
level of inflation understatement by the government. The estimates used here tend to be reasonably
conservative.

Shadow Government Statistics — Hyperinflation 2014—Second Installment, No. 617, April 8, 2014
Copyright 2006-2014 American Business Analytics & Research, LLC, www.shadowstats.com 90
Graph 45: Real GDP Level, Official Version
Graph 46: Corrected Real GDP Level
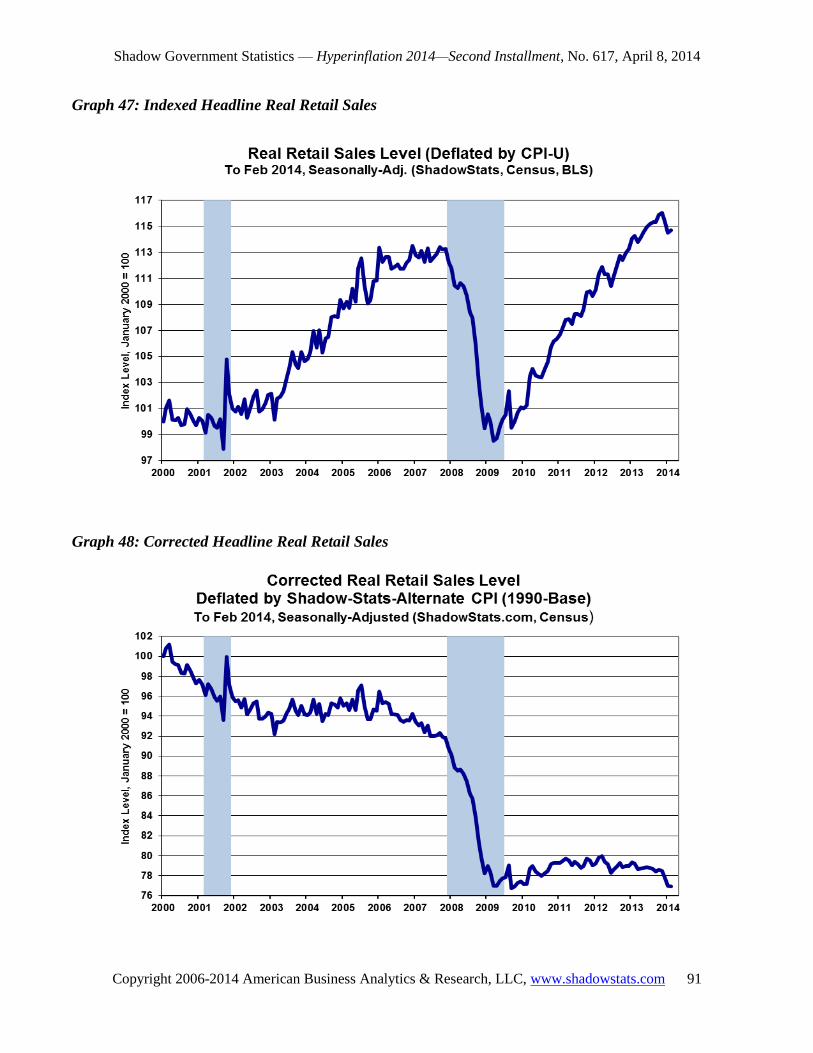
Shadow Government Statistics — Hyperinflation 2014—Second Installment, No. 617, April 8, 2014
Copyright 2006-2014 American Business Analytics & Research, LLC, www.shadowstats.com 91
Graph 47: Indexed Headline Real Retail Sales
Graph 48: Corrected Headline Real Retail Sales

Shadow Government Statistics — Hyperinflation 2014—Second Installment, No. 617, April 8, 2014
Copyright 2006-2014 American Business Analytics & Research, LLC, www.shadowstats.com 92
Graph 49: Indexed Headline Industrial Production Level
Graph 50: Corrected Industrial Production
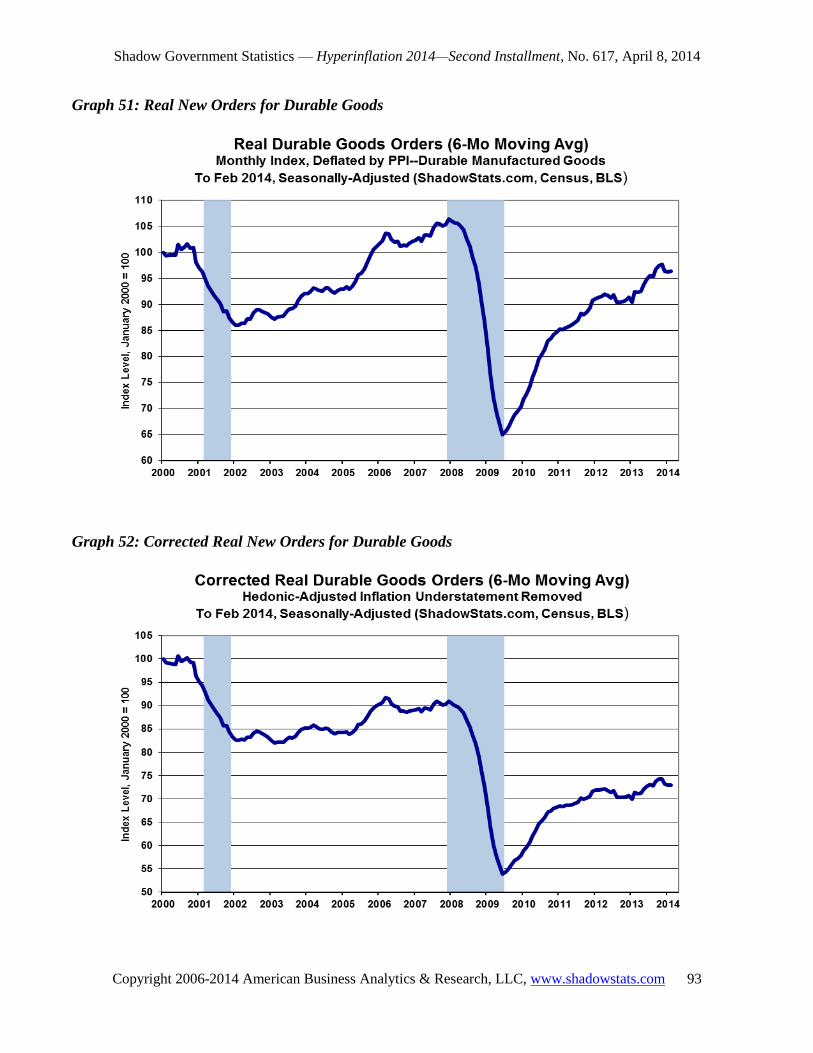
Shadow Government Statistics — Hyperinflation 2014—Second Installment, No. 617, April 8, 2014
Copyright 2006-2014 American Business Analytics & Research, LLC, www.shadowstats.com 93
Graph 51: Real New Orders for Durable Goods
Graph 52: Corrected Real New Orders for Durable Goods

Shadow Government Statistics — Hyperinflation 2014—Second Installment, No. 617, April 8, 2014
Copyright 2006-2014 American Business Analytics & Research, LLC, www.shadowstats.com 94
Chapter 10—Hyperinflationary Great Depression and How to Handle It
Move Towards Hyperinflation Accelerated by Current Fed and Government Actions.
Even with the government’s spending, debt and obligations running far beyond the ability of the
government to cover with taxes, or to constrain with spending cuts, and given the political unwillingness
of those controlling the federal government to recast programs such as Social Security and Medicare so
as to foster long-term fiscal solvency for the United States, the inevitable inflationary collapse, based
solely on these funding needs, possibly could have been pushed well towards the end of the current
decade. Yet, the effects of various systemic crises, the extraordinary economic downturn, and the
government’s responses to same, have moved the likely timing of the hyperinflationary crisis into the
current year.
Federal government and Federal Reserve responses to the financial, systemic and economic crises also
severely have weakened global confidence in the U.S. dollar. As seen in recent years, global political
crises have tended to push safe-haven flight money into gold, Swiss francs or other currencies. The
traditional post-World War II flight to safety in the U.S. dollar during crises appears to have dissipated.
With a severely weakened global standing, the U.S. dollar increasingly is at risk of losing its global
reserve status.
Conceivably, immediate massive and fiscally painful action by the federal government to restore and
maintain long-range U.S. government solvency still could avoid the looming dollar collapse, but the
related political issues appear now to have been pushed off until after the 2014 midterm election, again,
as those controlling the government continue to push politically-difficult choices and actions as far into
the future as possible. That has been explicitly demonstrated in actions by both the White House and
Congress in the last several years. Nonetheless, despite political efforts to dodge the issues, the U.S.
dollar and the deficit do matter, and the looming financial storm likely will break before the election.
The currency printing presses already are running, and the Fed has been working actively to debase the
U.S. dollar since the 2008 financial panic, effectively fully funding net U.S. Treasury debt issuance to
the public during QE2, and monetizing the better part of net U.S. Treasury issuance during QE3.
Continued liquidity issues in the financial system, combined with political cover for the Fed from
deteriorating economic circumstances, suggest increased, not reduced, quantitative easing in the year
ahead, despite recent ―tapering‖ moves.
Beyond the various actions that have failed to contain the systemic-solvency crisis or to stimulate the
economy; the unexpected continuing economic weakness—renewed headline downturn—will hamper
tax revenues and Treasury funding needs, as well as put the banking system through severe new stresses.
Again, some form of renewed stimulus package by the Fed aimed at helping banking-system solvency
remains likely. The hyperinflation crisis likely cannot be avoided beyond the end of this year, 2014; and
a precursor of massive selling or dumping of the U.S. dollar could be triggered at any time, with little or
no warning.
Shadow Government Statistics — Hyperinflation 2014—Second Installment, No. 617, April 8, 2014
Copyright 2006-2014 American Business Analytics & Research, LLC, www.shadowstats.com 95
As discussed in the First Installment, the underlying fundamentals driving the exchange-rate value of
the U.S. dollar could not be more negative. When the dollar breaks, various defensive reactions from
the U.S. Treasury and the Federal Reserve are likely, including dollar-supportive interventions,
jawboning and manipulations of other markets, including gold. The more intense the developing panic,
the shorter lived will the effects of the interventions. The underlying fundamentals will win out in the
end.
It is in this environment of rapid fiscal deterioration and related massive funding needs that the U.S.
dollar remains open to a rapid and massive decline, along with a dumping of domestic- and foreign-held
U.S. Treasuries. The Federal Reserve would be forced to monetize further significant sums of Treasury
debt, triggering the early phases of a monetary inflation. Under such circumstances, current multi-
trillion dollar deficits would feed rapidly into a vicious, self-feeding cycle of currency debasement and
hyperinflation.
With the economy already in or near depression, hyperinflation kicking in quickly would push the
economy into a great depression, since disruptions from uncontained inflation are likely to bring normal
commercial activity to a halt.
What happens next is anyone’s speculation. How long would a hyperinflation last before the
government brought its fiscal house into order and established a sound currency? I would be surprised if
the hyperinflation crisis lasted beyond a year or two, since the system is not positioned to handle the
crisis well and pressures for rapid resolution would be extremely strong. All that depends, however, on
what evolves out of what otherwise would be highly unstable political, economic, financial and social
environments. Accordingly, the best individuals can do is to take actions to protect themselves and their
families, through the worst of foreseeable circumstances, both in terms of personal safety and in terms of
the purchasing power of pre-crisis assets.
Following is an exploration of certain problems that probably would be faced and have to be handled in
a hyperinflation, as well as some areas that can be addressed now by individuals and the federal
government.
Lack of Physical Cash.
The United States, in a hyperinflation, likely would experience the quick disappearance of cash as we
know it, with current Federal Reserve notes rapidly becoming worthless. Any replacement notes of
higher denominations would suffer a similar fate, but such a system needs a back-up of hard assets to
continue to function. In Zimbabwe, as discussed in the First Installment, Chapter 2, there was the back-
up of a black market in U.S. dollars, but no such back-up exists at present in the United States.
A functional black market in U.S. dollars effectively mitigated somewhat the impact of hyperinflation
on the functioning of the Zimbabwe economy. Those being paid in a rapidly devaluing currency were
able to convert what they held into the relatively hard asset of U.S. dollars, temporarily preserving the
purchasing power of the cash needed for later expenditures.
As discussed briefly in Chapter 2, former Congressman Ron Paul at one time introduced legislation that
would make gold a legal currency, directly convertible and exchangeable at market rates with Federal
Reserve notes, and with no tax consequences. If such a system were in place, that would provide a
back-up system that conceivably would do much to mitigate the severe economic damage that otherwise
Shadow Government Statistics — Hyperinflation 2014—Second Installment, No. 617, April 8, 2014
Copyright 2006-2014 American Business Analytics & Research, LLC, www.shadowstats.com 96
would occur in the early stages of a U.S. hyperinflation. The U.S. government would do well to
consider something along the lines proposed by Ron Paul.
Shy of a back-up system, and shy of the rapid introduction of a new currency and/or the highly
problematic adaptation of the current electronic commerce system to new pricing realities, a barter
system is the most likely circumstance to evolve for regular commerce. Such would make much of the
current electronic commerce system useless and add to what would become an ongoing economic
implosion. It also could take a number of months to become reasonably functional.
Some years back, I happened to be in San Francisco, having dinner with a former regional Federal
Reserve Bank president and the chief economist for a large Midwestern bank. Market rumors that day
had been that there was a run on a major bank in the City by the Bay. So I queried the regional Fed
president as to what would be happening if the rumors were true.
He had had some personal experience with a run on banks in his region and explained how the Fed had a
special team designed to handle such a crisis. The biggest problem he had had was getting adequate
cash to the troubled banks to cover depositors, having to fly cash in by helicopters to meet the local
cash-flow needs.
The troubled bank in San Francisco, however, was much larger than the example cited, and the former
Fed bank president speculated that there was not enough cash in the vaults of the regional Federal
Reserve Bank, let alone the entire Federal Reserve System, to cover a true run on deposits at the major
bank.
Therein lies an early problem for a system headed into hyperinflation: adequate physical currency.
Where the Fed may hold roughly $200 billion in currency outside of roughly $65 billion in commercial
bank vault cash, the bulk of roughly $1.2 trillion in currency outside the banks is not in the United
States. Back in 2000, the Fed estimated that 50% to 70% of U.S. dollar cash was outside the system.
That number probably is higher today, with perhaps less than $400 billion in physical cash in circulation
in the United States, or roughly 2.5% of M3. The rest of the dollars are used elsewhere in the world as a
store of wealth, or as an alternate currency, free of the woes of unstable domestic financial conditions.
Those conditions would change severely in the event of a U.S. hyperinflation.
Given the extremely rapid debasement of the larger denomination notes, with limited physical cash in
the system, existing currency would become worth more as kindling for a fire than as currency, and
would disappear quickly as a hyperinflation broke.
For the system to continue functioning in anything close to a normal manner, the government would
have to produce quickly an extraordinary amount of new cash, and electronic commerce would have to
be able to adjust to rapidly changing prices.
In terms of cash, new bills of much higher denominations would be needed, but production lead time is a
problem. Conspiracy theories of recent years have suggested the U.S. Government already has printed a
new currency of red-colored bills, intended for some dual internal and external U.S. dollar system. If
something like that indeed were the case, then there might be a store of ―new dollars‖ that could be
released at a 1-to-1,000,000 ratio, or whatever ratio was needed to make the new currency meaningful,
but such would not resolve any long-term problems—as seen in the multiple Zimbabwe devaluations—
Shadow Government Statistics — Hyperinflation 2014—Second Installment, No. 617, April 8, 2014
Copyright 2006-2014 American Business Analytics & Research, LLC, www.shadowstats.com 97
unless it was part of an overall restructuring of the global currency system, and unless the U.S.
government first put its fiscal house in order.
From a practical standpoint, however, currency would disappear, at least for a period of time in the early
period of a hyperinflation.
Possible Short-Term Electronic Relief for Individuals.
For those who have foreign-currency denominated bank accounts outside the United States, something
along the lines of a debit or credit card against that account—let’s say a Swiss franc account—could
help, in theory. In the United States, one could buy $100,000 worth of groceries with the credit card,
and 50 Swiss francs would be deducted overnight from the account in Zurich, based on the then-current
exchange rate. Such presumes, though, the ongoing functioning of a system in the U.S. that could
handle the transaction.
Where the vast bulk of today’s money is not physical, but electronic, however, chances of the system
adapting there are virtually nil. Think of the time, work and effort that went into preparing computer
systems for Y2K. Systems would have to be adjusted for variable, rather than fixed pricing, credit card
lines would need to be expanded daily, the number of digits used in tallying dollar-denominated
transactions would need to be expanded sharply. Some in the computer field advise, though, that many
businesses have accounting software that can handle any number of digits.
From a practical standpoint, however, the electronic quasi-cashless society of today likely also would
shut down early in a hyperinflation. Unfortunately, this circumstance rapidly would exacerbate an
ongoing economic collapse.
Barter System.
With standard currency and electronic payment systems non-functional, commerce quickly would
devolve into black markets for goods and services and a barter system. Gold and silver both are likely to
retain real value and would be exchangeable for goods and services. Silver would help provide smaller
change for less costly transactions. One individual indicated to me that he had found airline bottles of
high-quality scotch to be ideal small change in a hyperinflationary environment.
Other items that would be highly barterable would include full bottles of liquor or wine, or canned
goods, for example. Similar items that have a long shelf life can be stocked in advance of the problem,
and otherwise would be consumable if the terrible inflation never came. Separately, individuals, such as
doctors and carpenters, who provide broadly useable services, already have services to barter.
A note of caution was raised once by one of my old economics professors, who had spent part of his
childhood living in a barter economy. He told a story of how his father had traded a shirt for a can of
sardines. The father decided to open the can and eat the sardines, but he found the sardines had gone
bad. Nonetheless, the canned sardines had taken on a monetary value.
Howard J. Ruff, who has been writing about these problems and issues since Nixon closed the gold
window, rightly argued that it would take some time for a barter system to be established, and suggests
that individuals should build up a six-month store of goods to cover themselves and their families in the
difficult times. Such is within the scope of normal disaster planning in some areas of the country (for

Shadow Government Statistics — Hyperinflation 2014—Second Installment, No. 617, April 8, 2014
Copyright 2006-2014 American Business Analytics & Research, LLC, www.shadowstats.com 98
example, I sit almost on top of the Hayward Fault). Stories out of recent catastrophes such as the great
Japanese earthquake and Hurricane Sandy just reinforce those common-sense principles.
Current Inflation and Investments.
Inflation can be hedged in various ways, and outperforming inflation is a common, minimal investment
goal. CPI reporting understates actual inflation, at least as investors like to view their cost-of-living, in
terms—minimally—of maintaining a constant standard of living. As discussed in the Public Comment
on Inflation, and as defined and graphed in the First Installment (see pages 6 to 8 in the Definitions
section), the ShadowStats alternate inflation measures estimate where current inflation would be, had the
government not moved deliberately to understate it. The government’s reporting changes to inflation
were designed to reduce artificially the cost-of-living adjustments to programs such as Social Security,
rather than to provide an inflation number that would be more meaningful to a public interested in
personal financial considerations.
The various inflation measures are discussed and viewed against precious metals and the Swiss franc in
the First Installment, Chapter 3, particularly with Table I: Loss of U.S. Dollar Purchasing Power on
page 31, and the graphs following on pages 32 and 33.
When considering how one can hedge against a hyperinflation, it is useful to consider how various asset
classes traditionally have behaved in an inflationary environment. Once in the throes of the systemic
instabilities that would accompany a hyperinflation, certain other considerations come into play.
For example, where gold and silver would be the primary hedges against a hyperinflation, related
systemic instabilities would suggest that holding the precious metals in physical form would be prudent.
The following graph (Graph 53) was put together as part of a study by, and is courtesy of, our friends at
www.NorthPeakAM.com, who specialize in hedging inflation. Not too surprisingly, the asset class of
commodities, which includes the primary hedges against a hyperinflation—physical gold and silver—
was the best performing in the ―Rising Inflation‖ environment.
The next section following separately reviews various financial and hedging options.
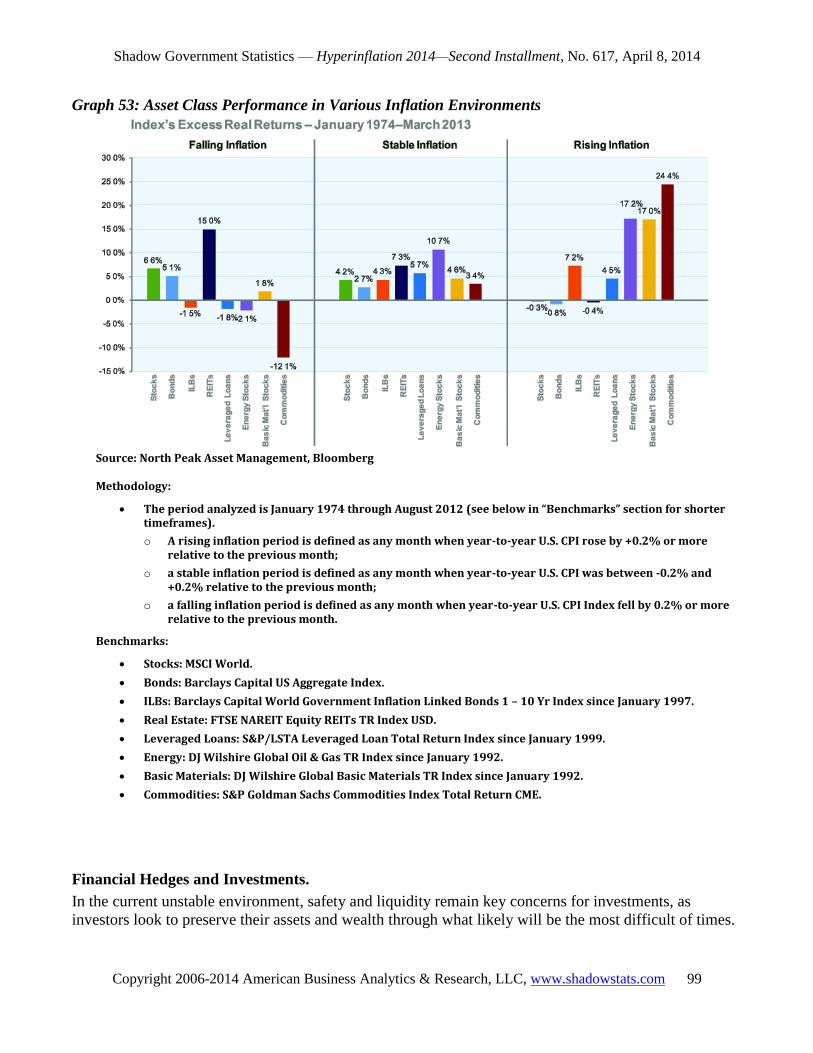
Shadow Government Statistics — Hyperinflation 2014—Second Installment, No. 617, April 8, 2014
Copyright 2006-2014 American Business Analytics & Research, LLC, www.shadowstats.com 99
Graph 53: Asset Class Performance in Various Inflation Environments
Source: North Peak Asset Management, Bloomberg
Methodology:
The period analyzed is January 1974 through August 2012 (see below in “Benchmarks” section for shorter timeframes).
o A rising inflation period is defined as any month when year-to-year U.S. CPI rose by +0.2% or more relative to the previous month;
o a stable inflation period is defined as any month when year-to-year U.S. CPI was between -0.2% and +0.2% relative to the previous month;
o a falling inflation period is defined as any month when year-to-year U.S. CPI Index fell by 0.2% or more relative to the previous month.
Benchmarks:
Stocks: MSCI World.
Bonds: Barclays Capital US Aggregate Index.
ILBs: Barclays Capital World Government Inflation Linked Bonds 1 – 10 Yr Index since January 1997.
Real Estate: FTSE NAREIT Equity REITs TR Index USD.
Leveraged Loans: S&P/LSTA Leveraged Loan Total Return Index since January 1999.
Energy: DJ Wilshire Global Oil & Gas TR Index since January 1992.
Basic Materials: DJ Wilshire Global Basic Materials TR Index since January 1992.
Commodities: S&P Goldman Sachs Commodities Index Total Return CME.
Financial Hedges and Investments.
In the current unstable environment, safety and liquidity remain key concerns for investments, as
investors look to preserve their assets and wealth through what likely will be the most difficult of times.
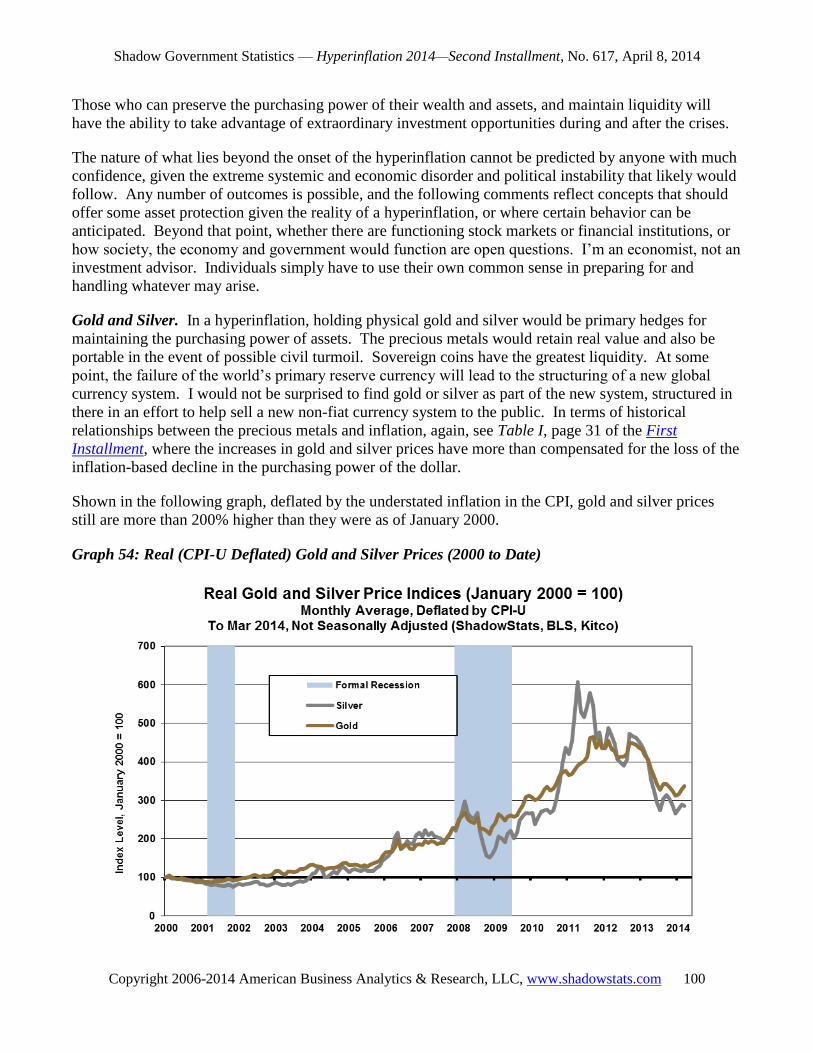
Shadow Government Statistics — Hyperinflation 2014—Second Installment, No. 617, April 8, 2014
Copyright 2006-2014 American Business Analytics & Research, LLC, www.shadowstats.com 100
Those who can preserve the purchasing power of their wealth and assets, and maintain liquidity will
have the ability to take advantage of extraordinary investment opportunities during and after the crises.
The nature of what lies beyond the onset of the hyperinflation cannot be predicted by anyone with much
confidence, given the extreme systemic and economic disorder and political instability that likely would
follow. Any number of outcomes is possible, and the following comments reflect concepts that should
offer some asset protection given the reality of a hyperinflation, or where certain behavior can be
anticipated. Beyond that point, whether there are functioning stock markets or financial institutions, or
how society, the economy and government would function are open questions. I’m an economist, not an
investment advisor. Individuals simply have to use their own common sense in preparing for and
handling whatever may arise.
Gold and Silver. In a hyperinflation, holding physical gold and silver would be primary hedges for
maintaining the purchasing power of assets. The precious metals would retain real value and also be
portable in the event of possible civil turmoil. Sovereign coins have the greatest liquidity. At some
point, the failure of the world’s primary reserve currency will lead to the structuring of a new global
currency system. I would not be surprised to find gold or silver as part of the new system, structured in
there in an effort to help sell a new non-fiat currency system to the public. In terms of historical
relationships between the precious metals and inflation, again, see Table I, page 31 of the First
Installment, where the increases in gold and silver prices have more than compensated for the loss of the
inflation-based decline in the purchasing power of the dollar.
Shown in the following graph, deflated by the understated inflation in the CPI, gold and silver prices
still are more than 200% higher than they were as of January 2000.
Graph 54: Real (CPI-U Deflated) Gold and Silver Prices (2000 to Date)
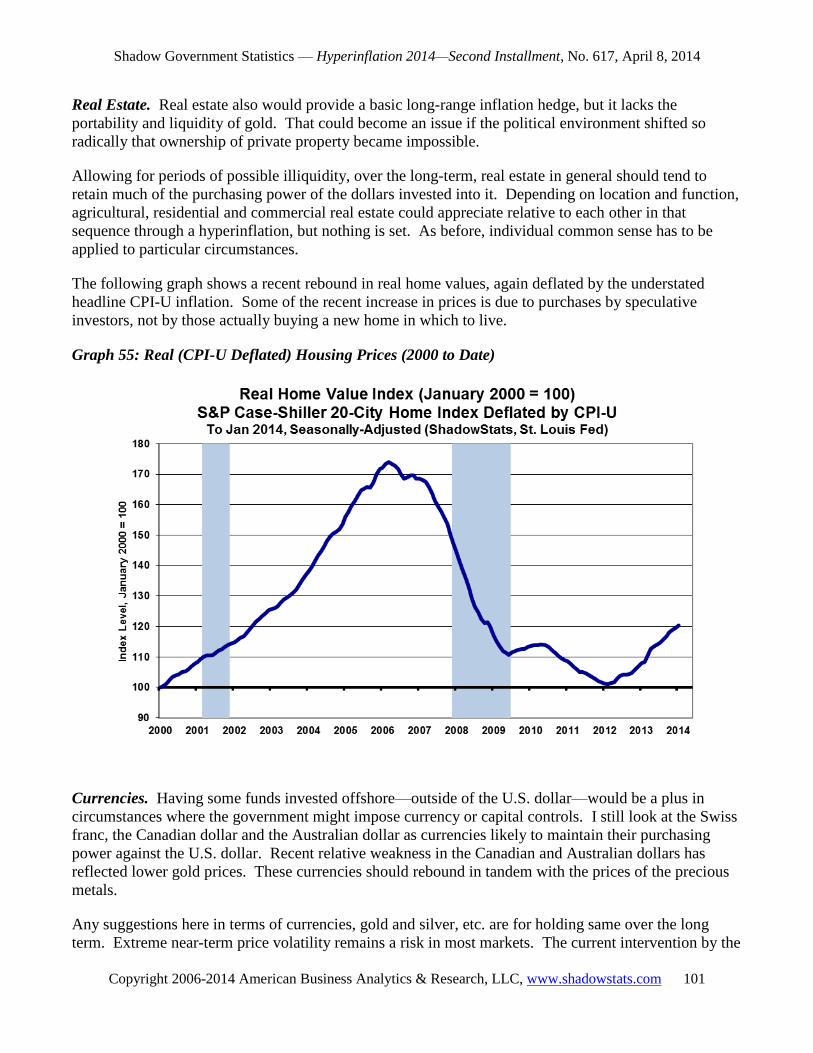
Shadow Government Statistics — Hyperinflation 2014—Second Installment, No. 617, April 8, 2014
Copyright 2006-2014 American Business Analytics & Research, LLC, www.shadowstats.com 101
Real Estate. Real estate also would provide a basic long-range inflation hedge, but it lacks the
portability and liquidity of gold. That could become an issue if the political environment shifted so
radically that ownership of private property became impossible.
Allowing for periods of possible illiquidity, over the long-term, real estate in general should tend to
retain much of the purchasing power of the dollars invested into it. Depending on location and function,
agricultural, residential and commercial real estate could appreciate relative to each other in that
sequence through a hyperinflation, but nothing is set. As before, individual common sense has to be
applied to particular circumstances.
The following graph shows a recent rebound in real home values, again deflated by the understated
headline CPI-U inflation. Some of the recent increase in prices is due to purchases by speculative
investors, not by those actually buying a new home in which to live.
Graph 55: Real (CPI-U Deflated) Housing Prices (2000 to Date)
Currencies. Having some funds invested offshore—outside of the U.S. dollar—would be a plus in
circumstances where the government might impose currency or capital controls. I still look at the Swiss
franc, the Canadian dollar and the Australian dollar as currencies likely to maintain their purchasing
power against the U.S. dollar. Recent relative weakness in the Canadian and Australian dollars has
reflected lower gold prices. These currencies should rebound in tandem with the prices of the precious
metals.
Any suggestions here in terms of currencies, gold and silver, etc. are for holding same over the long
term. Extreme near-term price volatility remains a risk in most markets. The current intervention by the
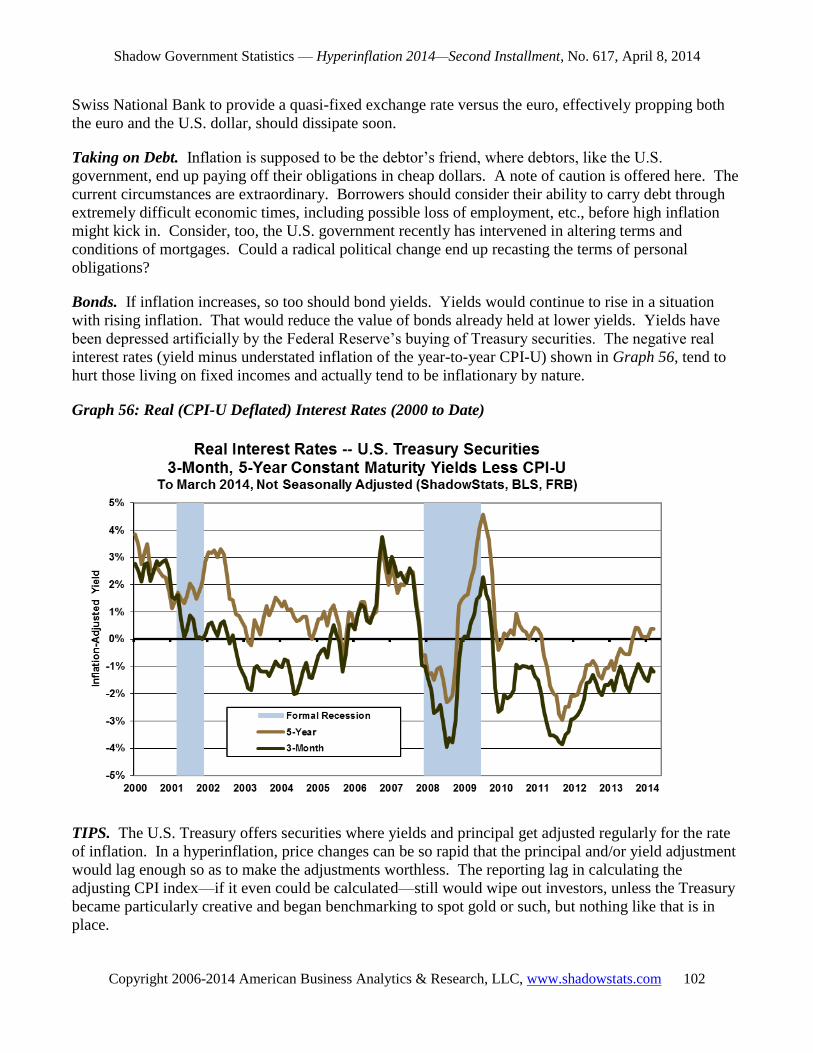
Shadow Government Statistics — Hyperinflation 2014—Second Installment, No. 617, April 8, 2014
Copyright 2006-2014 American Business Analytics & Research, LLC, www.shadowstats.com 102
Swiss National Bank to provide a quasi-fixed exchange rate versus the euro, effectively propping both
the euro and the U.S. dollar, should dissipate soon.
Taking on Debt. Inflation is supposed to be the debtor’s friend, where debtors, like the U.S.
government, end up paying off their obligations in cheap dollars. A note of caution is offered here. The
current circumstances are extraordinary. Borrowers should consider their ability to carry debt through
extremely difficult economic times, including possible loss of employment, etc., before high inflation
might kick in. Consider, too, the U.S. government recently has intervened in altering terms and
conditions of mortgages. Could a radical political change end up recasting the terms of personal
obligations?
Bonds. If inflation increases, so too should bond yields. Yields would continue to rise in a situation
with rising inflation. That would reduce the value of bonds already held at lower yields. Yields have
been depressed artificially by the Federal Reserve’s buying of Treasury securities. The negative real
interest rates (yield minus understated inflation of the year-to-year CPI-U) shown in Graph 56, tend to
hurt those living on fixed incomes and actually tend to be inflationary by nature.
Graph 56: Real (CPI-U Deflated) Interest Rates (2000 to Date)
TIPS. The U.S. Treasury offers securities where yields and principal get adjusted regularly for the rate
of inflation. In a hyperinflation, price changes can be so rapid that the principal and/or yield adjustment
would lag enough so as to make the adjustments worthless. The reporting lag in calculating the
adjusting CPI index—if it even could be calculated—still would wipe out investors, unless the Treasury
became particularly creative and began benchmarking to spot gold or such, but nothing like that is in
place.
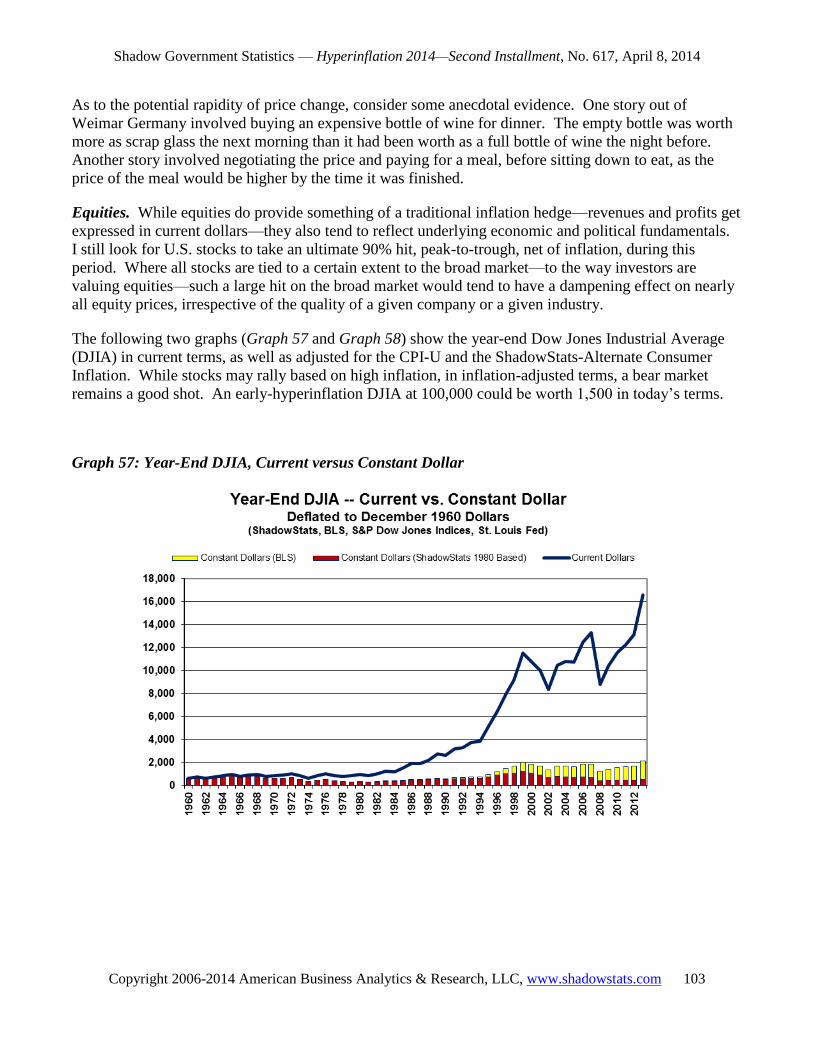
Shadow Government Statistics — Hyperinflation 2014—Second Installment, No. 617, April 8, 2014
Copyright 2006-2014 American Business Analytics & Research, LLC, www.shadowstats.com 103
As to the potential rapidity of price change, consider some anecdotal evidence. One story out of
Weimar Germany involved buying an expensive bottle of wine for dinner. The empty bottle was worth
more as scrap glass the next morning than it had been worth as a full bottle of wine the night before.
Another story involved negotiating the price and paying for a meal, before sitting down to eat, as the
price of the meal would be higher by the time it was finished.
Equities. While equities do provide something of a traditional inflation hedge—revenues and profits get
expressed in current dollars—they also tend to reflect underlying economic and political fundamentals.
I still look for U.S. stocks to take an ultimate 90% hit, peak-to-trough, net of inflation, during this
period. Where all stocks are tied to a certain extent to the broad market—to the way investors are
valuing equities—such a large hit on the broad market would tend to have a dampening effect on nearly
all equity prices, irrespective of the quality of a given company or a given industry.
The following two graphs (Graph 57 and Graph 58) show the year-end Dow Jones Industrial Average
(DJIA) in current terms, as well as adjusted for the CPI-U and the ShadowStats-Alternate Consumer
Inflation. While stocks may rally based on high inflation, in inflation-adjusted terms, a bear market
remains a good shot. An early-hyperinflation DJIA at 100,000 could be worth 1,500 in today’s terms.
Graph 57: Year-End DJIA, Current versus Constant Dollar
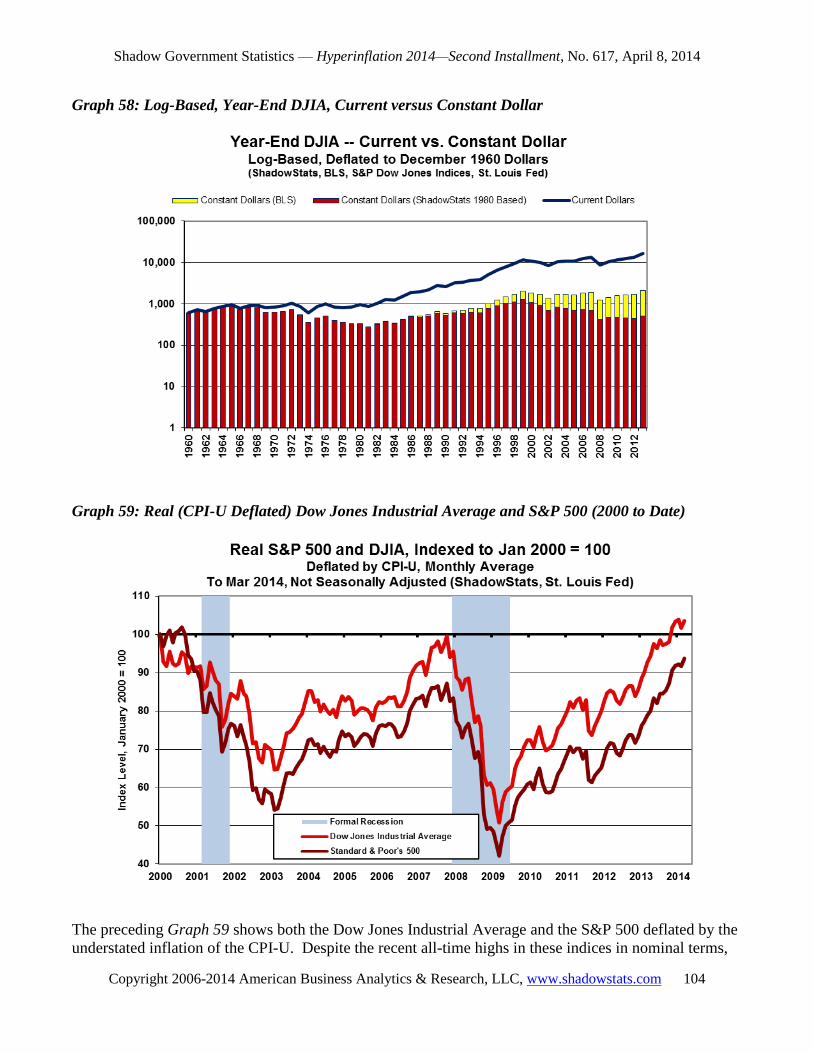
Shadow Government Statistics — Hyperinflation 2014—Second Installment, No. 617, April 8, 2014
Copyright 2006-2014 American Business Analytics & Research, LLC, www.shadowstats.com 104
Graph 58: Log-Based, Year-End DJIA, Current versus Constant Dollar
Graph 59: Real (CPI-U Deflated) Dow Jones Industrial Average and S&P 500 (2000 to Date)
The preceding Graph 59 shows both the Dow Jones Industrial Average and the S&P 500 deflated by the
understated inflation of the CPI-U. Despite the recent all-time highs in these indices in nominal terms,
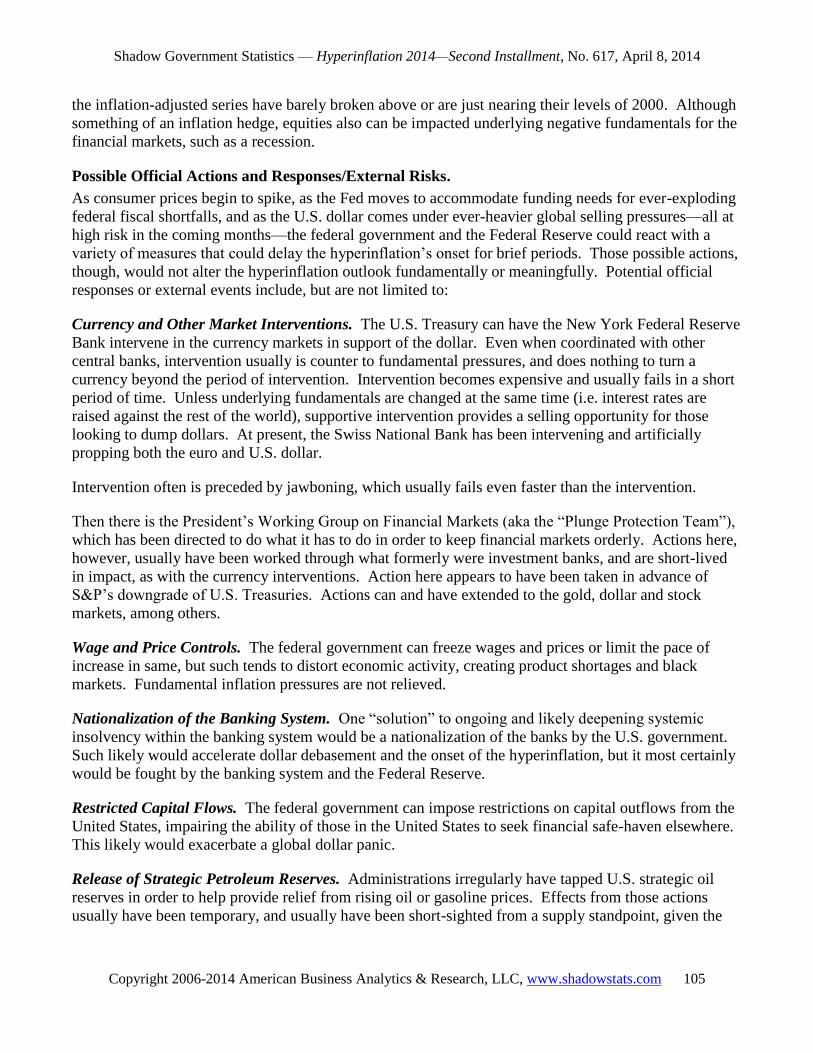
Shadow Government Statistics — Hyperinflation 2014—Second Installment, No. 617, April 8, 2014
Copyright 2006-2014 American Business Analytics & Research, LLC, www.shadowstats.com 105
the inflation-adjusted series have barely broken above or are just nearing their levels of 2000. Although
something of an inflation hedge, equities also can be impacted underlying negative fundamentals for the
financial markets, such as a recession.
Possible Official Actions and Responses/External Risks.
As consumer prices begin to spike, as the Fed moves to accommodate funding needs for ever-exploding
federal fiscal shortfalls, and as the U.S. dollar comes under ever-heavier global selling pressures—all at
high risk in the coming months—the federal government and the Federal Reserve could react with a
variety of measures that could delay the hyperinflation’s onset for brief periods. Those possible actions,
though, would not alter the hyperinflation outlook fundamentally or meaningfully. Potential official
responses or external events include, but are not limited to:
Currency and Other Market Interventions. The U.S. Treasury can have the New York Federal Reserve
Bank intervene in the currency markets in support of the dollar. Even when coordinated with other
central banks, intervention usually is counter to fundamental pressures, and does nothing to turn a
currency beyond the period of intervention. Intervention becomes expensive and usually fails in a short
period of time. Unless underlying fundamentals are changed at the same time (i.e. interest rates are
raised against the rest of the world), supportive intervention provides a selling opportunity for those
looking to dump dollars. At present, the Swiss National Bank has been intervening and artificially
propping both the euro and U.S. dollar.
Intervention often is preceded by jawboning, which usually fails even faster than the intervention.
Then there is the President’s Working Group on Financial Markets (aka the ―Plunge Protection Team‖),
which has been directed to do what it has to do in order to keep financial markets orderly. Actions here,
however, usually have been worked through what formerly were investment banks, and are short-lived
in impact, as with the currency interventions. Action here appears to have been taken in advance of
S&P’s downgrade of U.S. Treasuries. Actions can and have extended to the gold, dollar and stock
markets, among others.
Wage and Price Controls. The federal government can freeze wages and prices or limit the pace of
increase in same, but such tends to distort economic activity, creating product shortages and black
markets. Fundamental inflation pressures are not relieved.
Nationalization of the Banking System. One ―solution‖ to ongoing and likely deepening systemic
insolvency within the banking system would be a nationalization of the banks by the U.S. government.
Such likely would accelerate dollar debasement and the onset of the hyperinflation, but it most certainly
would be fought by the banking system and the Federal Reserve.
Restricted Capital Flows. The federal government can impose restrictions on capital outflows from the
United States, impairing the ability of those in the United States to seek financial safe-haven elsewhere.
This likely would exacerbate a global dollar panic.
Release of Strategic Petroleum Reserves. Administrations irregularly have tapped U.S. strategic oil
reserves in order to help provide relief from rising oil or gasoline prices. Effects from those actions
usually have been temporary, and usually have been short-sighted from a supply standpoint, given the

Shadow Government Statistics — Hyperinflation 2014—Second Installment, No. 617, April 8, 2014
Copyright 2006-2014 American Business Analytics & Research, LLC, www.shadowstats.com 106
political problems still festering in the Middle East and North Africa. Oil price problems increasingly
will be difficult to contain when they are driven by intensifying weakness in the U.S. dollar
Balanced-Budget Effort. The government could move to balance its fiscal condition, to restore long-
range fiscal solvency. With those currently controlling the U.S. government demonstrating a lack of
political will to address the serious issues, the next round potentially meaningful negotiations have been
put off until after the midterm 2014 election. Any budget deals struck within the current government
likely would be dominated by accounting gimmicks stretched over many years. With limited actual
impact on both near- and long-term fiscal solvency, any such deals likely would do more damage than
good to global confidence in the U.S. dollar.
Return to Gold Standard. Suggestions have been floated as to returning the U.S. dollar to full gold
backing. While something like that is likely—probably a necessity—in the aftermath of the
hyperinflation ahead, the problem (perhaps the desired effect) is that the gold standard would restrict the
government’s deficit spending. As such, in order for the new system to work, the government first
would have to balance its GAAP-based spending—which I contend is not politically feasible at present.
Unless fiscal circumstances are in balance, a new gold-based system would see continuous devaluations
of the dollar against gold, as unsupportable money was created. On the other hand, if fiscal conditions
were in balance, returning to a gold standard likely would not be under serious consideration at present.
Government Seizure of Privately Held Gold. A question commonly raised by subscribers is the
potential for the federal government to seize privately held gold, today, as it did back in 1933, when
President Franklin Roosevelt abandoned the domestic gold standard. While there is little the federal
government might do that would be too surprising in the current environment, seizure of privately-held
gold most likely would be tied to some reform of the monetary system, not just as an action aimed at
punishing gold investors.
Back in 1933, the use of gold continued for the settlement of international accounts between sovereign
states, and the U.S. government’s needs under that circumstance were used as an excuse for the seizure
of the public’s gold holdings. While there were some exceptions to the seizure, such as coin collections
and jewelry, U.S. investors ended up shifting funds into gold stocks as surrogates for the precious metal.
Private U.S. ownership of physical gold became legal, again, after President Richard Nixon closed the
gold window on international settlements in 1971. The shift in private-gold-ownership policy, then, also
was tied to the international monetary system’s backing, or lack of same, in gold.
Meaningful reform of the global monetary system and creation of a new U.S. currency, of whatever
form, most likely would be post-hyperinflation events.
Seizure of Bank Accounts. Various speculations have been raised as to bank depositors being forced to
bailout the next round of bank failures. In the 2008 panic, all U.S. deposits were guaranteed so as to
quell a run on the banks. Presumably the U.S. government would move to fund at least FDIC backing,
but a 2008 circumstance most likely would bring back full guarantees, rather than run the risk a collapse
of the domestic and, likely, the global banking system.
Major Natural Disasters. The catastrophic earthquake in Japan and Hurricane Sandy are reminders of
the unpredictably of the natural disasters that can befall a nation. Physical damages are not adjusted in
Shadow Government Statistics — Hyperinflation 2014—Second Installment, No. 617, April 8, 2014
Copyright 2006-2014 American Business Analytics & Research, LLC, www.shadowstats.com 107
GDP, although insurance payments can have positive impact when the payments are made by a foreign-
based insurer or reinsurer. Disruptions in normal commerce are a GDP negative, but rebuilding activity
is a positive. To the extent the federal government funds rebuilding efforts with deficit spending or pays
out unfunded government insurance, such actions add to the deficit and inflation issues.
Military Action. Beyond their horrors, wars historically have roots in economic problems, and they
usually have the effect of spiking economic activity and inflation, as well as distracting public attention
from other concerns. Orders for military goods at the outbreak of World War II in Europe, for example,
helped to pull the United States out of the Great Depression.
Today, defense accounts for just four-percent of durable goods orders in the consumer-driven U.S.
economy. A major new military conflict—beyond conflicts already impacting U.S. economic activity
and fiscal planning—might provide the economy with some boost, but that would be at the expense of
an offsetting further sharp deterioration in fiscal conditions and inflation prospects. Mounting global
political instabilities also can turn sharply negative for the U.S. dollar in the current environment.
Some production gains also might be problematic, where the United States has lost significant
manufacturing capacity to offshore competition. As mentioned in Chapter 7, when the big gun on the
USS Iowa exploded in 1989, the machine tools needed to manufacture a replacement gun no longer
were available in the United States. They were available, however, in China. At the extreme, the
outbreak of a global conflict of the magnitude of World War II, today, would be at the horrific risk of
becoming nuclear.
Back to the Fed: A New Round of Easing and Other Non-Effective Policies. The Federal Reserve
fairly easily can have negative impact on the economy and inflation, but positive results are not so
simple. The Fed can kill economic activity by shrinking systemic liquidity, and it can increase inflation
by ―printing‖ money. Efforts to stimulate economic growth or to reduce inflation, however, historically
have been much more difficult to accomplish. At present, though, Fed policies perversely have been
aimed at creating new inflation at the same time that an ongoing systemic liquidity squeeze is
intensifying the economic downturn. Continued efforts to debase the dollar should be successful, but
not in stimulating economic activity, only in triggering an eventual accelerating pace of inflation.
Despite recent minimal tapering, significant further efforts to cut back on, or to reverse, the so-called
quantitative easing actions are not likely. The liquidity that the Fed has put into the system has been
deemed necessary by the Fed, likely more from the standpoint of helping banking-system liquidity than
really expecting the measures would boost economic activity. As discussed throughout this report, the
economic and systemic-solvency crises appear to be worsening, not improving, suggesting more, not
less, quantitative easing is likely.
Volcker-Like Inflation Containment. Back in the oil-based inflation of the late-1970s, early-1980s,
Federal Reserve Chairman Paul Volcker earned a reputation as an effective inflation fighter. What he
did was to raise interest rates so high as to drive the economy into the ground, creating one of the worst
(double-dip) recessions of the post-World War II era. He killed economic demand enough so as to
offset oil-price distortions, at least partially. With current economic activity already in severe
contraction—even more severe than that of the early-1980s—chances of such a policy being pursued or
even having the potential of working, at present, are slim.
Shadow Government Statistics — Hyperinflation 2014—Second Installment, No. 617, April 8, 2014
Copyright 2006-2014 American Business Analytics & Research, LLC, www.shadowstats.com 108
Restraining the Federal Reserve. Efforts in Congress to restrain government spending could contain
federal spending activity when the system next moves to the brink of collapse. As long as the Federal
Reserve remains independent, however, it still likely would do whatever it had to in order to prevent
systemic collapse into a deflationary great depression. If the Fed were reined-in, then whether the
system ended in fire or ice, or somehow bought new life with a miraculous political shift that allowed
for fiscal balance, would be in the hands of the President and the Congress.
Closing Comments—Other Issues.
Political Considerations.
What lies ahead for the economy and inflation will have significant impact on the U.S. political process,
as economic woes did on the 2010 mid-term election. Historically, the concerns of the electorate have
been dominated by pocketbook issues. Pocketbook issues should be more of a concern in the upcoming
election than they were in 2010, or 2012.
For Those Outside the United States.
At least initially, the hyperinflation should be limited primarily to the U.S. dollar and dollarized
countries (where the U.S. dollar is used as a currency), with some flight to safety into the stronger
Western currencies. Efforts at emigration from the U.S. also should increase markedly (as they already
appear to be doing). An increasingly severe economic downturn in the United States, though, would be
felt globally. Nonetheless, with the usual creativity of the private sector and some shifting of trade
patterns away from linkage to the U.S. economy, would tend to mitigate some of the negative, global
impact. That already seems to be underway to a certain extent. Eventually, the global currency system
will have to be overhauled and the system in the United States should stabilize.
Common Sense.
A U.S. hyperinflationary great depression would be extremely disruptive to the lives, businesses and
economic welfare of most individuals living in the United States. Such severe economic pain could lead
to extreme political change and/or civil unrest.
What has been discussed here remains well shy of a comprehensive overview of all possible issues, but
rather at least has raised some questions and touched upon some likely consequences. No one can figure
out better than you the peculiarities of this circumstance and how you, your family and/or your business
might be affected and best be protected. Using common sense remains the best advice I can give.
These matters will continue to be expanded upon in the ShadowStats regular Commentaries and Special
Commentaries, as circumstances and subscriber interests dictate. As always, I extend by deep thanks to
the various readers who have raised questions and provided ideas, comments and material. Please feel
free to offer your thoughts or raise your questions by e-mail to [email protected].