Embed Size (px)
Citation preview
HYPOLIPIDEMIC AGENT Z-GUGGULSTERONE: METABOLISM INTERPLAYS WITH INDUCTION OF CHOLESTERYL ESTER HYDROLASE
CES1 AND BILE SALT EXPORT PUMP
Dongfang Yang1, Jian Yang1, Deshi Shi1, Da Xiao1, Yi-Tzai Chen1, Chris Black2
Ruitang Deng1, and Bingfang Yan1
1Department of Biomedical and Pharmaceutical Sciences, Center for Pharmacogenomics and
Molecular Therapy, University of Rhode Island, Kingston, RI 02881; 2IntelliCyt Corporation, 317
Commercial St. NE, Suite G100, Albuquerque, NM 87102.
Running title Interplay between CES1 and BSEP induction by Z-guggulsterone
Correspondence to: Dr. Bingfang Yan, Department of Biomedical and Pharmaceutical
Sciences, University of Rhode Island, Kingston, RI 02881, Phone: (401) 874-5032, Fax: (401)
874-5048, E-mail: [email protected]
Abbreviations BSEP, bile salt export pump; CDCA, chenodeoxycholic acid; CES1,
carboxylesterase-1; CYP7A1, cytochrome P450 7A1; EMSA, electrophoretic mobility shift assay; ER, endoplasmic reticulum; FXR, farnesoid X receptor; HDL, high-density lipoproteins; LDL, low-density lipoproteins; VLDL, very low-density lipoproteins.
by guest, on June 18, 2018w
ww
.jlr.orgD
ownloaded from
ABSTRACT
Z-Guggulsterone is a major ingredient in the Indian traditional hypolipidemic remedy guggul. A
study in mice has established that its hypolipidemic effect involves the farnesoid X receptor
(FXR), presumably by acting as an antagonist of this receptor. It is generally assumed that the
antagonism leads to induction of cytochrome P450 7A1 (CYP7A1), the rate-limiting enzyme
converting free cholesterol to bile acids. In this study, we tested whether Z-guggulsterone
indeed induces human CYP7A1. In addition, the expression of cholesteryl ester hydrolase
CES1 and bile salt export pump (BSEP) was monitored. In contrary to the general assumption,
Z-guggulsterone did not induce CYP7A1. Instead, this phytosterol significantly induced CES1
and BSEP through transactivation. Z-Guggulsterone underwent metabolism by CYP3A4, and
the metabolites greatly increased the induction potency on BSEP but not CES1. BSEP
induction favors cholesterol elimination, whereas CES1 involves both elimination and retention
(probably when excessively induced). Interestingly, clinical trials reported the hypolipidemic
response rates from 18 to 80% and showed that higher dosages actually increased very low
density lipoprotein cholesterol. Our findings predict that better hypolipidemic outcomes likely
occur to individuals who have relatively higher capacity of metabolizing Z-guggulsterone with
moderate CES1 induction, a scenario possibly achieved by lowering the dosing regimens.
Keywords Carboxylesterase, CES1, CYP7A1, transactivation, BSEP, antioxidant
by guest, on June 18, 2018w
ww
.jlr.orgD
ownloaded from
3
INTRODUCTION
Cardiovascular diseases remain the leading cause of death and the majority of these diseases
involve a pathogenic process: atherosclerosis [1]. Hyperlipidemia is the primary atherogenic
risk factor [1, 2]. In the plasma, lipids are encapsulated particles with apoproteins [1]. High-
density lipoproteins (HDL) transport lipids from peripheral tissues to the liver, thus is anti-athero-
genic [1]. Low-density lipoproteins (LDL) are the major type of lipoproteins accumulated in the
subendothelial matrix, hence are atherogenic. LDL is derived from very low-density lipoproteins
(VLDL), which are assembled in and secreted by the liver [2]. VLDL assembly starts when
apolipoprotein B-100 (apo-B100) is translated and translocated into endoplasmic reticulum (ER).
Maturation of VLDL particles undergo multiple-lipidation processes that traverse from the ER
and post-ER/Golgi compartments [2]. Lipids incorporated into VLDL particles undergo
continuous hydrolysis/re-esterification.
Carboxylesterase-1 (CES1) in humans and its functionally related mouse counterpart (Ces1d) in
lipid catabolism are implicated in the hydrolysis/re-esterification cycle [3, 4]. Indeed, higher
CES1 activity facilitates VLDL maturation [5] and transgenic expression of CES1 leads to
increased secretion of apoB proteins [3]. Conversely, hydrolysis of cholesterol esters by CES1
is linked to cholesterol elimination [6]. In the classic pathway of bile acid synthesis, cholesterol
is oxidized by cytochrome 7A1 (CYP7A1) [7], eventually converted into bile acids and secreted
by the bile acid export pump (BSEP). The secretion of bile acids represents the net elimination
of excessive cholesterol [8].
Increased bile acid synthesis has long been explored for the development of drugs with
cholesterol-lowering activity. The bililary secretion has a large capacity and is equally effective
in eliminating both endogenous and dietary cholesterols. For quite some time, guggul has
gained interests worldwide [9-11]. Originally described in the Indian traditional medicine
by guest, on June 18, 2018w
ww
.jlr.orgD
ownloaded from
4
Ayurveda, guggul has been used for thousands of years to treat conditions such as athero-
sclerosis [9, 12]. The hypolipidemic activity has been confirmed in multiple animal models [9].
Human clinical trials, however, produced inconsistent results. Some clinical trials reported that
guggul lowered plasma cholesterol by 20-30% and triglycerides by 10-20% with the response
rate being as high as 80% [9, 13, 14]. Other trials, however, did not detect the same level of
effectiveness [10, 11].
Nonetheless, Z-guggulsterone is recognized as the major active ingredient and its hypolipidemic
activity in mice requires the farnesoid X receptor (FXR) [15]. This phytosterol is an antagonist of
FXR and such antagonism is assumed to accelerate bile acid synthesis by inducing CYP7A1.
To directly test this hypothesis, human primary hepatocytes were treated with Z-guggulsterone
and the expression of CYP7A1 was determined. In addition, the expression of CES1 and BSEP
was monitored. In contrary to the general assumption, Z-guggulsterone was an inducer of
CES1 and BSEP but not CYP7A1. In addition, Z-guggulsterone underwent metabolism, and the
metabolites differentially altered CES1 and BSEP induction. Our findings predict that the
hypolipidemic activity of Z-guggulsterone depends on two important interplays, CES1 induction
versus CYP7A1 activity, and the metabolism of Z-guggulsterone versus the relative inducibility
between CES1 and BSEP.
by guest, on June 18, 2018w
ww
.jlr.orgD
ownloaded from
5
EXPERIMENTAL PROCEDURES
RT-qPCR Human primary hepatocytes were obtained from the Liver Tissues Procurement and
Distribution System (University of Minnesota) or CellzDirect (Pittsboro, NC). The use of the
human samples was approved by the Institutional Review Board. Hepatocytes and hepatoma
cells (Huh7) were cultured and treated with Z-guggulsterone, chenodeoxycholic acid (CDCA) or
both as described previously [12]. The mRNA levels were determined with TaqMan Assays [16].
The assay identification numbers were: CES1, Hs00275607_m1; CYP7A1, Hs00167982_m1;
BSEP, Hs00184824_m1; GAPDH, 4352934E; and RNA polymerase II, Hs00172187_m1. The
CES1 probe recognized both CES1A1 and CES1A2, and both enzymes are identical although
encoded by distinct genes [17].
Reporter assays The BSEP guggulsterone element reporter and the FXR expression construct
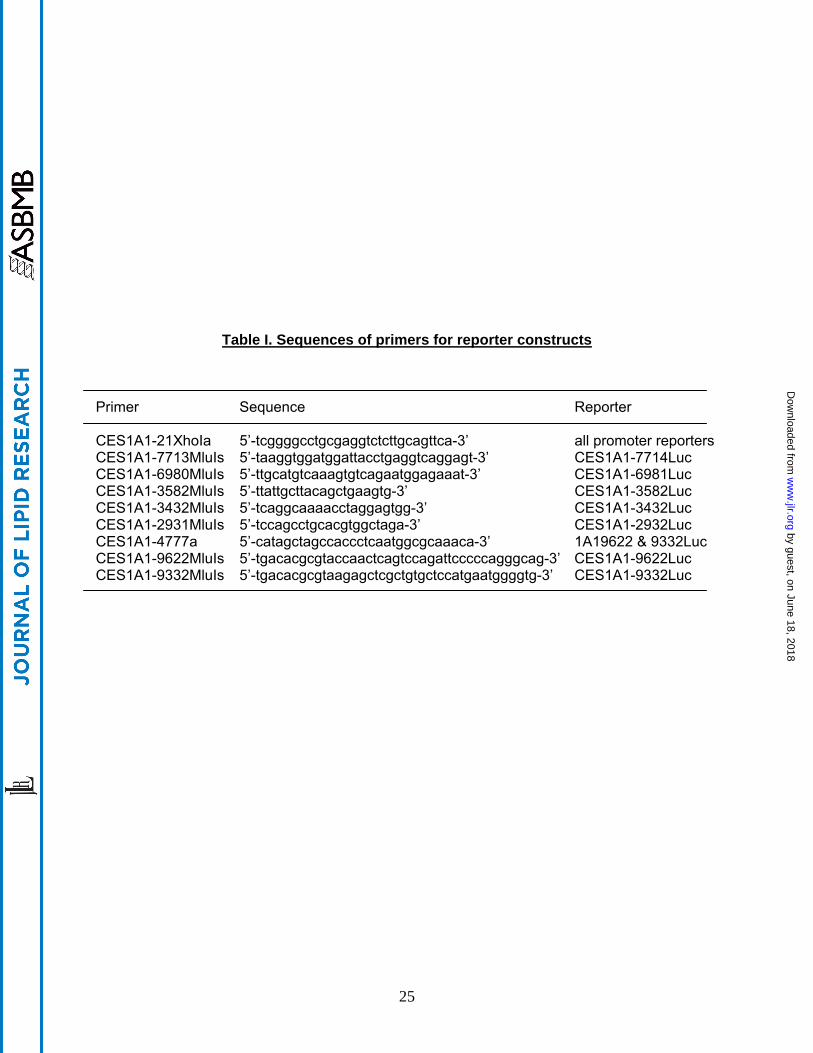
were described elsewhere [12]. The CES1A1 reporters containing its promoter and its
upstream sequence at varying length were prepared by inserting the corresponding genomic
fragment into the pGL3 basic luciferase vector at the Mlu I and Xho I sites. All genomic
fragments were generated by PCR with high fidelity Platinum Taq DNA polymerase. The primer
sequences are listed in Table I. Initially, human genomic DNA from the placenta was used as
the template for the amplification of the genomic fragment from -7714 to -21 (from the initial
translation codon) with primers CES1A1-21XhoIa and 7714MluIs. This fragment was inserted
into the pGL3 basic luciferase vector to prepare reporter CES1A1-7714Luc. This construct was
then used as the template to prepare reporters: CES1A1-6981Luc, CES1A1-3582Luc, CES1A1-
3432Luc, CES1A1-2932Luc with the same antisense primer (CES1A1-21XhoIa) but different
sense primer (Table I). The reporters CES1A1-9622Luc and CES1A1-9332Luc contained
additional upstream sequences. To prepare these constructs, human genomic DNA was used
as the template with primers CES1A1-4777a and CES1A1-9622Mlus or CES1A1-9333MluIs.
by guest, on June 18, 2018w
ww
.jlr.orgD
ownloaded from
6
The respective fragments were digested with Mlu I and Spe I (an internal site in the fragments).
The digested fragments were then ligated to the reporter CES1A1-7714Luc pretreated with the
same endonucleases. The CES1A1 guggulsterone element reporter was prepared by inserting
the oligonucleotides (5’-CACAATCTGCAGAGTCATCATGAAG-3’) into the pGL3 promoter
vector at the Nhe I and Xho I sites. All constructs were confirmed by sequencing. The reporter
assays were performed as described previously [16].
Metabolism of Z-guggulsterone Metabolism was conducted with recombinant CYPs (1 pmol)
and pooled human liver microsomes (20 μg) in a total volume of 100 μl [18, 19]. Preliminary
studies were performed to determine conditions supporting the linear rate. Z-Guggulsterone
was dissolved in acetonitrile and the final concentration of the solvent was 0.1%. After a 10-min
pre-incubation at 37°C, reactions were initiated by adding the NADPH-regenerating system
(NRS) and incubated for 40 min. The reactions were terminated by two volumes of ice cold
acetonitrile containing the internal standard spironolactone (10 μg/ml), followed by centrifugation.
For the inhibition assay, the pre-reaction mixtures contained a CYP inhibitor at previously
reported concentrations [20]. The metabolism was monitored for the disappearance of Z-
guggulsterone by LC-MS/MS (API 3200) [19]. Detection of the analytes was performed in
positive ion mode using the mass transitions of m/z: 313.2 → 97.0 for Z-guggulsterone, m/z:
416.6→341.2 for IS. Injection analysis was performed at a flow rate of 200 μl/min to obtain
optimum source parameters. The assay was linear from 1.04 to 416.27 ng/ml for Z-
guggulsterone.
Purification of metabolites Reactions were set up in a total volume of 1 ml with CYP3A4. The
supernatants were separated on a Chromolith SpeedROD column RP-18e (Merck, Germany) by
a gradient mobile phase made of A: 0.1% aqueous formic acid and B: acetonitrile. The mobile
by guest, on June 18, 2018w
ww
.jlr.orgD
ownloaded from
7
phase started with 10% acetonitrile for 2 min, 15% for 5 min, 70% for 3 min, 30% 4 min and
10% 1 min with the flow rate of 2 ml/min and the metabolites were detected by a diode array
detector at 240 nm. The concentrated metabolites were analyzed by HPLC and the
concentrations were estimated according to the curve generated with Z-guggulsterone at
various concentrations. The metabolites were analyzed for the mass-to-charge ratios by a Q-
Star Elite time-of-flight mass spectrometer (Applied Biosystems MDS). The LC conditions were
the same as described above but with a reduced flow rate (0.5 ml/min). Follows were analytic
parameters: injection volume 20 μl; column temperature, 30°C; DAD range, 210-400 nm with
240 as the detection wavelength; ionization mode, ESI+; scan range, 220-500 amu; and scan
rate, 1 scan/s.
Mouse hepatocyte culture and treatment Primary mouse hepatocytes were isolated from 9-
week old CD-1 mice (male) by a modified two-step collagenase digestion method, essentially as
described previously [21]. Hepatocytes were dispersed from the digested liver in Williams’ E
medium without collagenase and washed by low speed centrifugation (100-150 g, 5 min) 3
times. Hepatocytes were suspended in Williams’ E medium containing 35% percoll (Sigma-
Aldrich, St Louis, MO). The resulting cell pellet was then suspended in Williams’ E medium
containing 10% fetal bovine serum, insulin-transferrin-sodium selenite (ITS) supplement and
dexamethasone (100 nM), and the cell viability was determined by trypan blue exclusion.
Hepatocytes were then plated onto collagen coated culture plates (12-well plate). The cells
were allowed to attach for 4 h at 37°C in a humidified chamber with 95%/5%air/CO2. Culture
plates were then gently swirled and the medium containing unattached cells was then aspirated.
Fresh medium (free serum) was added to each well, and the cultures were returned to the
humidified chamber. Hepatocytes were cultured in the same medium for 48 h but the medium
was changed at 24 h. Thereafter, hepatocytes were cultured in DMEM containing treatment
chemicals at appropriate concentrations for 48 h and the treatment medium was replaced once
by guest, on June 18, 2018w
ww
.jlr.orgD
ownloaded from
8
at 24 h. Treated hepatocytes were collected in RIPA buffer for Western analysis. Otherwise,
hepatocytes were collected in Tris-HCl (50 mM, pH 7.4) and lysates were prepared by
sonication as described previously [24]. All mice were allowed free access to Purina Rodent
Chow 5001 and water, and the use of animals was approved by the Institutional Animal Care
and Use Committee.
Electrophoresis-coupled activity determination Nondenaturing gel electrophoresis for
staining esterase activity was conducted as described previously [22]. Cell lysates (5 or 20 μg)
was solubilized with 0.2% Lubrol and subjected to electrophoresis with a 3% acrylamide
stacking gel and a 7.5% acrylamide separating gel. After electrophoresis, the gels were washed
for 1 h in 100 mM potassium phosphate buffer (pH6.5), followed by incubating in the same
buffer containing 1-naphthylacetate (5 mM) and 4-benzolamino-2,5-dimethoxy-
benzenediazonium chloride hemi (zinc chloride) salt, usually termed Fast Blue RR (0.4 mg/ml).
The staining of esterases by this method is based on the formation of a black, insoluble complex
between 1-naphthol hydrolyzed from 1-naphthylacetate and Fast Blue RR.
Other analyses Electrophoretic mobility shift assay (EMSA) was performed as described
previously [21, 23]. Western blotting was detailed elsewhere [19, 24]. Preparation of CES1
antibody against a peptide was described previously [25]. The antibody (PC-064) against BSEP
(mouse and human) was purchased from Kamiya Biomedical Company (Seattle, WA), the
antibody against human CYP7A1 (ab79847) from Abcam Inc (Cambridge, MA), and the
antibody against mouse cyp7a1 from Cosmo Bio Co (Western Carlsbad, CA). Significant
differences were made according to One-way ANOVA followed by a DUNCAN’s multiple
comparison test (p < 0.05).
by guest, on June 18, 2018w
ww
.jlr.orgD
ownloaded from
9
RESULTS
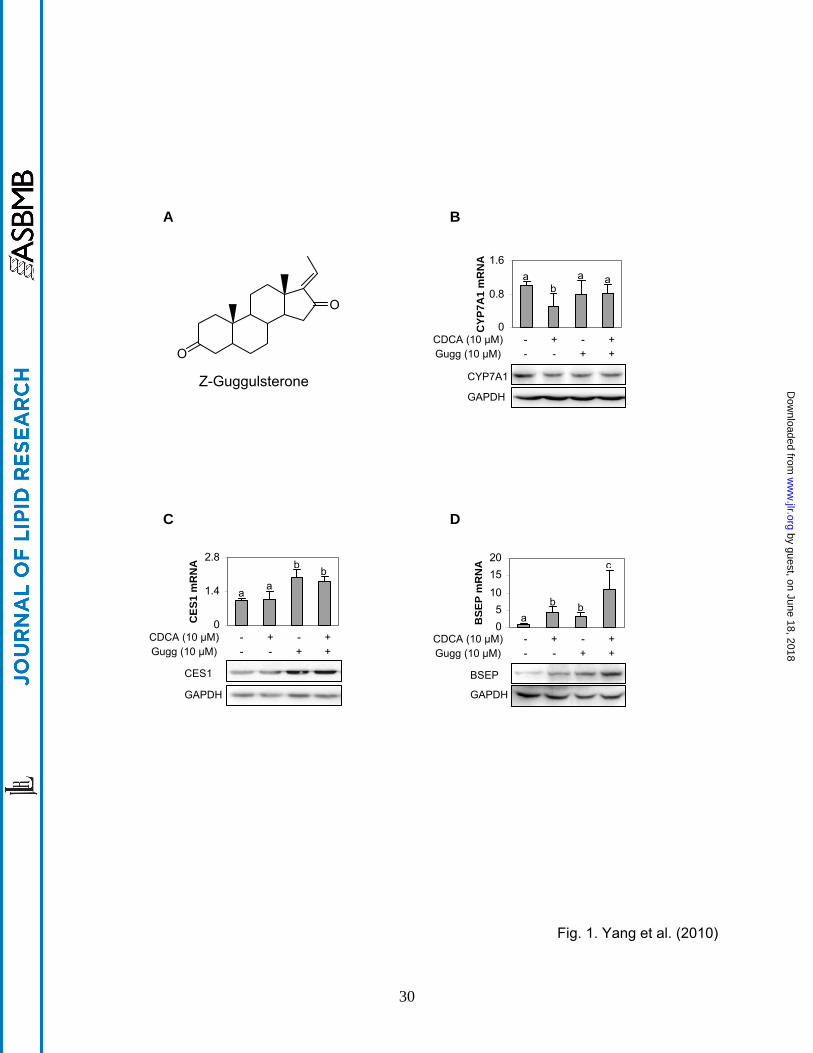
Z-Guggulsterone induces CES1 and BSEP but not CYP7A1 Based on a feed-back
mechanism [7], it is generally assumed that Z-guggulsterone exerts hypolipidemic activity by
increasing bile acid synthesis through inducing CYP7A1. On the other hand, rats fed with
guggul herb extract did not show increased expression of CYP7A1 [26]. Nevertheless, we
made an effort to determine whether Z-guggulsterone induces human CYP7A1. Human primary
hepatocytes were treated with Z-guggulsterone and the expression was determined. CDCA, a
known suppressor of CYP7A1 [27], was included in this study as a negative control. In contrary
to the general assumption, Z-guggulsterone caused a 20% decrease of CYP7A1 mRNA (Fig.
1B), although the decrease did not reach statistical significance. As expected, CDCA
significantly decreased CYP7A1 mRNA (Fig. 1B). The decrease was partially reversed by Z-
guggulsterone (Fig. 1B). The level of CYP7A1 protein showed similar pattern of changes as the
level of CYP7A1 mRNA. In contrast to the suppression of CYP7A1, Z-guggulsterone
significantly induced both CES1 and BSEP mRNA with BSEP (Figs. 1C and D). The fold of
induction of BSEP was higher than that of CES1 in the primary hepatocytes (p < 0.05). Co-
treatment with CDCA synergistically increased BSEP induction but slightly decreased CES1
induction (Figs. 1C and D). As seen with CYP7A1, the levels of CES1 and BSEP proteins
exhibited similar patterns of changes as those of the respective mRNA levels.
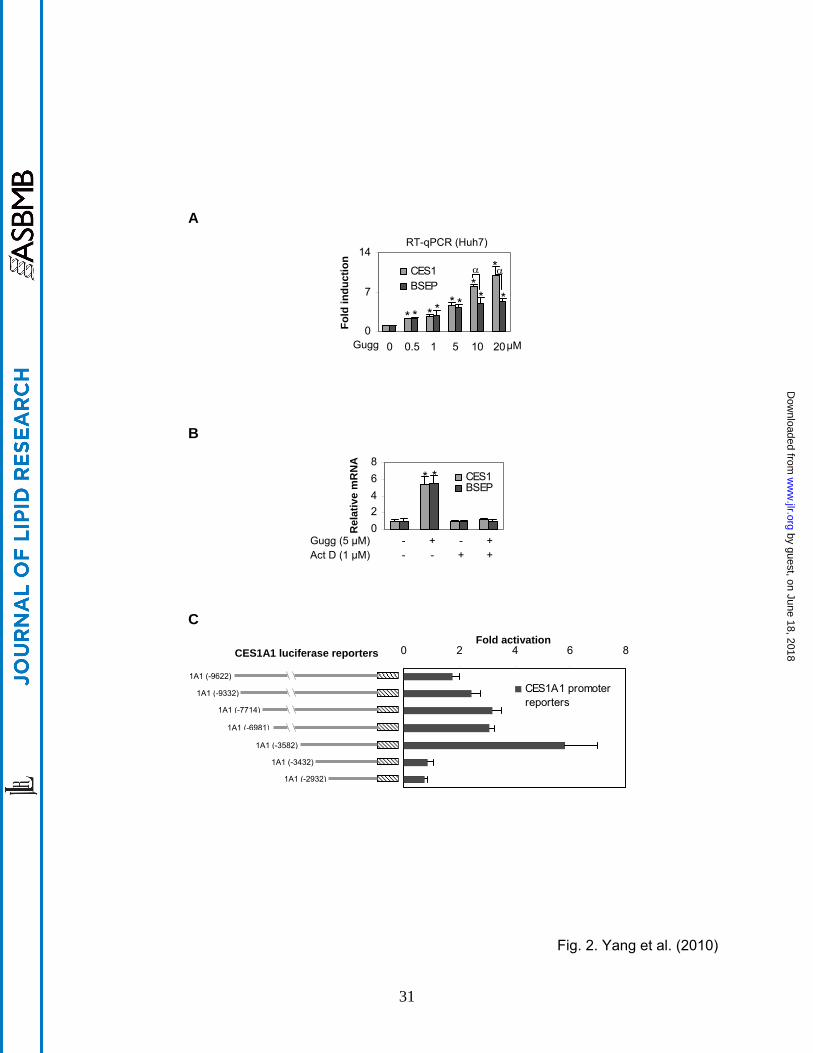
Activation of the CES1A1 promoter We have shown that Z-guggulsterone induces BSEP
through transactivation [12]. Next, we tested whether transactivation is also involved in CES1
induction. Huh7 cells (a human hepatic line) were used for this study. Initially, concentration-
dependent induction was determined in this line. As shown in Fig. 2A, Z-guggulsterone induced
CES1 and BSEP mRNA in a concentration-dependent manner, however, the magnitude of the
induction varied markedly. Both genes were induced comparably at lower concentrations, but
CES1 mRNA was induced to a significantly greater extent at 10 and 20 µM. All data-points on
by guest, on June 18, 2018w
ww
.jlr.orgD
ownloaded from
10
CES1 induction significantly differed with each other (p < 0.05) except those between 0.5 and 1
µM. Likewise, all concentrations caused statistically significant induction of BSEP. However,
the magnitudes of the induction between 0.5 and 1 µM did not differ significantly, neither did
those among 5, 10 and 20 1 µM. Next, we tested whether actinomycin D, a transcriptional
inhibitor, abolishes the induction of both CES1 and BSEP. Huh7 cells were treated with Z-
guggulsterone in the presence or absence of actinomycin D. As shown in Fig. 2B, co-treatment
with actinomycin D completely abolished the induction of both CES1 and BSEP, suggesting that
Z-guggulsterone induces CES1, like BSEP [12], through transactivation. We next tested
whether Z-guggulsterone stimulates the promoter of CES1A1, the predominant form of the
CES1 genes [17]. As shown in Fig. 2C, all reporters were activated by Z-guggulsterone except
reporters CES1A1-3432luc and CES1A1-2932Luc. The maximum activation was 6-fold and
occurred with the reporter CES1A1-3582Luc (Fig. 2C). CES1A1-3432luc, the immediate
reporter shorter than CES1A1-3582Luc, no longer responded to Z-guggulsterone, suggesting
that this 150-bp genomic fragment (-3582 to -3432) supports the transactivation.
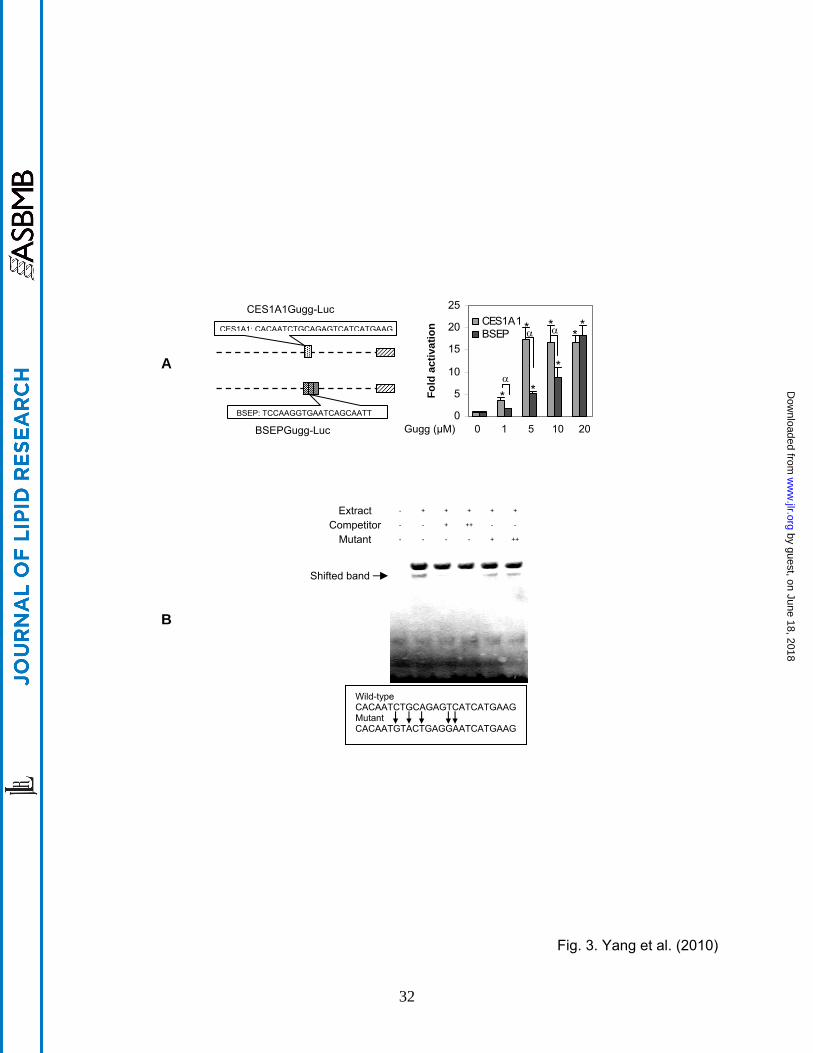
To precisely specify the sequence for the transactivation, element reporters (20-25 bases each)
were prepared to span the entire region with overlapping sequence. Among the element
reporters, only one reporter, designated CES1A1gugg-Luc, responded to Z-guggulsterone (Fig.
3A). This and the BSEP gugg-Luc reporter were tested for the activation as a function of Z-
guggulsterone. As shown in Fig. 3A, the CES1A1 element reporter was activated much higher
except the 20 µM data-point (Fig. 3A). It should be noted that the CES1 reporter contained only
a single copy of the element, whereas the BSEP reporter contained three copies. Nevertheless,
EMSA with nuclear extract from Z-guggulsterone treated Huh7 cells detected a shifted band
with the CES1A1 element. This binding was competed effectively by the corresponding non-
labeled element (Fig. 3B). In contrast, the mutant element (5’-CACAATGTACTGAGGAAT-
CATGAAG-3) had no competitive effect (Fig. 3B).
by guest, on June 18, 2018w
ww
.jlr.orgD
ownloaded from

11
Metabolism by CYP3A4 As described in Figs. 1 and 2, BSEP mRNA was induced higher in
primary hepatocytes, whereas CES1 mRNA was induced comparably or higher in Huh7 cells
depending on the concentrations. One explanation is that primary hepatocytes express higher
basal levels of CES1 thus the inducibility is lower. Another explanation is that primary
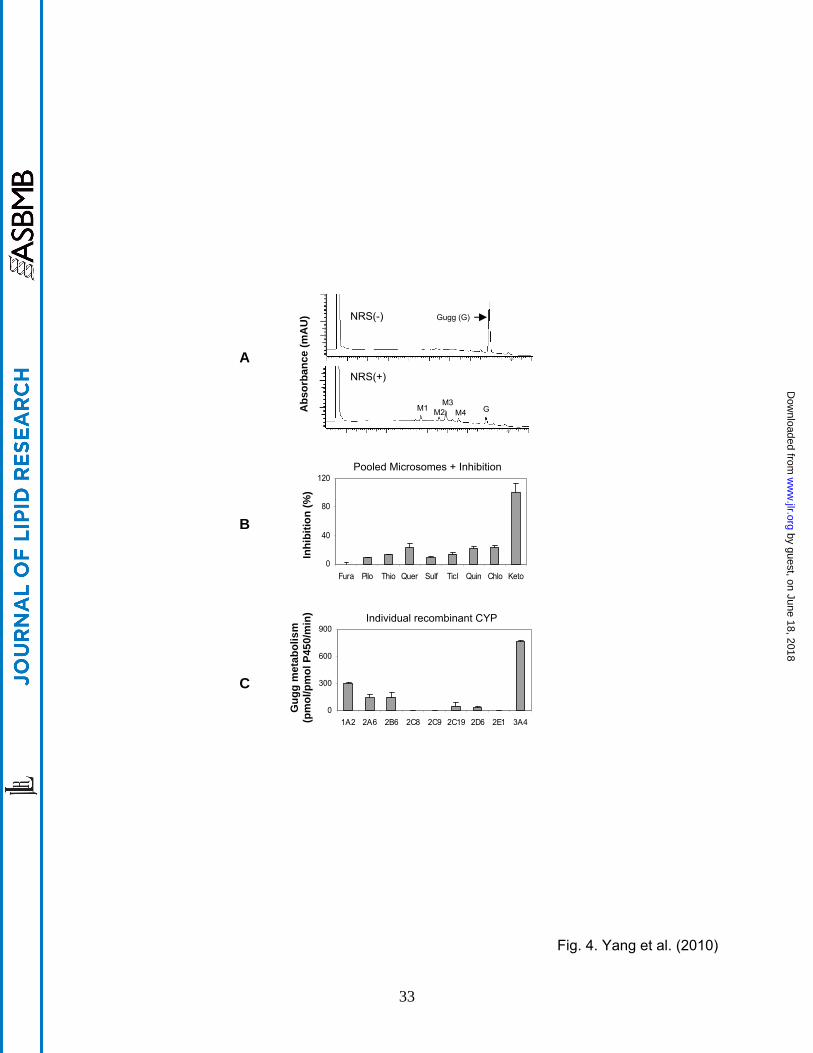
hepatocytes but not Huh7 [28] effectively metabolize Z-guggulsterone. To test whether Z-
guggulsterone actually undergoes metabolism, incubations were performed with pooled human
liver microsomes in the presence or absence of the NADPH-regenerating system (NRS). This
system is required for reactions catalyzed by CYPs and flavin monooxygenases [28]. As shown
in Fig. 4A, the reaction incubated without NRS, like zero-minute incubation, yielded a peak with
a retention time of 7.92 min (i.e., Z-guggulsterone). This peak, however, disappeared by ~90%
when the incubation was performed in the presence of NRS (Fig. 4A). At the same time,
several metabolite peaks appeared with a retention time of 4.69 min (M1), 5.60 (M2), 5.92 (M3)
and 6.56 (M4), respectively. M3 was the most abundant (Fig. 4A).
The majority of oxidations are catalyzed by the CYP system [28]. We next tested whether one
or more CYPs metabolize Z-guggulsterone. Likewise, incubations were conducted with pooled
microsomes but in the presence of a CYP inhibitor. A total of 9 inhibitors were used including
furafylline (CYP1A2), pilocarpine (CYP2A6), thio-tepa (CYP2B6), quercetin (CYP2C8),
sulfaphenazole (CYP2C9), ticlopidine (CYP2C19), quinidine (CYP2D6), chlormethiazole
(CYP2E1) and ketoconazole (CYP3A4/5). With the exceptions of furafylline (Fura) and
ketoconazole (Keto), all inhibitors caused a 10-20% decrease in the metabolism (Fig. 4B).
Ketoconazole caused complete inhibition, whereas the CYP1A2 inhibitor furafylline caused no
inhibition. Isoform-specific substrates were used to confirm the inhibitory activity of each
inhibitor.
by guest, on June 18, 2018w
ww
.jlr.orgD
ownloaded from
12
The inhibition study demonstrated that multiple CYPs metabolized Z-guggulsterone with the
CYP3A4 being the most active. To directly test this possibility, recombinant CYPs were tested
for the metabolism. Consistent with the inhibition study, CYP3A4 had the highest activity (Fig.
4C). Moderate metabolism was detected with CYP1A2, 2A6 and 2B6, slight metabolism was
detected with CYP2C19 and 2D6, and no metabolism was detected with CYP2C8, 2C9 and 2E1
(Fig. 4C). Interestingly, CYP1A2 was the second most active toward Z-guggulsterone, although
the corresponding inhibitor showed no inhibitory activity (Fig. 4B). Specific substrates for each
CYP were included to verify the catalytic activity of each recombinant CYP.
Purification of major metabolites To determine whether the metabolism alters the induction
potency, we purified several major metabolites. Initially, we performed a time-course study to
determine the kinetics of the metabolism by recombinant CYP3A4. As shown in Fig. 5A, the
parent compound was disappeared by ~70% within 30-min incubation. Prolonged incubation
further increased the metabolism. The metabolite profile generated by CYP3A4 was very
similar as that by liver microsomes (Figs. 4A and 5A), confirming that this CYP is the primary
enzyme for the metabolism. Interestingly, the 30 min-incubation produced similar amounts of
M1 and M4, however, prolonged incubation produced more M1 than M4 (Fig. 5A). To this end,
we purified M1, M2, M3 and M4 to the homogeneity. As shown in Figs. 5B-E, all purified
metabolites produced a single peak with a predicated retention time. Mass spectrometry
revealed that M1 was at m/z 345, the other three metabolites at 329. Z-Guggulsterone had a
mass-to-charge ratio of 313. Therefore, M1 represented an addition of two hydroxyl groups,
whereas others resulted from an addition of a single hydroxyl group.
Induction potency of major metabolites To determine whether the metabolites and Z-
guggulsterone differ in the induction potency, RT-qPCR and reporter assays were performed.
The concentrations of the metabolites were estimated based on the area under the curve. This
by guest, on June 18, 2018w
ww
.jlr.orgD
ownloaded from
13
study included all major metabolites but not M2, which was not sufficient to generate the
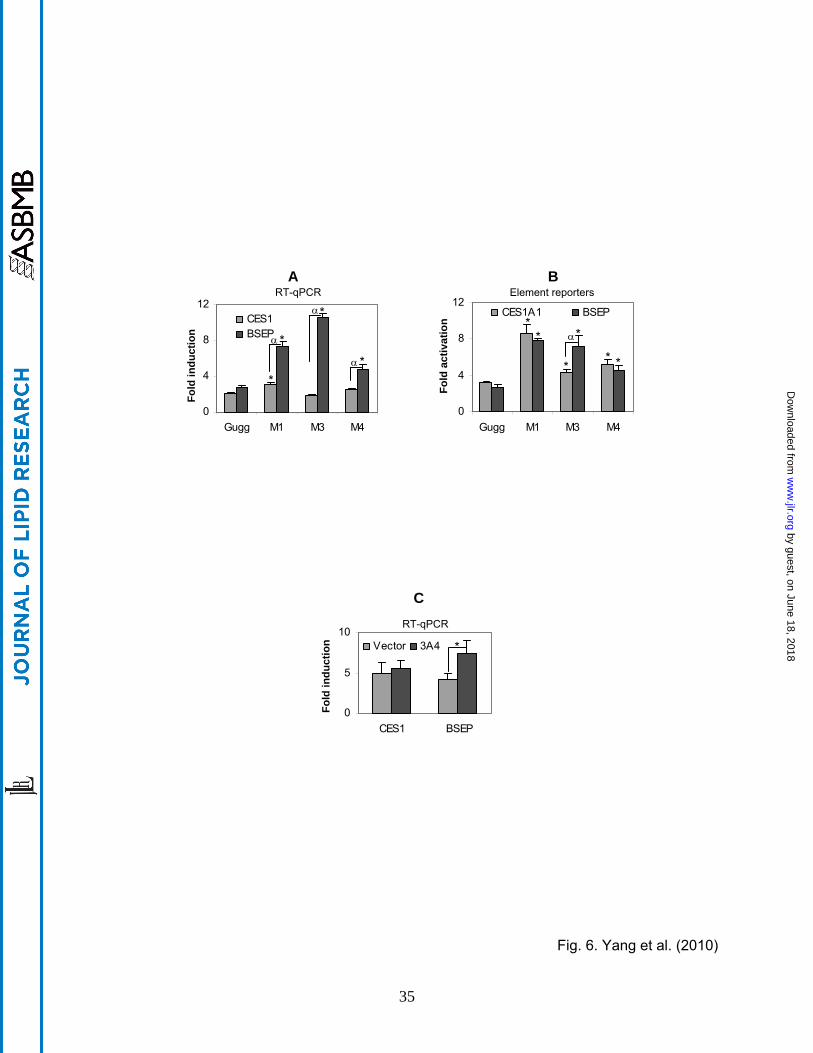
standardized concentration (2 µM). Compared with Z-guggulsterone, all metabolites caused
significant increases in the level of BSEP mRNA (Fig. 6A) with M3 causing the highest increase
(>3 fold). In contrast, the magnitude of changes in CES1 mRNA was much less. Compared
with Z-guggulsterone, M1 caused a 47% increase, M3 caused a 12% decrease and M4 caused
a 22% increase in CES1 induction (Fig. 6A). All metabolites tested showed significantly higher
induction of BSEP than CES1 mRNA (Fig. 6A).
We next tested the activation of CES1 and BSEP element reporters by various metabolites.
The results are summarized in Fig. 6B. The changes in element reporter activation, compared
with those in the induction of CES1 and BSEP mRNA, had several important differences.
Firstly, all metabolites showed increases in the activation of the element reporters, which was
not true in mRNA induction (Figs. 6A and B). For example, metabolite M3 actually caused a
slight decrease in the induction of CES1 mRNA. Secondly, between CES1A1 and BSEP,
metabolites generally caused less difference in the activation of the element reporters than
induction of the mRNA (Fig. 6A and B). For example, metabolite M1 caused much higher
increases in the induction of BSEP mRNA than CES1 mRNA, whereas this metabolite caused
similar increases in the activation of both element reporters (Figs. 6A and 6B). And thirdly, the
overall changes in the CES1 element reporter activation were greater than those in the
induction of CES1 mRNA. For example, compared with Z-guggulsterone, the maximal change
in the induction by M1 was 47% increase (Fig. 6A), whereas the maximal change in the
activation by M1 was ~2 fold (Fig. 6B). To further determine whether CYP3A4-based
metabolism of Z-guggulsterone differentially alters BSEP and CES1 induction, Huh7 cells were
transfected with CYP3A4 or the vector, treated with Z-guggulsterone (5 µM) and then analyzed
for the induction of CES1 and BSEP mRNA. As shown in Fig. 6C, co-transfection of CYP3A4,
compared with the vector, significantly increased BSEP but not CES1 induction.
by guest, on June 18, 2018w
ww
.jlr.orgD
ownloaded from
14
Effect of Z-guggulsterone on the expression of mouse bsep, cyp7a1 and carboxyl-
esterases (ces) To determine whether Z-guggulsterone modulates the expression of the
corresponding mouse genes, mouse primary hepatocytes were treated with Z-guggulsterone,
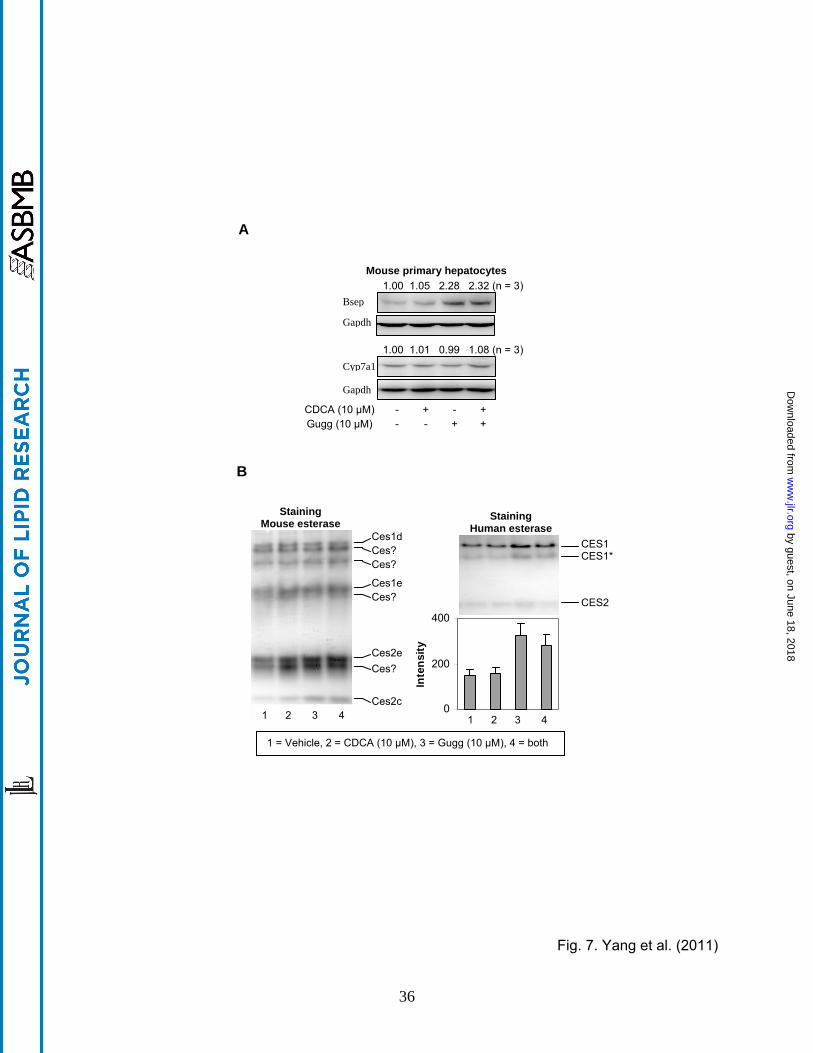
CDCA or both. As shown in Fig. 7A, Z-guggulsterone significantly induced bsep but not cyp7a1,
and the induction was not affected by CDCA co-treatment. This responding pattern was
consistent with that on the expression of BSEP and CYP7A1 in rats fed with guggul extract [26].
As expected, CDCA, a weak activator of mouse fxr [26], caused little changes in the expression
of bsep or cyp7a1 (Fig. 7A). Next we tested whether these treatments alter the expression of
mouse carboxylesterases. Mice have almost three times as many as humans in terms of the
number of carboxylesterase genes [29]. We took advantage that the relative level of
carboxylesterases can be indirectly determined by non-denaturing electrophoresis followed by
staining for hydrolytic activity with 1-naphythalacetate [22]. This standard substrate can be
hydrolyzed by many carboxylesterases. As shown in Fig. 7B (Left), both CDCA and Z-
guggulsterone markedly induced several major mouse carboxylesterases such as ces2e and
ces2c but not many others such as ces1d (the mouse counterpart of human CES1). The
identity of some of the electrophoretically distinct mouse carboxylesterases remains to be
established. As expected, Z-guggulsterone significantly increased the hydrolysis by CES1 but
much less so by CES2 (Right of Fig. 7B). Co-treatment with CDCA slightly decreased the
increased hydrolysis of CES1 by Z-guggulsterone.
by guest, on June 18, 2018w
ww
.jlr.orgD
ownloaded from
15
DISCUSSION
This study has shown that Z-guggulsterone significantly induced CES1 and BSEP. The
induction of CES1 by Z-guggulsterone, like the induction of BSEP, was achieved by
transactivation (Fig. 2). The transactivation depended on a particular genomic sequence
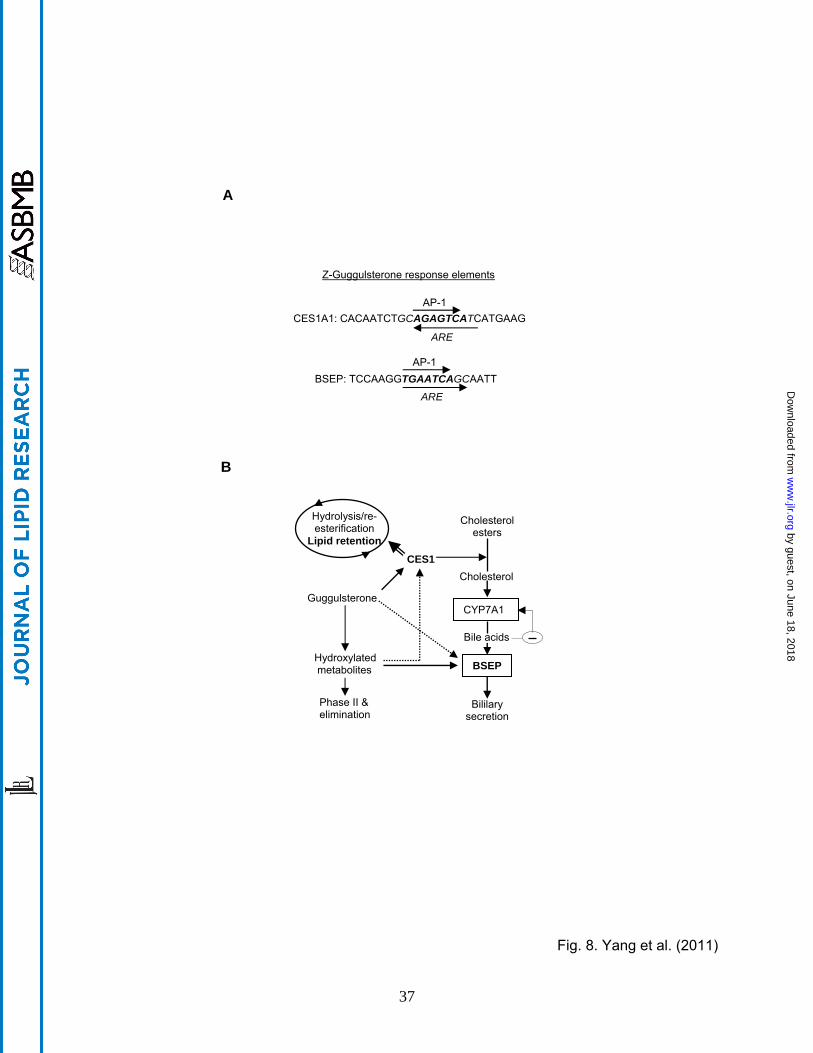
designated as the CES1A1 gugg element (Fig. 3A). Coincidently, both CES1A1 and BSEP
guggulsterone response elements contain an antioxidant response element (ARE) and an AP-1
site (Fig. 8A). However, the CES1A1 ARE is orientated in an opposite direction to that of BSEP
(Fig. 8A). Also, the CES1A1 AP-1 site (AGAGTCA) slightly differs from that of BSEP
(TGAATCA) (Fig. 8A). More importantly, these two elements differentially responded to Z-
guggulsterone and its metabolites, particularly metabolite M3 (Fig. 6B). Compared with Z-
guggulsterone, M3 increased the activation of the BSEP reporter from 2.6 to 7.3 fold, whereas
the increase was much less in the activation of the CES1A1 reporter: from 3.2 to 4.3 fold (Fig.
6B). On the other hand, similar responses were detected between the reporter activation and
mRNA induction of BSEP (Figs. 6A and B), whereas the reporter activation of CES1 was much
higher than the corresponding mRNA induction (Figs. 6A and B). One explanation is that the
BSEP element provides the primary mechanism for BSEP induction by Z-guggulsterone,
whereas the CES1A1 element represents one of the mechanisms for CES1 induction.
Clearly, the metabolism of Z-guggulsterone is determined largely by CYP3A4. The metabolite
profile generated by human microsomes was similar to that by CYP3A4 (Figs. 4A and 5A). On
the other hand, there were several interesting observations, particularly regarding the
metabolism by CYP1A2 (Figs. 4B and C). Furafylline, an inhibitor of CYP1A2, showed little
inhibition of Z-guggulsterone metabolism by liver microsomes (Fig. 4B), and yet, recombinant
CYP1A2 significantly metabolized this phytosterol (Fig. 4C). One explanation is that Z-guggul-
sterone is a substrate of both CYP3A4 and CYP1A2, but CYP3A4 has higher affinity and more
efficiently metabolizes this phytosterol. In addition, CYP3A4 is more abundant than CYP1A2 in
by guest, on June 18, 2018w
ww
.jlr.orgD
ownloaded from
16
the liver (2-3 times) [28]. Therefore, CYP1A2 normally contributes less, if any, to the hepatic
metabolism of Z-guggulsterone. Another interesting observation was that CYP3A4 produced
various metabolites (Fig. 5A). Most of them resulted from an addition of a single hydroxyl group
(Figs. 5C-E). In contrast, the formation of M1 was from an addition of two hydroxyl groups (Fig.
5B). Prolonged incubation increased the production of M1 but proportionally decreased M4 (Fig.
5A), suggesting that M4 is a substrate of CYP3A4 to produce M1 (Fig. 5A).
While the purified metabolites generally increased the induction of both CES1 and BSEP, the
magnitude was much greater on BSEP (Fig. 6). Secretion of bile acids represents net
elimination of cholesterol [8], therefore, induction of BSEP favors lowering cholesterol. In
contrast, induction of CES1 may favor the elimination or recycling of cholesterol, probably
depending on the level of CYP7A1 (Fig. 8B). Given the fact that the action of CES1 leads to
increased free cholesterol, high levels of CYP7A1 in individuals would facilitate the conversion
of cholesterol into bile acids, whereas low levels of CYP7A1 in others would favor the pathway
of VLDL assembling (double-lined arrow in Fig. 8B). Therefore, people with high-level induction
of BSEP relative to CES1 induction, probably with high capacity of metabolizing guggulsterones,
would benefit more in lowering cholesterol. Accordingly, the purified metabolites likely deliver
more favorable hypolipidemic profiles than Z-guggulsterone. The dosage, on the other hand, is
another factor that may influence the hypolipidemic efficacy. The standard dosage (3 x 1000
mg guggul extract/daily) in a random trial increased the VLDL-cholesterol by 6.4%, whereas the
high dosage (3 x 2000 mg/daily) increased it by 9.8%, pointing to the excessive induction of
CES1 [14]. We have shown that CYP3A4 efficiently metabolized Z-guggulsterone (Figs. 4B, 4C
and 5A) and cotransfection of CYP3A4 favors the induction of BSEP but not CES1 (Fig. 6C). A
previous study identified Z-guggulsterone as a potent activator of the pregnane X receptor [30],
a nuclear receptor supporting CYP3A4 induction. Therefore, dosages, even lower than the
standard dosage, likely produce sufficient metabolites with high potency on BSEP induction,
by guest, on June 18, 2018w
ww
.jlr.orgD
ownloaded from
17
thus produce better plasma lipid profiles. It should be noted that Z-guggulsterone also induced
several mouse carboxylesterases (Left of Fig. 7B), however, it remains to be determined
whether these carboxylesterases favor lipid retention or elimination.
The metabolism-based alteration of the biological activity may contribute significantly to the
observed individual variations in guggul hypolipidemic efficacy. In Indian population, the
positive rate in lowering LDL cholesterol is 60-80% [13, 14], whereas the rate in American
population is only 18% [10]. The precise mechanism on the large variations remains to be
determined. In addition to much lower dosing regimen in the India trials, differences in
metabolism likely contribute to the variations as well [31]. Unfortunately, none of the clinical
trials reported the blood concentrations of guggulsterones [10. 14]. We and other investigators
have shown that Z-guggulsterone is a substrate (this study) and an inducer of CYP3A4 [27].
Therefore, the involvement of CYP3A4 in the metabolism presents a major variable for guggul
therapy due to its variants, diverse substrates and altered expression by pathological conditions
and co-administered drugs [21, 32, 33]. People normally consume guggul supplement but not
purified guggulsterones. As a result, other components in the extracts [34] may modulate the
hypolipidemic activity of guggulsterones by acting on the genes relevant to the hypolipidemic
action or the metabolism of guggulsterones.
Z-Guggulsterone, an FXR antagonist, is assumed to down-regulate CYP7A1 through the bile
acid-FXR feedback mechanism. It was surprising that this phytosterol alone down-regulated
CYP7A1 by ~20% (Fig. 1B). It has been reported that primary hepatocytes produced CDCA,
the most potent bile acid in triggering the feedback mechanism [27], at the level (~1 µM) in the
medium comparable to that in normal human plasma [35, 36], suggesting that the feedback
mechanism is operational in primary hepatocytes. The lack of the induction of CYP7A1 by Z-
guggulsterone points to a pathway that overrides the feedback mechanism. While Z-
by guest, on June 18, 2018w
ww
.jlr.orgD
ownloaded from
18
guggulsterone has been shown to modulate the activities of many nuclear receptors, activation
of the pregnane X receptor led to the repression of the CYP7A1 promoter [36, 37]. On the other
hand, treatment with CDCA (10 µM) caused greater CYP7A1 suppression than Z-guggulsterone
(Fig. 1B), and interestingly, the suppression was partially reversed by Z-guggulsterone. These
findings suggest that Z-guggulsterone down-regulates CYP7A1 through both PXR and FXR with
FXR requiring higher presence of bile acids. In addition, Z-guggulsterone and CDCA
synergistically induced BSEP (Fig. 1D), further weakening the feedback mechanism, although it
remains to be ascertained whether and to which extent the feed-back mechanism contributes to
the hypolipidemic activity of Z-guggulsterone.
In summary, our study presents two interplays that likely determine the overall hypolipidemic
activity of guggul (Fig. 7). The first interplay occurs between CES1 induction and the CYP7A1
activity. CES1 induction within the capacity of CYP7A1 favors the synthesis of bile acids and
elimination of cholesterol. Excessive induction of CES1 beyond the capacity of CYP7A1 likely
increases the engagement of this enzyme in the hydrolysis/re-esterification cycle, favoring VLDL
assembly. The second interplay occurs between the metabolism of guggulsterones and the
induction of BSEP/CES1. Increased metabolism enhances BSEP induction and probably
decreases the induction of CES1. It is therefore expected that individuals with higher capacity
of metabolizing guggulsterones (probably lower dosing) will show lower induction of CES1 and
have better hypolipidemic outcomes.
Acknowledgement This work was supported by NIH grants R01GM61988, R01ES07965,
R01DK087755 and F05AT003019. The use of the Core Facility supported by NCRR/NIH (P20
RR016457) was greatly appreciated.
Disclosure The authors have nothing to disclosure.
by guest, on June 18, 2018w
ww
.jlr.orgD
ownloaded from
REFERENCE
1. Buemi, M., C. Aloisi, F. Fulvio, C. Caccamo, E. Cavallaro, E. Crasci, M. Criseo, F. Corica,
and N. Frisina. 2005. Cardiorenal consequences of atherosclerosis and statins therapy: from the
past to the future. Curr. Pharm. Des. 11: 3973-3984.
2. Sundaram, M., and Z. Yao. 2010. Recent progress in understanding protein and lipid factors
affecting hepatic VLDL assembly and secretion. Nutr. Metab (Lond). 7: 35.
3. Wei, E., M. Alam, F. Sun, L.B. Agellon, D.E. Vance, and R. Lehner. 2007. Apolipoprotein B
and triacylglycerol secretion in human triacylglycerol hydrolase transgenic mice. J. Lipid Res.
48: 2597-2606.
4. Wei, E., A.Y. Ben, J.Lyon, H. Wang, R. Nelson, V.W. Dolinsky, J.R. Dyck, G. Mitchell, G.S.
Korbutt, and R. Lehner. 2010. Loss of TGH/Ces3 in mice decreases blood lipids, improves
glucose tolerance, and increases energy expenditure. Cell Metab. 11: 183-193.
5. Blais, D. R., R.K. Lyn K, and M.A. Joyce. 2010. Activity-based protein profiling identifies a
host enzyme carboxylesterase 1 that is differentially active during hepatitis C replication. J. Biol.
Chem. 285: 25602-25612.
6. Zhao, B., R. Natarajan, S. Ghosh. 2005. Human liver cholesteryl ester hydrolase: cloning,
molecular characterization, and role in cellular cholesterol homeostasis. Physiol. Genomics. 23:
304-310.
7. Chiang, J.Y. 2009. Bile acids: regulation of synthesis. J. Lipid Res. 50: 1955-1966.
by guest, on June 18, 2018w
ww
.jlr.orgD
ownloaded from
20
8. Dawson, P.A., T. Lan, and A. Rao. 2009. Bile acid transporters. J. Lipid Res. 50: 2340-2357.
9. Urizar, N.L., and D.D. Moore. 2003. GUGULIPID: a natural cholesterol-lowering agent. Annu.
Rev. Nutr. 23: 303-313.
10. Szapary, P.O., M.L. Wolfe, and L.T. Bloedon. 2003. Guggulipid for the treatment of
hypercholesterolemia: a randomized controlled trial. JAMA. 290, 765-772.
11. Nohr, L.A., L.B. Rasmussen, and Straand J. 2009. Resin from the mukul myrrh tree, guggul,
can it be used for treating hypercholesterolemia? A randomized, controlled study. Complement.
Ther. Med. 17: 16-22.
12. Deng, R., D. Yang, A. Radke, J. Yang, and B. Yan. 2007. Hypolipidemic agent
guggulsterone regulates BSEP expression: dominance of transactivation over FXR-antagonism.
J. Pharmacol. Exp. Ther. 320: 1277-1286.
13. Gopal, K., R.K. Saran, S. Nityanand, P.P. Gupta, M. Hasan, S.K. Das, N. Sinha, S.S.
Agarwal. 1986. Clinical trial of ethyl acetate extract of gum gugulu (gugulipid) in primary
hyperlipidemia. J. Assoc. Physicians India. 34: 249-251.
14. Nityanand, S., J.S. Srivastava, O.P. Asthana. 1989. Clinical trials with gugulipid. A new
hypolipidaemic agent. J. Assoc. Physicians India. 37: 323-328.
by guest, on June 18, 2018w
ww
.jlr.orgD
ownloaded from
21
15. Urizar, N. L., A.B. Liverman, D.T. Dodds, F.V. Silva, P. Ordentlich, Y. Yan, F.J. Gonzalez,
R.A. Heyman, D.J. Mangelsdorf, and D.D. Moore. 2002. A natural product that lowers
cholesterol as an antagonist ligand for FXR. Science 296: 1703-1706.
16. Yang, D., R. Pearce, X. Wang, G. Roger, Y.J.Y. Wan, and B. Yan. 2009. Human
carboxylesterases HCE1 and HCE2: Ontogenic expression, inter-individual variability and
differential hydrolysis of oseltamivir, aspirin, deltamethrin and permethrin. Biochem. Pharmacol.
77: 238-247.
17. Fukami, T., M. Nakajima, T. Maruichi, S. Takahashi, M. Takamiya, Y. Aoki, H.L. McLeod,
and T. Yokoi. 2008. Structure and characterization of human carboxylesterase 1A1, 1A2, and
1A3 genes. Pharmacogenet. Genomics 18: 911-920.
18. Shi, D., J. Yang, D. Yang, E.L. LeCluyse, C. Black, L. You, F. Akhlaghi, and B. Yan. 2006.
Anti-influenza prodrug oseltamivir is activated by carboxylesterase HCE1 and the activation is
inhibited by anti-platelet agent clopidogrel. J. Pharmacol. Exp. Ther. 319: 1477-1484.
19. Shi, D., D. Yang, E.P. Prinssen, B.E. Davies, and B. Yan. 2011. Surge in expression of
carboxylesterase-1 during the post-natal stage enables a rapid gain of the capacity to activate
the anti-influenza prodrug oseltamivir. J. Infect. Dis. 203: 937-942.
20. Perloff, E. S., A.K. Mason, S.S. Dehal, A.P. Blanchard, L. Morgan, T. Ho, A. Dandeneau,
R.M. Crocker, C.M. Chandler, N. Boily, C.L. Crespi, and D.M. Stresser. 2009. Validation of
cytochrome P450 time-dependent inhibition assays: a two-time point IC50 shift approach
facilitates kinact assay design. Xenobiotica 39: 99-112.
by guest, on June 18, 2018w
ww
.jlr.orgD
ownloaded from
22
21. Shi, D., D. Yang, and B. Yan, B. 2010. Dexamethasone transcriptionally increases the
expression of the pregnane X receptor and synergistically enhances pyrethroid deltamethrin in
the induction of cytochrome P450 3A23. Biochem. Pharmacol. 80: 1274-1283.
22. Yang, D., Y. Li, X. Yuan, L. Matoney, B. Yan. 2001. Regulation of rat carboxylesterase
expression by 2,3,7,8-tetrachlorodibenzo-p-dioxin (TCDD): a dose–dependent decrease in
mRNA levels but a biphasic change in protein levels and activity. Toxicol Sci. 64: 20-27.
23. Liu, F., D. Yang, X. Song, R. Deng, and B. Yan. 2008. The far and distal enhancers in the
CYP3A4 gene coordinates the proximal promoter in responding to the pregnane X receptor
similarly but differentially to hepatocyte nuclear factor-4α. Biochem. J. 409: 243-250.
24. Yang, D., D. Shi, J. Yang, R. Deng, and B. Yan. 2011. Scoparone potentially transactivates
the bile salt export pump gene and the potentiation is enhanced by cytochrome P450 1A2 but
inhibited by protein kinase C inhibitor. Brit. J. Pharmacol. 16: 1547-1557.
25. Zhu, W., L. Song, H. Zhang, L. Matoney, E. LeCluyse, and B. Yan. 2000. Dexamethasone
differentially regulates the expression of carboxylesterase genes in humans and rats. Drug
Metab. Dispos. 28: 186-91.
26. Cui, J., L. Huang, A. Zhao, J.L. Lew, J. Yu, S. Sahoo, P.T. Meinke, L. Royo, F. Pelaez, and
S.D. Wrigh. 2003. Guggulsterone is a farnesoid X receptor antagonist in coactivator association
assays but acts to enhance transcription of bile salt export pump. J Biol Chem. 278: 10214-
10220.
by guest, on June 18, 2018w
ww
.jlr.orgD
ownloaded from
23
27. Ellis, E., M. Axelson, A. Abrahamsson, G. Eggertsen, A. Thörne, G. Nowak, B.G. Ericzon, I.
Björkhem, C. Einarsson. 2003. Feedback regulation of bile acid synthesis in primary human
hepatocytes: evidence that CDCA is the strongest inhibitor. Hepatology. 38: 930-8.
28. Parkinson, A. (2001) Biotransformation of xenobiotics, in Klaassen, C.D. the Casarett &
Doull’s Toxicology, the Basic Science of Poisons McGraw-Hill, New York, pp 139-162.
29. Holmes, R., M. Wright, S. Laulederkind, L. Cox, M. Hosokawa, T. Imai, S. Ishibashi, R.
Lehner, M. Miyazaki, P. Potter, M. Redinbo, J. Robert, T. Satoh, T. Yamashita , B. Yan, T.
Yokoi, R. Rudolf Zechner, and L. Maltais. (2010) Recommended Nomenclature for Five
Mammalian Carboxylesterase Gene Families: Human, Mouse and Rat Genes and Proteins.
Mammalian Genome. 21: 427-441.
30. Ding, X., and J.L. Staudinger. 2005. The ratio of constitutive androstane receptor to
pregnane X receptor determines the activity of guggulsterone against the Cyp2b10 promoter. J.
Pharmacol. Exp. Ther. 314: 120-127.
31. Ingelman-Sundberg, M., S.C. Sim, A. Gomez, and C. Rodriguez-Antona. 2007. Influence of
cytochrome P450 polymorphisms on drug therapies: pharmacogenetic, pharmacoepigenetic
and clinical aspects. Pharmacol. Ther. 116: 496-526.
32. Keshava, C., E.C. McCanlies, and A. Weston. 2004. CYP3A4 polymorphisms--potential risk
factors for breast and prostate cancer: a HuGE review. Am. J. Epidemiol. 160: 825-841.
by guest, on June 18, 2018w
ww
.jlr.orgD
ownloaded from
24
33. Martinez-Jimenez, C. P., R. Jover, M.T. Donato, J.V. Castell, and M.J. Gomez-Lechon.
2007. Transcriptional regulation and expression of CYP3A4 in hepatocytes. Curr. Drug Metab.
8: 185-194.
34. Yu, B. Z., R. Kaimal, S. Bai, K.A. El Sayed, S.A. Tatulian, R.J. Apitz, M.K. Jain, R. Deng,
and O.G. Berg. 2009. Effect of guggulsterone and cembranoids of Commiphora mukul on
pancreatic phospholipase A(2): role in hypocholesterolemia. J Nat Prod. 72: 24-28.
35. Ellis, E.C.S. 2006. Suppression of bile acid synthesis by thyroid hormone in primary human
hepatocytes. World J. Gastroenterol. 12: 4640-4645.
36. Xiang, X., Y. Han, M. Neuvonen, J. Laitila, P.J. Neuvonen, M. Niemi. 2010. High per-
formance liquid chromatography-tandem mass spectrometry for the determination of bile acid
concentrations in human plasma. J Chromatogr B Analyt Technol Biomed Life Sci. 878: 51-60.
37. Owsley, E., and J.Y. Chiang. 2003. Guggulsterone antagonizes farnesoid X receptor
induction of bile salt export pump but activates pregnane X receptor to inhibit cholesterol
7alpha-hydroxylase gene. Biochem. Biophys. Res. Commun. 304: 191-195.
by guest, on June 18, 2018w
ww
.jlr.orgD
ownloaded from
25
Table I. Sequences of primers for reporter constructs Primer Sequence Reporter CES1A1-21XhoIa 5’-tcggggcctgcgaggtctcttgcagttca-3’ all promoter reporters CES1A1-7713MluIs 5’-taaggtggatggattacctgaggtcaggagt-3’ CES1A1-7714Luc CES1A1-6980MluIs 5’-ttgcatgtcaaagtgtcagaatggagaaat-3’ CES1A1-6981Luc CES1A1-3582MluIs 5’-ttattgcttacagctgaagtg-3’ CES1A1-3582Luc CES1A1-3432MluIs 5’-tcaggcaaaacctaggagtgg-3’ CES1A1-3432Luc CES1A1-2931MluIs 5’-tccagcctgcacgtggctaga-3’ CES1A1-2932Luc CES1A1-4777a 5’-catagctagccaccctcaatggcgcaaaca-3’ 1A19622 & 9332Luc CES1A1-9622MluIs 5’-tgacacgcgtaccaactcagtccagattcccccagggcag-3’ CES1A1-9622Luc CES1A1-9332MluIs 5’-tgacacgcgtaagagctcgctgtgctccatgaatggggtg-3’ CES1A1-9332Luc
by guest, on June 18, 2018w
ww
.jlr.orgD
ownloaded from
26
Figure legends
Fig. 1. Effect of Z-guggulsterone on the expression of CES1, CYP7A1 and BSEP (A)
Chemical structure of Z-guggulsterone (B-D) Regulated expression in human primary
hepatocytes Hepatocytes (n = 4-8) were treated with Z-guggulsterone (10 μM), CDCA (10 μM)
or both for 24 h and DMSO (0.1%) was used as the control. The mRNA levels of CES1,
CYP7A1, BSEP, GAPDH or polymerase II by Taqman probes. Columns labeled with a different
letter were statistically significant (p < 0.05). To determine the changes in the protein level,
lysates (0.5 µg for CES1 and 20 µg for CYP7A1 or BSEP) from pooled samples (n = 4) were
resolved by 7.5% SDS-PAGE and transferred electrophoretically to nitrocellulose membranes.
The blots were incubated with an antibody against CYP7A1, CES1 or BSEP and developed with
chemiluminescent substrate and re-probed by GAPDH antibody. The signal was captured by
Carestream 2200 PRO Imager.
Fig. 2. Stimulation of the CES1A1 promoter (A) Concentration-dependent induction of CES1
and BSEP Huh7 cells were treated with Z-guggulsterone (Gugg) at various concentrations (0-20
µM) for 24 h and the levels of CES1 and BSEP mRNA were determined as described above.
An asterisk sign indicates statistical significance of a treatment over solvent control and an
alpha sign indicates statistical significance between two columns linked by a line (p < 0.05). (B)
Effect of actinomycin D on the induction Huh7 cells were treated with Z-guggulsterone (5 μM)
for 24 h in the absence or presence of actinomycin D (1 μM), and the levels of CES1 and BSEP
mRNA were determined. An asterisk sign indicates statistical significance of a treatment over
solvent control (p < 0.05). (C) Activation of CES1A1 reporters Huh7 cells were seeded in 48-
well plates. After an overnight incubation, the cells were transfected with a reporter (50 ng)
along with 5 ng of the null-Renilla luciferase plasmid. The transfected cells were treated with Z-
guggulsterone (10 μM) or the same volume of DMSO for 24 h. Luciferase activities were
by guest, on June 18, 2018w
ww
.jlr.orgD
ownloaded from
27
determined with a Dual-Luciferase Reporter Assay System. Data in this figure are from three
separate experiments.
Fig. 3. Characterization of CES1A1 guggulsterone element (A) Stimulation of the CES1A1
and BSEP element reporters Reporter assays were performed as described above but with
element reporters. An asterisk sign indicates statistical significance of a treatment over solvent
control and an alpha sign indicates statistical significance between two columns linked by a line
(p < 0.05). (B) EMSA analysis Nuclear extracts (5 μg) from Huh7 cells treated with Z-
guggulsterone (10 μM) were incubated with a biotinylated probe (0.01 pmol) for 20 min. In the
competition assay, nuclear extracts were pre-incubated with the unlabeled probe or mutant at
50x (+) or 100x (++) excess for 20 min, and then incubated with the biotinylated probe. The
protein-DNA complexes were electrophoretically resolved and detected with streptavidin-
conjugated horseradish peroxidase and chemiluminescent substrate.
Fig. 4. Metabolism of Z-guggulsterone (A) Chromatograms generated by pooled human liver
microsomes The incubations were performed at 37°C in a total volume of 100 μl containing
pooled human liver microsomes (20 μg) and Z-guggulsterone (10 μM) in the presence of NRS.
The incubations lasted for 90 min. The elution trace was generated at 240 nm by injecting 20 μl
supernatants. (B) Inhibited metabolism of Z-guggulsterone Z-guggulsterone (10 μM) was
metabolized by microsomes (20 μg) in the presence or absence of a CYP inhibitor: 50 μM
furafylline, 100 μM pilocarpine, 75 μM thio tepa A, 10 μM quercetin, 20 μM sulfaphenazole, 1
μM ticlopidine, 10 μM quinidine, 100 μM chlormethiazole or 1 μM ketoconazole. The reactions
lasted for 40 min. The disappearance of Z-guggulsterone was monitored. The percentage of
inhibition was calculated. (C) Metabolism by recombinant CYPs The incubations were
by guest, on June 18, 2018w
ww
.jlr.orgD
ownloaded from
28
performed with a recombinant CYP (1 pmol) and Z-guggulsterone (10 μl) for 40 min. All
experiments were conducted twice with each being in triplicate.
Fig. 5. Analyses of metabolites by HPLC and LC-MS (A) Time-course metabolism by
CYP3A4 The incubations were performed at 37°C with 1 pmol CYP3A4 and 10 μM Z-
guggulsterone for 0-120 min. The HPLC elution trace was generated at 240 nm. B, C, D and E
represent the HPLC chromatogram and full scan of metabolite M1, M2, M3 and M4,
respectively.
Fig. 6. Functional characterization of the metabolites (A) Differential induction of CES1 and
BSEP Huh7 cells were treated with Z-guggulsterone (2 μM) or a metabolite (2 μM) for 24 h.
The mRNA levels of CES1 and BSEP were determined. An asterisk sign indicates statistical
significance of a metabolite over Z-guggulsterone and an alpha sign indicates statistical
significance between two columns linked by a line (p < 0.05). (B) Differential activation of CES1
and BSEP element reporters Huh7 cells were seeded in 48-well plates. After an overnight
incubation, the cells were transfected with a reporter (50 ng) along with 5 ng of the null-Renilla
luciferase plasmid. The transfected cells were treated with Z-guggulsterone (2 μM), a
metabolite (2 μM), or the same volume of DMSO for 24 h. The reporter luciferase activities
(firefly) were normalized according to the null-Renilla luciferase activities. An asterisk sign
indicates statistical significance of a metabolite over Z-guggulsterone and an alpha sign
indicates statistical significance between two columns linked by a line (p < 0.05). (C) Effect of
CYP3A4 on the induction of CES1 and BSEP Huh7 cells were seeded in 24-well plates at a
density of 1.5 x 10⁵ and cultured for overnight. The cells were transfected with a CYP3A4
expression construct or the corresponding vector (0.5 µg). The transfected cells were cultured
for 24 h and then treated with Z-guggulsterone at 5 μM for 24 h. Total RNA was isolated and
by guest, on June 18, 2018w
ww
.jlr.orgD
ownloaded from
29
analyzed for the levels of CES1 and BSEP mRNA. The data were collected from three separate
experiments. *Statistically significant (p < 0.05).
Fig. 7. Effect of Z-guggulsterone, CDCA and both on the expression of mouse bsep, and
cyp7a1 and esterase activity staining (A) Expression of mouse bsep and cyp7a1 Mouse
primary hepatocytes (n = 3) were treated with Z-guggulsterone (10 μM), CDCA (10 μM) or both
for 24 h and DMSO (0.1%) was used as the control. Lysates (25 µg) were resolved by 7.5%
SDS-PAGE and transferred electrophoretically to nitrocellulose membranes. The blots were
incubated with an antibody against bsep or cyp7a1 and developed with chemiluminescent
substrate and re-probed by GAPDH antibody. The signal was captured by Carestream 2200
PRO Imager. (B) Non-denaturing electrophoresis stained for hydrolytic activity Mouse primary
hepatocytes and human HepG2 cells were treated as described above. Lysates from mouse
hepatocytes (5 µg) or Huh7 cells (20 µg) were subjected to native gel electrophoresis and
stained for esterase activity with 1-naphythalacetate as described in the section of Experimental
Procedures. CES* denotes a glycosylation variants. The staining intensity was captured by
Carestream 2200 PRO Imager.
Fig. 8. Response elements and interplays among CES1, BSEP and CYP7A1 (A) CES1A1
and BSEP guggulsterone response elements The anti-oxidant response elements (ARE) are
shown in italic whereas the activator protein-1 site (AP-1) are in bold. (B) Multiple interplays
among metabolism, CES1/BSEP induction, lipid retention and bile acid synthesis The arrows
point to the targets that an enzyme or a compound acts on or is converted into. When two
arrows points to the same target, the solid line denotes major effect whereas the dotted line
denotes minor effect. Double-lined arrow denotes an increased role when the induction of
CES1 exceeds the capacity of bile acid synthesis.
by guest, on June 18, 2018w
ww
.jlr.orgD
ownloaded from
30
Fig. 1. Yang et al. (2010)
A
O
O
Z-Guggulsterone
D
05
101520
c
a bb
BSEP
GAPDH
CDCA (10 µM) - + - + Gugg (10 µM) - - + +
BSE
Pm
RN
A
C
B
CYP7A1
GAPDH
0
0.8
1.6
CYP
7A1
mR
NA
CDCA (10 µM) - + - + Gugg (10 µM) - - + +
ba aa
0
1.4
2.8b
a
ba
CES
1 m
RN
A
CDCA (10 µM) - + - + Gugg (10 µM) - - + +
CES1
GAPDH
by guest, on June 18, 2018w
ww
.jlr.orgD
ownloaded from
31
Fig. 2. Yang et al. (2010)
1A1 (-9622)
1A1 (-9332)
1A1 (-7714)
1A1 (-6981)
1A1 (-3432)
1A1 (-2932)
1A1 (-3582)
CES1A1 luciferase reporters 0 2 4 6 8
CES1A1 promoterreporters
Fold activation
C
02468
CES1BSEP
* *
Rel
ativ
e m
RN
A
Gugg (5 µM) - + - + Act D (1 µM) - - + +
B
A
0
7
14
0 0.5 1 5 10 20
CES1BSEP
Fold
indu
ctio
n µM Gugg
RT-qPCR (Huh7)
**
* **** * * *
αα
by guest, on June 18, 2018w
ww
.jlr.orgD
ownloaded from
32
Fig. 3. Yang et al. (2010)
B
Extract - + + + + +
Competitor - - + ++ - -
Mutant - - - - + ++
Shifted band
Wild-type CACAATCTGCAGAGTCATCATGAAG Mutant CACAATGTACTGAGGAATCATGAAG
A
BSEP: TCCAAGGTGAATCAGCAATT
BSEPGugg-Luc
CES1A1: CACAATCTGCAGAGTCATCATGAAG
CES1A1Gugg-Luc
0
5
10
15
20
25CES1A1BSEP
Gugg (µM) 0 1 5 10 20 Fo
ld a
ctiv
atio
n * *
*
*
*
*
*α α
α
by guest, on June 18, 2018w
ww
.jlr.orgD
ownloaded from
33
Fig. 4. Yang et al. (2010)
C
B
A
Abs
orba
nce
(mA
U) NRS(-) Gugg (G)
NRS(+)
M1M3
M4 G M2
Inhi
bitio
n (%
)
0
40
80
120
Fura Pilo Thio Quer Sulf Ticl Quin Chlo Keto
Pooled Microsomes + Inhibition
Gug
g m
etab
olis
m
(pm
ol/p
mol
P45
0/m
in)
0
300
600
900
1A2 2A6 2B6 2C8 2C9 2C19 2D6 2E1 3A4
Individual recombinant CYP
by guest, on June 18, 2018w
ww
.jlr.orgD
ownloaded from

34
Fig. 5. Yang et al. (2010)
A Guggulsterone + CYP3A4
Abs
orba
nce
(mA
U)
90 min
120 min
0 min
60 min
30 min
M1 M3
M4 G M2
B
M1: HPLC
M1: full scan m/z: 345
400
800
0
1200
1600
320 300 360 340
E
M4: HPLC
M1: full scan m/z: 329
400
800
0
1200
1600
320 300 360 340
C
M2: HPLC
M1: full scan m/z: 329
140
70
0
210
280
320 300 360 340
M3: HPLC
M1: full scan m/z: 329
D
800
1600
0
2400
3200
320 300 360 340
by guest, on June 18, 2018w
ww
.jlr.orgD
ownloaded from
35
Fig. 6. Yang et al. (2010)
C
0
5
10
CES1 BSEP
Vector 3A4
Fold
indu
ctio
n *
RT-qPCR
A
Fold
indu
ctio
n
0
4
8
12
Gugg M1 M3 M4
CES1BSEP
RT-qPCR
α
α
α
*
*
* *
B
0
4
8
12
Gugg M1 M3 M4
CES1A1 BSEP
Element reporters
Fold
act
ivat
ion
* *
*
* *
* α
by guest, on June 18, 2018w
ww
.jlr.orgD
ownloaded from
36
Fig. 7. Yang et al. (2011)
Staining Mouse esterase
Ces1d Ces?
Ces1e
Ces2e
Ces?
Ces?
Ces2c
Ces?
1 2 3 4
1 = Vehicle, 2 = CDCA (10 µM), 3 = Gugg (10 µM), 4 = both
0
200
400
Inte
nsity
1 2 3 4
CES1
CES2
CES1*
Staining Human esterase
A
B
Bsep
Gapdh
Mouse primary hepatocytes 1.00 1.05 2.28 2.32 (n = 3)
Cyp7a1
Gapdh
CDCA (10 µM) - + - + Gugg (10 µM) - - + +
1.00 1.01 0.99 1.08 (n = 3)
by guest, on June 18, 2018w
ww
.jlr.orgD
ownloaded from
37
Fig. 8. Yang et al. (2011)
BSEP
Cholesterol esters
Cholesterol
Bililary secretion
CYP7A1
Bile acids
Guggulsterone
Hydroxylated metabolites
Phase II & elimination
CES1
Hydrolysis/re-esterification
Lipid retention
Z-Guggulsterone response elements
BSEP: TCCAAGGTGAATCAGCAATT
ARE
AP-1
CES1A1: CACAATCTGCAGAGTCATCATGAAG
ARE
AP-1
A
B
by guest, on June 18, 2018w
ww
.jlr.orgD
ownloaded from