Embed Size (px)
Citation preview
Hypothesis Testing
Math 1680
Overview
IntroductionOne-Sample z Tests and t TestsTwo-Sample z TestsChi-Squared TestsSummary
Introduction
Very often, we can model a chance process and use that model to predict resultsSometimes we get a result that seems far
off of the predictionAn important question is how likely the
observed result would be if the chance model was correct
Hypothesis tests offer an answer
Introduction
In a hypothesis test, an observed result is compared with the expected result from an appropriate chance modelWe assume that the chance model is
correct Null hypothesis, or H0
Usually want to reject the null hypothesis in favor of some alternative explanation
One-Sample z Tests and t Tests
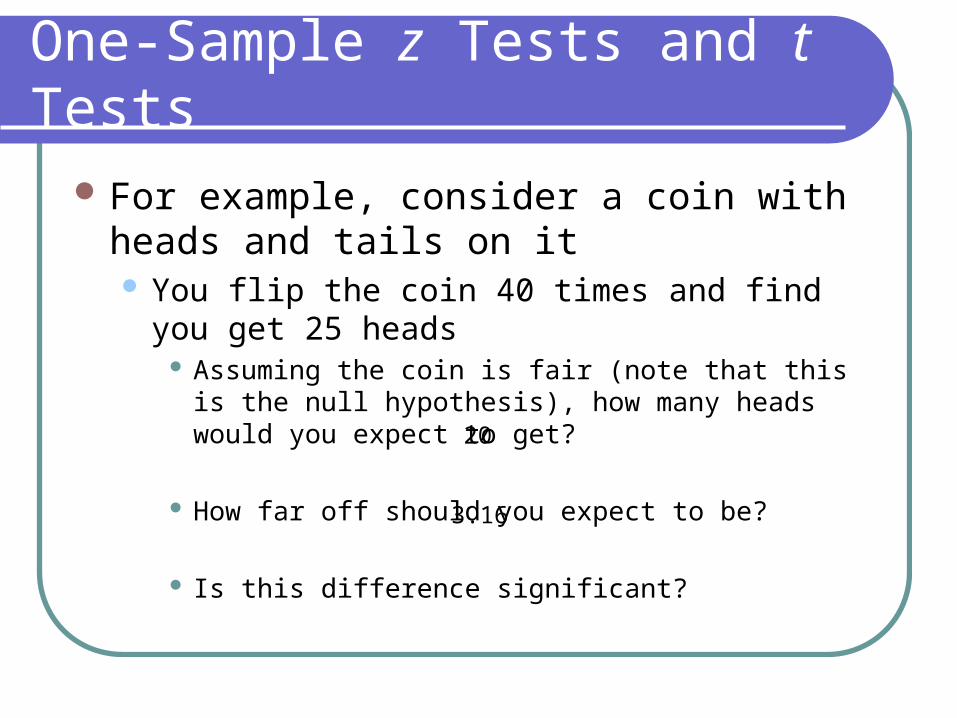
For example, consider a coin with heads and tails on it You flip the coin 40 times and find you get 25 heads
Assuming the coin is fair (note that this is the null hypothesis), how many heads would you expect to get?
How far off should you expect to be?
Is this difference significant?
20
3.16
One-Sample z Tests and t Tests
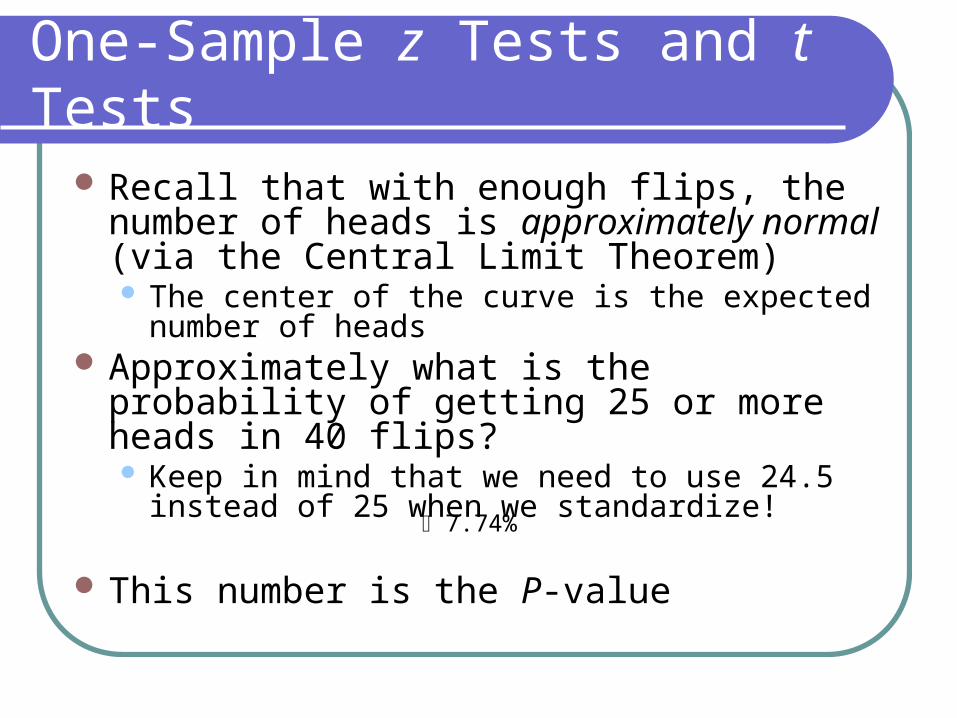
Recall that with enough flips, the number of heads is approximately normal (via the Central Limit Theorem) The center of the curve is the expected number of
heads Approximately what is the probability of getting
25 or more heads in 40 flips? Keep in mind that we need to use 24.5 instead of
25 when we standardize!
This number is the P-value 7.74%
One-Sample z Tests and t Tests
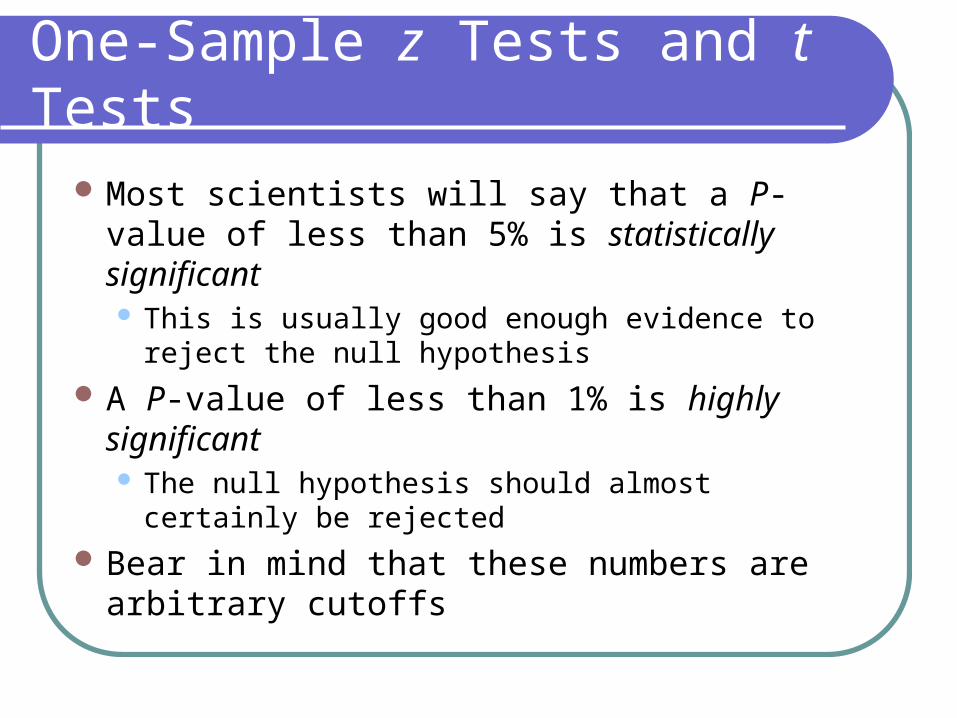
Most scientists will say that a P-value of less than 5% is statistically significant This is usually good enough evidence to reject the
null hypothesis
A P-value of less than 1% is highly significant The null hypothesis should almost certainly be
rejected
Bear in mind that these numbers are arbitrary cutoffs
One-Sample z Tests and t Tests
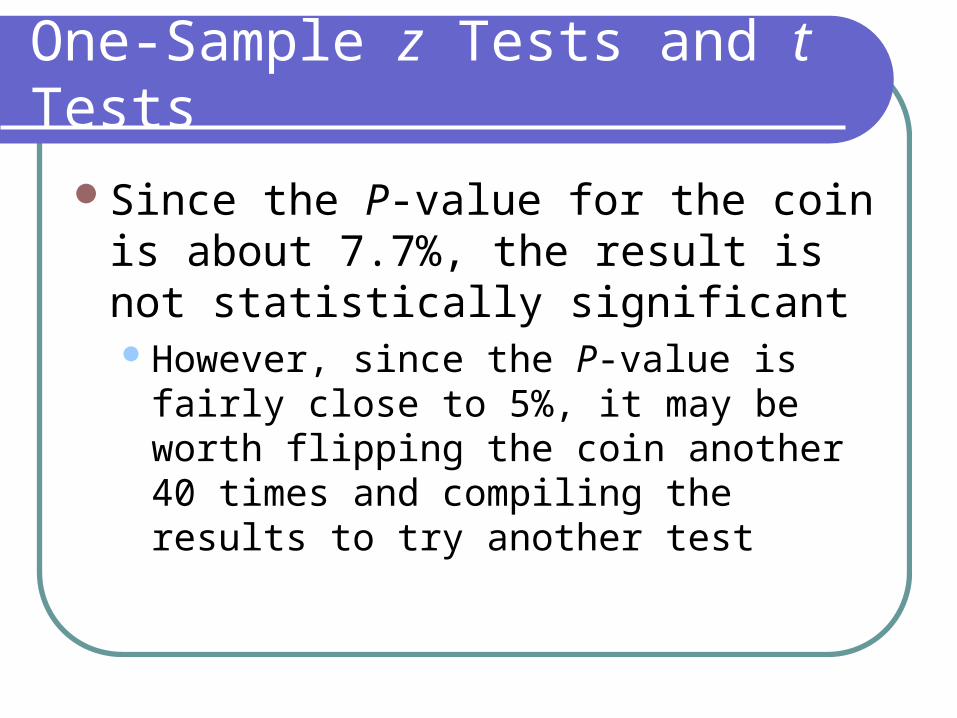
Since the P-value for the coin is about 7.7%, the result is not statistically significantHowever, since the P-value is fairly close to
5%, it may be worth flipping the coin another 40 times and compiling the results to try another test
One-Sample z Tests and t Tests
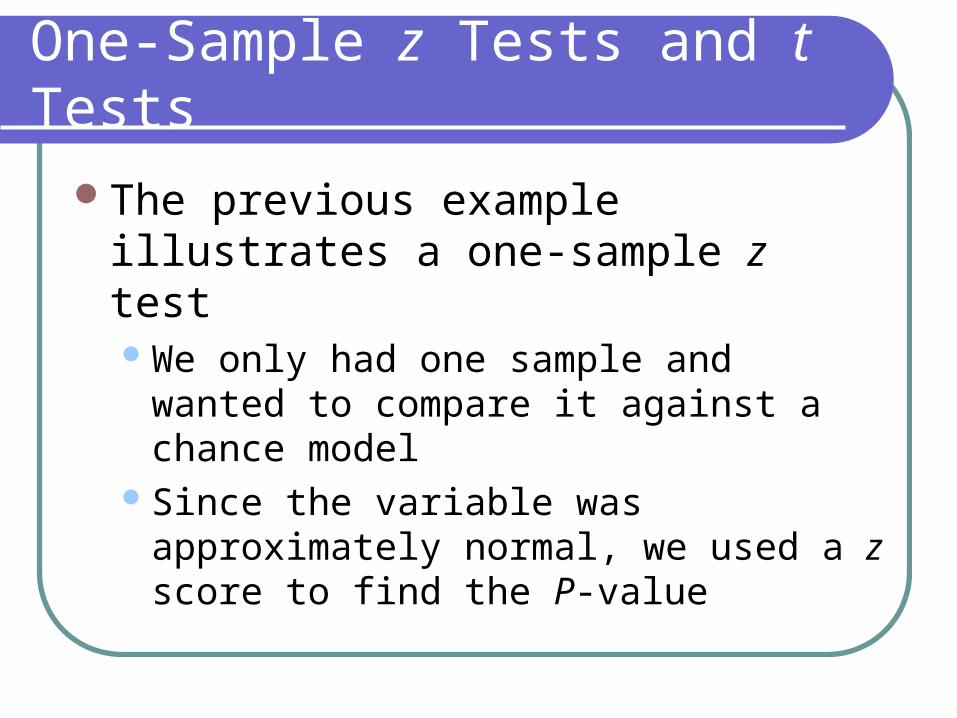
The previous example illustrates a one-sample z testWe only had one sample and wanted to
compare it against a chance modelSince the variable was approximately
normal, we used a z score to find the P-value
One-Sample z Tests and t Tests
We were comparing the null hypothesis of flipping a fair coin to the alternative that the coin was biased in favor of headsWe were only looking at the right tail of the
curve (one-tailed)We could also compare against the coin
being biased in either directionWe would then look at both tails (two-tailed)
One-Sample z Tests and t Tests
To perform a one-sample z test on the result of an experiment… State the null hypothesis and an alternative
hypothesis Compute the expected value and standard error for
the result using the model from the null hypothesis Use a normal approximation to find the P-value
If the P-value is less than 5%, the result is significant enough to reject the null hypothesis
One-Sample z Tests and t Tests
In many cities, chlorine is added to drinking water to remove microbes A typical recommended concentration is 3ppm (parts per million)
A reservoir technician wants to determine if the chlorine concentration is low enough to warrant adding more to the water She takes 50 samples from the reservoir outlet and measures the
concentration She finds that the average concentration is 2.6ppm with an SD of 0.9ppm
State the null hypothesis and the alternate hypothesis, and find the P-value for the observation Should the technician restock the reservoir?
H0: The reservoir already has enough chlorine in it.HA: The reservoir needs more chlorine.P 0.1%, the reservoir should be restocked.

One-Sample z Tests and t Tests
Sometimes our sample is too small to justify a normal approximationAn engineer working for a steel
manufacturer wants to determine the strength of the steel beams the company produces
He places 10 steel bars in a machine and pulls them until they deform
If the sample is too small, you cannot use a z test to check the result!
One-Sample z Tests and t Tests
Instead, we use a t testA t distribution with m degrees of freedom is
used in place of the normal curveThe degrees of freedom will be the number of
measurements – 1 in this contextThe distribution can be found on page A-
106 of the text
One-Sample z Tests and t Tests
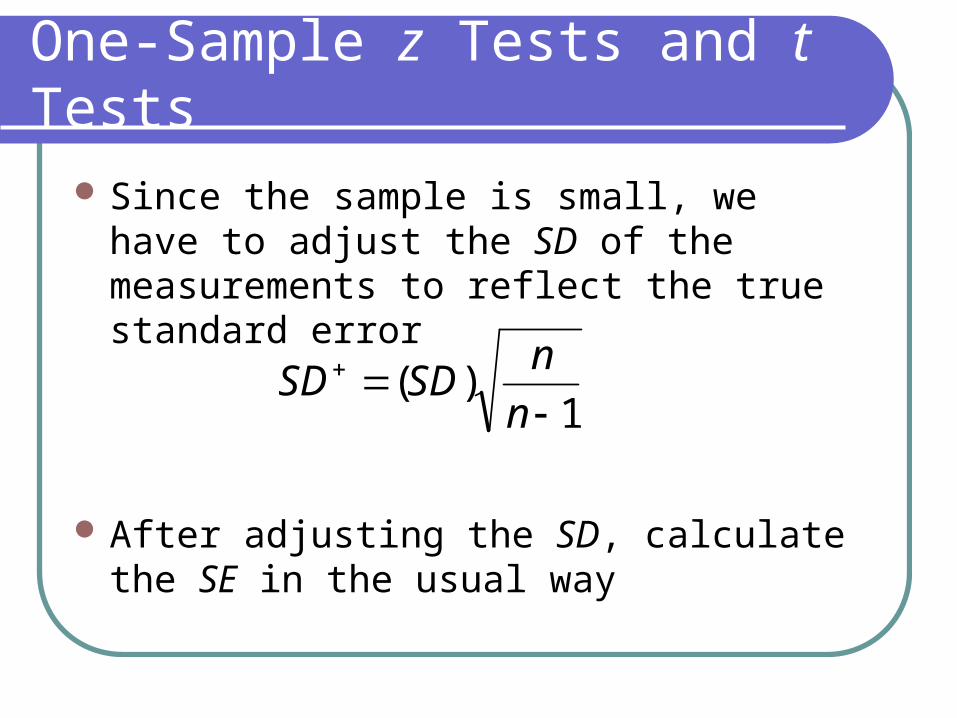
Since the sample is small, we have to adjust the SD of the measurements to reflect the true standard error
After adjusting the SD, calculate the SE in the usual way
1)(
n
nSDSD
One-Sample z Tests and t Tests
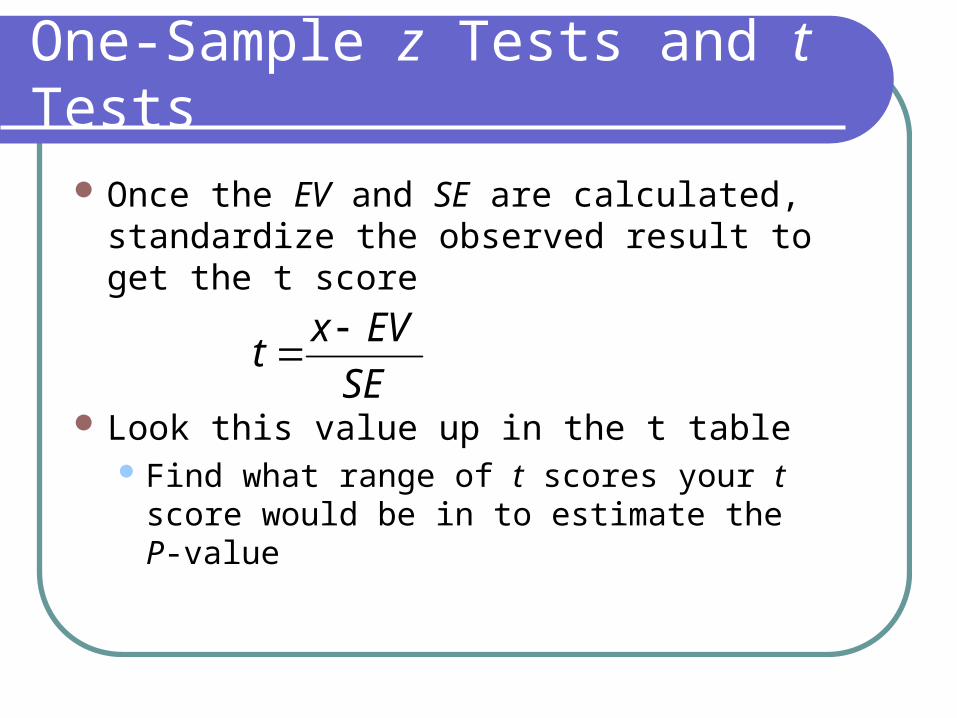
Once the EV and SE are calculated, standardize the observed result to get the t score
Look this value up in the t table Find what range of t scores your t score
would be in to estimate the P-value
SE
EVxt
One-Sample z Tests and t Tests
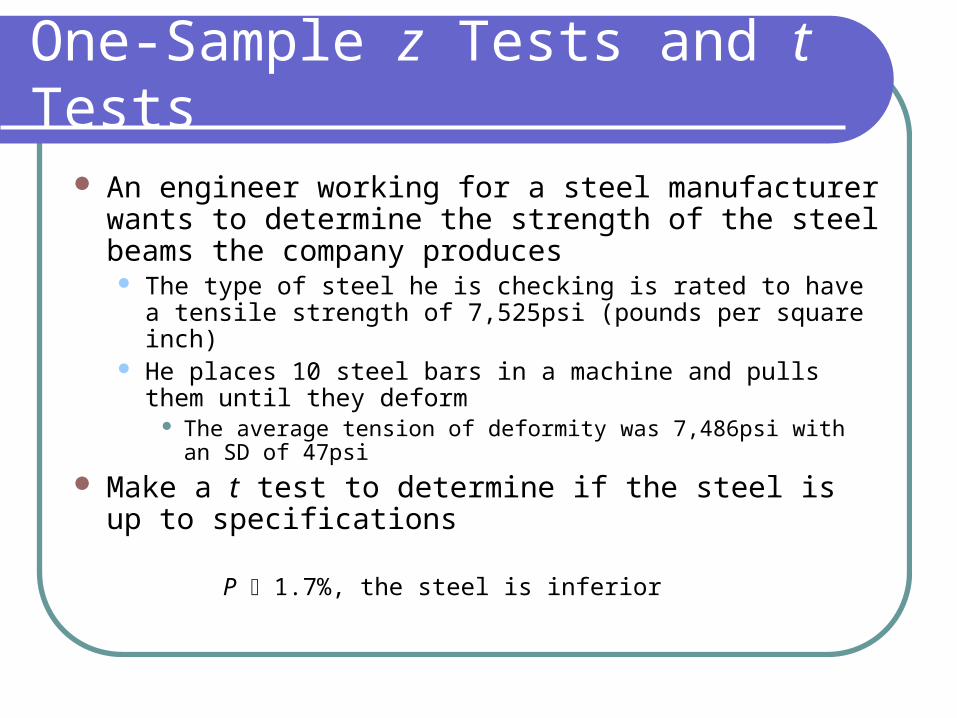
An engineer working for a steel manufacturer wants to determine the strength of the steel beams the company produces The type of steel he is checking is rated to have a tensile
strength of 7,525psi (pounds per square inch) He places 10 steel bars in a machine and pulls them until they
deform The average tension of deformity was 7,486psi with an SD of
47psi
Make a t test to determine if the steel is up to specifications
P 1.7%, the steel is inferior

One-Sample z Tests and t Tests
An engineer working on an aerial launch guided missile is testing the missile’s accuracy His goal is for the missile to strike within 10m of its
target Because each missile costs $2 million, the engineer
only gets to test-fire five missiles The missiles strike at distances 9.2m, 10.4m, 11.7m,
9.6m, and 10.2m
Are the missiles ready for mass production?
P 63%, the missiles are good enough
Two-Sample z Tests
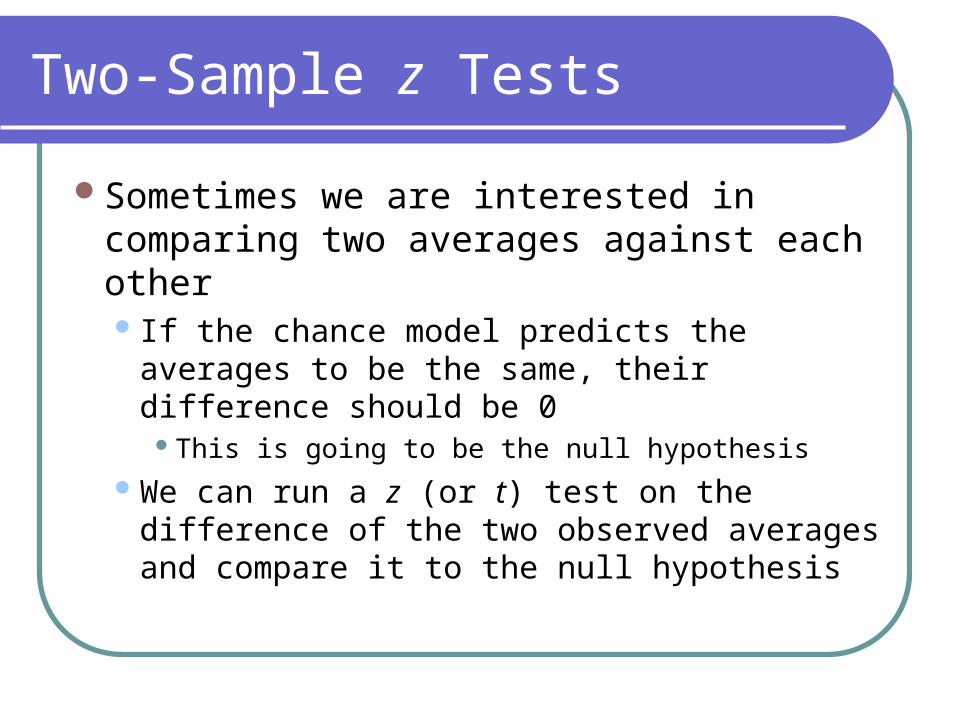
Sometimes we are interested in comparing two averages against each other If the chance model predicts the averages
to be the same, their difference should be 0This is going to be the null hypothesis
We can run a z (or t) test on the difference of the two observed averages and compare it to the null hypothesis
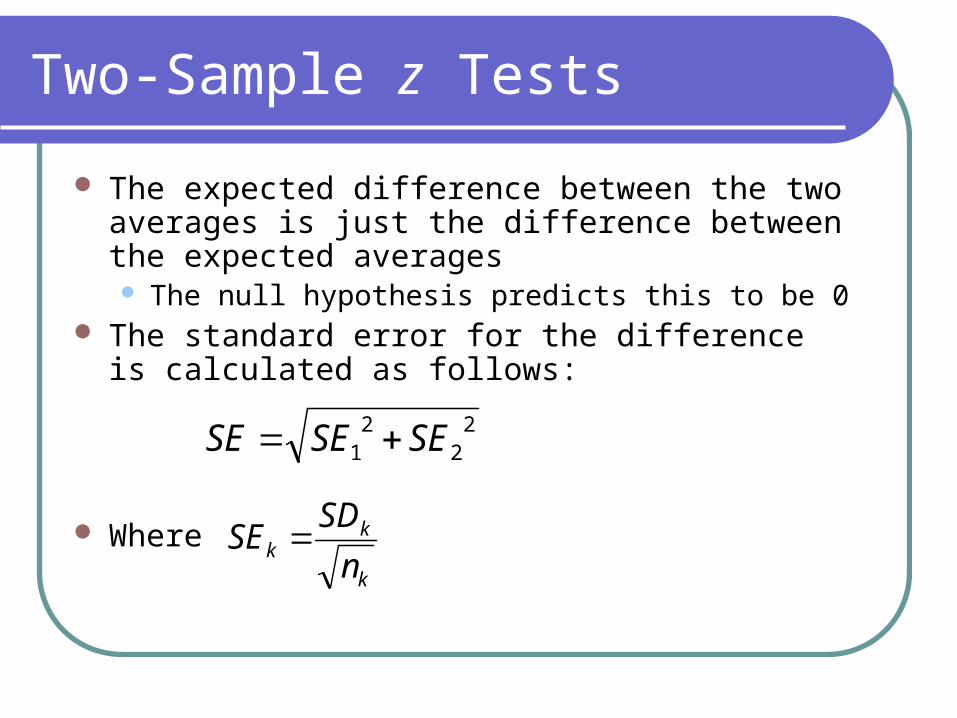
Two-Sample z Tests
The expected difference between the two averages is just the difference between the expected averages The null hypothesis predicts this to be 0
The standard error for the difference is calculated as follows:
Where
22
21 SESESE
k
kk
n
SDSE
Two-Sample z Tests
To perform a two-sample z test, standardize the observed difference according to the expected value and standard error for the difference to get the z scoreThen look the z score up in the normal table
to find the P-value
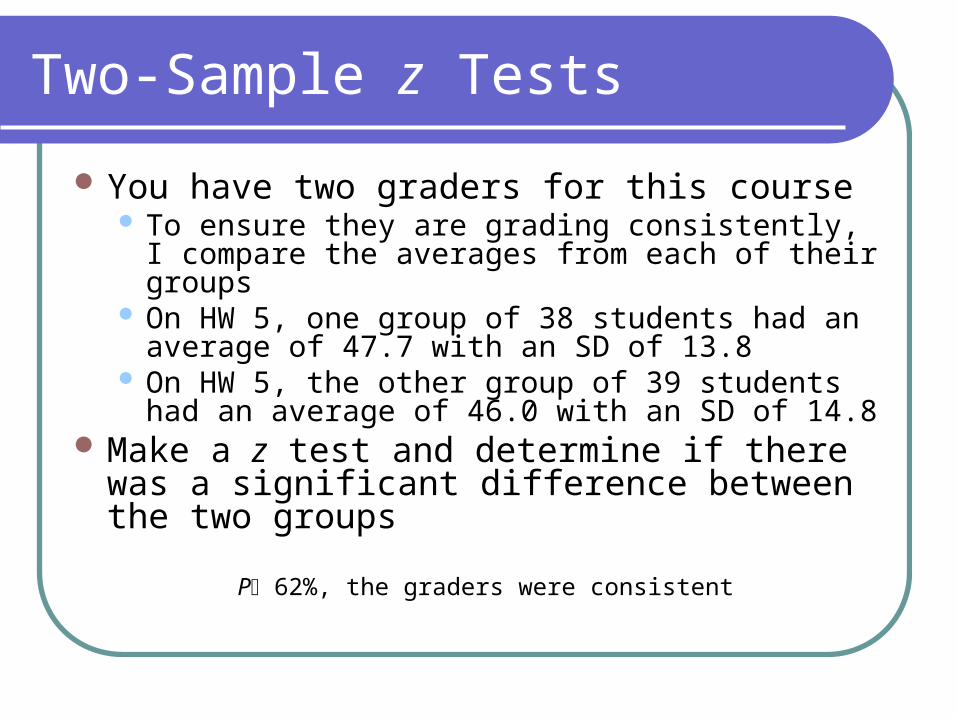
Two-Sample z Tests
You have two graders for this course To ensure they are grading consistently, I compare
the averages from each of their groups On HW 5, one group of 38 students had an
average of 47.7 with an SD of 13.8 On HW 5, the other group of 39 students had an
average of 46.0 with an SD of 14.8 Make a z test and determine if there was a
significant difference between the two groups
P 62%, the graders were consistent
Two-Sample z Tests
Another useful property of two-sample z tests is that they can be used to determine the significance of the difference between treatment and control groups in studies This is how we know if the studies from Chapter 1
and 2 show statistically significant results Compare the treatment group’s
average/percentage to that of the control group
Two-Sample z Tests
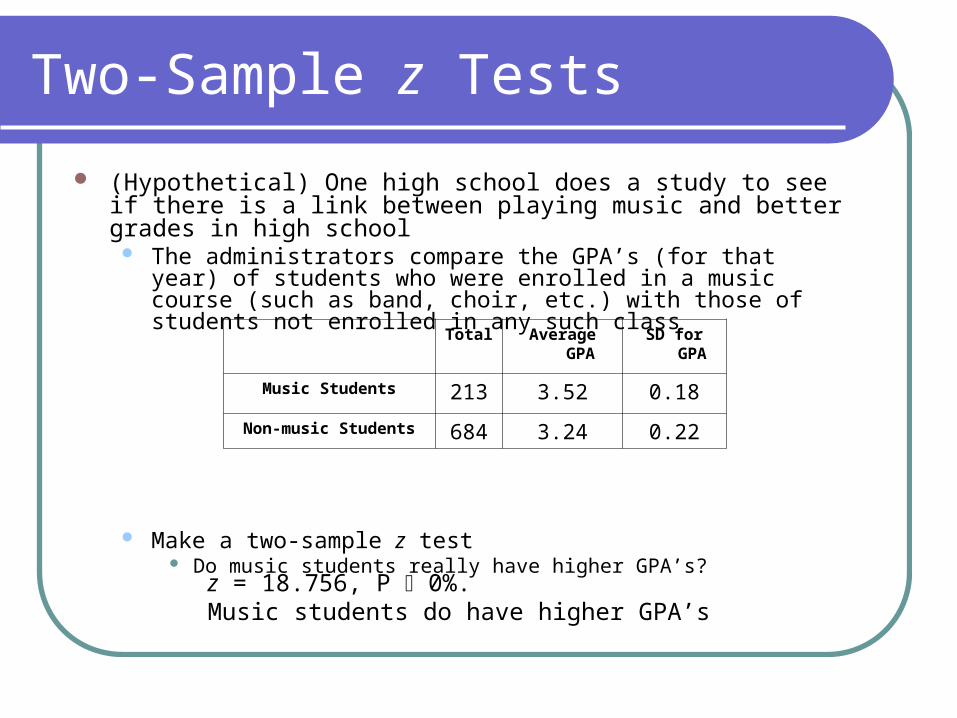
(Hypothetical) One high school does a study to see if there is a link between playing music and better grades in high school
The administrators compare the GPA’s (for that year) of students who were enrolled in a music course (such as band, choir, etc.) with those of students not enrolled in any such class
Make a two-sample z test Do music students really have higher GPA’s?
Total Average GPA SD for GPA
Music Students 213 3.52 0.18
Non-music Students 684 3.24 0.22
z = 18.756, P 0%.Music students do have higher GPA’s
Chi-Squared Tests
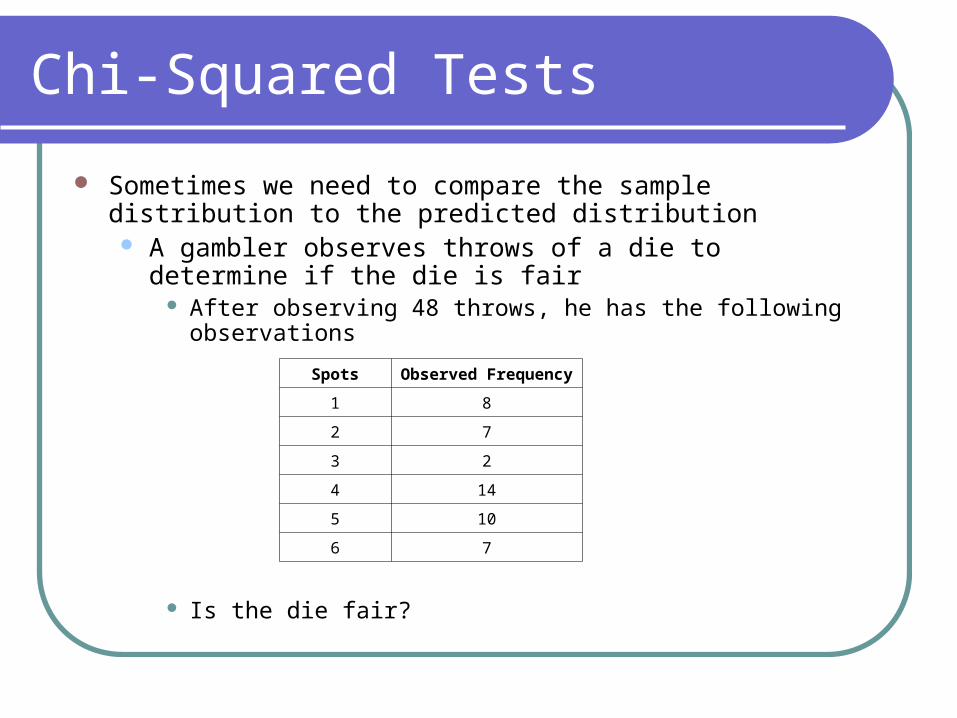
Sometimes we need to compare the sample distribution to the predicted distribution A gambler observes throws of a die to determine if the die is
fair After observing 48 throws, he has the following observations
Is the die fair?
Spots Observed Frequency
1 8
2 7
3 2
4 14
5 10
6 7
Chi-Squared Tests
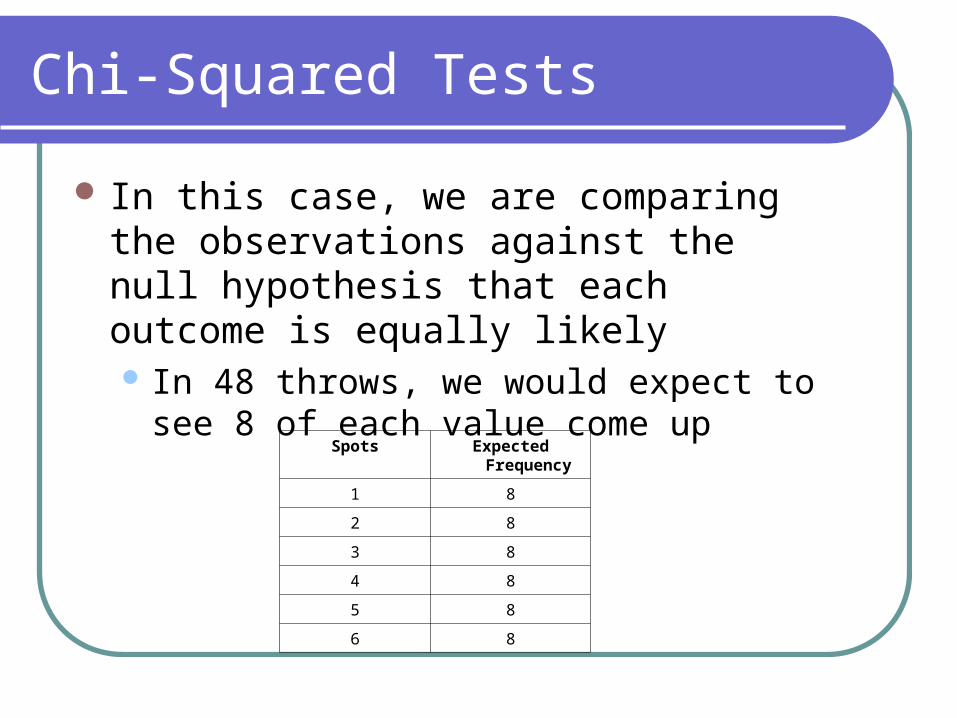
In this case, we are comparing the observations against the null hypothesis that each outcome is equally likely In 48 throws, we would expect to see 8 of
each value come up
Spots Expected Frequency
1 8
2 8
3 8
4 8
5 8
6 8
Chi-Squared Tests
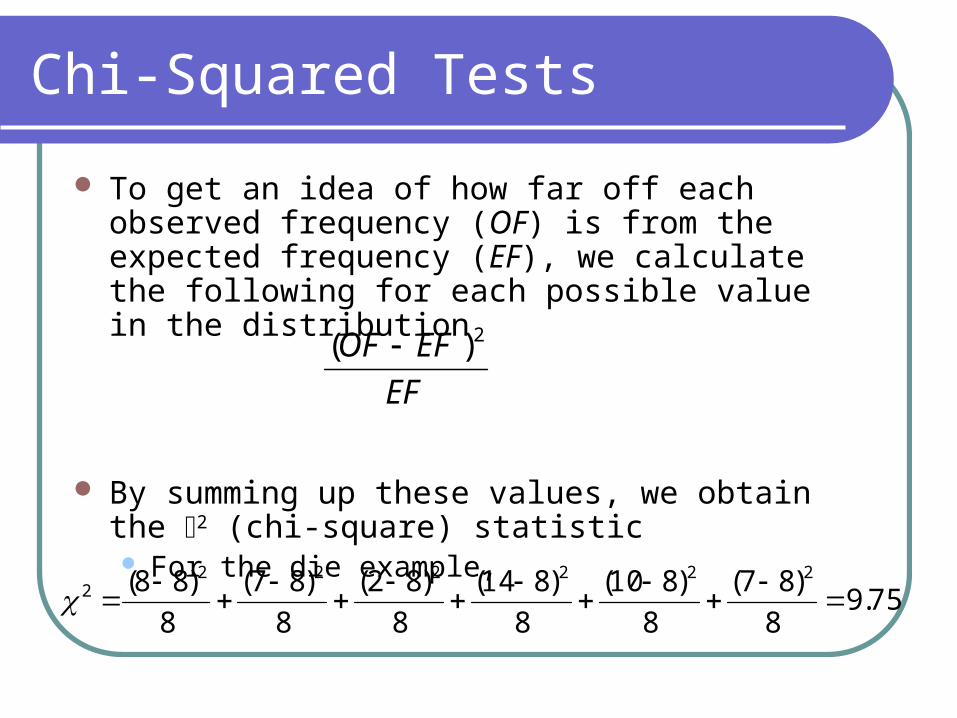
To get an idea of how far off each observed frequency (OF) is from the expected frequency (EF), we calculate the following for each possible value in the distribution
By summing up these values, we obtain the 2 (chi-square) statistic For the die example,
EF
EFOF 2)(
75.98
)87(
8
)810(
8
)814(
8
)82(
8
)87(
8
)88( 2222222
Chi-Squared Tests
Once we have the 2 statistic, we can look it up in a 2 table with m degrees of freedomThe degrees of freedom will be the number
of values in the distribution – 1 in this context
The distribution can be found on page A-107 of the text
Chi-Squared Tests
Since there are six possible values in the die-rolling distribution, there are 6 – 1 = 5 degrees of freedom in the 2 distribution Look up the 2 value of 9.75 in the row for 5
degrees of freedom The table tells us that the P-value is between 5%
and 10%, so the result is not statistically significant However, the rolls came heavy on 4 and light on 3
3 and 4 are on opposite sides of the die Perhaps it would be good to observe more throws and retest
Chi-Squared Tests
A programmer designing a random number generator needs to ensure that the numbers are uniformly distributed between 0 and 1 “Uniformly distributed” means that each number
between 0 and 1 is equally likely to be generated
She generates 1,000 numbers and groups them into class intervals based on their first digit after the decimal
Chi-Squared Tests
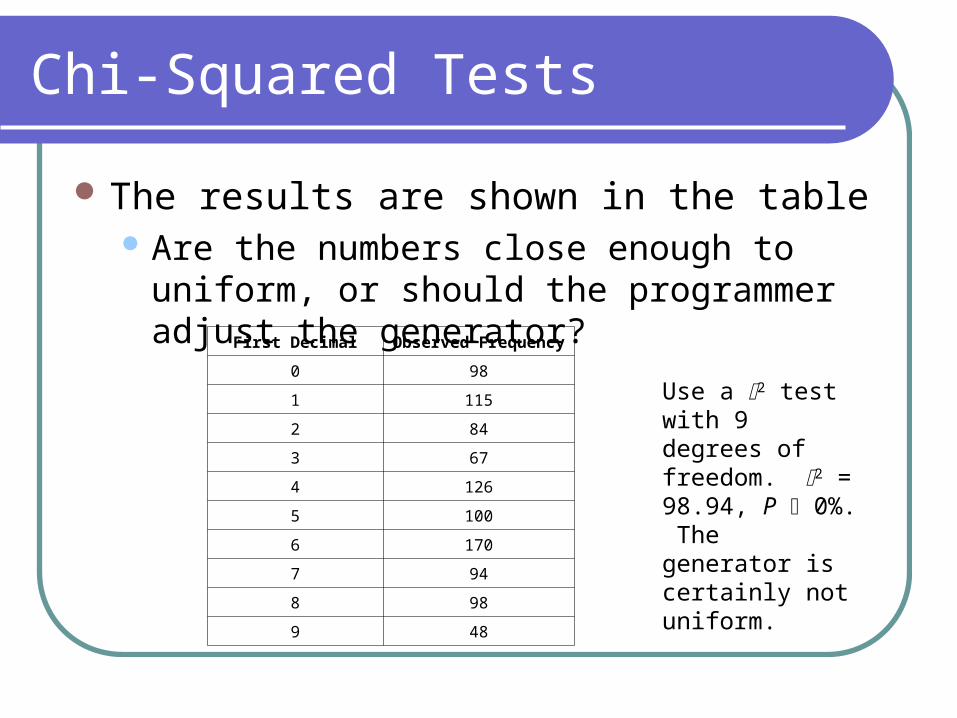
The results are shown in the table Are the numbers close enough to uniform, or
should the programmer adjust the generator?First Decimal Observed Frequency
0 98
1 115
2 84
3 67
4 126
5 100
6 170
7 94
8 98
9 48
Use a 2 test with 9 degrees of freedom. 2 = 98.94, P 0%. The generator is certainly not uniform.
Chi-Squared Tests
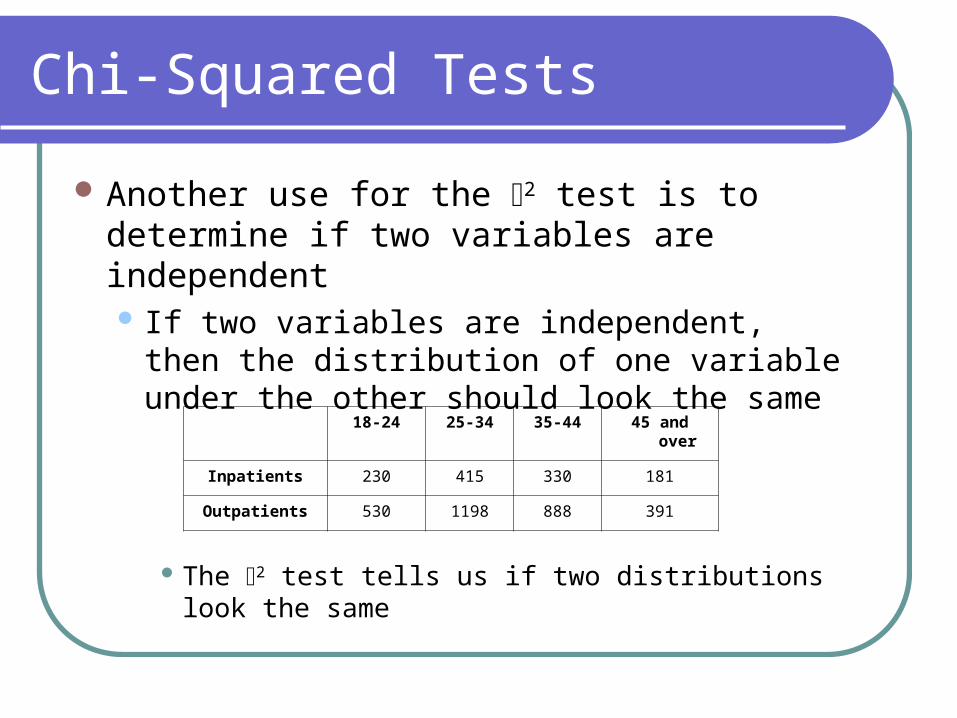
Another use for the 2 test is to determine if two variables are independent If two variables are independent, then the
distribution of one variable under the other should look the same
The 2 test tells us if two distributions look the same
18-24 25-34 35-44 45 and over
Inpatients 230 415 330 181
Outpatients 530 1198 888 391
Chi-Squared Tests
To calculate the expected frequencies in a block,Find the proportion of cases of all the
variables in that row compared to the total number of cases in the table
Multiply this by the total number of cases in that column
Chi-Squared Tests
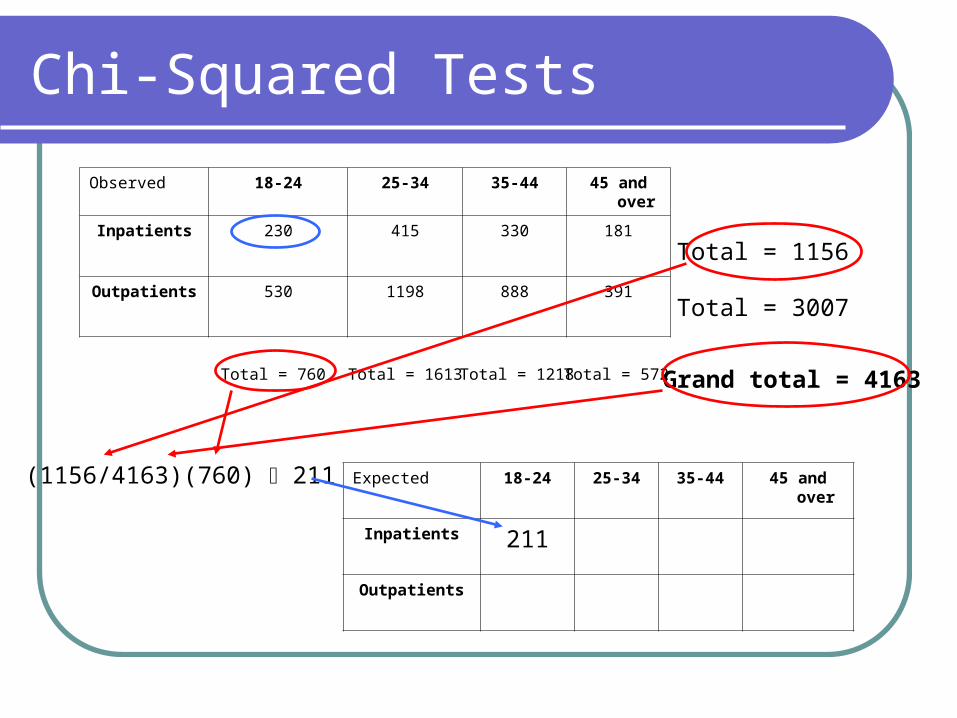
Observed 18-24 25-34 35-44 45 and over
Inpatients 230 415 330 181
Outpatients 530 1198 888 391
Expected 18-24 25-34 35-44 45 and over
Inpatients 211
Outpatients
Total = 1156
Total = 3007
Total = 760 Total = 1613 Total = 1218 Total = 572 Grand total = 4163
(1156/4163)(760) 211

Chi-Squared Tests
Observed 18-24 25-34 35-44 45 and over
Inpatients 230 415 330 181
Outpatients 530 1198 888 391
Expected 18-24 25-34 35-44 45 and over
Inpatients 211 448
Outpatients
Total = 1156
Total = 3007
Total = 760 Total = 1613 Total = 1218 Total = 572 Grand total = 4163
(1156/4163)(1613) 448
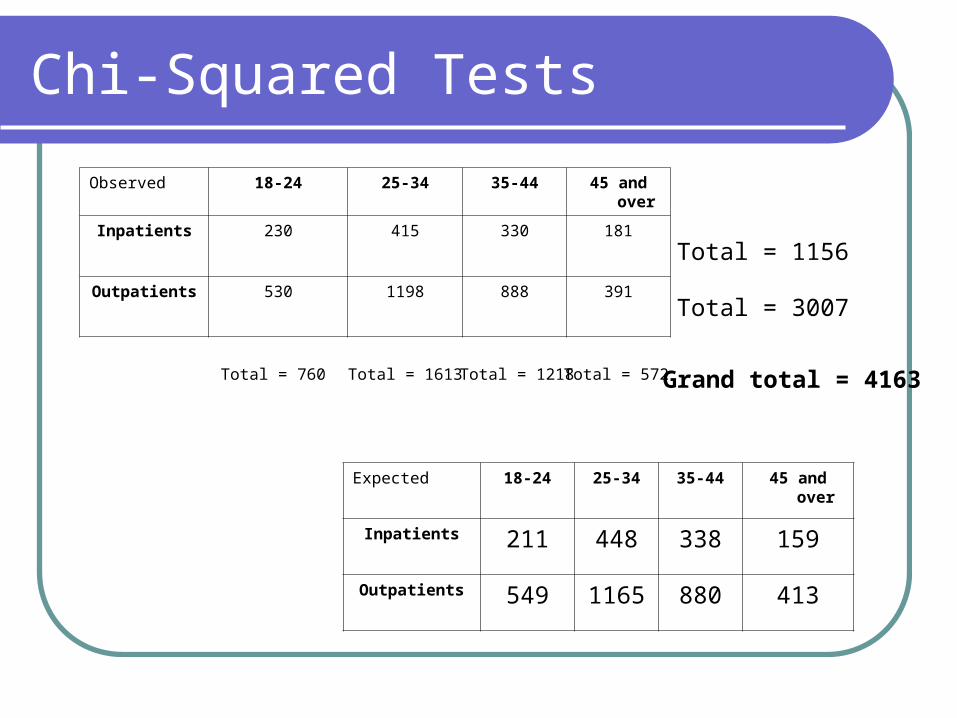
Chi-Squared Tests
Observed 18-24 25-34 35-44 45 and over
Inpatients 230 415 330 181
Outpatients 530 1198 888 391
Expected 18-24 25-34 35-44 45 and over
Inpatients 211 448 338 159
Outpatients 549 1165 880 413
Total = 1156
Total = 3007
Total = 760 Total = 1613 Total = 1218 Total = 572 Grand total = 4163
Chi-Squared Tests
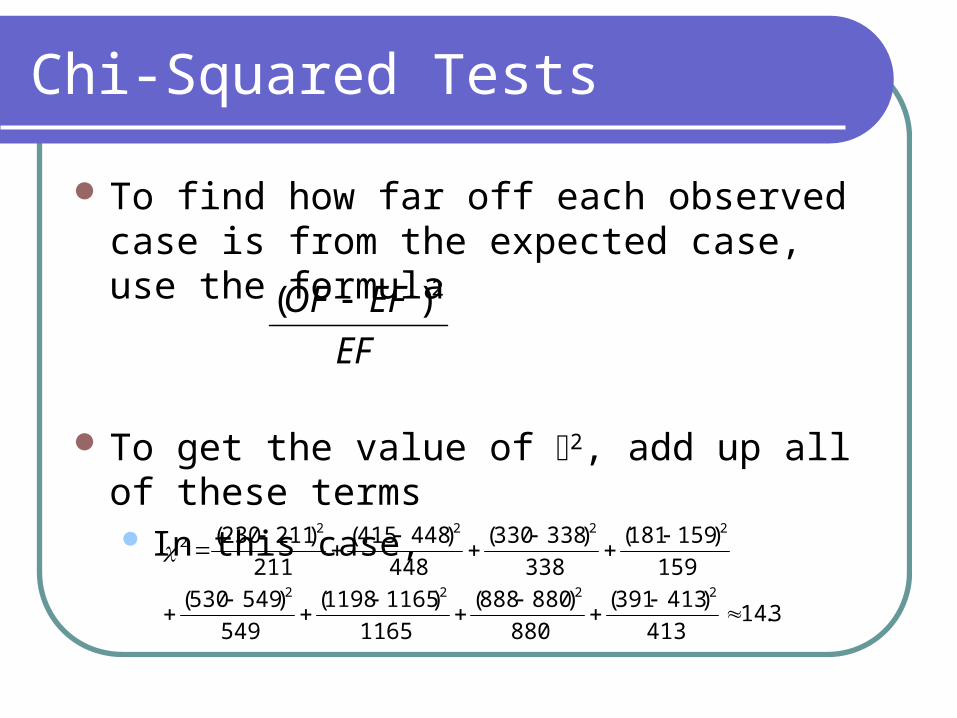
To find how far off each observed case is from the expected case, use the formula
To get the value of 2, add up all of these terms In this case,
EF
EFOF 2)(
3.14413
)413391(
880
)880888(
1165
)11651198(
549
)549530(
159
)159181(
338
)338330(
448
)448415(
211
)211230(
2222
22222
Chi-Squared Tests
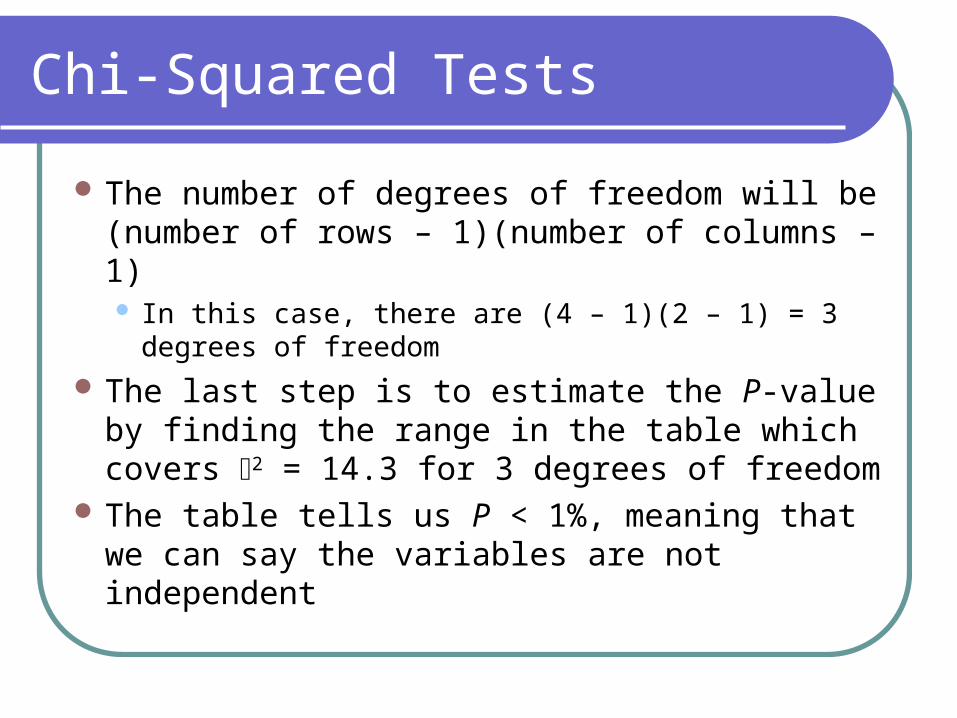
The number of degrees of freedom will be (number of rows – 1)(number of columns – 1) In this case, there are (4 – 1)(2 – 1) = 3 degrees of
freedom
The last step is to estimate the P-value by finding the range in the table which covers 2 = 14.3 for 3 degrees of freedom
The table tells us P < 1%, meaning that we can say the variables are not independent
Summary
When we want to show that a result was not likely to occur by pure chance, we can use a hypothesis test to validate our claimA hypothesis test takes as a null hypothesis
some chance model which could describe the situation
Summary
The goal of the researcher is to reject the null hypothesisThis is accomplished by finding a P-value
that is small enough to be considered “significant”
P-values less than 5% are generally considered statistically significant
The observed result was very unlikely to occur by pure chance
Summary
To compare a sample average or percentage against a chance model, use a z test (if sample is large enough) or a t test (if sample is small)
To compare the averages or percentages from two different samples, use a z (or t) test for the difference between the averages/percentages
Summary
To compare two entire distributions, use a 2 testThe null hypothesis for a 2 test is that the
distributions being compared are the sameA 2 test can also be used to check if two
variables are independent
Summary
Remember that all of the hypothesis tests can only give the researcher a probability that the observed value occurred under the null hypothesis conditionsEven if a score is significant, the test cannot
sponsor an alternativeProposing a viable alternative is a task for
the researcher