Embed Size (px)
Citation preview

Hypothesis Testing
Section 8.2

• Statistical hypothesis testing is a decision-making process for evaluating claims about a population.
• In hypothesis testing, the researcher must define the population under study, state the particular claim that will be investigated, give the significance level of the test, select a sample from the population, collect the data, perform the calculations required for the statistical test, and reach a conclusion.

• The three methods used to test hypothesis are:– Traditional method– P-value method– Confidence interval method

• The traditional method will be explained first. It has been used since the hypothesis-testing method was formulated.
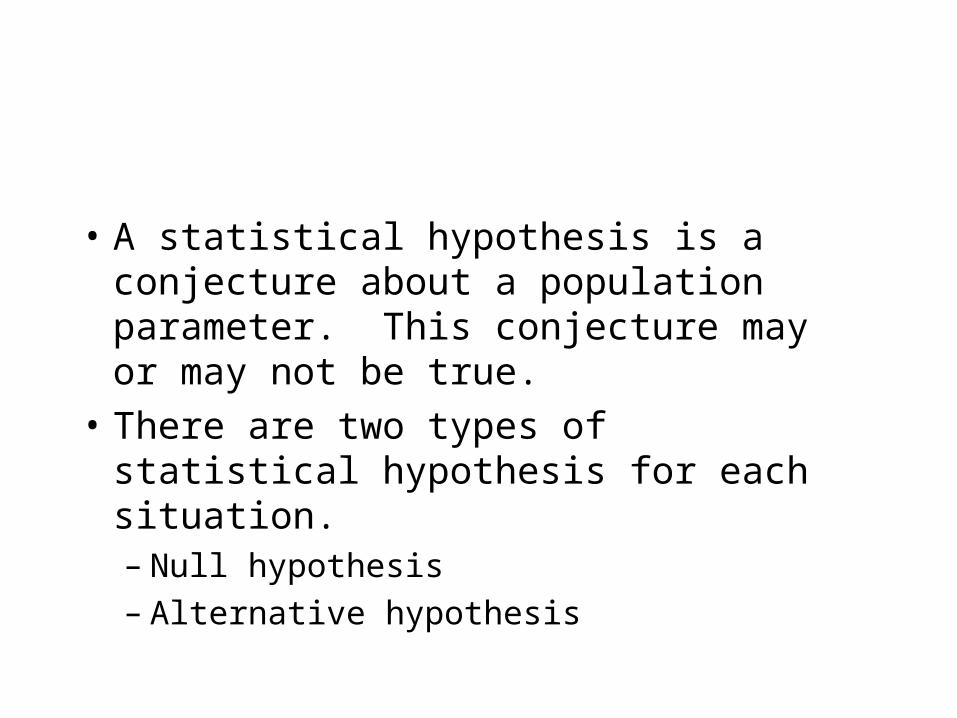
• A statistical hypothesis is a conjecture about a population parameter. This conjecture may or may not be true.
• There are two types of statistical hypothesis for each situation.– Null hypothesis– Alternative hypothesis

• The null hypothesis, symbolized by H0, is a statistical hypothesis that states that there is no difference between a parameter and a specific value, or that there is no difference between two parameters.
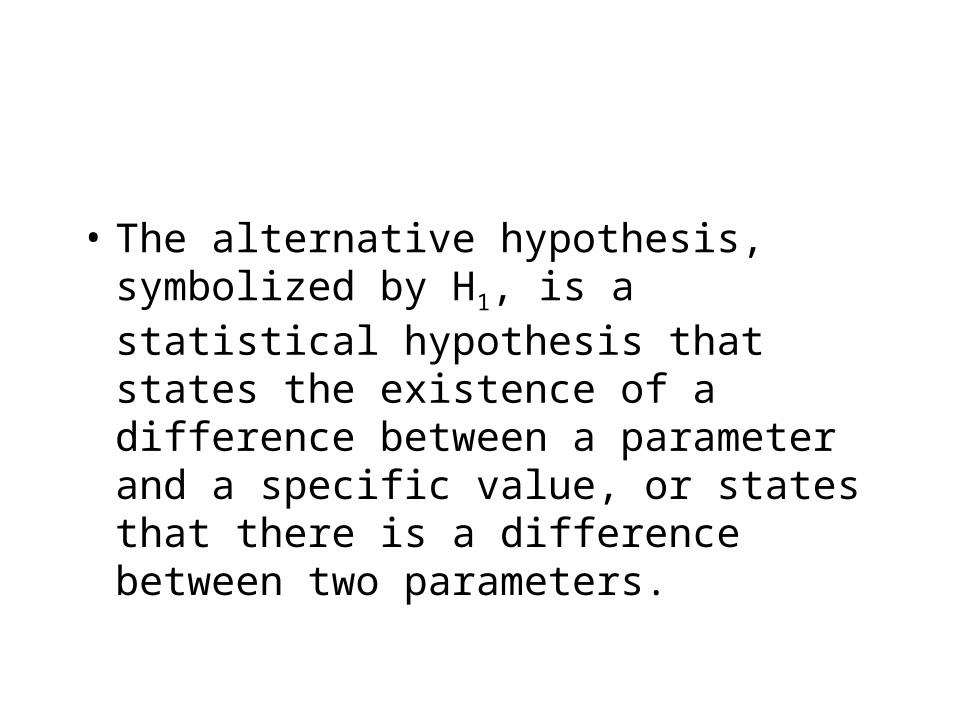
• The alternative hypothesis, symbolized by H1, is a statistical hypothesis that states the existence of a difference between a parameter and a specific value, or states that there is a difference between two parameters.

Examples
• A researcher thinks that if expectant mothers use vitamin pills, the birth weight of the babies will increase. The average birth weight of the population is 8.6 pounds. State the claim, the null, and the alternative hypothesis.

claim : 8.6Does the claim contain equality?
No, therefore it cannot be the null hypothesis.
claim : 8.6
Ho :8.6
H1 : 8.6

Example
• An engineer claims that the mean number of defects can be decreased in a manufacturing process of compact discs by using robots instead of humans for certain tasks. The mean number of defective discs per 1000 is 18.

claim :18
H0 :18
H1 : 18

Example
• A psychologist feels that playing soft music during a test will change the results of the test. The psychologist is not sure whether the grades will be higher or lower. In the past, the mean of the scores was 73.

claim :73
H0 :73
H1 : 73

• The next step is to determine if the test is a right tail test, a left tail test, or a two tail test.
• This decision is made by looking at H1.

claim : 8.6
Ho :8.6
H1 : 8.6
Right tail test

claim :18
H0 :18
H1 : 18
Left tail test

claim :73
H0 :73
H1 : 73
Two tail test
• Use the outline to determine what the Test Statistic (TS) is.
• A statistical test uses the data obtained from a sample to make a decision about whether or not the null hypothesis should be rejected.

• According to the outline, you make a decision about which TS to use the same way you made a decision about what type of confidence interval to do.
• If the claim is about the mean, ,– Is known or not?
• If the claim is about the population proportion, p, there is only one TS.

• Once the TS has been chosen, then we need to find the critical value(s) and critical region(s).
• The critical value(s) separate the critical region from the non-critical region.

claim : 8.6
Ho :8.6
H1 : 8.6
Right tail test
The critical region and critical value will be in the right tail.
CV
CR

CV
CR
claim :18
H0 :18
H1 : 18
Left tail test
The critical value and critical region willbe in the left tail.

claim :73
H0 :73
H1 : 73
Two tail test
For a two tail test, the critical values and critical region are in both tails.
CV
CR CR
CV

• A one-tailed test indicates that the null hypothesis should be rejected when the TS is in the critical region on one side of the mean.
• A one-tailed test is either right tailed or left tailed, depending on the direction of the inequality of the alternative hypothesis.

• In a two-tailed test, the null hypothesis should be rejected when the TS is in either of two critical regions.
• For a two-tailed test, the critical region must be divided into two equal parts. Therefore, (alpha, the significance level) must be divided by 2.

claim : 8.6
Ho :8.6
H1 : 8.6
1.645CV
CR
n = 30
Is known.
= .05
TS Z x 0
n

-1.699CV
CR
claim :18
H0 :18
H1 : 18
n = 30 unknown = .05
TS t x 0
sn

claim :73
H0 :73
H1 : 73
-1.96CV
CR CR
1.96
CV
n = 25
Known
= .05
TS Z x 0
n

• Next step: Calculate the TS.• If you have a TI-83,
– STAT
– TEST TO THE CORRECT TEST
– INPUT THE NEEDED INFORMATON
• If you have a Casio fx-9750G Plus– TEST
– GO TO THE CORRECT TEST
– VARIABLE
– INPUT THE ASKED FOR INFORMATION

• Otherwise, substitute the information into the formula to find your TS.
• Use the critical value as an aide in rounding.

• Next: Make the decision.– If the TS lands in the critical region, reject H0.
– Otherwise, fail to reject H0.
• Write the conclusion in a complete sentence in the context of the problem mentioning the significance level of the test.

• Whenever you make a decision, you could make an error. In statistics, we give these errors names.
Type I Error
• A type I error occurs if one rejects the null hypothesis when it is true.
P(Type I error )

Type II Error
• A type II error occurs if one fails to reject the null hypothesis when it is false.
P(Type II error )
• The hypothesis testing situation can be likened to a jury trial.
H0 : defendant is not quilty
H1 : defendant is quilty
• Type I error: Rejected the null hypothesis -- found the defendant guilty when in fact the defendant is not guilty.
H0 : defendant is not quilty
H1 : defendant is quilty

• Type II error -- failed to reject the null hypothesis -- found the defendant not guilty when in fact the defendant is guilty.
H0 : defendant is not quilty
H1 : defendant is quilty

• The level of significance is the maximum probability of committing a Type I error.