Embed Size (px)
Citation preview
International Journal of Technical Research (IJTR)Vol. 4, Issue 2, Jul-Aug 2015
ISSN 2278-5787 Page 51
IMPLEMENTATION OF ADVANCED ENERGY METER
USING PIC MICROCONTROLLERVikas1, Kuldeep Bhardwaj2
1M.Tech Scholar, 2Associate Professor, ECE Deptt, OITM Juglan (HISSAR)[email protected], [email protected]
Abstract—The objective of this paper is to study and implementan advanced single phase energy meter using PI Controller. Inthis paper a new way is proposed for implementation of energymeter with accurate results and which also have a feature ofgiving user the bill of its energy used. In India user faces problemof knowing its accurate bill. Motivation behind selecting PICmicrocontroller is its Accuracy, low cost and ease ofprogramming.Keywords— PIC, Energy Meter, LCD, kWh
I. INTRODUCTION
This application note describes a single-phase power/energymeter. The design measures active power/energy, potential,and current in a single-phase distribution environment. Theheart of the meter is a PICcontroller. All measurements aretook in the digital domain and measurement results areavailable in LCD. Power meters are sometimes mention to asenergy meters and vise versa. According to terminology,(active) power is a measure of what is required (or consumed)in order to perform particular useful work. For example, abulb with a 100W rating consumes 100 watts of real power inorder to create light (and heat). Energy, per definition, is themeasure of how much work has been required over a knownperiod of time. In the light bulb example, enlighten the bulbon for an hour it will consume 100W × 3600s = 360000Ws(watt seconds) = 100Wh (watt hours) = 0.1kWh (kilowatthours) of energy. The energy meter described in thisapplication note can be referred to as a energy meter or a watt-hour meter.All measurement results can be calibrated in thedigital domain, eliminate the need for any trimmingcomponents. The calibration event can be self-alter, andeliminate the time-spending manual trimming required intraditional type electromechanical energy meters. The Digitalcalibration is fast and efficient, minimize the overallcalculation time and cost. The brain of the meter is thesoftware firmware code, which is provided open source. Inspite of it includes all the functionality required for a single-phase meter,it can be alter and updated at any time,even in theworking mode. The software code is entirely written in C,which makes alteration easy.
II. PIC16F877A
PIC 16F877 is one of the most advanced microcontroller fromMicrochip. This controller is widely used for experimentaland modern applications because of its low price, wide rangeof applications, high quality, and ease of availability. It isideal for applications such as machine control applications,measurement devices, study purpose, and so on. The PIC
16F877 features all the components which modernmicrocontrollers normally have.
III. RESULTS
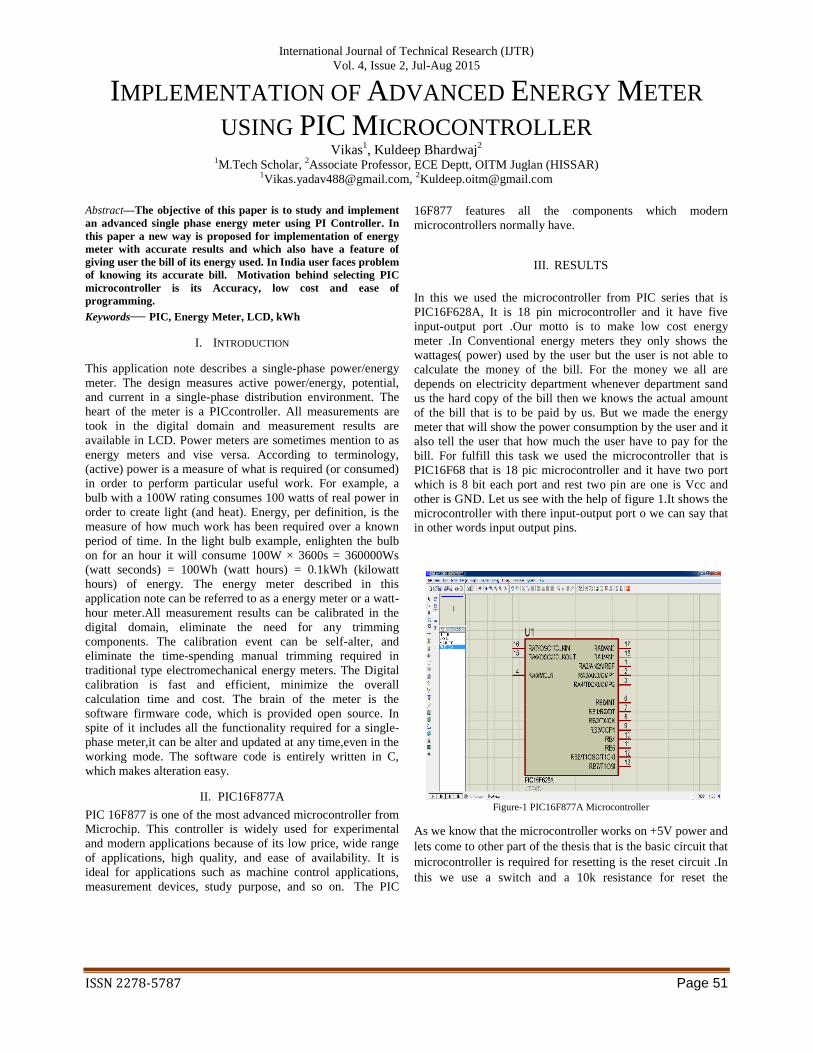
In this we used the microcontroller from PIC series that isPIC16F628A, It is 18 pin microcontroller and it have fiveinput-output port .Our motto is to make low cost energymeter .In Conventional energy meters they only shows thewattages( power) used by the user but the user is not able tocalculate the money of the bill. For the money we all aredepends on electricity department whenever department sandus the hard copy of the bill then we knows the actual amountof the bill that is to be paid by us. But we made the energymeter that will show the power consumption by the user and italso tell the user that how much the user have to pay for thebill. For fulfill this task we used the microcontroller that isPIC16F68 that is 18 pic microcontroller and it have two portwhich is 8 bit each port and rest two pin are one is Vcc andother is GND. Let us see with the help of figure 1.It shows themicrocontroller with there input-output port o we can say thatin other words input output pins.
Figure-1 PIC16F877A Microcontroller
As we know that the microcontroller works on +5V power andlets come to other part of the thesis that is the basic circuit thatmicrocontroller is required for resetting is the reset circuit .Inthis we use a switch and a 10k resistance for reset the
International Journal of Technical Research (IJTR)Vol. 4, Issue 2, Jul-Aug 2015
ISSN 2278-5787 Page 52
microcontroller and one more thing is that we also use abutton or we can say that in other words switch .This helps themicrocontroller to reset. Some time we also use the 5.5Vzener diode in between 10k resistance and the switch becausePIC16F628A have the ICSP (In Circuit Serial Programing) sowe are not to require to remove the controller from the circuitand then reprogram an put into the circuit but we can bun theprogram in microcontroller in circuit that is known as ICSP.The ICSP have 5 pin usually, first pin is MCLR bar that ismaster clear reset, Second pin Vcc, Third pin is GND, fourthpin is PGD(Programing Data) and finally,the last or fifth pinis PGC (Programing Clock).We can see the complete resetcircuit below figure-2.
Figure-2 Microcontroller’s Reset Circuit
For the output of the PWM I used a LCD display which is alsoknown as 16x2 LCD.This is because this lcd is divided intotwo part first part is row part and other is collum part so thelcd have two row and sixteen colloms and they are also knownas pixels of the lcd now the lcd have sixteen pins that havethere own use let us discuss .in this arreangmnt I connect 1st
and 16th pin to ground and 2nd and 15th pin to Vcc(+5V) .In lcdwe have two Vcc and two grounds this is because one Vcc andGround is used for lcd’s intrnal working and other is used forthe control the lcd’s backlight.after that we have Vee that isused for the contrest control o th lcd and the next pin is RS pinwhich tells the lcd that wheather the coming item is data orcommad by selecting tha RS=1 it means its data and RS=0means it is command and next pin is R/W bar that is R standsfor read and W stands for wright and as we know that we areto always write the data on lcd so to save an extra pin weparmannt ground this pin and rest next pin is data pin from thesequence D0-D7 these 8 pins are data pins but pic provides usthe new protocol and in this we only connects D4 to D7 pinwith the microcontroller as shown in below figure.LCD havetwo types of RAM first is DD ram an second is CG ram.HereDD RAM stands for Data Display Ram which is used for thedisplay the data on lcd other then this DD ram does not do
other work and the second type of ram is CG ram that worksfor command graphics ram which is used to process thecommand which is given to the lcd like clear the lcd or cursooff and much more commands which we used are processedby the CG ram.This is the basic protocol to interface the lcdwith the microcontrollr.So with the use of this protocol weinefaced the lcd.
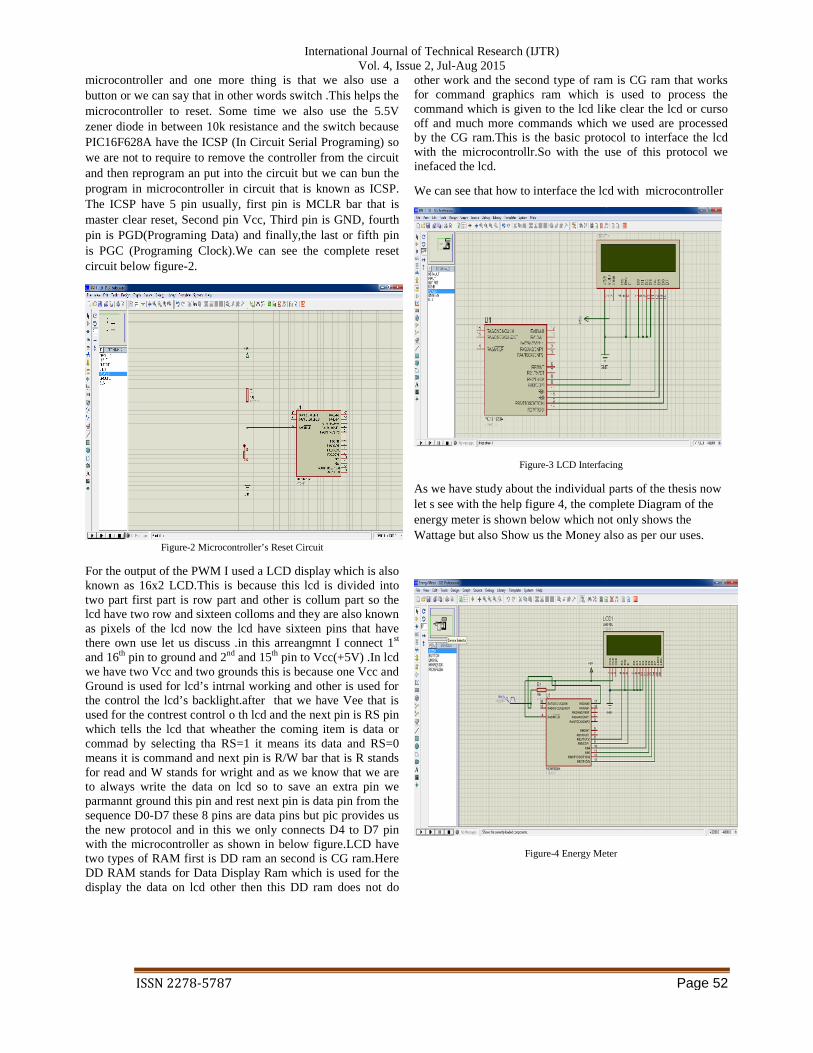
We can see that how to interface the lcd with microcontroller
Figure-3 LCD Interfacing
As we have study about the individual parts of the thesis nowlet s see with the help figure 4, the complete Diagram of theenergy meter is shown below which not only shows theWattage but also Show us the Money also as per our uses.
Figure-4 Energy Meter
International Journal of Technical Research (IJTR)Vol. 4, Issue 2, Jul-Aug 2015
ISSN 2278-5787 Page 52
microcontroller and one more thing is that we also use abutton or we can say that in other words switch .This helps themicrocontroller to reset. Some time we also use the 5.5Vzener diode in between 10k resistance and the switch becausePIC16F628A have the ICSP (In Circuit Serial Programing) sowe are not to require to remove the controller from the circuitand then reprogram an put into the circuit but we can bun theprogram in microcontroller in circuit that is known as ICSP.The ICSP have 5 pin usually, first pin is MCLR bar that ismaster clear reset, Second pin Vcc, Third pin is GND, fourthpin is PGD(Programing Data) and finally,the last or fifth pinis PGC (Programing Clock).We can see the complete resetcircuit below figure-2.
Figure-2 Microcontroller’s Reset Circuit
For the output of the PWM I used a LCD display which is alsoknown as 16x2 LCD.This is because this lcd is divided intotwo part first part is row part and other is collum part so thelcd have two row and sixteen colloms and they are also knownas pixels of the lcd now the lcd have sixteen pins that havethere own use let us discuss .in this arreangmnt I connect 1st
and 16th pin to ground and 2nd and 15th pin to Vcc(+5V) .In lcdwe have two Vcc and two grounds this is because one Vcc andGround is used for lcd’s intrnal working and other is used forthe control the lcd’s backlight.after that we have Vee that isused for the contrest control o th lcd and the next pin is RS pinwhich tells the lcd that wheather the coming item is data orcommad by selecting tha RS=1 it means its data and RS=0means it is command and next pin is R/W bar that is R standsfor read and W stands for wright and as we know that we areto always write the data on lcd so to save an extra pin weparmannt ground this pin and rest next pin is data pin from thesequence D0-D7 these 8 pins are data pins but pic provides usthe new protocol and in this we only connects D4 to D7 pinwith the microcontroller as shown in below figure.LCD havetwo types of RAM first is DD ram an second is CG ram.HereDD RAM stands for Data Display Ram which is used for thedisplay the data on lcd other then this DD ram does not do
other work and the second type of ram is CG ram that worksfor command graphics ram which is used to process thecommand which is given to the lcd like clear the lcd or cursooff and much more commands which we used are processedby the CG ram.This is the basic protocol to interface the lcdwith the microcontrollr.So with the use of this protocol weinefaced the lcd.
We can see that how to interface the lcd with microcontroller
Figure-3 LCD Interfacing
As we have study about the individual parts of the thesis nowlet s see with the help figure 4, the complete Diagram of theenergy meter is shown below which not only shows theWattage but also Show us the Money also as per our uses.
Figure-4 Energy Meter
International Journal of Technical Research (IJTR)Vol. 4, Issue 2, Jul-Aug 2015
ISSN 2278-5787 Page 53
As we have seen the energy meter that how did we make itand now let us see that how it works Electronic Energy Meteris based on Digital Micro Technology (DMT) and uses nomoving parts. So the EEM is known as “Static Energy Meter”In EEM the accurate functioning is controlled by a speciallydesigned IC called ASIC (Application Specified IntegratedCircuit). ASIC is constructed only for specific applicationsusing Embedded System Technology. Similar ASIC are nowused in Washing Machines, Air Conditioners, Automobiles,Digital Camera etc.In addition to ASIC, analogue circuits,Voltage transformer, Current transformer etc are also presentin EEM to “Sample” current and voltage. The ‘Input Data’(Voltage) is compared with a programmed “Reference Data’(Voltage) and finally a ‘Voltage Rate’ will be given to theoutput. This output is then converted into ‘Digital Data’ by theAD Converters (Analogue- Digital converter) present in theASIC. The Digital Data is then converted into an “AverageValue”. Average Value / Mean Value is the measuring unit ofpower. The output of ASIC is available as “Pulses” indicatedby the LED (Light Emitting Diode) placed on the front panelof EEM. These pulses are equal to Average Kilo Watt Hour(kWh / unit). Different ASIC with various kWh are used indifferent makes of EEMs. But usually 800 to 3600 pulses /kWh generating ASIC s are used in EEMs.
Figure-5 Energy Meter with Zero Reading
We have seen that energy meter is on zero reading and we testit with many random readings. In above figure we are able tosee that the energy meter shows zero reading of zero unit andzero Rs for the unit or in other words we can say that theenergy meter is on but have no load that is why it have zerounit with zero price.
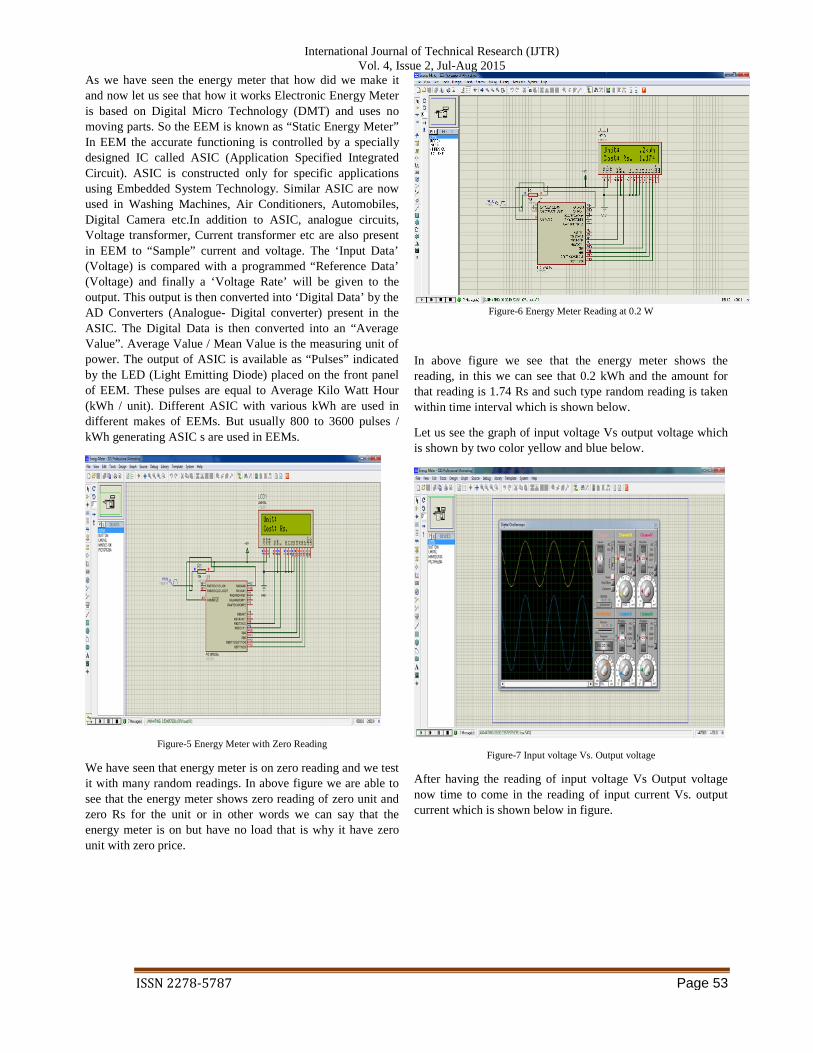
Figure-6 Energy Meter Reading at 0.2 W
In above figure we see that the energy meter shows thereading, in this we can see that 0.2 kWh and the amount forthat reading is 1.74 Rs and such type random reading is takenwithin time interval which is shown below.
Let us see the graph of input voltage Vs output voltage whichis shown by two color yellow and blue below.
Figure-7 Input voltage Vs. Output voltage
After having the reading of input voltage Vs Output voltagenow time to come in the reading of input current Vs. outputcurrent which is shown below in figure.
International Journal of Technical Research (IJTR)Vol. 4, Issue 2, Jul-Aug 2015
ISSN 2278-5787 Page 53
As we have seen the energy meter that how did we make itand now let us see that how it works Electronic Energy Meteris based on Digital Micro Technology (DMT) and uses nomoving parts. So the EEM is known as “Static Energy Meter”In EEM the accurate functioning is controlled by a speciallydesigned IC called ASIC (Application Specified IntegratedCircuit). ASIC is constructed only for specific applicationsusing Embedded System Technology. Similar ASIC are nowused in Washing Machines, Air Conditioners, Automobiles,Digital Camera etc.In addition to ASIC, analogue circuits,Voltage transformer, Current transformer etc are also presentin EEM to “Sample” current and voltage. The ‘Input Data’(Voltage) is compared with a programmed “Reference Data’(Voltage) and finally a ‘Voltage Rate’ will be given to theoutput. This output is then converted into ‘Digital Data’ by theAD Converters (Analogue- Digital converter) present in theASIC. The Digital Data is then converted into an “AverageValue”. Average Value / Mean Value is the measuring unit ofpower. The output of ASIC is available as “Pulses” indicatedby the LED (Light Emitting Diode) placed on the front panelof EEM. These pulses are equal to Average Kilo Watt Hour(kWh / unit). Different ASIC with various kWh are used indifferent makes of EEMs. But usually 800 to 3600 pulses /kWh generating ASIC s are used in EEMs.
Figure-5 Energy Meter with Zero Reading
We have seen that energy meter is on zero reading and we testit with many random readings. In above figure we are able tosee that the energy meter shows zero reading of zero unit andzero Rs for the unit or in other words we can say that theenergy meter is on but have no load that is why it have zerounit with zero price.
Figure-6 Energy Meter Reading at 0.2 W
In above figure we see that the energy meter shows thereading, in this we can see that 0.2 kWh and the amount forthat reading is 1.74 Rs and such type random reading is takenwithin time interval which is shown below.
Let us see the graph of input voltage Vs output voltage whichis shown by two color yellow and blue below.
Figure-7 Input voltage Vs. Output voltage
After having the reading of input voltage Vs Output voltagenow time to come in the reading of input current Vs. outputcurrent which is shown below in figure.
International Journal of Technical Research (IJTR)Vol. 4, Issue 2, Jul-Aug 2015
ISSN 2278-5787 Page 54
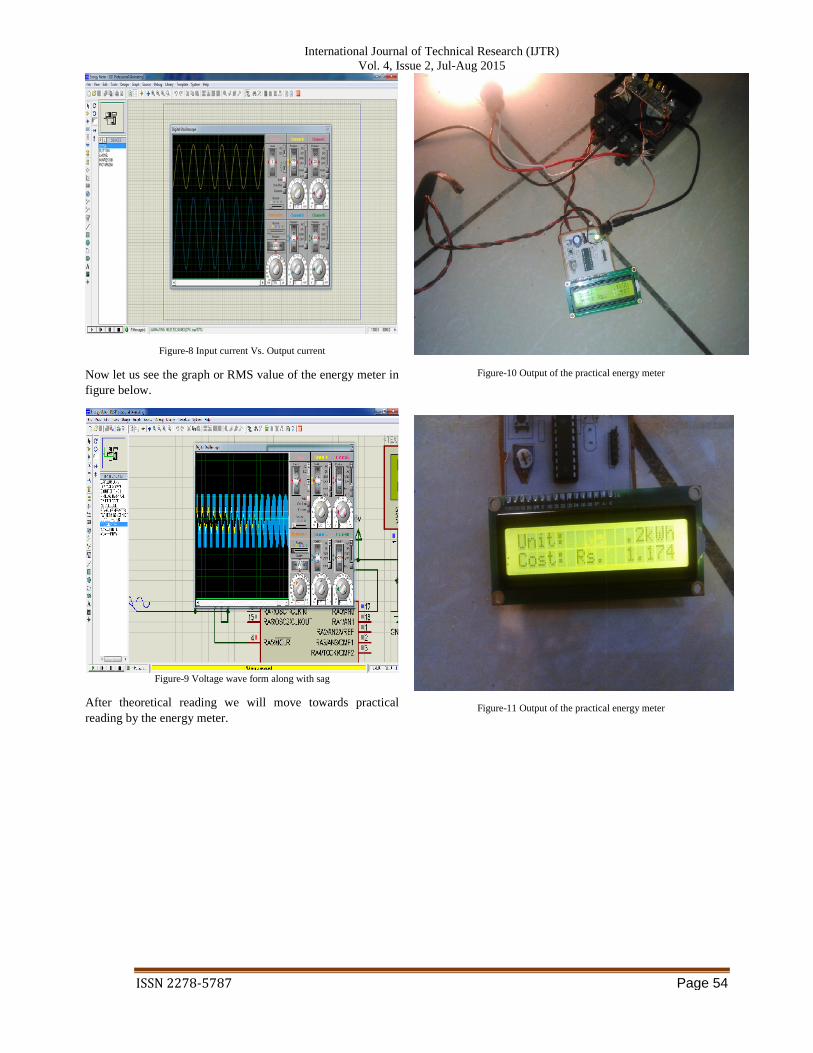
Figure-8 Input current Vs. Output current
Now let us see the graph or RMS value of the energy meter infigure below.
Figure-9 Voltage wave form along with sag
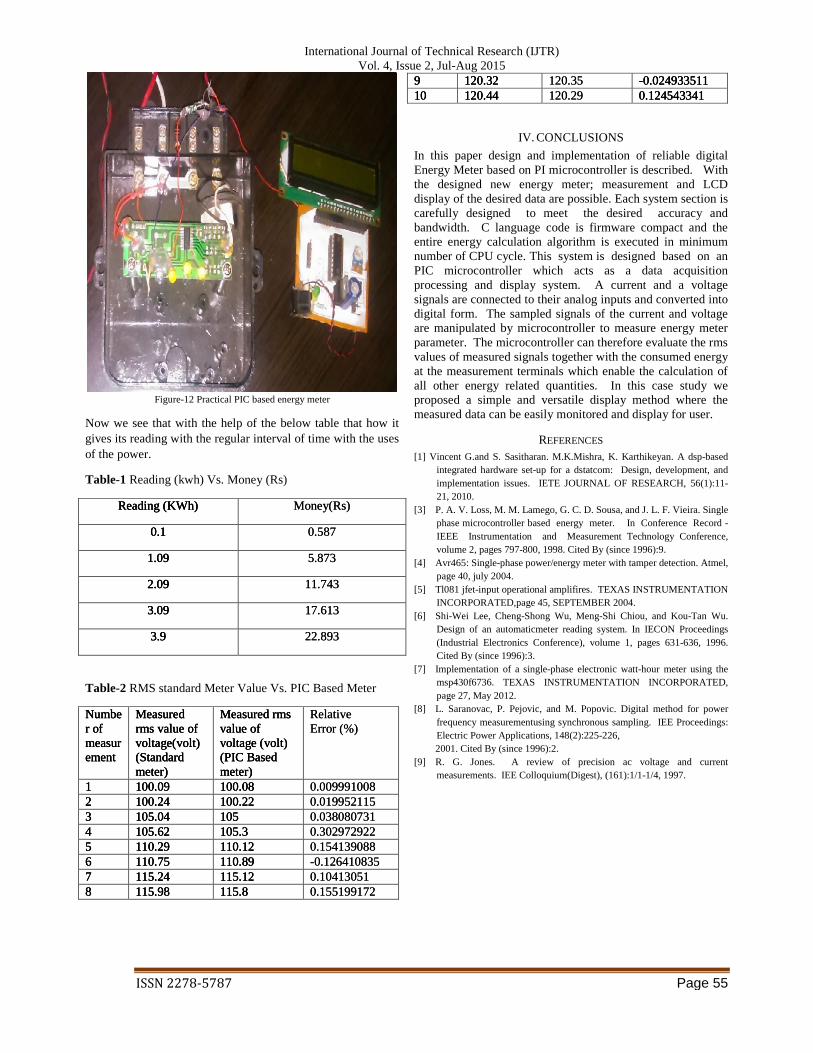
After theoretical reading we will move towards practicalreading by the energy meter.
Figure-10 Output of the practical energy meter
Figure-11 Output of the practical energy meter
International Journal of Technical Research (IJTR)Vol. 4, Issue 2, Jul-Aug 2015
ISSN 2278-5787 Page 54
Figure-8 Input current Vs. Output current
Now let us see the graph or RMS value of the energy meter infigure below.
Figure-9 Voltage wave form along with sag
After theoretical reading we will move towards practicalreading by the energy meter.
Figure-10 Output of the practical energy meter
Figure-11 Output of the practical energy meter
International Journal of Technical Research (IJTR)Vol. 4, Issue 2, Jul-Aug 2015
ISSN 2278-5787 Page 55
Figure-12 Practical PIC based energy meter
Now we see that with the help of the below table that how itgives its reading with the regular interval of time with the usesof the power.
Table-1 Reading (kwh) Vs. Money (Rs)
Reading (KWh) Money(Rs)
0.1 0.587
1.09 5.873
2.09 11.743
3.09 17.613
3.9 22.893
Table-2 RMS standard Meter Value Vs. PIC Based Meter
Number ofmeasurement
Measuredrms value ofvoltage(volt)(Standardmeter)
Measured rmsvalue ofvoltage (volt)(PIC Basedmeter)
RelativeError (%)
1 100.09 100.08 0.0099910082 100.24 100.22 0.0199521153 105.04 105 0.0380807314 105.62 105.3 0.3029729225 110.29 110.12 0.1541390886 110.75 110.89 -0.1264108357 115.24 115.12 0.104130518 115.98 115.8 0.155199172
9 120.32 120.35 -0.02493351110 120.44 120.29 0.124543341
IV. CONCLUSIONS
In this paper design and implementation of reliable digitalEnergy Meter based on PI microcontroller is described. Withthe designed new energy meter; measurement and LCDdisplay of the desired data are possible. Each system section iscarefully designed to meet the desired accuracy andbandwidth. C language code is firmware compact and theentire energy calculation algorithm is executed in minimumnumber of CPU cycle. This system is designed based on anPIC microcontroller which acts as a data acquisitionprocessing and display system. A current and a voltagesignals are connected to their analog inputs and converted intodigital form. The sampled signals of the current and voltageare manipulated by microcontroller to measure energy meterparameter. The microcontroller can therefore evaluate the rmsvalues of measured signals together with the consumed energyat the measurement terminals which enable the calculation ofall other energy related quantities. In this case study weproposed a simple and versatile display method where themeasured data can be easily monitored and display for user.
REFERENCES
[1] Vincent G.and S. Sasitharan. M.K.Mishra, K. Karthikeyan. A dsp-basedintegrated hardware set-up for a dstatcom: Design, development, andimplementation issues. IETE JOURNAL OF RESEARCH, 56(1):11-21, 2010.
[3] P. A. V. Loss, M. M. Lamego, G. C. D. Sousa, and J. L. F. Vieira. Singlephase microcontroller based energy meter. In Conference Record -IEEE Instrumentation and Measurement Technology Conference,volume 2, pages 797-800, 1998. Cited By (since 1996):9.
[4] Avr465: Single-phase power/energy meter with tamper detection. Atmel,page 40, july 2004.
[5] Tl081 jfet-input operational amplifires. TEXAS INSTRUMENTATIONINCORPORATED,page 45, SEPTEMBER 2004.
[6] Shi-Wei Lee, Cheng-Shong Wu, Meng-Shi Chiou, and Kou-Tan Wu.Design of an automaticmeter reading system. In IECON Proceedings(Industrial Electronics Conference), volume 1, pages 631-636, 1996.Cited By (since 1996):3.
[7] Implementation of a single-phase electronic watt-hour meter using themsp430f6736. TEXAS INSTRUMENTATION INCORPORATED,page 27, May 2012.
[8] L. Saranovac, P. Pejovic, and M. Popovic. Digital method for powerfrequency measurementusing synchronous sampling. IEE Proceedings:Electric Power Applications, 148(2):225-226,2001. Cited By (since 1996):2.
[9] R. G. Jones. A review of precision ac voltage and currentmeasurements. IEE Colloquium(Digest), (161):1/1-1/4, 1997.