Embed Size (px)
Citation preview
Indigenous and Laboratory Assessment of the Nutritive Value of Tree Fodder.
I : Discrimination Amongst and Within Species.
P.I. Thome3, D.B. Subbab, D.H. WaIkerc, B. Thapad, C.D. Wood3, F.L. Sinclaire
~aturaI Resources Institute, University of Greenwich, Central Avenue, Chatham Maritime, KentME4 4ffi, United Kingdom.bpakhribas Agricultural Centre, British Aid Project Support Office, c/o British Embassy, PO Box 106,Lainchaur, Lazimpat, Kathmandu, Nepal.cCSIRO Tropical Agriculture, Davies Laboratory, PMB PO, Aitkenvale QLD 4814, Australia.dCARE International, PO Box 1661, Kathmandu, Nepal..School of Agricultural and Forest Sciences, University of Wales, Bangor, Gwynedd, LL57 2UW,United Kingdom.
Corresponding author: Dr Peter Thome, Natural Resources Institute.Fax: + 44 1634 883888E-mail: [email protected]
1

1 Abstract
This paper describes a study of the discriminatol)' powers of assessments. by farmers and laboratol)'
3 techniques, of the nutritive value of tree fodder found in the middle hills of Nepal. Eight types of tree
4 fodder (one leguminous and seven non-leguminous), used to supplement crop residue-based diets for
5 cattle during the dry season (November to May), were sampled for destructive analysis at three times
6 during this period of 1994 / 95. Methods for the determination of basic indicators of c~emical
7 composition, tannin fractions and two techniques for detennining digestI"bility in vitro were applied.
8 At the time of sampling, ranking exercises and informal interviews conducted with farmers were used
Q to assess their perceptions of the nutritive value of the eight fodder types and the nature of changes in
10 feeding value with the time of year. Large differences in nutritive value of the different fodder types
11 studied were apparent, both from farmers' perceptions and laboratory results. The extent of farmers'
12 abilities to discriminate the different fodder types on the basis of nutritive value appeared to be
13 broadly similar to the discriminatory powers of combinations of laboratory nutritive value assessment
14 methods. Seasonal changes in fodder quality were also evident from the assessment made by farmers
15 and in the laboratory assessments. However, individual instances of farmers predicting differences
16 that were not apparent from the suite of techniques applied in the laboratory, and vice versa, were
17 recorded. It is concluded that farmers have an extensive knowledge of tree fodder quality that
18 programmes aimed at the improvement of fodder quality and feeding strategies should seek to build
19 upon rather than replace. On the other hand, laboratory assessments of nutritive value clearly have
20 the potential to descn"be fodder quality in terms that small-holder farmers can comprehend providing
21.
that they are applied in line with farmers' objectives. A first step towards achieving this -i.e. to
22 determine the consistency and complementary of nutritive value assessments made in laboratories and
23 by farmers -has been explored in a companion paper (Walker et al., this volume).
24
Keywords25
26 nutritive value, indigenous knowledge, tree fodder
2

Introd uction
2 Resource-poor farmers in Nepal have a detailed indigenous knowledge system for descnoing the
3 nutritive value of the fodders from a wide rnnge of tree species that are used as dietary supplements
4 for J11min.'!nt livestock (Rusten and Gold, 1991; Thapa et ai., in press). Analytical chemists now have
5 at their disposal a range of laboratory methods \\ith the potential to predict the nutritive value of tree
fodder. The study reported in this and an accompanying paper examined the discriminatory power of6
7 the two approaches for evaluating the nutritive value of different types of tree fodder and explored
8 their comparability and potential complementarity. The research thereby addressed the role that
9 laboratory analyses might play in supporting the maintenance of existing tree fodder feeding systems
10 by farmers and in providing information on novel tree fodders and feeding systems in a form that
might be compreheDSlole to fanners.
12
13 Livestock are a key component of the mixed, hill-farming systems found in Nepal. They provide
14 draught power, income and dietary protein and promote the effective cycling of nutrients through the
15 system (Hopkins, 1985). Fodder from trees is particularly important as a green, high nitrogen, feed
16 source in the dry season (November to June) when other feeds are scarce (panday, 1982). This fodder
17 may be collected from forest areas or, increasingly, from trees grown on farmland, including the
banks of crop-terraces (Carter & Gilmour, 1989). A previous investigation of farmers' knowledge
]9 (Thapa et ai.. in press) has revealed two local classification systems for tree fodder; posi/o -kam
20 posilo and obano -chiso. These systems were found to be fundamental to famlers' perceptions of tree
21 fodder quality.
22
23 The literal translation of the Nepali terms posi/o and kam posi/o are nutritious (high nutritive value)
24 and less nutritious (low nutritive value) respectively. Farmers state that posi/o fodders promote milk
25 and butter fat production in lactating anim:lls, rapid live weight gain and animal health. They are
26 generally considered to be palatable and to satisfy appetite although these effects are, at least to some
27 extent. dependent on the type of livestock involved. In contrast, kam posilo fodder is not associated
3

1
2 loss, reductions in milk and butter fat yield and a general deterioration in health.
3
4 Obano is literally translated as 'dry and warm' and chiso as 'cold and wet'. The terms have been taken
5 by Rusten and Gold (1991) as referring, specifically, to the consistency of dung produced by anim:t1s
6 consuming the different types of fodder. However, fanners also state that obano fodder is highly
7 palatable. particularly during colder months. and is eaten voraciously. often causing constipation if fed
8 in excess. Obano fodder is said to improve animal health and generally contributes to milk and ghee
9 (clarified butter) production. It produces (literally) dry, firm dung -which must be viewed as
10 significant in a system in which the manual collection and application of manure-compost is the
primary means of maintaining soil fertility. Chiso fodders are reported to be less palatable and, if fed
12 in cold months, often result in anim~1s producing watery dung that is difficult to collect and spread.
13
14 Farmers recognise seasonal variation in the nutritive value of tree fodder. For example; as leaves
15 mature they are typically thought to become less chiso and more obano, although this is species
16 dependent Intra-species variability in fodder quality is consistently recognised by farmers for some
17 species (Ficus nemoralis, Bauhinia purpurea and F. roxburghii) while some farmers also recognise
18 sub-species-level variants in a further four species (F. lacor, F.semicordata, B.. variegata and
19 Saurauia nepaulensis). The varietal distinction used by farmers for F. semi cordata has been
20 recognised scientifically by the Forest Research Division in Nepal (Amatya, 1989). However,
21 varieties within the other species have not, to date, been differentiated botanically.
22
23 Laboratory analyses of feed composition (conventional proximate composition and detergent fibre
24 determinations) and estimates of digestibility conducted in vitro (e.g. neutral cellulase digestibility)
25 are used widely to investigate the nutritive value of a range of feeds. However, these methods are of
26 less certain value for evaluating tree fodder which may contain anti-nutritive factors such as t~nnin~.
27 In one study (Wood et al. 1994) .fodder from twelve out ofthineen Nepalese tree species evaluated
28 was found to contain tannins. Tannins have been associated with low digestibility and toxic effects on
29 livestock (Hagerman and Butler, 1991~ Makkar, 1993). Such observations would suggest that
4

conventional techniques may need to be augmented for effective assessment of the nutritive value of
2 tree fodder in the laboratory. A range of tannin assays and an in vitro gas production technique with
3 the potential to meet this need have become available recently. The gas production method
4 (Theodorou et al., 1994), which uses rumen microbes, is inhibited by the presence of t~nnin~ in the
5 substrate (Wood and Plumb, 1995), suggesting that it might be particularly useful as a predictor of the
6 nutritive value of tree fodders.
7
8 In the study reported here, a suite of conventional and novel nutritive value assessment methods was
9 applied to a set of tree fodder samples.These were collected to reflect the inter- and intra-species
10 variability in nutritive value recognised by farmers. At the same time, farmers were asked to rank
11 fodder samples in relation to their posilo -kam posilo and obano -chiso classification systems for
12 nutritive value. The specific objectives of the research were:
13 to examine the consistency of laboratory nutritive value assessments and farmer classifications of
14 tree fodder and the extent to which they were both able to differentiate fodder from different
15 species and types) at different times of the year;
16 to compare farmer classifications of tree fodder with indicators of nutritive value determined in
17 the laboratory; and
18
.
to identify, if posSIble, nutritive value assessment methods that, individually or in combination,
19 might be used to supplement farmers' assessments of tree fodder quality.
20
21 In this, the first of two papers, the first of these objectives i; addressed.
I -throughout this paper, and its companion, we describe distinguishable classes of trees within
species by the use of the use of the term type. This is in order to avoid confusion between botanically
differentiated sub-species and the distinct sub-types within species that have been identified by
farmers but not by taxonomists.
5
1 Materials and Methods
Study Site and Selection of Trees2
3 The study was undertaken within the boundaries of the Solma Village Development Committee area.
4 Terathum District, in the middle hills of eastern Nepal. Solma comprises approximately 3500 people
5 in a collection of hamlets on a single, East-facing, slope from 500 m to 2000 m in altitude.
6
7 Over 90 species of trees, shrubs and bamboos have been reported by farmers in Solma as being
8 providers of fodder (Thapa et al., in press). Eight representative and mdely-used tree types were
9 selected from these for the current study. The selected types included five botanically-differentiated
10 species of which three were differentiated into distinct types. Binomial and local names of the eight
11 tree types are presented in Table I.
12
13 Six groups of farm households were selected within the study area as a basis for stratifying the
14 selection of in~dual trees for sampling. These "farm groups" were selected as the smallest adjacent
15 set of farms on which all of the eight tree types under consideration were represented. All groups lay
16 at an altiWde of between 1100 m and 1700 m. Two trees of each of the eight types were selected
17 within the boundaries of each of the farm groups. Selected trees were all grown on the banks of bari
18 (ie. non-irrigated) crop-terraces, were indicated by the farmers owning them as being mature, but not
19 over mature, and were regularly lopped for fodder. Any trees showing visual indications of disease or
20 overshaded by other trees were excluded. Trees from a total of 43 farms were selected for sampling.21 across the six fam1 groups.
22
Ranking of Tree Fodder Quality by Farmers23
Ranking Procedures24
25 The selected trees were sampled for laboratory analyses at three sampling times (see Table 2). At the
26 second sampling time, farmers were asked to rank the fodder from the eight tree types in terms of
27 obano -chiso and posilo -kam posilo status. A branch with several leaves from each of the tree types
28 was placed on the ground. Informants were first asked to identify the branch with the most chiso
6

fodder. They were then asked to identify the most chiso of the rem~ining seven branches. The branch
2 with the third most chiso fodder was then selected and placed in rank order relative to the first two,
3 and so on until all eight branches had been placed in a rank order. The exercise was repeated but
4 ranking from most to least obano to cross-check responses. Inconsistencies identified by the repeat
5 were resolved, as necessary, through consultation with informants. A similar procedure was then
6 employed, using the same sample branches, to derive rankings for posi/o -kam posi/o status.
7
8 The ranking exercises were undertaken on an individual basis by a total of 69 farmers -including 33
9 of the 43 owners of the fodder trees sampled for analysis. 60 of the 69 farmers (15 men and 15
10 women of each of the two, main ethnic groups, Matawali and Bahun, living in Solma) were treated as
11 a core group for evaluating the rankings. Individual farmers giving rankings were asked not to
12 attnoute the same chiso or posi/o status to two fodders from different tree types.
13
14 In a separate exercise, conducted at the third sampling time, 42 of the 43 farmers who owned the trees
15 sampled during the study were asked, individually, to rank fodder from each tree type for its
16 comparative obano -chiso andposilo -kam posilo status across the months of the year during which
17 it was used2. The numbers offarmers using a particular fodder were not the same during each month
18 and different fodder types were used for different numbers of months. Therefore, the monthly ranks
19 given for each fodder were normalised to the number of ranks available by dividing the ranks given by
20 each farmer by the number ofmontbs during which he or she ranked (used) the fodder. Mean,
21.
normalised ranks for each month were then calculated across the farmers using the fodder in that
22 particular month. Data for months during which less than five farmers had ranked a particular fodder
23 were discarded.
2 -The months of the Nepali calendar sttaddle the months of the Julian calendar. For example, the
Nepali month of Baisak runs from the 16th of April to the 14th of May. Information on seasonal
patterns given by respondent fanners referred to Nepali months. In the text, these have been altered to
the fonn Apr/Mayetc.
7
Ancillary Data
2 The gender and ethnic group of all farmers participating in the ranking exercise were noted. The 43
3 farmers owning sample trees were also classified into three groups (A, B and C) depending on
4 whether they produced surplus food, were self sufficient or experienced food deficits during the year
5 and the size and structure of their livestock holdings were recorded. These farmers also provided, at
6 the second sampling time, descriptive data on the sample trees, including recent lopping history, an
7 estimate of age, site details (soil type, fertiliser regime, associated crops) and the ways in which fodder
8 from that tree was generally used (eg. fed as a sole feed or in a mixture).
9
Laboratory Analyses10
Sampling and Sample Preparation11
12 Fodder samples were taken from each of the 96 selected trees at three sampling times during the
13 course of the study (on the dates shown in Table 2). The exact dates taken to represent. each of the
14 three sampling times differed with tree type as a result of their differing phenologies. When
15 sampling, four sub-samples of fodder were taken from mid-canopy on all four sides of the tree along
16 with a further sub-sample from as high in the canopy as practicable. The five sub-S3I:nples were then
17 well mixed to create a final, representative, bulked sample.
18
19 Leaves were removed from the top of the petiole and their surfaces cleaned with tissue paper and
20 rinsed with water. The individual leaves were pooled and DJixed to give a sample representative of the
21 tree as a whole. This sample was chopped coarsely and oven dried at 5Q:t3°C for 72 hours (h). The
22 dried sample was ground in a heavy duty commercial coffee grinder and sieved through a 1 mm
23 screen. It was then mixed and. using a sample divider, subdivided for analysis in the laboratories at
the Pakhribas Agricultural Centre, Nepal (proximate constituents, detergent fibre analysis and neutral24
25 cellulase digestibility) and the Natural Resources Institute, U.K. (tannin analysis and gas production).
8
Analytical Procedures1
2 The dry matter content (DM) of the fresh samples was measured by taking 500g of the coarsely
chopped leaf material, drying it at I OO:tsO C for 48h and reweighing.
4
5 Residual dry matter, crude protein (CP), ether extract (BE), total ash (TA) and crude fibre (CF) were
6 determined using the methods of the AOAC (1980). Acid detergent fibre (AD!'), neutral detergent
7 fibre (NDF), lignin. acid detergent insoluble nitrogen (ADIN) and neutral detergent insoluble lignin
8 (NDIN) were assayed by the methods of Goerring and Van Soest (1970) Neutral cellulase
9 digesnoility (NCD) was determined using the method ofDeBoever et al. (1988).
10
11 Tannins were extracted into 70% aqueous acetone and analysed for protein precipitation activity
12 (PPA), total phenols (TP) and condensed t:lnnin~ (CT) using the methods described by Wood and
13 Plumb (1995). Non extractable condensed t~nnins (NXCT) were esri~ted by washing out the
14 extractable t:lnnin~ and treating the residue \\ith acid butanol using the conditions described by Porter
15 et aJ. (1986). The residue was washed five times in 15 ml 70% aqueous acetone, the residue being
16 recovered by filtration into a scinter glass crucible (porosity Pl60). Acetone was removed under a
17 stream of compressed air and the residue dried at 6OoC for 2 h. To 10 mg residue, weighed into a 100
18 ml Duran bottle, 15 ml methanol, 90 m1 acid butanol and 3 m1 ammonium ferric sulphate solution
19 were added to give the reagent mixture descn"bed by Porter et af. (1986). The reaction conditions and
20
21
optical density were measured as descn"bed by Porter et of. (1986), the optical densities being.multiplied by 17.42 to adjust them to the same reagent volume used for extractable cr.
22
23 In vitro gas production was performed using the method of Theodorou et af. (1994) as described by
Prasad et al. (1994), but the incubations were terminated after 70 h. Cumulative gas production at 12,24
24, 52 and 70 h (CG12, CG24, CG52, CG70 respectively) and dry matter disappearance at 70 h25
(D1'IIm70) were the variables selected for data analysis.26
27
All data were corrected to a dry matter basis using the residual dry matter data.28
9

Statistical Analyses1
2 All statistical analyses were conducted using the standard directives and library procedures provided
3 by Genstat 5, release 3.1 (Lawes Agricultural Trust, 1993).
4
5 The internal consistency of farmers' rankings for obano -chiso and posiJo -kam posiJo status was
6 tested by a series of Spearman rank correlations (rs) conducted on paiIwise associations of the ranks
7 given by individual farmers (n=3540). The consistencies of obano -chiso and posi/o -kam posi/o
8 rankings between respondents of different gender, ethnic group and economic status, and for livestock
9 holding size were tested by the application of i tests for two independent samples across ranks.
10
11 The effects of the principal factors and their interactions on the analytical variables were evaluated
12 using the REML directive of Genstat's variance components analysis. This allowed the effects of
13 unbalanced factors in the general ANOV A model to be evaluated and the variances within and
14 amongst individual trees to be compared.
15
16 The analytical data comprised a number of variables that were judged likely to be. intercorrelated.
17 Canonical variates were calculated from linear combinations of the analytical variables to exaJDine the
18 ability of the analytical procedures, in combination, to discriminate the eight fodder types. These
10 were used as linear discriminant functions to assess the ability of the combined laboratory analysis
20 methods to assign individual samples of each fodder correctly to the type of tree from which it was
21 sampled.
22
Results23
Ranking of Tree Fodder Quality by Farmers24
Consistency of Application of Obano -chiso and Posi/o -kam posi/o Classifications25
26 Calculation of rs for pairwise associations of individual farmers' rankings according to the obano -
27 chiso and PfsiJo-kam posiJo classification systems provided a test of the consistency with which these
28 systems were applied. For obano -chiso rankings, the mean rs between pairs of faJDlers was
10

2
3
posi/o status were slightly less consistent mth a mean rs of 0.553 mth a value of s of 0.291
5
6
7
8
9
10
11
12
13
14 than five cows.
15
16
17
18
19 comparisons was 0.01 with a value ofs of 0.390 confirming the independence of the two systems.
20
21 Mean Rankings and Consensus Between Fanners
22
23 sample size (n = 60) pennitted the assumption that the rankings would be distn"buted in an
24 approximately DOnna! manner. Rankings were, therefore, converted to an ordinal data set by
25 calculating mean ranks for the fodder from each type of tree. This operation allowed issues of
26 consensus between farmers to be explored in more detail through comparisons based on least
27 significant differences calculated from the individual standard errors (SEM). The means ranks for
11

1 obano -chiso and posi/o-kam posi/o status given by individual farmers to the fodder from each tree
2 type are shown in Table 3
3
4 The general consistency of the rankings for both classification systems is reflected by the spread in the
5 mean ranks (obano -chiso: 1.37 -6.85; posi/o-kam posi/o: 2.40 -7.95). However, clustering at
6 certain points on the scale suggests that this consistency was not uniform amongst fodder types. This
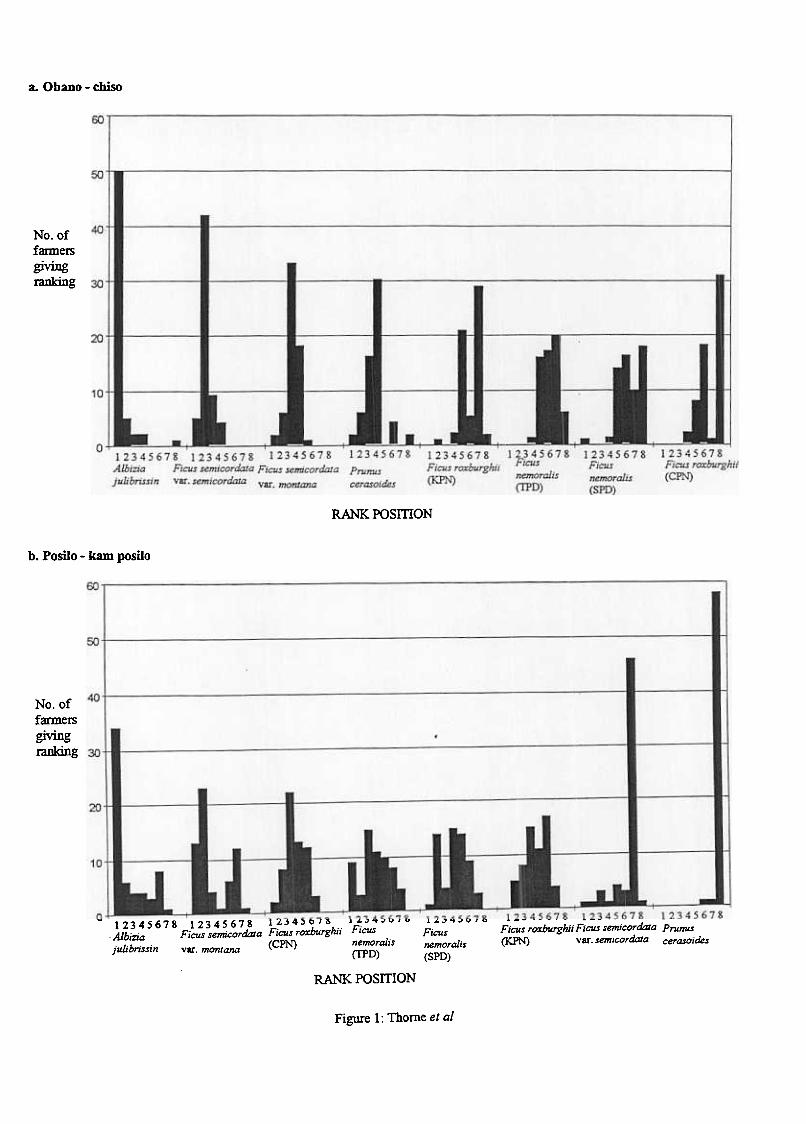
7 is illustrated, graphically, for the obano -chiso and the posi/o-kam posi/o rankings in Figure la and
8 lb respectively. The extent of consensus amongst farmers regarding the relative obano -chiso and
9 posi/o-kam posi/o status varied considerably with the type of fodder being ranked. Little disagreement
10 was observed regarding the chiso nature of Ficus semicordata val. semicordata andA/bizia ju/ibrissin
11 or the kam posiJo nattIre of F. semicordata vaT. semicordata and Prunus cerasoides. In general, the
12 clearer agreement between farmers regarding obano -chiso status suggested by the pairwise rank
13 correlations is further emphasised by the patterns of agreement seen in Figure 1. Interestingly, the
14 degree of consensus for obano -chiso status appeared to be greater for fodder types that were ranked
15 more obano.
16
17 Seasonality of Tree Fodder Utilisation and Farmers' Perceptions of Seasonal Patterns
18 in its Quality
19 The utilisation patterns of the eight fodder types are summarised in Figure 2. All fodder types, except
20
21
Prunus cerasoides. were used by more than 10% of the farmers owning sampled trees in NovlDec and.Feb/Mar. Albizia julibrissin and Ficus roxburghii were fed earlier, in OctINov, and the use of F.
22 semicordata and F. roxburghli continued through Marl Apr. P. cerasoides was only used extensively
23 from Mar/April to May/Jon and was the only fodder utilised extensively during AprlMay. P.24 cerasoides and Ficus nemora/is were the only trees providing fodder in May/Jun and use of the latter
25 persisted into Jun/Jul. F. nemoralis differed ftom all other species in having two separate periods of
26 extensive utilisation. the first being from Nov/Dec to Feb/Mar and the second from May/Jnn to
27 JuD/Jul.
28
12

1
2
3
4
5
6
7
8
9
10
11 Laboratory Analysis
12 Effects ofFann Group
13 A significant. but unsystematic, effect (P < 0.05 -P < 0.01) of the farm group in which sampled trees
14 were located was observed in several of the analytical variables (BE, CF, ADF, ADIN, NDIN, cr,
15 NXCT, CG12). The only evidence of interactions of tree species mth faIn1 group was in the data for
16
17 for Ficus semicordata and Ficus roxburghii respectively.
18
19 Effects of Fodder Type
20 Highly significant effects (P < 0.00 1) of tree species on th~ values of all the analytical variables were
21 observed. The principal characteristics of the five species studied are summarised in Table 4.
22 However, there was also evidence of compositional differences within species (i.e. between the fodder
23 types identified by farmers). These are illustrated by the data presented in Table 5. The two sub-
24 species of Ficus semicordata differed significantly (P < 0.001) in their DM and CF contents. Ficus
25 nemoralis (fPD) contained significantly less extractable (P < 0.01) and non-extractable (P < 0.001)
26 condensed t~nnin~ than Ficus nemora/is (SPD). These observations were consistent with the
27 significantly higher (P < 0.05) NCD of Ficus nemora/is (TPD). There were no significant differences
28 for F. roxburghii.
13
1 Effect of Sampling Time
2
3
4
5
6
7 sampling time 3 mth data for sampling times 1 and 2.
8
9
10
12
13 pooled as no significant effects were observed of fodder type within this species on these analytical
14 variables). DM contents of Ficus semicordata and Prunus cerasoides were similar at each sampling
15 time whilst A. ju/ibrissin, F: nemora/is (SPD and TPD) and Ficus roxburghii exm"bited a marked
16 decrease in DM at the third sampling. This pattern was minored by changes in CP content CP
17 contents of Ficus roxburghii and A/bizia ju/ibrissin and, to a lesser extent, both types of Ficus
18 nemora/is increased significantly between the second and third samplings (percent3;ge increases of
19 between 13% [F. nemora/is (SPD)] and 61% [.4. ju/ibrissin] were observed). NXCT contents tended
20 to increase over the sampling times, except in the case of F. nemora/is (TPD) which eXhIoited a sharp
21.
decrease in NXCT between sampling times 2 and 3 and A/bizia ju/ibrissin which remained constant
22 in NXCT. There appeared to be little effect of sampling time on NCD, with the exception of Ficus
23 roxburghii which became more digestible at the third sampling time and Prunus cerasoides, for which
24 NCD appeared to vary considerably over the three sampling times.
14.
1 Ability of the Analytical Variables in Combination to Distinguish Fodder from
Different Tree Types2
3 Separate canonical variates were calculated for the analytical variables for each of the three sampling
4 times. Heavily-weighted analytical variables included CP, and indicators of tannin content (fP and
5 PPA) and in vitro digestIoility (NCD and DMD70) and were similar for each sampling time. The
6 ability of the canonical variates to assign samples of fodder from individual trees to the type of tree
7 from which each was sampled is summarised in Table 6 for each of the three sampling times.
8 Assignments to the two non-Ficus species, A/bizia ju/ibrissin and Prunus cerasoides were consistently
9 successful Assignments to the three Ficus species were generally successful amongst species -except
10 to Ficus roxburghii at sampling times one and two and Ficus semicordata vaT. montana at sampling
II time two. However, for all Ficus species, a proportion of false assignments within species were
12 observed at all sampling times -that is Ficus roxburghii (CPN) and F. roxburghii (KPN) , Ficus
13 nemoralis (SPD) and F. nemoralis (fPD) and the two sub-species of F. semicordata were not reliably
14 discriminated. Success rates for the assignment of these types ranged from 58.3% correctly assigned
15 to 91.7% correctly assigned.
16
Discussion17
18 Ranking of Tree Fodder Quality by Farmers
19 Consistency of Application of Ohano -chiso and Posilo -kam posilo Classifications
20 Correlations between the rankings given by individuals, indicated that the obano -chiso and posi/o -
21 kam posi/o classification systems were generally applied in a consistent manner by farmers. This
22 finding agreed with an earlier study of the knowledge of tree fodder quality held by farmers in Solma
23 (Thapa et ai, in press) and was implicit, for obano -chiso status, in a study conducted in the middle
24 hills of Central Nepal (Rusten and Gold, 1991). Unpublished research on tree fodder resources in the
25 hill districts of Uttar Pradesh, India suggests that classification of fodder values used by farmers there
26 is consistent with the obano -chiso cIassi.fication (Louise Garde, pers comm). This suggests that the
27 ohano -chiso and posi/o -kam posi/o systems are widely and consistently applied, indicating a
28 widespread perception of their practical utility.
15

1 Further support for this view is provided by the lack of evidence of differences in the application of the
2 systems across gender, and particularly, across ethnic and wealth di~sions that might be expected to
3 constitute at least partial barriers to the flow of information on tree fodder quality. Research by Thapa
4 has also tested gender differences (n=40) and found no significant differences (Thapa et aJ., in press)
5 while work by Rusten and Gold (n=13) suggested a gender-based difference in the use of the term
6 obano (Rusten and Gold, 1991). Differences in the rankings of tree fodder by farmers with five or
7 more cattle and those with less than five cattle are noteworthy, although confined to differing
8 perceptions of the relative posilo status of only one of the fodder types studied (Albizia julibrissin).
9 This may be related to differences in the relative posilo stanIS of the fodder types when fed to different
10 livestock species and, if so, would be consistent with research findings indicating diffeI:ences in the
responses of large and small TI)minants to protein supplementation. It is worth noting that a previous
12 study in Solma (Thapa et al., in press) and unpublished research from Uttar Pradesh (Louise Garde,
13 pers comm) has shown that farmers distinguish fodder attnoutes according to whether they are fed to
14 cattle! buffalo or goats.
15
16 The independence of the obano -chiso andposilo -kam posilo classification systems suggests that
17 farmers' perceptions of tree fodder quality are quite sophisticated in that they are able to differentiate
18 nutritive value into more than one component However, Thapa et of (in press) have found that,
19 although obano fodders were generally also posi/o fodders, chiso fodders are not necessarily kam
20 posiJo fodders. This suggests a complexity that would make the biological interpretation of the two
21 classification systems and the elucidation of the relationships between them difficult without more
22 detailed in vivo studies.
23
Mean Rankings and Consensus Between Farmers24
The mean rankings presented in Table 3 indicate that farmers perceive a broad range of variation in25
the nutritive value of tree fodder as represented by both classification systems. However, a marked26
lack of consensus regarding the relative obano -chiso or posilo-kam posilo stablS of some of the27
16

1 fodder types studied was also apparent. There are at least three possible and not mutually exclusive
2 explanations of this observation. as follows.
3
4 Firstly, some of the fodder types studied were similar in nutritive value. The fodder types that were
5 not well-separated in terms of their relative obano -chiso (Ficus roxburghii and Ficus nemoralis) and
6 posilo-kam posilo (Ficus semicordata vaT. montana, Ficus roxburghii (CPN) and Ficus nemoralis)
status (see Table 3) were, in belonging to the genus, Ficus, closely related botanically. Some support
8 for this view comes from the laboratory assessments of nutritive value. The results of the linear
Q discriminant analysis presented in Table 6 also suggest similar nutritive values for the. six Ficus types
10 studied.
11
12 Secondly, differences in the rankings given by individual fam1ers reflected real variability in the
13 nutritive value of the different types of fodder amongst farms. The laboratory analyses indicated
14 effects of the farm group from which samples were taken on chemical composition and; possibly,
15 nutritive value. However, these effects did not appear to operate consistently across the analytical
16 variables studied and are, therefore, unlikely to explain the relatively systematic differences in
17 consensus for individual fodder types.
18
19 Finally, although farmers were asked to consider the nutritive value of the fodder types studied for
20 cattle feeding only, differences were observed in the application of rankings by fam1ers mth different
21.
sizes of cattle holdings. This implies that individual farmers' perceptions of the relative value of
22 different types of fodder are strongly dependent on the nature of their livestock. holdings. An
examination of the distribution of rankings for the posi/o-kam posi/o status of Ficus semicordata var.23
montana (see Figure Ib) illustrates this possibility. Farmers appeared to divide into two distinct24
25 groups, one centred on a lank of two and the other on a lank of six, when assessing this fodder type
for posilo status. The mean livestock holding size for the first of these two groups of farmers was 4.6126
(SEM = 0.83) tropical livestock units (1LUs) and for the second 2.93 (SEM = 0.33) TLUs. The larger27
holding sizes generally reflected higher numbers of cattle and buffalo. It is suggested, therefore, that28
the distn"bution of rankings for a particular fodder type and hence, perceptions of its quality, might29
17
1 well be related to its intended use. This equates with farmer distinctions between fodder for different
livestock species as previously discussed.
3
4 Consensus between farmers appeared to be !inner for obano -chiso than for posi/o-kam posi/o sbtus.
5 The current study offers no obvious explanations for this observation. However, Thapa et al (in press)
6 suggest that farmers may employ a wider range of indicators of obano -chiso status than are available
for posi/o-kam posi/o status. Reasons for the greater agreement between farmers with regard to
8 fodders at the obano end of the obano -chiso classification scale are also unclear. The observation
Q may be an artefact arising from the fodders selected. The value attached to obano fodder means that it
10 is likely to be more widely used. This f~miliarity might allow farmers to take a more.consistent view
11 of the relative qualities of obano fodder types. It has been postulated in the companion to this paper
12 (Walker et al., in press) that chiso characteristics might be associated with anti-nutritive factors.
13 Levels of anti-nutritive factors vary mth genotype and in response to environmental changes
14 (D'Mello, 1992). Thus, a link between chiso characteristics and levels of anti-nutritive factors would
15 make chiso status inherently more variable than obano status and. therefore, consensus regarding
16 chiso fodders inherently less stable.
17
18 Seasonality of Tree Fodder Utilisation and Fanners' Perception of Seasonal Patterns in
its Quality19
20 Seasonal patterns in fodder utilisation differed considerably with tree type. The main period of.21 utilisation of the widest range of fodder types occurred between November and April. A study
22 conducted in the nearby village development committee of Jirkhimti and elsewhere in eastern Nepal
23 (Thome et ai, unpublished data) has shown that this is also the period of most intensive usage with
24 tree fodder often contn"buting more than 50% of the dry matter intakes of individual animals.
25 However, the critical period of green fodder shortage during the year (and hence the period during
26 which tree fodder assumes its greatest importance) is widely stated by farmers to be May -June,
immediately before the onset of the monsoon rains. Only one of the eight fodder types studied27
(Prunus cerasoides) was used during this period. Panday (1982) has reported that P. cerasoides is28
18

1
2
3
4
5 following leaf shedding in May.
6
7
8
9
10
11
12
13
14 perception of increasing chiso status (a reduction in nutritive value) between November and January
15
16
17
18 extractable tannins in April as leaf senescence and shedding. Some other, but not all, of the 13
19
20 be linked to compositional changes such as these, although the data from this study was inconclusive.
21
22 This evaluation of famlers' perceptions of changes in obano -chiso and posilo-kam posilo status was
23 confined to seasonal trends within species. Therefore, the extent to which the data support
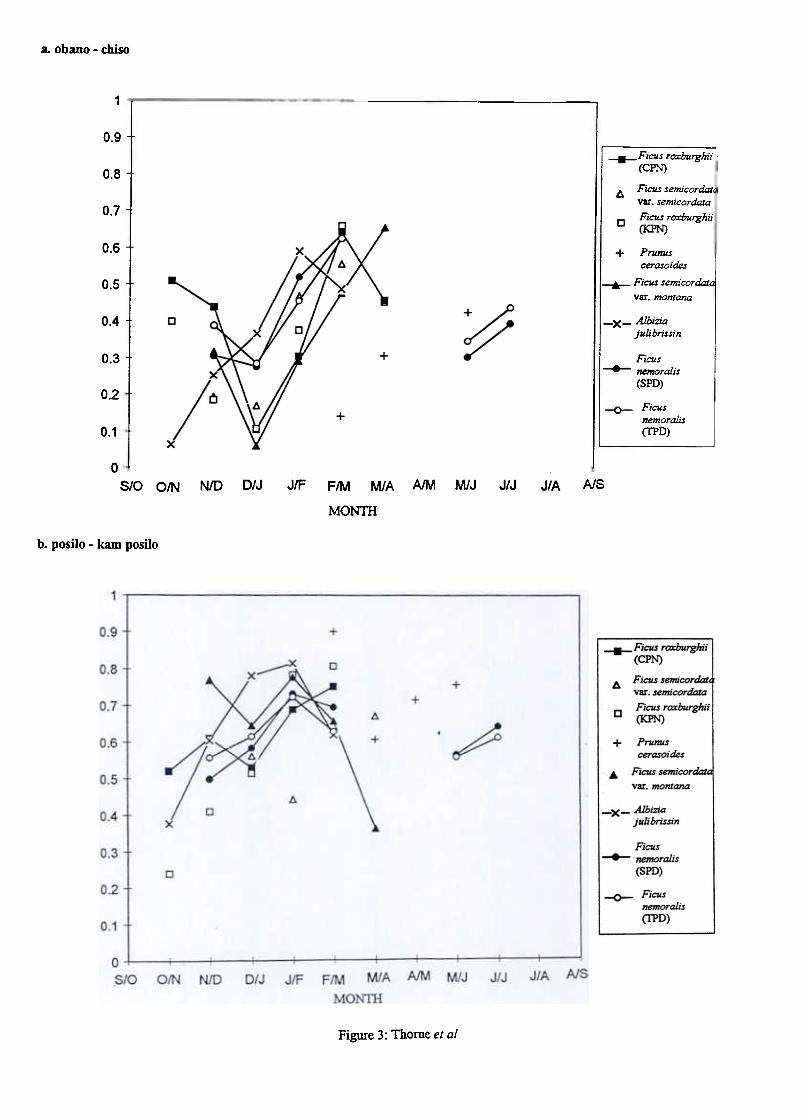
24 comparisons amongst fodder types is limited. However, it is apparent from Figure 3 that some species
25 were perceived to be improving in nutritive value at the same time as others were seen to be declining.
26 This might have affected the relative rankings given to the fodder types by individual farmers making
27 use of a particular fodder type at different times of year, thereby furnishing a further possible
28 explanation of the lack of consensus in the rankings for some fodder types.
19
Laboratory Analysis1
Effects ofFann Group2
3 The area on the Solma hillside from which samples were taken clearly influenced the values of a
4 number of the analytical variables. However, the differences observed did not appear to reflect the
5 effects of any systematic source of variation such as altitude or aspect. It is likely that the effects of
6 fann group represented the combined influences of an amalgam of environmental factors which affect
7 tree fodder quality. There is a number of such factors (e.g. altitude, slope, aspect. photon flux density,
8 soil type) which are also likely to interact but. there appears to be little published information that
9 would allow the quantitative effects of environment on fodder quality to be predicted. The extent to
10 which these relationships might be researchable to assist in the planning of practicable fodder tree
11 planting regimes for optimising fodder quality remains uncertain.
12
13 Effects of Fodder Type
14 The range in protein content (121 -263 g/kg DM), non-extractable tannin content (158 -637
15 ODssormlg DM) and in vitro digesnoility (363 -623 g/kg DM) observed in the five species studied was
16 consistent with farmers' perceptions of considerable variation amongst them in nutritive value. As all
17 five species are mdely used throughout Nepal (panday, 1982), this further confirms the finding of
18 Thapa et oJ (in press) and Garde (pers comm) that nutritive value is by no means the only criterion
19 applied by farmers in tree species selection. An improved understanding of the range of and relative
20 weights applied to these criteria would appear to be a pre-rec;uisite for applied research aimed at the
21 development of reliable recommendations on fodder production and feeding strategies. The current
22 study suggests that the effective inclusion of considerations of nutritive value into this idnd of research
23 would be complicated at present by the failure of scientists to recognise systematic sources of variation
24 within species. The perception that farmers have of distinct types of tree within species is supported
25 by the results presented here, with significant differences observed in the chemical compositions of
Ficus nemora/is (SPD) and F. nemora/is (IPD) as well as the botanically-differentiated sub-species of26
27 F. semicordata. In the case of the fonner, these differences were, notably, in tannin contents. The
protein binding ability of tannins means that such differences are likely to be very important in28
20

1 determining the nutritive value of a tree fodder and its role in providing supplementarY protein in crop
2 residue-based feeding systems.
3
Effect of Sampling Time4
5 The changes in nutritive value over time that were recognised by farmers in their obano -chiso and
6 posiJo-kam posiJo classifications were also indicated by differences observed amongst the three
7 sampling times in the analytical variables determined. Changes of similar magnitude mth time were
8 observed in an earlier study of fodder from 13 Nepalese tree species (Wood et ai, 1994).
9
The analytical data strongly indicated that the nature of these changes in nutritive value were unlikely10
to be consistent amongst species. This probably reflects differences in the phenologies and11
12 management of the different species. Ancillary information provided by farmers o\VniDg the sampled
trees suggested that differences amongst fodder types in the patterns of change in DM and CP13
contents was associated with the lopping regime employed. Ficus roxburghii and Albizia julibrissin14
were subjected to the highest lopping intensities. Some of the Ficus nemoralis trees sampled were15
lopped less intensively but, where this was the case, were generally lopped twice during the period of16
utilisation. Generally, levels of tannin!: increased with leaf maturity, except for Albizia julibrissin (the17
only legume amongst the species studied) in which they remained constant over the sampling period18
and Ficus nemoralis (fPD) in which levels declined sharply at the third sampling time. It is19
20 postulated that foliage collected from F. nemoralis during sampling time three may have been.regrowth as this species tends to drop leaves during the month of May (Wood et ai, 1994).21
22
Ability of the Analytical Variables in Combination to Distinguish Fodder from23
Different Tree Types24
Assignments of indi~dual samples to their actual fodder types were less reliable between the fodder25
types identified by farmers than amongst the botanically differentiated species. Success rates with the26
botanically differentiated sub-species of Ficus semicordata (var. semicordata and vax. montana) were27
intermediate. However, in no case were less than 50% of samples of a particular fodder type28
21

1 accurately assigned to type by the linear discriminant functions. This does suggest that Teal, if
2 somewhat blurred, differences in nutrient profiles and hence in nutritive value existed amongst all
fodder types.
4
5 It is interesting to draw the parallel between the reliability of assignments to species based on nutrient
6 profiles and the degree of consensus shown by farmers with respect to the relative ranks of the
7 different fodder types. In general, the fodder types that were less reliably discriminated by the
8 combinations of analytical variables (i.e. the two type of Ficus nemoraJis and the two types of Ficus
9 roxburghii) were also those on which farmers were less able to agree relative rankings. This implies
10 that, whilst real differences may exist in the nutritive values of these variants, these might not be large
11 enough to affect the performance of ~nim~ Is under the conditions in which they are kept. It should be
12 pointed out that the differentiation of variants practised by farmers need not necessarily be based
13 solely on nutritive value but might also focus on morphological or agronomic charactensncs.
14
15 The eight types of fodder studied were selected to represent a range in nutritive value according to the
16 perceptions offanners recorded by Thapa (1994). Tree fodder is used by farmers to supplement low-
17 protein basal diets so the eight fodder types should V31Y considerably in their ability to supply useable
18 protein in such diets. It is encouraging, therefore, and indicative of a general consistency between the
19 indicators used by fanners and in the laboratory to predict nutritive value, that the most hearuy
20 weighted analytical variables in the calculated canonical variates were those that Inight be expected to
21 influence protein supplies most. This observation, and the general consistency amongst sampling
22 times in both the variables that were heavily weighted and the consistency of assignments to fodder
23 types, suggests that a reliable suite of techniques for assessing the nutritive value of tree fodder might
24 be devised from this work. This suite of techniques would have the advantage of going beyond a
25 theoretical consideration of the relative importance of the different components of protein supply to
26 being clearly focussed on the objectives that farmers have when they use tree fodder.
22

Conclusions
2 It is concluded that farmers have an extensive knowledge of tree fodder quality that programmes
3 aimed at the improvement of fodder quality and feeding strategies should seek to build upon rather
4 than replace. On the other hand, laboratory assessments of nutritive value clearly have the potential
5 to descnre fodder quality in temlS that small-holder farmers can comprehend provided they are
6 applied in line with fam1ers' objectives.
7
8 The study described in this paper has suggested that a fim1 biological basis may underlie the
9 classification systems used by farmers in Nepal to describe tree fodder quality. This is not entirely
10 surprising as these systems have been based on many years of empirical obseIVation of.the responses
11 of~nim~ls to supplementation with different types of tree fodder. However, the obano -chiso and
12 posilo-kam posiJo classifications used are quite complex and appear to be applied with'vaI:ying success
13 depending on the type of fodder under consideration.
14
15 The study has also suggested that farmers' classifications and the information that may be gained
16 from the application of a range of laboratory techniques for assessing nutritive value are companole
17 with each other. If this is shown to be the case, the application of laboratory assessment offeed
18 quality that is properly focussed on farmers' requirements becomes possible.
19
20 In order to assess the viability of such an approach, more detailed analysis of the correspondence
21.
between farmers' ranking of different types of tree fodder and predictions of nutritive ~ue from the
22 anal}1ical methods together with an evaluation of the complementarity of the two approaches is
23 required. This is presented in a companion paper (Walker et al., in review).
24
25 Acknowledgements
26 The authors would like to acknowledge the role of the following people in the research reported in
27 these two papers. The farmers of Solma~ Mr F .E. Tollervey, Director P AC~ Laboratory staff at P AC-
28 Messrs. B.B. Tamang, B. Yaday, M.B. Tamang; T .B. Magar, and at NRI Ms A Murray and Mr B. T.
23
1
2
3
4
5 andMr S L Sherpa, PAC.
6
7
8
9 provided or views expressed.
10
References11
12 Amatya. 8.M 1989. Ficus semicordata Buch.Ham.ex Sm. and its taxonomy. Forest Research Division
13
14
15 AOAC 1980 Official methods of analysis. 13 th Edition. Association of Official Analytical
16 Chemists, Washington DC.
17
18 Carter, AS. and Gilmour, D.A 1989. Increase in tree cover on private farmland in central Nepal.
19 Mountain Research and Development, 9 (4): 381-391
20
21 .D'Mello, J.P.F. 1992. Chemical constrains to the use of tropical legumes in animal nutrition. Ammal
22 Feed Science and Technology, 38: 237-261.
23
24 De Boever J L, Cottyn B G, Andries J I, Buysse F X and Vanacker J M 1988 The use of a cellulase
25 technique to predict digestibility, metabolizable and net energy of forages. Animal Feed Science and
26 Technology 19 247 -260.
27
24
l
1 Goerring H K and Van Soest P J 1970 Forage fibre analysis (apparatus, reagents, procedure and
2 applications). Agricultural Handbook No 379. United States Department of AgricultQre, Washington
3 DC.
4
5 Hagerman A E and Butler L G 1991 Tannins and lignins p 360 -388. In Herbivores. Their
6 interactions with secondary plant metabolites. 2nd edition vol I The chemical participants. eds
7 Rosenthal G A and Berenbaum M R pub Academic Press.
8
9 Hopkins, N.C.G. 1985. Nepal: Fodder trees. World Animal Review, 56: 18-23.
10
11 Makkar H P S 1993 Antinutritional factors in foods for livestock. p69 -85 In Animal Production in
12 Developing Countries, Occasional Publication No 16, British Society of AniIna1 Production. ed Gill
13 M, Owen E, Pollott G E and Lamence T L J.
14
15 Panday, KK 1982. Fodder trees and tree fodder ofNepaJ. Sahayogi Prakashan, KathmaIldu. Nepal
16
l7 Porter L P, Hrstich L N and Chan B G 1986 The conversion of procyanidins and prodelphinidins to
18 cyanidin and delphinidin. Phytochemistty 25 223 -230.
19
20 Prasad C S, Wood C D and Sampath K T 1994 Use of in vitro gas production to evaluate rumen
femlation of untreated and urea treated finger millet stra~ (E/eusine caracana) supplemented with21
22 different levels of concentrate J Sci Food Agric 65 457 -464.
23
Rusten, E.P. and Gold MA 1991. Understanding an indigenous knowledge system for tree fodder24
via a multi-method on-farm research approach. Agroforeslry Systems 15 : 139-16525
26
Tbapa, B. 1994. Farmers' ecological knowledge about the management and use of farmland tree27
fodder resources in the mid-hills of eastern Nepal. PhD thesis. School of Agricultural and Forest28
Sciences, University of Wales, Bangor29
25
1 Thapa, B., Walker, D.H., Sinclair, F.L., (in press) Indigenous knowledge of the feeding value of tree
2 fodder. Animal Feed &ience and Technology
3
4 Theodorou M K. Williams B A. Dhanoa M S, McAllan DB and France J 1994 A new gas production
5 method using a pressure transducer to determine the fermentation kinetics of romin:lnt feeds. Animal
6 Feed Science and Technology 48 185 -197.
7
8 Walker, DR, Thapa, B., Thome, P., Sinclair, FL., Wood, C., Subba, D.B.(in review) Indigenous and
9 laboratory assessment of the nutritive value of tree fodder. Part 2: Comparison offarmer and
10 laboratory assessment Animal Feed Science and Technology
11
12 Wood C D and Plumb V E 1995 Evaluation of assays for phenolic compounds on the basis of in vitro
13 gas production by rumen micro-organisms. Animal Feed Science and Technology 56 195 -206.
14
15 Wood C D, Tiwari B N, Plumb V E, Powell C J, Roberts B T, Sirimane V P D, Rossiter J T and Gill
Interspecies differences and variability with time of protein precipitation activity of16 M 1994
extractable t~nnjn~, crude protein, ash. and dry matter content of leaves from 13 species of Nepalese17
18 fodder trees. Journal of Chemical Ecology 203149 -3162.
19
26

Table 1: The eight types of tree used in the swdy.
Botanical nameLocal name
Ficus nemora/is (SPD)Sano pate dudhilo
Ficus nemora/is (TPD)Thulo pate dudhilo
Chillo pate nebharo Ficus roxburghii (CPN)
Khasro pate nebharo Ficus roxburghii (KPN)
Rai khanyu Ficus semicordata var. montana
Kbasrekhanyu Ficus semicordata var. semicordata
Prunus cerasoidesPainyu
A/bizia ju/ibrissinRato siris
Botanical names have been adhered to throughout the text. Where distinctions are made within
species, by farmers, these have been discriminated by the addition of an abbreviation of the local name
(e.g. Ficus nemora/is (SPD».
27

Table 2: Timing offodder samples for each of the eight tree types sampled.
Sampling time
Time 1 Time 2 Time 3
midFeb end Feb mid JuneFicus nemora/is (SPD)
Ficus nemora/is (TPD) midFeb end Feb mid June
midFeb mid March mid JuneFicus roxburghii (KPN)
mid March mid JuneFicus roxburghii (CPN) mid Feb
mid March mid JuneA/hizia julihrissin midFeb
mid Feb mid March mid AprilFicus semicordata val. montana
midFeb mid March mid AprilFicus semicordata var. semicordata
midFeb mid March mid AprilPrunus cerasoides
28
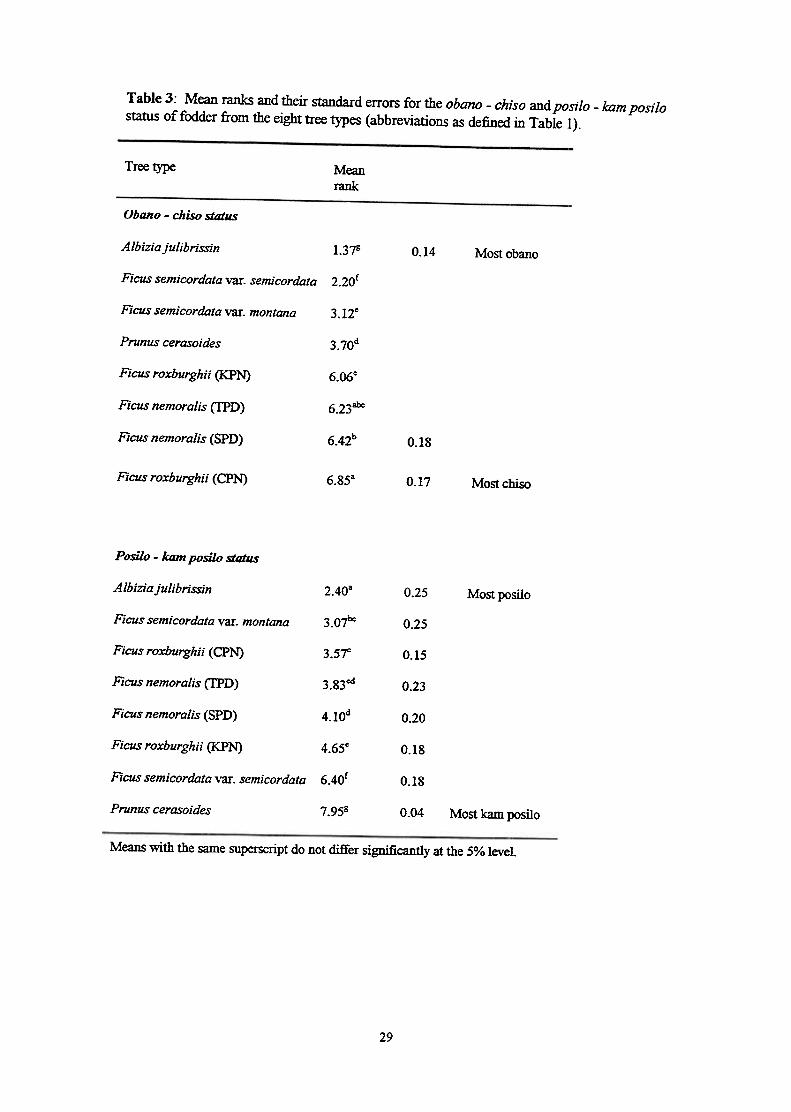
Table 3: Mean ranks and their standard errors for the obano -chiso and posi/o -kam posi/ostatus offodder from the eight tree types (abbreviations as defined in Table 1).
Tree type Meanrank
Obano -chiso status
Albizia julibrissin 1.37S 0.14 Most obano
2.20£Ficus semicordata vaT. semicordata
Ficus semicordata val. montana 3.12e
Prunus cerasoides 3.70d
Ficus roxburghii (KPN) 6.06C
Ficus nemora/is (1PD) 6.23abc
Ficus nemoralis (SPD) 6.42b 0.18
Ficus roxburghii (CPN) 6.8Sa 0.17 Most chiso
Posilo -kam posilo status
Albizia julibrissm 2.40' 0.25 Most posilo
3.07bcFicus semicordata VaT. montana 0.25
Ficus roxburghii (CPN) 3.5~ 0.15
Ficus nemora/is (TPD) 3.83cd 0.23
Ficus nemoralis (SPD) 4.10d 0.20
Ficus roxburghii (KPN) 4.6SC 0.18
Ficus semicordata VaT. semicordata 6.40£ 0.18
Prunus cerasoides 7.9Sg 0.04 Most kam posilo
Means with the same superscript do not differ significantly at the 5% level.
29
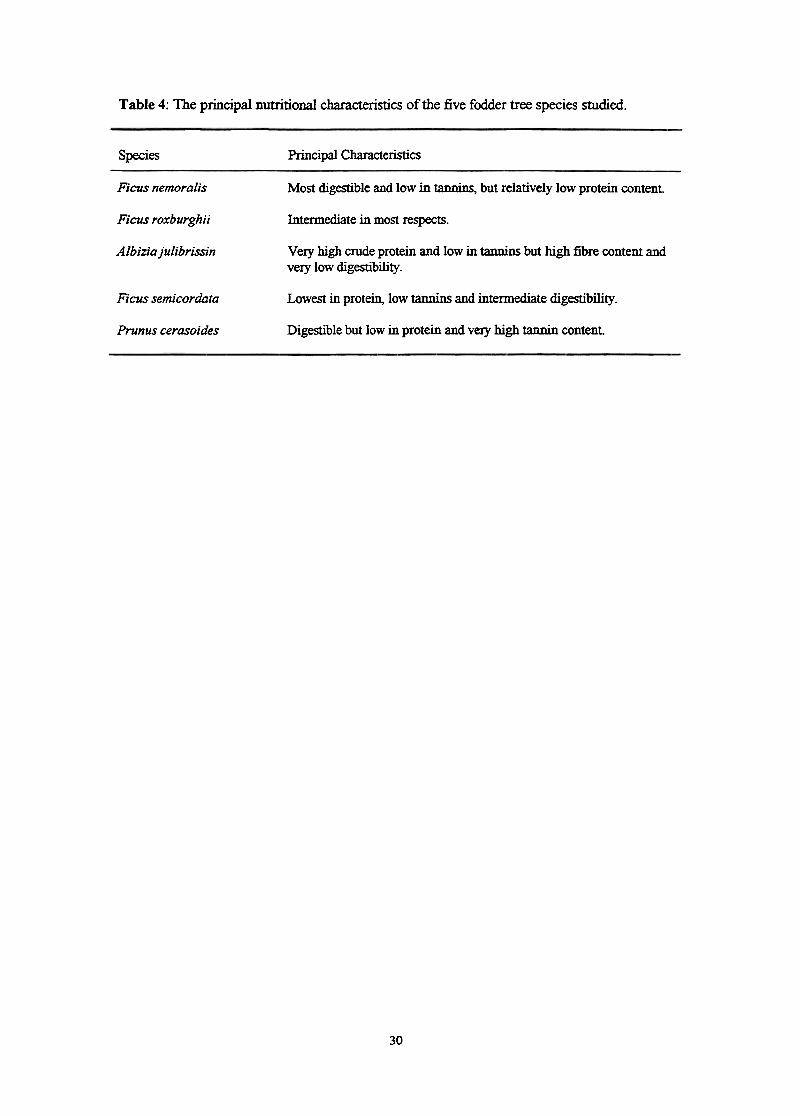
Table 4: The principal nutritional characteristics of the five fodder tree species studied.
Species Principal Characteristics
Ficus nemora/is Most digestible and low in t~nnin~, but relatively low protein content
Ficus roxburghii Intermediate in most respects.
A/bizia ju/ibrissin Very high crude protein and low in tannins but high fibre content andvery low digestibility.
Lowest in protein, low tannins and intermediate digestibility.Ficus semicordata
DigestIole but low in protein and very high tannin contentPrunus cerasoides
30
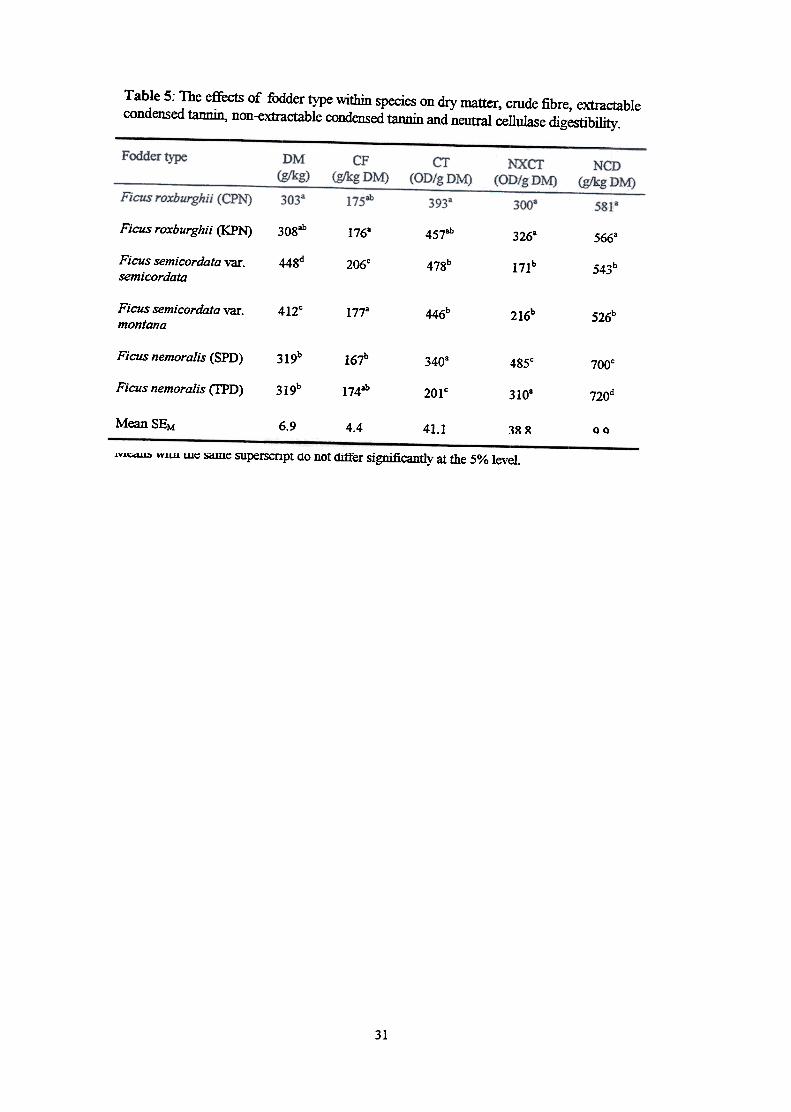
Table 5: The effects of fodder type within species on dry matter, crude fibre, extractablecondensed tannin, non-extractable condensed tannin and neutral cellulase digestibility.
30gabFicus roxburghii (KPN) 1768 457ab 3268 566a
Ficus semicordata var.semicordata
448d 2060 47gb 171b 543b
Ficus semicordata vaf.
montana412C 1773 446b 216b 526b
Ficus nemora/is (SPD) 319b 167b 3408 485C 7000
31gbFicus nemora/is (I'PD) 174ab 20lC 310. 720d
Mean SEM 6.9 4.4 41.1 38.8 9.9
Means with the same superscript do not differ significantly at the 5% level.
31
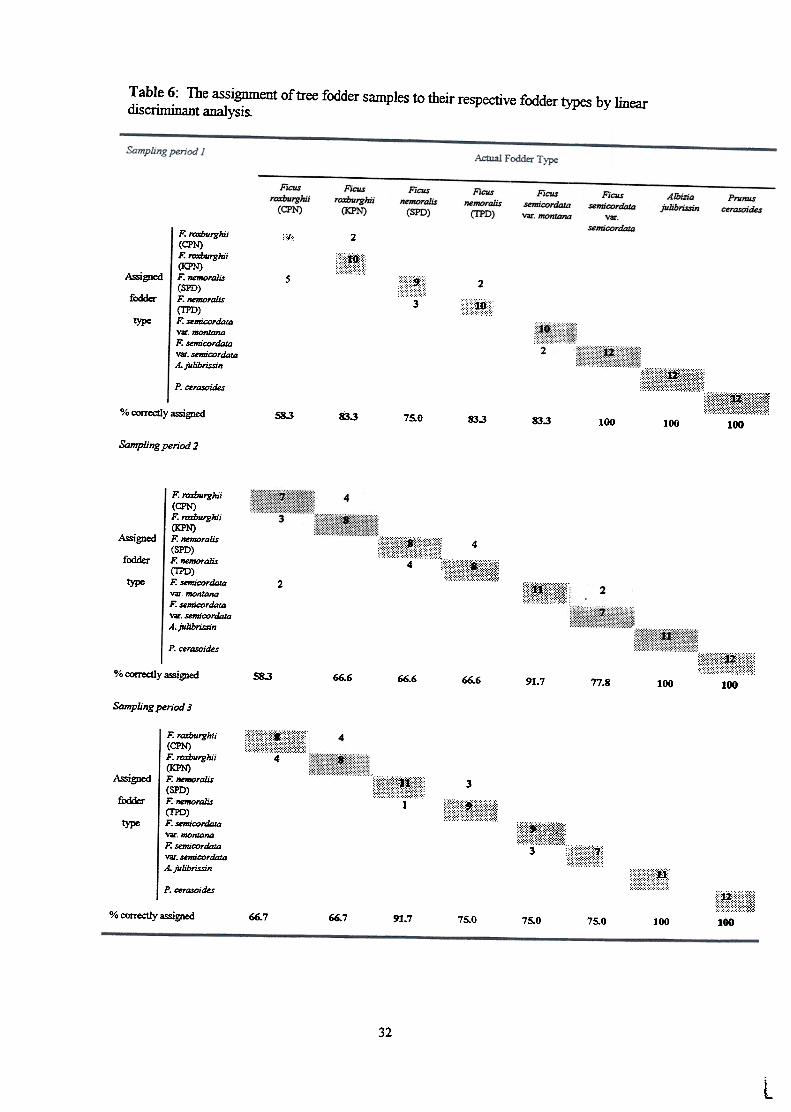
Table 6: The assignment of tree fodder samples to their respective fodder types by lineardiscriminant analysis.
:;7 2
i::.:!ii~i~;::!A$igned
fodder
5
:'i:":":i'j::
3
2
;::::::!!!:;type
1': raxburghii(CPN)1': raxburghii(KPN)1': nemoraJis(SPD)1': nemoraJis(lPD)1': semicordalDvar. montana1': semicordalDvar. semicordalDA. jldibrizin
P. cerasoides 1111111:1:1111111;11111:111111.
:::ii~~I!::j!I!!:I!il!j:lijijiji~I!li
100% correctly assigned S8.3 83.3 75.0 83.3 83.3 100 100
Sampling period 2
F. rorburghii(CPN)F. rorburghii(KPN)F. nemor"Zis
(SPD)F. nemoralis(TPD)F. semicordatavar. montanaF. semicordatavar. semicordata.4. julibrissin
P. certlSt1ides
Assigned
fodder
~
4
!iilili::!iiiiriiil!ii:!:iilt)'1)e 2
j:i!iil~i!i!i!:~i~~
Figure 1: Consensus between farmers in the application of nuuitive value classifications.
33

calendar months are straddled).
34
l.

Figure 3: Seasonal trends in obano -chiso and posilo-kam posilo status for each of the eight fodder
types studied. Relative rank by month (the Nepal calendar is divided so that Julian calendar months
are straddled) for each fodder type for a) the obano -chiso classification (where obano = 0, chiso = 1)
and b) the posilo -kam posilo classification (where posilo =0, kam posilo =1).
35

36
L
a. Obano -chiso
No. offarmersgivingranking
RANK POSmON
b. Posilo -kam posilo
50
No. offarmersgivingranking
12345678 12345678 12345678Ficus roxburghii Ficus semicordata Prunus(KPN) V&r. semicordata cerasoides
0 12345678FicusnemoraIis
(SPD)
12345678 12345678 12345678 12345678Albizia Ficus semicordata Ficus roxburghii Ficusjulibrissin VIr. montana (CPN) nemoralis
(TPD)
RANK POSmON
Figure 1: Thome et al

40
35
30
25
Number 20offarmers 15
using~e 10fodder inthat 5month
0SID 10 AlS SID 10 AlS SID 10 AlS SID 10 A/S SID 10 AlS SID 10 A/S SID 10 AlS SID 10 AlS
Months of the year. Starting September / October, ending August/September, ticks liebetween February/March and March/AprilFicus Ficus Ficus Pnmus Ficus Albizia Ficus Ficusroxburghii semicordata roxburghii cerasoides semicordata julibrissin nemoraJis nemoralis(CPN) vu. (KPN) vu. montana (SPD) (I'PD)
semicordata
Figure 2: Thome et of
a. obano -chiso
1
0.9
0.8_Ficus roxhurghii
(CPN)
~ Ficus semicordat,Vir. semicordata
[] Ficus roxburghii(KPN) I
I + Prunusi cerasoides I
!-.- Ficus semicordatj'
Vir. montana
0.7
0.6
0.5
0.4 i_X- AlbiZiajulibrissin
+0.3 Ficus1-'- nemoralis
(SPD)I ",.
-0- rlCUS
nemoralisi (l'PD)
0.2
0.1
0 I I I I I I i I I I
SIO O/N N/D D/J J/F F/M MIA AIM M/J J/J J/A A/S
MONm
b. posilo -kam posilo
Figure 3: Thome et oJ