Embed Size (px)
Citation preview
InterferometryInterferometryInterferometryInterferometry Lab Report for the Lab Report for the Lab Report for the Lab Report for the 2222ndndndnd Year Undergrad CourseYear Undergrad CourseYear Undergrad CourseYear Undergrad Course in Physics in Physics in Physics in Physics
1
In this article we discuss experiments with two different types of interferometry instruments, the Michelson-Morley interferometer, and the Fabry-Pérot one. These two interferometers play a chief-role in the field of interferometry, which is the applied science of combining two or more waves which are said to interfere with each other. We begin by describing the general theory, move to discussing the actual systems we’ve used, and finally exhibit the results produced in the lab. Authored by J. Shapiro and J. Zuta, instructed by Mr. Samuel Rubinstein.
The Hebrew University of Jerusalem,
Faculty of Science,
Racah Institute of Physics,
Jerusalem 91904, Israel.
I. INTRODUCTIONI. INTRODUCTIONI. INTRODUCTIONI. INTRODUCTION
The dark days of the late 19th century were characterized by physical theories that postulated that just as audible sound waves require a medium to move through (air), so do light waves require such medium, which went by the name of the “luminiferous aether”. It wasn’t until the Michelson-Morley experiment which took place in 1887 at Ohio, USA that evidence has been found to show exactly the opposite. Michelson’s original intent had actually been to show the existence of the aether, which resulted in this experiment being labeled as “the most famous failed experiment”. The experiment, which incorporated an instrument designed by Michelson himself – the interferometer, showed that two beams of light which went through different optical paths did not exhibit fringe shifts, which were expected if a stationary aether did exist between the earth and the sun.
Today the Michelson interferometer has various other uses, which include the detection of gravitational waves, being a tunable band-filter, and finally as the core of the Fourier-transform spectroscopy – which is to measure the temporal coherence of light.
The Fabry-Pérot interferometer, which is sometimes called just “etalon” (the French word for stallion), is widely used in telecommunications, lasers, and spectroscopy for selecting specific wavelengths of light. Originally designed by Charles Fabry and Alfred Pérot right before the beginning of the 20th century, this interferometer was incorporated into many designs. In 1913. for instance, it was used to show that the upper atmosphere is plentiful in ozone, which filters ultraviolet radiation from the sun. Another example would be the the HIFI (Hawaii Imaging Fabry-Pérot interferometer) from 1989 which is used for optical studies of bright, nearby galaxies.
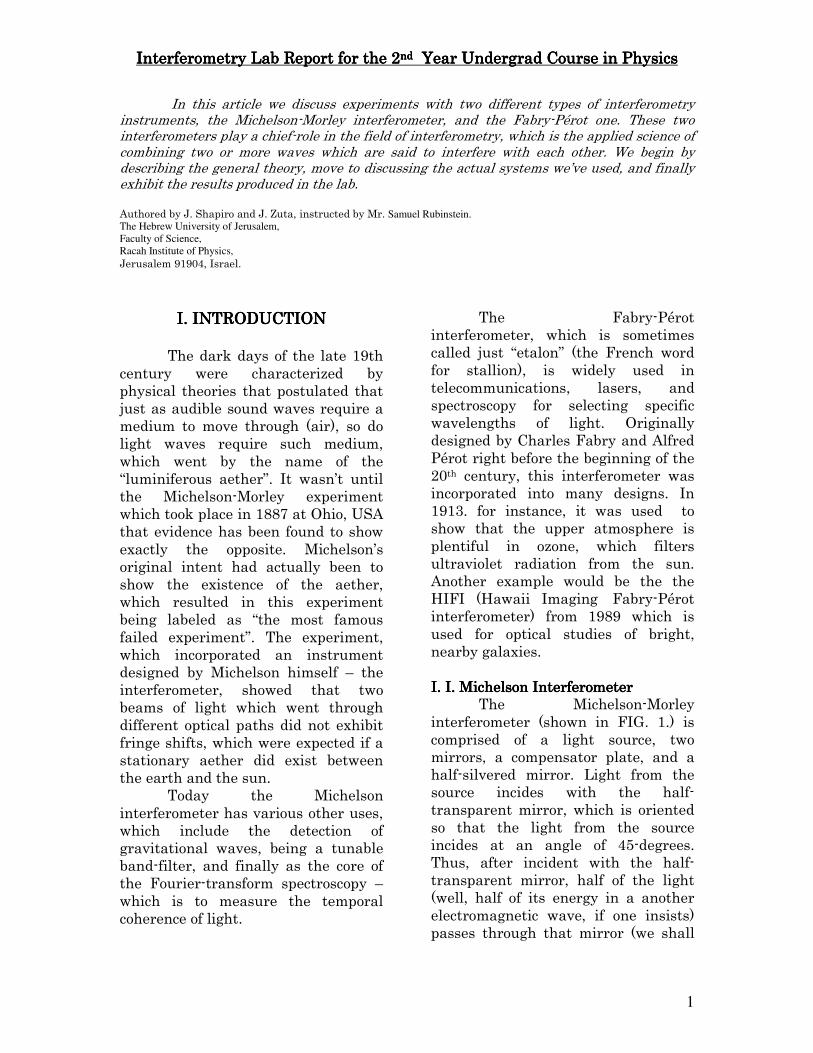
IIII. I. . I. . I. . I. Michelson InterferometerMichelson InterferometerMichelson InterferometerMichelson Interferometer The Michelson-Morley interferometer (shown in FIG. 1.) is comprised of a light source, two mirrors, a compensator plate, and a half-silvered mirror. Light from the source incides with the half-transparent mirror, which is oriented so that the light from the source incides at an angle of 45-degrees. Thus, after incident with the half-transparent mirror, half of the light (well, half of its energy in a another electromagnetic wave, if one insists) passes through that mirror (we shall
InterferometryInterferometryInterferometryInterferometry Lab Report for the Lab Report for the Lab Report for the Lab Report for the 2222ndndndnd Year Undergrad CourseYear Undergrad CourseYear Undergrad CourseYear Undergrad Course in Physics in Physics in Physics in Physics
2
call this beam “Beam 2”), and the other half follows a perpendicular axis to the original path of light from the source (“Beam 1”). The two spiltted beams of light meet a mirror (not a transparent one, though) with which the beams are reflected by 180-degrees. “Beam 2” also passes through a compensator plate on it’s way. Thus both spiltted-beams are destined to incide with the half-transparent mirror yet again, for a second incident, and finally re-combine together (although now, with a different phase in time which results from the different length the two beams of light have passed) after the mirror, on an axis perpendicular to the original path of the light source. After having re-united the two beams produce an interference pattern on a screen. The distance of “Mirror 1” (the mirror that relfects “Beam 1”) from the half-transparent mirror is 1l where as the
distance of “Mirror 2” from the half-transparent mirror is 2l . It is
reasonable to assume that the light we are dealing with is a plane-wave, hence, the magnetic field of that light is given by:
( )[ ]tkxiB ω−∝ expr
. (1)
Since the two beams pass different lengths on their way to the screen, each has a different phase upon arrival at the screen. Thus it is appearant that the difference in phase of the magnetic field of the light on the screen is given by:
( )[ ]122exp llik −=ϕ . (2)
where ( )122 ll − is the difference of the
length of the path that each beam passes. If we want to know the condition for maximal intensities of light, we would want to require that the phase between the two beams
would be integer multiplies of π2 . That is,
( ) nllk ⋅=−⋅ π22 12 , (3)
or, ( ) λ⋅=− nll 122 . (4)
In fact, Equation (4) spells the fundamental rule for the whole experiment. We may put other obstacles, such as glass, or other materials with different refactive indexes, but in the end, it would all amount to changing the distance between the two mirrors and the half-transparent mirror, and in order to observe a maximum of light intensity on the screen, we have to have this difference be half integer multiplies of the light’s wavelength. IIII. I. I. I. IIIII. Fabry. Fabry. Fabry. Fabry----PérotPérotPérotPérot InterferometerInterferometerInterferometerInterferometer
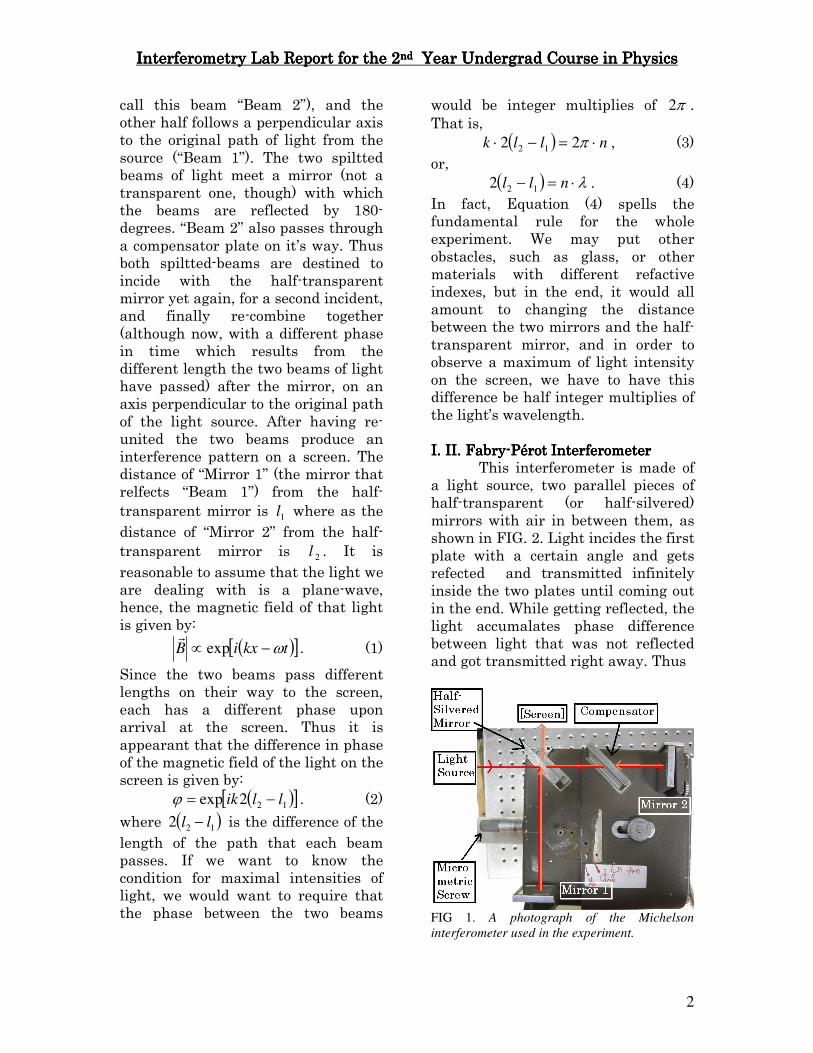
This interferometer is made of a light source, two parallel pieces of half-transparent (or half-silvered) mirrors with air in between them, as shown in FIG. 2. Light incides the first plate with a certain angle and gets refected and transmitted infinitely inside the two plates until coming out in the end. While getting reflected, the light accumalates phase difference between light that was not reflected and got transmitted right away. Thus
FIG 1. A photograph of the Michelson
interferometer used in the experiment.
InterferometryInterferometryInterferometryInterferometry Lab Report for the Lab Report for the Lab Report for the Lab Report for the 2222ndndndnd Year Undergrad CourseYear Undergrad CourseYear Undergrad CourseYear Undergrad Course in Physics in Physics in Physics in Physics
3
we are left again with two (or rather, an infinite amount of) beams of light with different phase in time. This difference in phase creates an interference pattern on the screen, which we may observe as more intensity of light or less (which would be constant in time).
II. II. II. II. APPARATUSAPPARATUSAPPARATUSAPPARATUS
The experiment incorporated the two said types of interferometers (Shown in FIG. 1. And FIG. 2.), a HeNe laser light source of wavelength λ = 632.8nm (see FIG. 3.), and finally a Na light source (see FIG. 4) which emits two distinct different wavelengths. Additionally we also used a caliber, a scattering lens, a piece of glass, a chamber of differential pressure of air, a pump, pieces of paper, selotapes and so on.
III. PROCEDUREIII. PROCEDUREIII. PROCEDUREIII. PROCEDURE IIIIIIIIIIII. I. . I. . I. . I. Michelson InterferometerMichelson InterferometerMichelson InterferometerMichelson Interferometer
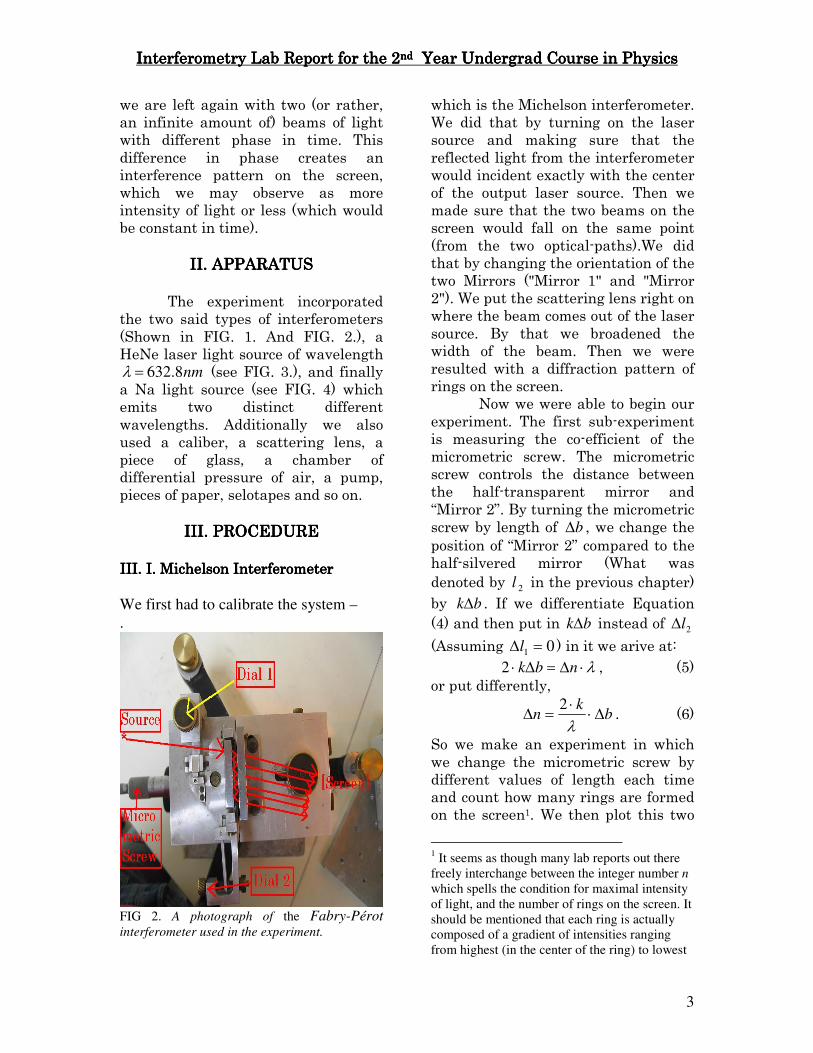
We first had to calibrate the system –
.
FIG 2. A photograph of the Fabry-Pérot interferometer used in the experiment.
which is the Michelson interferometer. We did that by turning on the laser source and making sure that the reflected light from the interferometer would incident exactly with the center of the output laser source. Then we made sure that the two beams on the screen would fall on the same point (from the two optical-paths).We did that by changing the orientation of the two Mirrors ("Mirror 1" and "Mirror 2"). We put the scattering lens right on where the beam comes out of the laser source. By that we broadened the width of the beam. Then we were resulted with a diffraction pattern of rings on the screen.
Now we were able to begin our experiment. The first sub-experiment is measuring the co-efficient of the micrometric screw. The micrometric screw controls the distance between the half-transparent mirror and “Mirror 2”. By turning the micrometric screw by length of b∆ , we change the position of “Mirror 2” compared to the half-silvered mirror (What was denoted by 2l in the previous chapter)
by bk∆ . If we differentiate Equation
(4) and then put in bk∆ instead of 2l∆
(Assuming 01 =∆l ) in it we arive at:
λ⋅∆=∆⋅ nbk2 , (5) or put differently,
bk
n ∆⋅⋅
=∆λ
2. (6)
So we make an experiment in which we change the micrometric screw by different values of length each time and count how many rings are formed on the screen1. We then plot this two
1 It seems as though many lab reports out there
freely interchange between the integer number n
which spells the condition for maximal intensity
of light, and the number of rings on the screen. It
should be mentioned that each ring is actually
composed of a gradient of intensities ranging
from highest (in the center of the ring) to lowest
InterferometryInterferometryInterferometryInterferometry Lab Report for the Lab Report for the Lab Report for the Lab Report for the 2222ndndndnd Year Undergrad CourseYear Undergrad CourseYear Undergrad CourseYear Undergrad Course in Physics in Physics in Physics in Physics
4
columns on a graph and find its slope. From the slope we extract k, the micrometric screw coefficient.
The second sub-experiment was to put a piece of glass betweem the half-silvered mirror and “Mirror 1” in different orientations. Puttying a glass in the path of “Beam 1” changes its phase compared to with no glass at all. See FIG. 5. for a detailed illustration. In this illustration, we can see that instead of passing a distance of 1l in the air, “Beam 1”
passes a distance of ACl −12.
Additionally, “Beam 1” also passes a distance of AB inside the glass, which has a refractive index of 0n . The
wavelength of light inside a medium (in our case - glass) is given by:
0
'n
λλ = . (7)
So now the phase difference between the two beams will be
( ) ABknACllk 22 012 ++− instead of
( )122 llk − . If we require this phase
difference to be integer multiplies of π2 , just like we did during the derivation of Equation (4), in order to predict when we’ll observe maximum of light intensities, we arrive at the following relationship:
( ) nABknACllk ⋅=++− π222 012. (8)
Differentiating Equation (8), (Assuming 01 =∆l , 02 =∆l ):
( ) λ⋅∆=∆+∆ nABnAC 02 . (9)
From FIG. 5. we may extract the values of AC∆ and AB∆ in terms of θ∆ , and after approximation of small angles we arrive at:
(what we consider to be the gap between the
rings). Thus, counting the number of rings on the
screen is equivalent to counting the number of
maximum of intensities on the screen. 2 In this section two capital English letters
indicate the distance between these two points.
( ) λθ ⋅∆≈−
⋅∆ nn
nd
0
02 1, (10)
Where θ∆ is the orientation of the piece of glass, d is the its width, and n0 is the glass’ refractive index. So
again we may change the value of θ∆ and see how many rings get formed on the screen. We plot a graph and from that extract n0 - the refractive index of
glass. The third sub-experiment was
to put a chamber of differential pressure of air in it, and measure the air’s refractive index. We changed the pressure in the chamber with the pump and observed how the number of rings on the screen changed in accordance. The number of rings was proportional to the pressure and from the refractive index with the equivalent of equation (4):
2 ⋅ (n0 −1) ⋅ L ⋅P − P0( )
P0
= n ⋅ λ (11)
Where n0 is the refractive index of air,
L is the length of the chamber (in which the light passes through), P is the pressure in the chamber, and P0 is
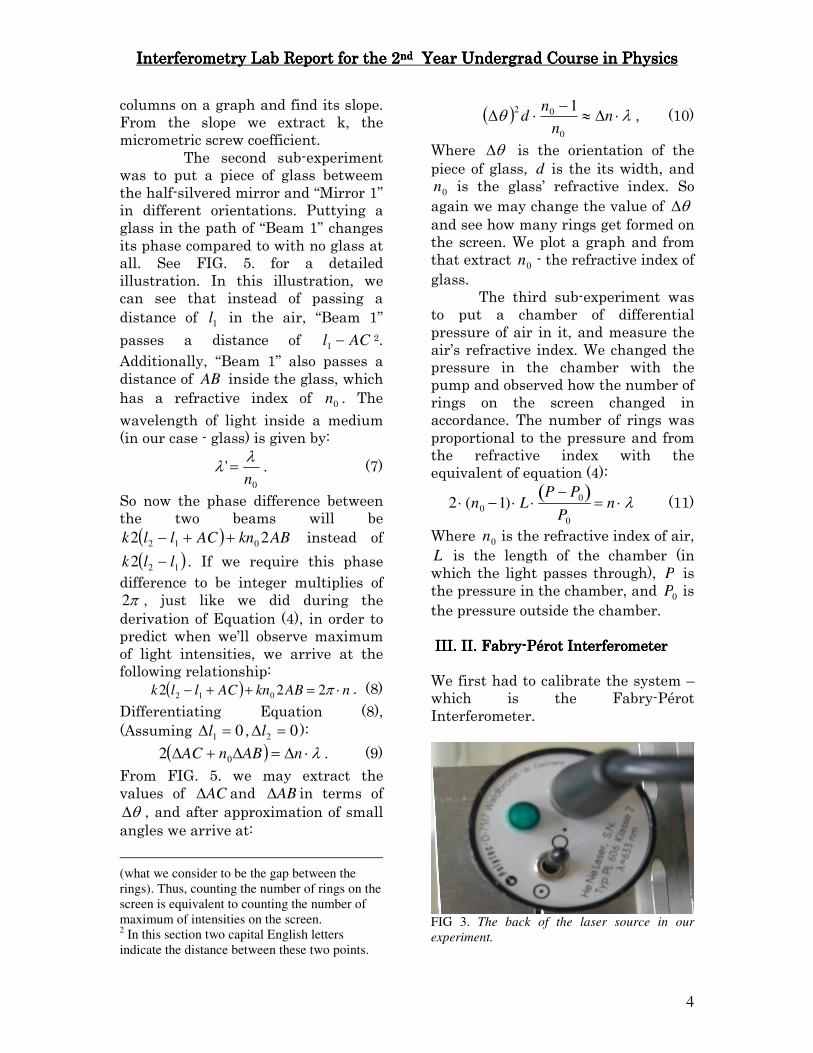
the pressure outside the chamber. III. II. FabryIII. II. FabryIII. II. FabryIII. II. Fabry----PérotPérotPérotPérot InterferometerInterferometerInterferometerInterferometer We first had to calibrate the system – which is the Fabry-Pérot Interferometer.
FIG 3. The back of the laser source in our
experiment.
InterferometryInterferometryInterferometryInterferometry Lab Report for the Lab Report for the Lab Report for the Lab Report for the 2222ndndndnd Year Undergrad CourseYear Undergrad CourseYear Undergrad CourseYear Undergrad Course in Physics in Physics in Physics in Physics
5
We did that by turning on the laser source and making sure that the reflected light from the interferometer would incident exactly at the center of the output laser source. Then we made sure that all the beams (infinite number of them) fall on the same point on the screen, and then we put the scattering lens and played with the coarse dial to get 10 rings. The actual experiment consisted of measuring the radii of the rings we observed. According to the theory3, the radius of the ring has to correspond to the following formula (see FIG. 6.):
( )L
rtg
p
pm =+0θ , (12)
and also:
( )[ ] ( )λθ pmd pm +=+ 00cos2 . (13)
Where 0m is the initial order of the
ring’s maximum intensity in the diffraction pattern, pm +0 is the
order of a specific ring. d is the distance between the two plates. From measurements of different radii, each of different order, p, we may extract the value of 0m and d . We do that by
approximating 2
pr to be a linear
function of p:
pd
Ld
mLrp ⋅⋅+
−=
λλ 20222 . (14)
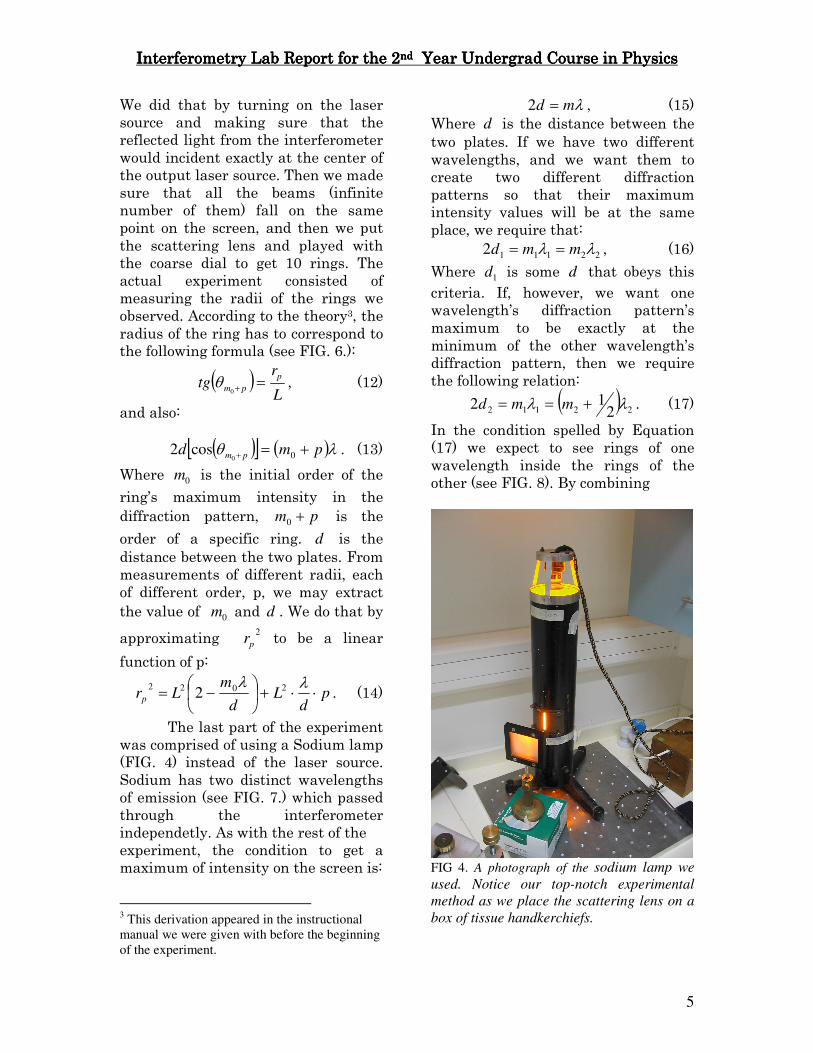
The last part of the experiment was comprised of using a Sodium lamp (FIG. 4) instead of the laser source. Sodium has two distinct wavelengths of emission (see FIG. 7.) which passed through the interferometer independetly. As with the rest of the experiment, the condition to get a maximum of intensity on the screen is:
3 This derivation appeared in the instructional
manual we were given with before the beginning
of the experiment.
λmd =2 , (15) Where d is the distance between the two plates. If we have two different wavelengths, and we want them to create two different diffraction patterns so that their maximum intensity values will be at the same place, we require that:
221112 λλ mmd == , (16)
Where 1d is some d that obeys this
criteria. If, however, we want one wavelength’s diffraction pattern’s maximum to be exactly at the minimum of the other wavelength’s diffraction pattern, then we require the following relation:
( ) 22112 212 λλ +== mmd . (17)
In the condition spelled by Equation (17) we expect to see rings of one wavelength inside the rings of the other (see FIG. 8). By combining
FIG 4. A photograph of the sodium lamp we
used. Notice our top-notch experimental
method as we place the scattering lens on a
box of tissue handkerchiefs.

InterferometryInterferometryInterferometryInterferometry Lab Report for the Lab Report for the Lab Report for the Lab Report for the 2222ndndndnd Year Undergrad CourseYear Undergrad CourseYear Undergrad CourseYear Undergrad Course in Physics in Physics in Physics in Physics
6
FIG 5. An illustration of how light passes
through glass within the Michelson
interferometer.
Equation (16) and Equation (17) we arrive at the following criteria:
)(2 21
21
21dd −
⋅=−≡∆
λλλλλ . (18)
Where 21 , dd are two distances which
are consequent.
IV. DESIGNIV. DESIGNIV. DESIGNIV. DESIGN
The first experiment in with the Michelson interferometer resulted in a table of the micrometric screw’s displacement ( b∆ ) vs. the number of rings on the screen ( n∆ ). The second sub-experiment was a table of the glass’ orientation vs. number of rings on the screen and finally the third sub-experiment was a table of the pressure in the chamber vs. number of rings on the screen. In the Fabry’ interferometer experiment, we had a table to radii of different rings on the
FIG 6. A schema of the path of light in the
Fabry-Pérot interferometer.
FIG 7. Spectrum of Sodium doublet.
screen vs. their order, p. The second experiment with this interferometer resulted in the difference, in length between the two plates of the etalon, between two states that either obeyed Equation (16) or Equation (17). V. RESULTSV. RESULTSV. RESULTSV. RESULTS AND DISCUSSION AND DISCUSSION AND DISCUSSION AND DISCUSSION V.V.V.V. I. I. I. I. Michelson InterferometerMichelson InterferometerMichelson InterferometerMichelson Interferometer FIG. 10. shows the graph we have plotted for the first experiment (finding the micrometric screw coefficient). We found
( )m
k 12145.29937172829.827
2±=
⋅λ
4.
We use the laser’s manufacturer’s specifications of nm8.632=λ to get
that 510761.7054.0 −⋅±=k . For the experiment in which we measure the refraction index of glass, the results are shown in FIG. 11. We found 588.10 =n which does not stand
in complete contradiction to the values that appear in the literature for glass. The pressure chamber experiment is revealed in FIG. 12. We
found that 34.1)1(2
0 =− Ln
Pλ. Here, it is
important to note that the value of 0P
measured is not the pressure outside the chamber, since we did not begin to measure when the number of rings
4 The ± sign that appears within the brackets is
by no means an error value computed for the
parameter. It is merely a statistical uncertainty
computed by our data-fitting computer program.
InterferometryInterferometryInterferometryInterferometry Lab Report for the Lab Report for the Lab Report for the Lab Report for the 2222ndndndnd Year Undergrad CourseYear Undergrad CourseYear Undergrad CourseYear Undergrad Course in Physics in Physics in Physics in Physics
7
was zero. Thus we may only estimate the value of 0P to be somewhere close
to the atmospheric pressure in the room. cmHgP 5.740 ≈ . We measured L
with a caliber, and it was ( )cmL 3.09.6 ±= . Thus we were able
to find the refraction index of air, 000255924.1=n . This value is closely
related to the literary one, which is 000289.1=n .
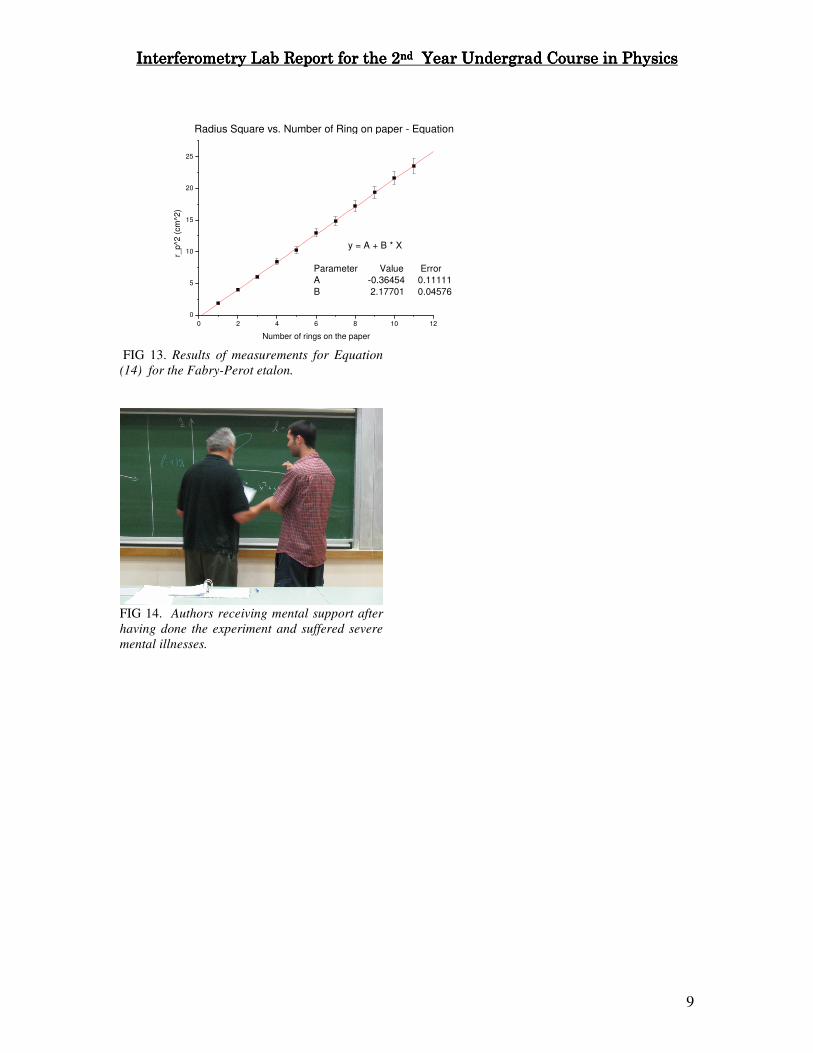
VVVV. II. Fa. II. Fa. II. Fa. II. Fabrybrybrybry----PérotPérotPérotPérot InterferometerInterferometerInterferometerInterferometer FIG. 13. shows our results for measurements made with the Fabry-Pérot interferometer. We were hoping to find 0m and d using a fit for
Equation (14). From the graph we can
see that 17.22 =⋅=d
LBλ
and
36.02 02 −=
−=
d
mLA
λ. We
measured L, the distance from the screen
to the interferometer, which we found to
be cmcmL 25.176 ±= and from there
cmcmd 11.0906.0 ±= . From
preliminary measurements we’ve made
in the lab with a caliber, the distance
between the two plates, d, was
cmcmd 1.005.1 ±= . So the two values
are in accordance. From B we found 0m
to be 17.445,280 ≈m . We have no idea
what to compare this value to.
For the second part of this
experiment (Sodium Doublet) we
captured three points. The first one was
when we had the condition for Equation
(16). d was 19.2mm. The second point
was one obeying the condition in
Equation (17) – that is, half wavelengths,
d=15.75mm. The third, was another
point for Equation (16), d=12.7mm. If
we put in the first point and the third
point, which two obey the same
condition, which is what we required
then we arrive at nm336.1=∆λ , if we
use the value of 213
21 10473.3 m−⋅=⋅λλ
from the literature. However, the
literature also specifies that nm6.0=∆λ ,
so we are in a bit of a jam. The deviation
from the theoretical value may be
explained by the fact that our
measurements were highly inaccurate
due to the fact we had tremendous
difficulty to differentiate between one
condition and the other (convergence or
divergence). The pattern was no where
as obvious as it is on FIG. 8.
Additionally, the coefficient of the
micrometric screw in the interferometer
may have been wrongly given to us.
That is since we replaced our
interferometer in the middle of the
experiment since the first one didn’t
work.
VVVVI. I. I. I. REFERENCESREFERENCESREFERENCESREFERENCES
[1] FIG. 6. From http://hug.phys.huji.ac.il/PHYS_HUG/MAABADA/Mabada_b/add_2003-4/Interferometer.pdf [2] FIG. 7. from http://www.lightfrominfinity.org/images/Abstract2/Sodium_doublet.jpg

InterferometryInterferometryInterferometryInterferometry Lab Report for the Lab Report for the Lab Report for the Lab Report for the 2222ndndndnd Year Undergrad CourseYear Undergrad CourseYear Undergrad CourseYear Undergrad Course in Physics in Physics in Physics in Physics
8
FIG 8. Sodium diffraction pattern of two
different wavelengths. Notice the two different
sets of rings, which means the system obeys
Equation (17).
FIG 9. (b) Sodium diffraction pattern of two
different wavelengths. Notice how there are no
two different sets of rings, which means the
system obeys Equation (16).
0.0000 0.0002 0.0004 0.0006 0.0008 0.0010 0.0012
0
20
40
60
80
100
120
140
160
180
200
delta_n = A + 2k/lambda * delta_b
Parameter Value ErrorA -0.69885 1.374922k/lambda 172829.827 2145.29937
Number of Rings vs. Number of Scales - Equation (6)
Nu
mbe
r o
f rin
gs form
ed
on th
e s
cre
en
Displacement of Micrometric Screw (m)
FIG 10. Results of measurements for Equation
(6) for the micrometric’s screw coefficient with
the Michelson interferometer.
-0.3 -0.2 -0.1 0.0 0.1 0.2 0.3
0
10
20
30
40
50
60 Equation: Num=d/632.8E-7*(n-1)/n*(x+x0)^2
R^2 = 0.99537
d 0.09477 (cm)
n 1.58852
x0 0.09181
Rin
gs (
#)
Angle (rad)
Number of Rings vs. Angle of glass plate - Equation (10)
FIG 11. Results of measurements for Equation
(10) for the glass refraction index with the
Michelson interferometer.
0 5 10 15 20 25 30 35 40 45
10
20
30
40
50
60
70
num = P_0 + (lambda*P_0/2(n-1)L) * P
Parameter Value Error
P_0 14.26074 0.17869
(lambda*P_0/2(n-1)L) 1.34381 0.00647
Pre
ssu
re (
cm
of m
erc
ury
va
cu
um
)
Rings (#)
Pressure vs. Number of Rings - Equation (11)
FIG 12. Results of measurements for Equation
(11) for the air refraction index with the
Michelson interferometer.
InterferometryInterferometryInterferometryInterferometry Lab Report for the Lab Report for the Lab Report for the Lab Report for the 2222ndndndnd Year Undergrad CourseYear Undergrad CourseYear Undergrad CourseYear Undergrad Course in Physics in Physics in Physics in Physics
9
0 2 4 6 8 10 12
0
5
10
15
20
25
y = A + B * X
Parameter Value Error
A -0.36454 0.11111
B 2.17701 0.04576
r_p^2
(cm
^2)
Number of rings on the paper
Radius Square vs. Number of Ring on paper - Equation (14)
FIG 13. Results of measurements for Equation
(14) for the Fabry-Perot etalon.
FIG 14. Authors receiving mental support after
having done the experiment and suffered severe
mental illnesses.