Embed Size (px)
Citation preview
I. Introduction
The costs and benefits of universal banking have been debated for over seventy years. The
desirability of altering the Glass-Steagall Act—the landmark 1933 law which, among other things,
restricted underwriting by commercial banks—has attracted increasing attention. The recent wave of
mergers in the financial sector has intensified the scrutiny of these issues.
In this paper, we examine the impact of potential conflicts of interest in a modern setting
analogous to universal banks. This approach represents a distinct contribution to the recent research
by financial economists on this question. Earlier work has focused on banks during the pre-Glass-
Steagall era. Kroszner and Rajan1 and Puri2 find that securities underwritten by affiliates of commercial
banks did not perform worse than similar offerings underwritten by investment houses and may have
actually outperformed the investment bank offerings. Kroszner and Rajan find that universal banks of
the 1920s may have chosen to address potential conflicts of interests by underwriting less information-
sensitive issues.3 Puri examines similar data and argues that the public was actually willing to pay a
premium for issues underwritten by universal banks, suggesting that the banks—with their greater
access to information—were able to more effectively certify the quality of the new issues.4 Finally,
Kroszner and Rajan find that the organizational structure of the underwriting activity at a bank affected
1 Randall S. Kroszner & Raghuram G. Rajan, Is the Glass-Steagall Act Justified? A Study of the U.S.Experience with Universal Banking before 1933, 84 Am. Econ. Rev. 810 (1994).
2 Manju Puri, The Long-Term Default Performance of Bank Underwritten Security Issues, 18 J. ofBanking & Fin. 397 (1994).
3 Kroszner & Rajan, supra note 1.
4 Manju Puri, Commercial Banks in Investment Banking: Conflict of Interest or Certification Role? 40J. Fin. Econ. 373 (1996).
2
the market’s perception of the offering.5
We offer an alternative test, which partially addresses the hurdles that studies of pre-Glass-
Steagall banks face. We use venture capital-backed initial public offerings (IPOs) to investigate the
importance of conflicts of interest in the issuance of public securities. Investment banks often have
venture capital subsidiaries that invest in private firms. If the investment banker underwrites an offering
for a firm in which it is already a venture investor, potential conflicts of interest may result. These
conflicts are analogous to the conflicts of interest that might affect a bank that underwrites the security
of a firm in which it holds a debt obligation.
Our paper augments the earlier research by examining potential conflicts of interest in a modern
setting. The availability of stock price information allows us to calculate actual returns for the issuing
firms. Similarly, the detailed financial disclosure available for our sample allows us to determine the
precise financial relationship between the underwriter and the issuer. This allows us to more directly
examine the consequences of potential conflicts than historical studies.
We seek to determine (i) whether underwriters that hold an equity stake in issuing firms are
able to take advantage of unsuspecting buyers (which Kroszner and Rajan call the “naïve investor”
5 Randall S. Kroszner & Raghuram G. Rajan, Organization Structure and Credibility: Evidence fromCommercial Bank Securities Activities before the Glass-Steagall Act, 39 J. Monetary Econ. 475(1997).

3
hypothesis) or (ii) whether the market correctly anticipates the conflict of interest (Kroszner and
Rajan’s “rational discounting” hypothesis).6 We examine how venture-backed IPOs perform after
issuance and how this performance is related to the potential conflicts arising from the relationship
between the underwriter and the venture investors. We find that IPOs in which underwriters hold prior
venture investments perform no worse and may actually perform better than offerings in which no
underwriter has a venture stake. We also find that when a potential conflict of interest exists, the
reputation of the underwriting bank seems to mitigate some of the negative impact. The evidence is
consistent with predictions of rational discounting.
We also examine the market’s reaction at the time of the offering to determine whether the
market anticipates any conflict of interest. The market does appear to perceive some potential conflict
of interest at the time of the offering. Issues underwritten by investment banks that are also venture
investors are sold at a greater discount (“underpriced”).
We also find evidence that venture capital subsidiaries of investment banks are sensitive to
potential conflicts when they make investment decisions. IPOs by firms in which underwriters are also
venture investors appear to be more common for firms in which asymmetric information is less of a
problem. The companies with such investments have larger market capitalizations, employ higher
quality underwriters, and have greater venture shareholdings. All of these may proxy for higher quality
firms with fewer potential conflicts of interest.
6 Kroszner and Rajan, supra note 1.

4
The results of the paper call into question the restrictions on underwriting by commercial banks
instituted by the Glass-Steagall Act of 1933. In a structure that is in many respects analogous to
universal banking, we find that the market correctly anticipates potential conflicts and that underwriters
react to them.
In addition to the papers on pre-Glass-Steagall banking, this paper is related to examinations of
underwriter reputation and long-run performance, underwriter reputation and underpricing, and
venture capital reputation and underpricing.7 None of these papers examines potential conflicts of
interest that can arise because of a venture capital-investment banker affiliation.
The rest of the paper is organized as follows. The universal banking debate is briefly reviewed
in Section II. Section III presents an overview of the important features of the venture capital industry
that allow us to test for potential conflicts. Construction of the data set is described in Section IV.
7 For papers on underwriter reputation and long-run performance see Jay Ritter, The Long-RunPerformance of Initial Public Offerings, 42 J. Fin. 365 (1991); Vikram Nanda, Jong-Hwan Yi, &Youngkeol Yun, IPO Long-run Performance and Underwriter Reputation, Unpublished manuscript,Univ. of Michigan, 1995; and Richard Carter, Frederick Dark, & Ajai Singh, Underwriter Reputation,Initial Returns, and the Long-Run Performance of IPO Stocks, 53 J. Fin. 285 (1998). For papers onunderwriter reputation and underpricing see Richard Carter & Steven Manaster, Initial Public Offeringsand Underwriter Reputation, 45 J. Fin 1045 (1990). For papers on venture capital reputation andunderpricing, see Christopher B. Barry, Chris J. Muscarella, John W. Peavy III, & Michael R.Vetsuypens, The Role of Venture Capital in the Creation of Public Companies: Evidence from theGoing Public Process, 27 J. Fin. Econ. 44 (1990) and William C. Megginson & Kathleen A. Weiss,Venture Capital Certification in Initial Public Offerings,46 J. Fin. 879 (1991).

5
Section V presents the summary statistics and a detailed analysis of the hypotheses. Section VI
concludes the paper.
II. The Universal Banking Debate
Roe documents the populist sentiment that developed against financial capitalism in the United
States during the late 19th and early 20th century.8,9 The stock market crash of 1929 ended the euphoria
for investing that had developed after World War I and turned public sentiment against financial
institutions. Most of the criticism centered on the role that banks played in the ultimate collapse of the
stock market. It was argued that banks had an incentive to take advantage of investors by issuing
securities in companies with outstanding loan balances at times when the firms’ future prospects were
not as positive as the public believed. Issuing overpriced securities allowed the firms to liquidate the
outstanding balances owed to the banks.
Ultimately, public outcry led to legislation that was meant to curb these activities.10 The
Securities Acts of 1933 and 1934 required greater disclosure of information by firms. The Glass-
Steagall Act of 1933 had myriad effects on the banking sector in the United States. Most importantly
8 Mark Roe, Political and Legal Restraints on Ownership and Control of Public Companies, 27 J. Fin.Econ. 7 (1990).
9Randall S. Kroszner, The Evolution of Universal Banking and its Regulation in Twentieth CenturyAmerica, in Universal Banking: Financial System Design Reconsidered, (Anthony Saunders & IngoWalter eds. 1996) presents an overview of the development of the U.S. banking industry during thistime period.
10 Roe, supra note 8.

6
for this paper, Section 20 of the Act barred commercial banks that were members of the Federal
Reserve System and their affiliates from holding, trading, or underwriting corporate securities. (The
act also created the deposit insurance system and regulated the rates that banks could pay on deposits.)
In recent years, the debate about whether the U.S. should remove the restrictions on
commercial banks imposed by the Glass-Steagall Act has intensified. Advocates of repeal point to the
efficiency of universal banking. Calomiris and Ramirez argue that universal banking has four primary
advantages over the current system in the U.S: improved information gathering and monitoring,
amelioration of conflicts between various claimants on the firm, diversification benefits, and more
effective signaling.11
Universal banking, however, may lead to conflicts of interest. Through monitoring and
advising the firm, the universal bank may learn that the firm’s securities are overpriced relative to their
true value. Because they hold an ownership interest in the firm, they may have an incentive to take
advantage of this information and may be tempted to sell securities to the public. The banker is subject
to an adverse selection problem such as that discussed by Myers and Majluf.12 It is more likely that a
firm is overvalued when the bank chooses to issue securities that are of the same or a lower priority
11 Charles W. Calomiris & Carlos Ramirez, Financing the American Corporation: The Changing Menuof Financial Relationships, (NBER Historical Working Paper No. 79, 1996).
12 Stewart Myers & Nicholas F. Majluf, Corporate Financing and Investment Decisions when Firmshave Information that Investors Do Not Have, 13 J. Fin. Econ. 187 (1984).
7
than its claim. Rajan develops a model in which banks are affected by both the good and bad aspects
of being informed: they increase efficiency through the generation of information, but have an incentive
to take advantage of new investors.13
III. Venture Capital as a Testing Ground for Universal Banking
A. Challenges to the Previous Research
While the research discussed in the introduction argued that security underwriting by universal
banks prior to Glass-Steagall was not adversely affected by conflicts of interest, several factors hamper
extrapolation of these results to the current debate over the desirability of repealing the Glass-Steagall
Act.
First, studies using data from the 1920s cannot discern if banks that issued securities through
bank affiliates also had lending relationships with the issuing firms. Kroszner and Rajan14 do not know
whether a firm had any bank loans and Puri15 can only determine whether a firm issuing securities had
an outstanding loan agreement with some bank at the time of the offering. Many securities law reforms
have sought to improve the information flow from companies to investors. A series of legislative
initiatives and U.S. Securities and Exchange Commission (SEC) regulations required the release of
13 Raghuram G. Rajan, A Theory of the Costs and Benefits of Universal Banking, (Unpublishedmanuscript, Univ. Chicago, 1992).
14 Kroszner & Rajan, supra note 1.
15 Puri, supra note 2.
8
substantial amounts of information that were often not available in the 1920s. Second, long-run returns
to these securities are difficult or impossible to measure since prices of bonds in the 1920s and 1930s
are hard to find on a systematic basis. Previous studies have only been able to look at default rates.
Finally, the sample period for previous studies is rather short, usually limited to the latter half of
the 1920s. Two factors may hamper this analysis. The first is cross-sectional correlation. A short
sample period might bias the significance of the results if certain types of issues are clustered in time.
Second, the Great Depression of the 1920s is a potential confounding factor.
Our sample has several advantages. First, we are able to precisely characterize the relationship
between an underwriter and a company issuing equity in our sample. This characterization is both
qualitative (is there a relationship?) and quantitative (how much of the firm does the underwriter
own?). Second, we can observe not only delistings, but also risk-adjusted long-run and short-run
returns. Finally, our twenty-year sample period allows us to overcome the potential clustering
problems present in earlier work.
B. Venture Capital as a Testing Ground
The venture capital industry offers a testing ground for the importance of conflict of interest in
the issuance of public securities. Most venture funds are run by independent firms that have no
affiliation with another institution or organization. Others, however, have relationships with financial
institutions or corporations. For the purpose of our study, the venture capital industry can be divided

9
into those venture capital firms that are independent and those that are either captive subsidiaries of or
are affiliated with an investment bank. This classification allows us to determine whether the market
treats affiliated offerings differently from unaffiliated offerings.
The investment banks with venture capital affiliates are analogous to universal banks in many
respects. First, an investment bank that is underwriting a security for a company in which it holds a
venture capital investment will have substantial private information on the company: venture capitalists
sit on boards and advise managers. If the investment bank has private information about the firm, it
may attempt to time security market issues that increase the value of its existing investment. If it is
selling a large fraction of their stake at the time of the IPO, the venture group will receive cash for its
shares at a very attractive price. Even if they do not sell any equity, the venture capitalists are typically
free to liquidate their stakes within six months of the IPO.16 Furthermore, they suffer less dilution of
their equity holdings when the IPO is priced at a premium. The investment banks that have venture
capital subsidiaries suffer from potential conflicts of interest similar to those associated with universal
banks.
One illustration of this potential conflict was the IPO of the biotechnology firm Regeneron
Pharmaceuticals.17 ML Venture Partners II, an affiliate of the lead underwriter of the offering (Merrill
16 Paul A. Gompers & Josh Lerner, Venture Capital Distributions: Short-Run and Long-RunReactions, J. of Fin. forthcoming (1998).
17 Josh Lerner, ImmuLogic Pharmaceutical Corporation (C): April 1991, Harvard Business Schoolcase #9-293-071and teaching note #5-293-118 (1992).

10
Lynch), was the lead venture capital investor, holding 23.8% of the firm at the time of offering. On the
evening prior to the IPO, Merrill Lynch increased the offer price and the number of shares that it was
selling. The price of Regeneron fell from an offer price of $22 to $14.75 in its first ten days of trading.
Many industry analysts and the shareholder lawsuits that followed pointed to the perceived conflict of
interest as the major reason for the price decline.
C. Hypotheses
Investment banks face conflicting pressures in valuing IPOs. On the one hand, an investment
bank acts as an agent for the firm issuing securities in an initial public offering. As an agent, the
investment bank has an incentive to declare a high price and raise as much money for the company for
as little equity as possible. In addition, its fee is based on the size of the offering. On the other hand,
the investment bank is concerned about losing its ability to place shares in future offerings if it develops
a reputation for pricing offerings too high. The investment bank also has long-term clients on the
purchasing side—e.g., large mutual and pension funds—which provide substantial amounts of business
for the bank. The investment bank does not want these clients to be hurt by offering the issue at too
high of a price. These concerns will limit how high the investment banker will set the price of any
particular offering. In other words, the investment bank maximizes the offering price subject to the
possibility that selling overpriced shares will tarnish its reputation. When an investment bank is also an
investor in the firm, the ability to directly gain by selling overpriced shares (either at the time of the
offering or shortly thereafter) may provide an additional incentive to sell equity at a higher price.
11
What happens both at the time of issuance and in the long run depends upon the market
conditions that prevail. Kroszner and Rajan propose two hypotheses concerning conflicts of interest
and market performance.18 In the “naïve investor” hypothesis, investors do not take these conflicts into
account when assessing offerings (nor do they measure past performance). Consequently, an
investment bank has an incentive to charge a high price when it holds an equity stake. The issues taken
public by an investment bank that has invested in the company should perform significantly worse in
the long run. The poor performance should be manifested in lower stock returns and higher liquidation
rates.
Under the second hypothesis, “rational discounting,” the market correctly anticipates that
underwriters who hold an investment interest will be subject to potential conflicts of interest. This
condition may lead underwriters with venture capital subsidiaries to only bring the least information-
sensitive portfolio firms to market. The market may choose not to purchase issues that are difficult to
evaluate if there is a conflict. Underwriters that are also venture investors would therefore only bring
less speculative issues to market.
If the market correctly anticipates the conflict of interest, then there should be no difference in
long-run performance between issues brought public by an independent underwriter and those brought
public by an investment bank that holds an investment in the company. If the investment bank with
18 Kroszner & Rajan, supra note 1.
12
venture investments only underwrites their best firms, yet the market still perceives some conflict, then
issues underwritten by an investment bank with an investment in the firm may actually perform better.
The market may be overly cautious about the firm’s quality. While we would not expect this
“overperformance” to continue in equilibrium, it may occur as the market learns that underwriters are
aware of and addressing the potential conflict.
The two hypotheses also have different predictions about the first-day return, i.e., underpricing.
In many models of the IPO process, offerings are sold at a discount to initial investors in equilibrium.
The extent of this underpricing is dependent upon the severity of the potential adverse selection
problem.19 Investors are concerned that they will be allocated more shares of poor offerings than
shares of good offerings if others know things about the firm that they do not. In the naïve investor
hypothesis, investors do not differentiate between issues by independent investment banks and those
that have a conflict. Because there is no perceived increase in adverse selection, underpricing will be
the same. In the rational discounting hypothesis, the presence of a conflict of implies that the adverse
selection problems are intensified. Thus, issues through investment banks that are investors should be
more underpriced.
IV. The Construction of the IPO Sample
We limit the sample of venture-backed IPOs to the offerings completed between December
19 Kevin Rock, Why New Issues Are Underpriced, 15 J. Fin. Econ. 187 (1986).

13
1972 and December 1992.20 We identify potential venture-backed IPOs using three sources. The first
is the listings of venture-backed IPOs published in Venture Economics' Venture Capital Journal.21
The second is listings of the securities distributions by venture funds used by Gompers and Lerner.22
The final source used to identify IPOs for the sample are over four hundred offering documents by
venture capitalists in the files of Venture Economics.23
The sample includes all firms with a venture investor listed in the database or a director
affiliated with a listed venture organization at the time that the director joined the board.24 For each
20We do not go back any further because the Corporate Reports Department at Harvard BusinessSchool only began receiving microfiched prospectuses from Disclosure at the end of 1972 and fewearlier IPOs are included on the CRSP tapes.
21This is the same source used by Barry, et al., supra note 7 and Megginson & Weiss, supra note 7. These listings are an extract from the Venture Intelligence Database (marketed by Venture Economics'parent, Securities Data Corporation [SDC]) that documents the private and public financings ofventure-backed firms. [The coverage and features of this database are described in Paul A Gompers,1995, Optimal Investment, Monitoring, and the Staging of Venture Capital, 50 J. Fin. 1461 (1995) andJosh Lerner, Venture Capitalists and the Oversight of Private Firms, 50 J. Fin. 301 (1995).]
22 Gompers & Lerner, supra note 16.
23Not all firms identified in these sources are venture-backed IPOs. We consequently examine IPOprospectuses to determine if any venture capital organizations were investors in the firm and if anyindividuals affiliated with these organizations were on the board. We define venture organizations asthose included in a venture capital database compiled by Venture Economics' Investors ServicesGroup, which includes over two thousand venture capital funds, small business investment companies,and related organizations. This database not only records venture capital organizations, but also thenames of their individual funds. [The construction and verification of the database are described inPaul A. Gompers & Josh Lerner, An Analysis of Compensation in the U.S. Venture CapitalPartnership, J. Fin. Econ. forthcoming (1998).]
24In many cases, it is not immediately obvious whether a venture investor or director is an exact matchwith a venture organization listed in the database. To address these ambiguities, we consult the edition

14
director, we record the associated venture organization25 and the dates of board service; for each
investor, we code the venture organization, the particular venture fund investing in the firm, and the
size of the stake before and after the offering. This process leads to the identification of 885 IPOs in
which a venture capitalist served as a director or a venture capital fund was a blockholder.
We gather the information about each IPO from SDC's Corporate New Issues database and
SEC filings. The information includes the size and per-share price of the offering (adjusted for any
additional shares sold by the underwriter through the exercise of its over-allotment option), the name of
the managing ("book") and other underwriters, the industry of the firm, and the market capitalization
implied by the IPO price. From SDC, we also obtain the return of the firm’s stock price on the first
day of trading. In the cases where this item is missing or where there is a unit offering (which may lead
to confusion about the return), we check the Daily Stock Price Record.26 Subsequent returns for the
five years after the offering or through the end of 1995 are obtained from the Center for Research in
Securities Prices (CRSP) databases. We then rank the reputation of the IPO's managing underwriter.
of Venture Economics, Pratt's Guide to Venture Capital Sources (1996) published in the year of theIPO. We compare the addresses and key personnel of each of these ambiguous venture organizationswith the information reported in the prospectus. If we are not virtually certain that the ventureorganizations in the prospectus and the database are the same, we do not code it as a match.
25In some cases, a venture capitalist will remain on a firm's board even if he switches to another venturecapital organization. In these instances, the individual is coded as representing the venture capitalorganization with which he was affiliated at the time that he joined the board.
26 Standard and Poor’s Corporation, Daily Stock Price Record—NASDAQ. (also AMEX and NYSEvolumes) (1993 and earlier years).

15
For offerings prior to 1985, we use the scale in Carter and Manaster.27 This was compiled using the
ordering of investment banks in newspaper advertisements announcing IPOs ("tombstones") between
1979 and 1983. For offerings from 1985 and subsequent years, we use Carter, Dark, and Singh’s
updating of these rankings.28, 29
Finally, we characterize the quality of the venture organizations involved in these IPOs. First,
we compute the mean age of the venture organizations that were directors or investors. Older venture
organizations are likely to be better on average than new firms, because poorly performing
organizations will be unable to raise new funds. We determine the age of each venture organization at
the time of the IPO using the Venture Economics funds database described above. For the mean age
of the venture organizations with board representation, we compute a simple average. We do not
weight organizations with multiple board seats more heavily than those with only one seat. We use a
27 Carter & Manaster, supra note 7.
28 Carter, Dark, & Singh, supra note 7.
29If an investment bank is not listed in the preferred tabulation, but is listed in their tabulation from theother period, we use the available ranking. A number of investment banks active in underwritingventure-backed firms in the 1970s were merged or acquired during that decade, and consequently werenot included in either ranking. The rankings of most of these can be deduced from Samuel L. Hayes,Investment Banking: Power Structure in Flux, 49 Harvard Bus. Rev. 136 (November-December1971), which discussed the major groupings of investment banks. These three sources yield theunderwriter ranking for 98% of the sample. We assigned an approximate ranking to the remaininginvestment banks after conversations with a number of Harvard Business School faculty who hadundertaken field research into the financial services industry during the 1970s and 1980s. One potentialconcern is the endogeneity of underwriter ranking: we rank underwriters using ‘tombstones’ printedcontemporaneously with the IPOs we analyze. We are confident, however, that this has minimal effecton the results. Hayes examines the hierarchy in the underwriting business during the first seventy yearsof this century and found a great deal of persistence in relative rankings.

16
slightly different approach for venture investors. The average of venture investors' ages is weighted,
with each organization's weight proportional to its stake in the firm.30
We finally examine whether any of the venture investors served as underwriters of the offering.
We determine whether the venture organizations in the sample had affiliations with investment banks
during the sample period by the various annual volumes of Pratt’s Guide—which has a list of each
venture organization’s affiliations—as well as searches of news stories in the LEXIS/NEXIS database
and unpublished records in the files of Venture Economics.31 In all, we found 282 venture capital firms
affiliated with investment banks, approximately 25% of the venture capital organizations active during
the past 25 years. In 386 of the 885 IPOs, an investment bank-affiliated venture fund had invested in
the company. In 127 of these, a lead or co-lead underwriter had made an earlier venture investment in
the firm.
V. Empirical Results
Our empirical analysis has four components. First, we examine the offerings’ characteristics.
30If we cannot determine the age of a venture organization, we do not use it in these averages. Inalternative specifications, we proxied for reputation by using the mean reputation rank of theunderwriters for previous IPOs in which the venture capitalists had been an investor and the value ofequity held in prior IPOs. The results using alternative reputation measures are qualitatively similar.
31One complication is introduced by the fact that in seven cases, investment banks made directinvestments into the firm prior to the initial public offering, but not through a venture fund that theysponsored. We treat these direct investments by investment banks in firms as if they had been made bya venture fund affiliated with the investment bank.

17
This is followed by an analysis of long-run performance after issuance. Both the long-run stock price
performance and the probability that a firm is liquidated are examined. The third set of analyses
focuses on underpricing of the IPO. Finally, we examine whether the potential for conflict of interest
induces affiliated investment banks to underwrite less information-sensitive issues.
A. Summary Statistics
The characteristics of the venture capital-backed IPOs are presented in Table I. The table
verifies prior evidence on venture-backed issues. As shown in previous work, venture-backed IPOs
tended to be larger than other IPOs.32 The mean (median) market value of the firm at its first CRSP-
listed closing price was $161 ($99) million in 1992 dollars, while the average offering price was
$14.67 per share. This is nearly twice the size of comparable non-venture IPOs in Brav and Gompers
(1997).
Venture capital equity ownership was substantial at the time of the offering. Venture capitalists
owned 33.7% of the equity prior to the offering. The venture capital investors sold little of their equity
in the offering, on average 5.9% (with a median of 0%). The low percentage of equity sold by venture
investors at the time of the offering might reflect the perceived adverse selection problem if venture
capitalists were thought to be cashing out.
32 Alon Brav & Paul A. Gompers, Myth or Reality? The Long-Run Underperformance of Initial PublicOfferings: Evidence from Venture Capital and Nonventure Capital-Backed Companies, 52 J. Fin. 1791(1997).

18
The measures of reputation differ very little whether they are calculated as the average of the
directors or the weighted average of all venture capital investors in the firm. The typical venture capital
firm serving as director or investor was nearly 12 years old at the time of the offering.
Underpricing and long-run performance both have skewed distributions. The average
underpricing—the percentage change from the offering price to the closing price on the first day of
trading—was +9.3%, while the median underpricing was +3.7%. These results are similar to that
found in Barry et al. and Megginson and Weiss.33 Five-year performance (both nominal and relative)
was even more highly skewed. The average five-year nominal buy-and-hold return (measured from the
first CRSP-recorded closing price) was +61.5%, while the median return was -11.3%.34
To measure relative performance, we calculate the five-year buy-and-hold excess return. This
is the difference between the five-year buy-and-hold return of the issuing firm and the five-year buy-
and-hold return of the portfolio of firms with the same size and book-to-market ratio. The use of a size
and book-to-market benchmark is advocated by Barber, Lyon, and Tsai.35 Barber et al. argue that
using size and book-to-market adjustments minimizes the misspecification in the long horizon
33 Barry, et al., supra note 7, and Megginson & Weiss, supra note 7.
34Returns for firms that delist from CRSP prior to their fifth anniversary are truncated at the delistingdate and include the delisting return (when available). Benchmark returns are also truncated at thedelisting date.
35 Brad M. Barber, John D. Lyon, & Chih-Ling Tsai, Improved Methods for Tests of Long-RunAbnormal Stock Returns, J. Fin. forthcoming (1998).
19
performance tests.36 The average excess return was +25.2% and the median excess return was -
34.8%. The mean excess return was positive, demonstrating that, as Brav and Gompers show, the
average venture-backed IPO outperforms the matched size and book-to-market benchmark. The
skewness of the excess returns is apparent.
Finally, the sample of 885 IPOs displays considerable heterogeneity in the relationships
between the underwriters and the venture investors. For 758 of the issues, the underwriters were
totally unaffiliated with any of the venture capital investors. In 127 of the cases, at least one of the
investment bankers was a venture investor in the firm, creating the possibility of a conflict of interest.
For 71 of the 127 issues, the book underwriter—the investment bank responsible for tallying orders
from institutional and individual investors and ultimately allocating the shares to the investors—was a
venture investor. Because the book manager has the most control over the IPO, the possibility for a
conflict of interest at the time of offering is increased. Finally, in 23 of the issues, all of the investment
bankers held venture investments in the firm. This final case would be associated with the highest
possibility of conflict of interest. This dispersion in investment banker/venture capitalist relationships
gives us the ability to examine whether such conflicts affect valuations.
Table II tabulates the time series distribution of our sample. Several trends are noticeable.
First, the number of venture-backed IPOs increased dramatically during the 1980s and 1990s. This
36The matching portfolios exclude all firms that have issued equity in IPOs or seasoned equity offeringswithin the past five years. For a detailed description of their construction, see Brav & Gompers, supra

20
increase parallels both the growth in the venture industry and their increasing activity in the public
markets. Second, the average offering size (in 1992 dollars) steadily declined over the time period.
This likely reflects an increasing ability to bring smaller issues public as the IPO market expanded.
The final four columns show that considerable variation in these measures. Average
underpricing ranges from as low as -1.8% (an actual decline in prices at the time of offering) to
+27.9%. Long-run returns show equally dramatic variation. We also show the number of issuing firms
that were delisted for bankruptcy, liquidation, or violations of capital requirements within the first five
years of offering. The use of liquidations as a measure of long-run performance is in the spirit of
Kroszner and Rajan (1994) and Puri (1994). In the early part of the sample, no firms were liquidated
within five years. During the late 1980s and early 1990s, a small portion of the issuing firms are
delisted within five years of their IPO.
B. Long-run Performance and Conflict of Interest
We next explore the relation between long-run performance and conflict of interest. Table III
tabulates our two measures of long-run performance to determine whether conflict of interest affects
performance. We divide IPOs into those that have a potential conflict because an underwriting
investment bank also holds an equity stake and those that do not.
The investment banking relationship classifications show little or no evidence of an
note 32.

21
unanticipated conflict of interest. Offerings underwritten by investment banks that had the strongest
potential for conflict of interest (those in which all the underwriters or the book manager were venture
investors) actually performed better than other issues, not worse as the naïve investor hypothesis would
predict.
In Table IV, we investigate the long-run excess returns in multivariate regressions. The
dependent variable is the five-year buy-and-hold excess return. Independent variables include dummy
variables denoting the underwriters’ relationship with the venture investors as well as the venture firm
and underwriter reputation measures. We also include the natural logarithm of firm size (market value
in constant 1992 dollars) and the natural logarithm of the firm’s book-to-market ratio.37 If size and
book-to-market portfolios properly adjust for risk, these coefficients should be insignificant. We also
include the percentage of the firm that is held by the venture capitalists prior to the IPO. If the quality
of monitoring or certification is related to how much of the company is owned by the venture investors,
higher percentages of equity should be related to better performance. The percentage of the venture
investors’ equity sold at the time of the IPO is also included. If venture investors try to take advantage
of investors, the higher the fraction of their equity that they sell at the time of the IPO, the poorer the
performance of the offering firm should be. Finally, we include the percent revision in the offering
price between the initial filing and the IPO. By including the revision variable, we control for the
37Following the convention of Eugene F. Fama & Kenneth R. French, The Cross-Section of ExpectedStock Returns, 47 J. Fin. 427 (1992) and Barber, Lyon, & Tsai, supra note 35, we exclude all firmswith negative book values from the regression analysis. In unreported regressions, we employ dummyvariables for the year of the offering.

22
possibility that these price revisions are related to underwriters systematically taking advantage of
investors.
The results support the rational discounting hypothesis: there is no difference in long-run
performance conditioning on a relationship between the venture capitalists and the underwriter. On the
contrary, when all the underwriters are venture investors in the company, long-run performance is
better. The other two underwriter affiliation variables are insignificant.
Reputation of the venture investors is positively related to performance, although the results
are only marginally significant. More important is the underwriter reputation: firms taken public with
higher quality underwriters perform better in the long run. High-quality underwriters appear to be
concerned about the negative consequences to their reputation of overpricing issues. This result seems
to hold independent of whether the underwriter is also a venture investor. Interactions of the
underwriter reputation with the investment bank-venture capital relationship variable were consistently
insignificant.
While the share of the firm held by venture investors and the revision in the offering price are
not related to long-run performance, the fraction of the venture investors’ equity stake sold at the time
of offering is significant. The relation, however, is opposite to that predicted by the naïve investor
hypothesis. The more of their stake the venture investors sell, the better the company performs in the
long run. One possible explanation for this result is the reputational concerns of the venture investors

23
combined with the need to return capital to investors. Venture capitalists need to return money to their
investors in order to raise new funds, but they do not want to sell a lot of equity at the time of offering
if the firm might decline in value.38 The negative reputational impact of cashing out at the expense of
new investors might hurt their ability to take firms public in the future. Therefore, venture capitalists
might only sell equity in the offering when they were certain that future news concerning the company
will be positive.
Table V presents a comparable analysis of the factors that are associated with liquidations
within the first five years of the IPO. The results show no evidence of a conflict of interest for
underwriters who are also venture investors. In fact, the opposite relation seems to be true: the
stronger is the relation between the underwriter and venture investor, the lower the likelihood of
liquidation. The regressions in Table V do not include the dummy variable that indicates if all the
underwriters were venture investors because it perfectly predicts liquidations. No issue in which all
underwriters were venture investors was liquidated within five years.
Unlike long-run returns, neither the reputation of the venture capital investors nor the
reputation of the underwriter has an impact on the probability of liquidation. Size (market value at the
time of the IPO) is the most important factor related to liquidation. Larger firms are liquidated far less
frequently. This makes sense if larger firms at IPO raise more money and have better investment
prospects.
38 Paul A. Gompers, Grandstanding in the Venture Capital Industry, 42 J. Fin. Econ. 133 (1996).

24
While the percentage of the firm owned by the venture investors prior to IPO has no effect on
liquidation probability, the fraction of their stake they sell at IPO does. Once again, the result is the
opposite of what we would expect if the naïve investor hypothesis were true. If the venture investors
sell a larger fraction of their holdings, the firm is less likely to be liquidated.
In summary, the long-run performance tests support rational discounting. The status of an
investment bank as a venture investor is generally unrelated to the firm’s performance.
C. Underpricing
The discount of the offering at the time of the IPO provides an alternative way to examine the
market’s reaction to potential conflicts of interest. As discussed in Section 3.3, the rational discounting
hypothesis suggests that issues in which an underwriter is also a venture investor would have to be
underpriced more to induce investors to buy the issue, because of the greater adverse selection.
In Table VI, we tabulate the average and median underpricing. We once again sort the IPOs
on the basis of underwriter status. Underpricing does seem to be related to the underwriter status. As
a conflict of interest becomes more likely—i.e., as we move from no underwriter being a venture
investor to any underwriter being a venture investor to all underwriters being venture investors—the
average underpricing increases. The differences, however, are statistically insignificant.

25
Regression results for underpricing are presented in Table VII. While significance levels are
low, there does appear to be a monotonic relationship between venture capital/underwriter affiliation
and underpricing. A closer relationship is associated with greater underpricing. The market appears to
require greater underpricing to compensate for perceived conflicts of interest. None of the venture
firm reputation variables associated with reduced underpricing. Unlike the long-run excess returns, the
reputation of the venture capitalist has no effect on underpricing. In all the regressions, however, size
of the issuing firm is positively related and its book-to-market ratio is negatively related to the firm’s
first day return. Large issuing firms and high growth (low book-to-market) companies are associated
with more underpriced offerings. (It might be thought that information problems would be greater
here.) The reputation of the underwriter has a significant impact on the first day return. IPOs
underwritten by higher reputation investment banks have lower underpricing, as shown by Barry, et
al.39
The role of reputation is particularly pronounced when there is a potential conflict of interest.
Interactions between underwriter affiliation and underwriter reputation are consistently negative.
When a potential conflict of interest is present, reputation may be a check on incentives to take
advantage of investors. This highlights the role that reputation may play in ameliorating conflicts of
interest.
39 Barry, et al., supra note 7.

26
D. Portfolio Company Selection
In this section, we examine whether the venture capital subsidiaries of investment banks choose
to invest in and underwrite less information-sensitive issues in order to limit potential conflicts of
interest. Kroszner and Rajan do a similar analysis of public issues during the pre-Glass-Steagall
period.40 We are able to obtain more detailed information on the venture-backed offerings and can
therefore classify the types of offerings with greater detail.
Table VIII presents summary statistics which classify issuers into three groups: if any of the
underwriters was a venture investor, if an investment bank-affiliated venture capital firm invested in the
company but was not an underwriter, and if no investment bank-affiliated venture capital firm invested
in the firm. Firms in which an investment bank both invested as a venture capitalist and underwrote the
offering are larger, have higher offering share prices, and have older venture capital investors than
either those in which an investment bank-affiliated venture firm chose not to underwrite the offering or
those in which there are no investment bank-affiliated venture investors. These results are consistent
with the belief that investment bankers are concerned about potential conflicts of interest and only
choose to both invest in and underwrite offerings that are less information sensitive: i.e., larger and
higher priced firms with more reputable venture capital investors.
Table IX presents three logit regressions. First, we determine what factors influence an
investment bank to both invest in and underwrite the offering of a particular company. The first

27
column shows that firms in which an underwriter is also a venture investor tend to be larger, have
higher book-to-market ratios (i.e., are less likely to be “glamour” stock), have more reputable venture
investors, and have higher equity ownership by the venture capitalists. The second column indicates
that this pattern is a consequence of the types of firms in which investment bank-affiliated venture
investors choose to invest. The regression examines whether or not the firm had received capital from
an investment bank-affiliated venture capitalist, regardless of whether the investment bank underwrote
the offering or not. The regression shows that investment banks invest in companies that have lower
asymmetric information. In the third regression we examine which firms go public with an underwriter
who is an venture investor, conditional on the firm having received an earlier investment by an
investment bank-affiliated venture fund. We find that the only factor which is associated with the
likelihood that an investment bank will underwrite an offering in which it is an investor is firm size:
investment banks are unwilling to underwrite smaller offerings. The significant variables in the three
regressions proxy for potentially lower asymmetric information. As in the earlier period studied by
Kroszner and Rajan, investment banks appear to internalize the conflict of interest and choose to
simultaneously invest in and underwrite only those issues in which the potential to exploit asymmetric
information is small.41 Again, this result is consistent with the predictions of the rational discounting
hypothesis.
VI. Conclusions
40 Kroszner & Rajan, supra note 1.41Kroszner & Rajan, supra note 1.

28
The evidence from venture affiliates of investment banks suggests that in a context analogous
to a universal bank, the market appears to “rationally” discount for potential conflicts of interest.
Offerings underwritten by an investment bank that is also a venture investor do not perform any worse
than other issues. The market appears to require a greater discount at the offering to compensate for
potential adverse selection. Some of this greater discount required is reduced by the reputation of the
investment bank. Finally, investment banks tend to choose to invest in and underwrite firms with lower
asymmetric information.
While this study concurs with the conclusions of earlier historical studies, because of the
greater information available for our sample, we are able to perform sharper and more detailed tests of
Krozner and Rajan’s rational discounting and naïve investor hypotheses.42 Unlike earlier work, we can
quantitatively document the precise ownership relationship between the underwriter and the firm
issuing equity and have very detailed performance measures. Our analysis also controls for other
factors that potentially confound previous studies, including size, book-to-market ratios, and
reputation.
Our evidence strongly supports the rational discounting hypothesis, while rejecting the naïve
investor hypothesis. The ability of the market to correctly anticipate conflicts of interest and
incorporate them into the price of the security argues in favor of removing restrictions on investment
and commercial banking imposed by the Glass-Steagall Act. The large number of institutional
42 Kroszner and Rajan, supra note 1.

29
investors with large research staffs and the increase in disclosure requirements imply that the market
has the ability to understand the incentive effects of universal banking.43
43Paul A. Gompers & Andrew Metrick, 1998, How are Large Institutions Different from OtherInvestors? Why do these Differences Matter for Equity Prices and Returns? (Unpublished manuscript,Harvard Univ., 1998).

30
References
Barber, Brad M., Lyon, John D., and Tsai, Chih-Ling, “Improved Methods for Tests of Long-RunAbnormal Stock Returns.” Journal of Finance forthcoming (1998).
Barry, Christopher B., Muscarella, Chris J., Peavy, John W., III, and Vetsuypens, Michael R.. “TheRole of Venture Capital in the Creation of Public Companies: Evidence from the Going PublicProcess.” Journal of Financial Economics 27 (1990): 447-71.
Brav, Alon and Gompers, Paul A., “Myth or Reality? The Long-Run Underperformance of InitialPublic Offerings: Evidence from Venture Capital and Nonventure Capital-backed Companies.” Journalof Finance 52 (1997): 1791-1821.
Calomiris, Charles W. and Ramirez, Carlos. “Financing the American Corporation: The ChangingMenu of Financial Relationships.” NBER Historical Working Paper No. 79 (1996).
Carter, Richard and Manaster, Steven. “Initial Public Offerings and Underwriter Reputation.” Journalof Finance 45 (1990): 1045-67.
Carter, Richard, Dark, Frederick, and Singh, Ajai. “Underwriter Reputation, Initial Returns, and theLong-Run Performance of IPO Stocks.” Journal of Finance 53 (1998): 285-312.
Fama, Eugene F., and French, Kenneth R.. “The Cross-section of Expected Stock Returns.” Journal ofFinance 47 (1992): 427-465.
Gompers, Paul A. “Optimal Investment, Monitoring, and the Staging of Venture Capital.” Journal ofFinance 50 (1995): 1461-1489.
Gompers, Paul A. “Grandstanding in the Venture Capital Industry.” Journal of Financial Economics42 (1996): 133-156.
Gompers, Paul A. and Lerner, Josh. “An Analysis of Compensation in the U.S. Venture CapitalPartnership.” Journal of Financial Economics forthcoming (1998).
Gompers, Paul A. and Lerner, Josh. “Venture Capital Distributions: Short-Run and Long-RunReactions.” Journal of Finance forthcoming (1998).
Gompers, Paul A., and Metrick, Andrew. “How are Large Institutions Different from Other Investors?Why do these Differences Matter for Equity Prices and Returns?” Unpublished manuscript.Cambridge: Harvard University 1998.
Hayes, Samuel L. “Investment Banking: Power Structure in Flux.” Harvard Business Review 49

31
(November-December 1971): 136-52.
Kroszner, Randall S. “The Evolution of Universal Banking and its Regulation in Twentieth CenturyAmerica.” In Universal Banking: Financial System Design Reconsidered, edited by Anthony Saundersand Ingo Walter, Chicago, Irwin, 1996, 70-99.
Kroszner, Randall S. and Rajan, Raghuram G.. “Is the Glass-Steagall Act Justified? A Study of theU.S. Experience with Universal Banking before 1933.” American Economic Review 84 (1994): 810-832.
Kroszner, Randall S. and Rajan, Raghuram G.. “Organization Structure and Credibility: Evidence fromCommercial Bank Securities Activities before the Glass-Steagall Act.” Journal of MonetaryEconomics 39 (1997): 475-516.
Lerner, Josh. “ImmuLogic Pharmaceutical Corporation (C): April 1991.” Harvard Business Schoolcase #9-293-071and teaching note #5-293-118 (1992).
Lerner, Josh. “Venture Capitalists and the Oversight of Private Firms.” Journal of Finance 50 (1995):301-318.
Megginson, William C. and Weiss, Kathleen A. “Venture Capital Certification in Initial PublicOfferings.” Journal of Finance 46 (1991): 879-93.
Myers, Stewart and Majluf, Nicholas S. “Corporate Financing and Investment Decisions when FirmsHave Information that Investors Do Not Have.” Journal of Financial Economics 13 (1984): 187-221.
Nanda, Vikram, Yi, Jong-Hwan, and Yun, Youngkeol. “IPO Long-Run Performance and UnderwriterReputation,” Unpublished manuscript. Ann Arbor: University of Michigan, 1995.
Puri, Manju. “The Long Term Default Performance of Bank Underwritten Security Issues.” Journal ofBanking and Finance 18 (1994): 397-418.
Puri, Manju. “Commercial Banks in Investment Banking: Conflict of Interest or Certification Role?”Journal of Financial Economics 40 (1996): 373-401.
Rajan, Raghuran G. “A Theory of the Costs and Benefits of Universal Banking.” Unpublishedmanuscript, Chicago: University of Chicago, 1992.
Ritter, Jay. “The Long-Run Performance of Initial Public Offerings.” Journal of Finance 42 (1991):365-394.
Rock, Kevin. “Why New Issues are Underpriced.” Journal of Financial Economics 15 (1986): 187-

32
212.
Roe, Mark. “Political and Legal Restraints on Ownership and Control of Public Companies.” Journalof Financial Economics 27 (1990): 7-42.
Standard and Poor’s Corporation. Daily Stock Price Record—NASDAQ. New York: Standard andPoor’s (also AMEX and NYSE volumes), 1993 and earlier years.
Venture Economics. Pratt's Guide to Venture Capital Sources. New York: Securities Data Company,1996 and earlier years.

Table I
Summary statistics for venture capital-backed IPOs. The sample is 885 venture capital-backed IPOs from 1972 through1992 for which a venture capitalist could be identified as a five percent equity holder in or a director of the company priorto offering.
Characteristics of offering Mean MedianMarket value of equity (millions of 1992 dollars) $160.7 $98.9Offer price per share (1992 dollars) $14.67 $13.00Underwriter rank 7.54 8.75Percentage of firm owned by venture capitalists before IPO 33.7% 30.5%Percentage of firm owned by venture capitalists after IPO 23.4% 21.1%Percentage of their stake sold by venture capitalists in the IPO 5.9% 0%Mean age of the venture organizations who were directors (years) 11.8 11.7Mean age of the venture organizations who were investors (years) 11.8 11.7Underpricing 9.3% 3.7%Five year buy-and-hold return +61.5% -11.3%Five year excess buy-and-hold return versus size and book-to-market portfolios +25.2% -34.8%Characteristics of the investment banking relationshipNumber of IPOs in which any of the investment bankers was also a venture capitalinvestor in the firm
127
Number of IPOs in which the book investment banker was also a venture capitalinvestor in the firm
71
Number of IPOs in which all of the investment bankers were also venture capitalinvestors in the firm
23

Table II
Summary statistics by year of offering. The sample is 885 venture capital-backed IPOs from 1972 through 1992 for whicha venture capitalist could be identified as a five percent equity holder in or a director of the company prior to offering. Themarket value of the firm is determined by the first CRSP-listed closing price and is expressed in constant 1992 dollars. Underpricing is the percentage return on the first day calculated from the offering price to the close of the first trading day. The five-year return is the buy-and-hold return calculated over five years or until delisting. The excess return is the five-year buy-and-hold return on the IPO firm minus the five-year buy-and-hold return on a matched size and book-to-marketportfolio which excludes all firms that have issued equity in initial public offerings or seasoned equity offerings within thepast five years. The number of liquidations within the first five years after issue is also tabulated.
Year NumberMarket Value (millions
of 1992 dollars) Underpricing Five year return Excess returnLiquidations
within five years1972 1 $178.4 na 2.0% -9.1% 01973 11 227.6 6.2% 45.6 -21.3 01974 3 275.5 -1.8 181.4 -113.8 01975 0 na na na na na1976 8 299.6 1.7 259.2 17.1 01977 5 138.1 13.3 346.7 269.5 01978 8 231.6 21.7 604.0 390.1 01979 6 234.8 27.9 1.7 -120.7 01980 23 459.5 18.5 67.9 14.9 11981 49 146.6 16.3 16.3 -21.9 51982 23 261.5 9.3 43.9 -54.0 21983 109 263.1 10.8 -11.2 -26.4 61984 46 119.6 1.7 -0.8 -23.4 81985 45 113.1 3.7 14.1 5.5 61986 94 143.0 6.8 83.0 83.4 131987 76 127.8 6.3 23.0 18.3 71988 35 132.8 7.4 120.6 90.0 51989 37 118.2 10.0 148.0 117.9 21990 40 121.9 10.9 2.0 -54.4 11991 104 145.1 13.0 106.5 59.6 31992 151 117.0 11.2 72.5 44.3 9

Table III
Summary statistics for five-year excess returns and liquidation fraction sorted by investment banking relationship. Thesample is 885 venture capital-backed IPOs from 1972 through 1992 for which a venture capitalist could be identified as afive percent equity holder in or a director of the company prior to offering. The excess five-year return is calculated as thefive-year buy-and-hold return on the IPO firm minus the five-year buy-and-hold return on the matched size and book-to-market portfolio which excludes all firms that have issued equity in initial public offerings or seasoned equity offeringswithin the past five years. The fractions of firms liquidated in the first five years are also tabulated. {p-values for t-testsfor differences in means, Wilcoxon rank-sum tests for differences in medians, and Pearson chi-squared tests fordifferences in incidence rates are in braces.}
Five year excess return LiquidationMean Median Fraction
1) All underwriters are venture investors in the firm 112.6% -24.1% 0.0%2) Not all underwriters are venture investors in the firm 23.1
{0.082}-35.0
{0.530}8.2
{0.153}3) Book underwriter is a venture investor in the firm 31.6 -33.4 2.84) Book underwriter is not a venture investor in the firm 24.7
{0.817}-35.0
{0.905}8.4
{0.094}5) Any underwriter is an investor in the firm 20.5 -50.0 6.36) No underwriter is an investor in the firm 25.9
{0.815}-34.1
{0.271}8.3
{0.453}
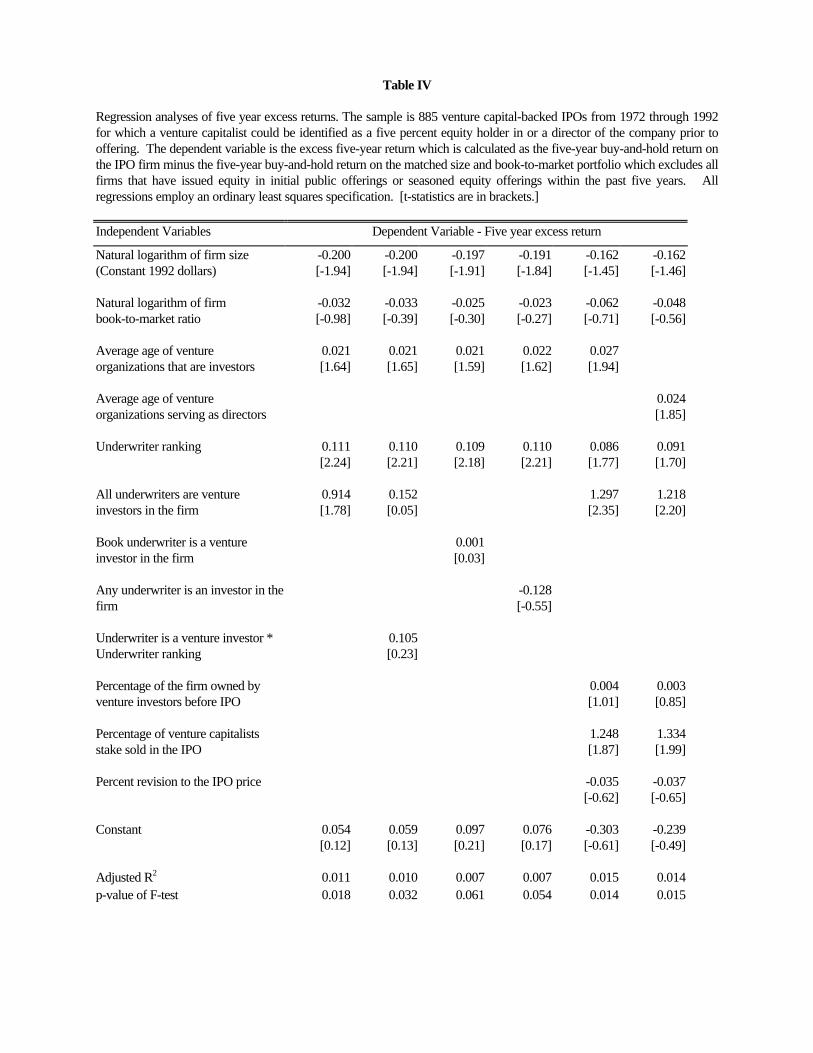
Table IV
Regression analyses of five year excess returns. The sample is 885 venture capital-backed IPOs from 1972 through 1992for which a venture capitalist could be identified as a five percent equity holder in or a director of the company prior tooffering. The dependent variable is the excess five-year return which is calculated as the five-year buy-and-hold return onthe IPO firm minus the five-year buy-and-hold return on the matched size and book-to-market portfolio which excludes allfirms that have issued equity in initial public offerings or seasoned equity offerings within the past five years. Allregressions employ an ordinary least squares specification. [t-statistics are in brackets.]
Independent Variables Dependent Variable - Five year excess return
Natural logarithm of firm size(Constant 1992 dollars)
-0.200[-1.94]
-0.200[-1.94]
-0.197[-1.91]
-0.191[-1.84]
-0.162[-1.45]
-0.162[-1.46]
Natural logarithm of firmbook-to-market ratio
-0.032[-0.98]
-0.033[-0.39]
-0.025[-0.30]
-0.023[-0.27]
-0.062[-0.71]
-0.048[-0.56]
Average age of ventureorganizations that are investors
0.021[1.64]
0.021[1.65]
0.021[1.59]
0.022[1.62]
0.027[1.94]
Average age of ventureorganizations serving as directors
0.024[1.85]
Underwriter ranking 0.111[2.24]
0.110[2.21]
0.109[2.18]
0.110[2.21]
0.086[1.77]
0.091[1.70]
All underwriters are ventureinvestors in the firm
0.914[1.78]
0.152[0.05]
1.297[2.35]
1.218[2.20]
Book underwriter is a ventureinvestor in the firm
0.001[0.03]
Any underwriter is an investor in thefirm
-0.128[-0.55]
Underwriter is a venture investor *Underwriter ranking
0.105[0.23]
Percentage of the firm owned byventure investors before IPO
0.004[1.01]
0.003[0.85]
Percentage of venture capitalistsstake sold in the IPO
1.248[1.87]
1.334[1.99]
Percent revision to the IPO price -0.035[-0.62]
-0.037[-0.65]
Constant 0.054[0.12]
0.059[0.13]
0.097[0.21]
0.076[0.17]
-0.303[-0.61]
-0.239[-0.49]
Adjusted R2 0.011 0.010 0.007 0.007 0.015 0.014p-value of F-test 0.018 0.032 0.061 0.054 0.014 0.015

Number of observations 814 814 814 814 766 766

Table V
Regression analyses of the incidence of liquidation within the first five years of offering. The sample is 885 venturecapital-backed IPOs from 1972 through 1992 for which a venture capitalist could be identified as a five percent equityholder in or a director of the company prior to offering. The dependent variable is a dummy variable that equals one if thefirm was liquidated within the first five years of its initial public offering. All regressions employ a logit specification. [t-statistics are in brackets.]
Independent Variables Dependent Variable - Liquidation in the first five yearsNatural logarithm of firm size (Constant1992 dollars)
-0.779[-4.12]
-0.414[-3.17]
-0.806[-4.23]
-0.901[-4.30]
-0.903[-4.61]
Natural logarithm of firmbook-to-market ratio
-0.166[-1.35]
-0.192[-2.07]
-0.169[-1.37]
-0.080[-0.61]
-0.088[-0.66]
Average age of venture organizationsthat are investors
-0.004[-0.18]
-0.030[-1.82]
-0.005[-0.23]
-0.004[-0.17]
Average age of venture organizationsserving as directors
-0.028[-1.27]
Underwriter ranking -0.002[-0.03]
-0.087[-1.63]
-0.008[-0.11]
0.071[0.84]
0.084[1.01]
Book underwriter is a venture investorin the firm
-0.761[-1.03]
0.923[0.32]
-0.829[-1.12]
-0.779[-1.05]
Any underwriter is an investor in thefirm
0.243[0.59]
Underwriter is a venture investor *Underwriter ranking
-0.245[-0.64]
Percentage of the firm owned by ventureinvestors before IPO
-0.010[-1.46]
-0.008[-1.20]
Percentage of venture capitalists stakesold in the IPO
-3.534[-1.94]
-3.599[-1.96]
Percent revision to the IPO price 0.205[1.74]
0.210[1.76]
Constant 0.715[1.07]
0.841[1.68]
0.804[1.19]
1.393[1.89]
1.464[2.01]
Log likelihood -193.16 -328.2 -193.58 -184.81 -156.18
p-value of χ2-statistic 0.000 0.000 0.000 0.000 0.000Number of observations 814 814 814 766 766

Table VI
Summary statistics for underpricing sorted by investment banking relationship. The sample is 885 venture capital-backedIPOs from 1972 through 1992 for which a venture capitalist could be identified as a five percent equity holder in or adirector of the company prior to offering. Underpricing is calculated as the percentage return on the first day of tradingfrom the offering price to the closing price on the first day. {p-values for t-tests for differences in means and Wilcoxonrank-sum tests for differences in medians are in braces.}
UnderpricingMean Median
1) All underwriters are venture investors in the firm 13.1% 2.9%2) Not all underwriters are venture investors in the firm 9.2
{0.250}3.8
{0.829}3) Book underwriter is a venture investor in the firm 11.6 5.94) Book underwriter is a venture investor in the firm 9.1
{0.216}3.7
{0.322}5) Any underwriter is a venture investor in the firm 10.3 5.96) No underwriter is a venture investor in the firm 9.1
{0.435}3.5
{0.115}
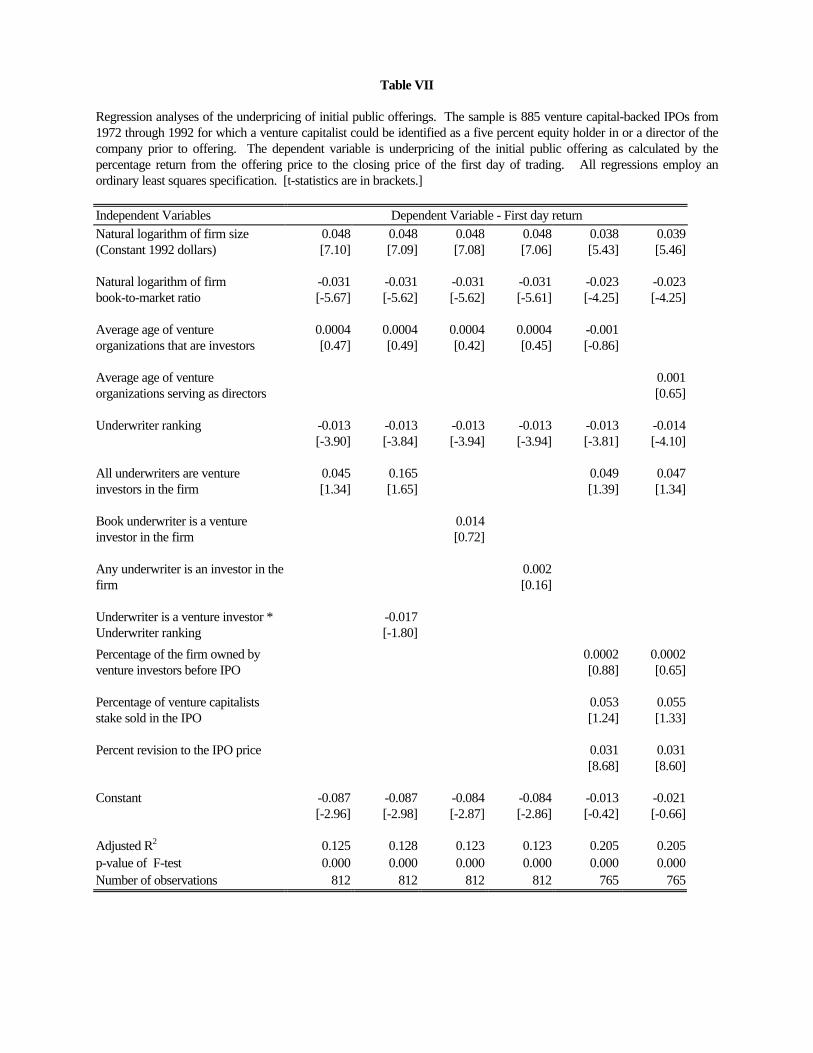
Table VII
Regression analyses of the underpricing of initial public offerings. The sample is 885 venture capital-backed IPOs from1972 through 1992 for which a venture capitalist could be identified as a five percent equity holder in or a director of thecompany prior to offering. The dependent variable is underpricing of the initial public offering as calculated by thepercentage return from the offering price to the closing price of the first day of trading. All regressions employ anordinary least squares specification. [t-statistics are in brackets.]
Independent Variables Dependent Variable - First day returnNatural logarithm of firm size(Constant 1992 dollars)
0.048[7.10]
0.048[7.09]
0.048[7.08]
0.048[7.06]
0.038[5.43]
0.039[5.46]
Natural logarithm of firmbook-to-market ratio
-0.031[-5.67]
-0.031[-5.62]
-0.031[-5.62]
-0.031[-5.61]
-0.023[-4.25]
-0.023[-4.25]
Average age of ventureorganizations that are investors
0.0004[0.47]
0.0004[0.49]
0.0004[0.42]
0.0004[0.45]
-0.001[-0.86]
Average age of ventureorganizations serving as directors
0.001[0.65]
Underwriter ranking -0.013[-3.90]
-0.013[-3.84]
-0.013[-3.94]
-0.013[-3.94]
-0.013[-3.81]
-0.014[-4.10]
All underwriters are ventureinvestors in the firm
0.045[1.34]
0.165[1.65]
0.049[1.39]
0.047[1.34]
Book underwriter is a ventureinvestor in the firm
0.014[0.72]
Any underwriter is an investor in thefirm
0.002[0.16]
Underwriter is a venture investor *Underwriter ranking
-0.017[-1.80]
Percentage of the firm owned byventure investors before IPO
0.0002[0.88]
0.0002[0.65]
Percentage of venture capitalistsstake sold in the IPO
0.053[1.24]
0.055[1.33]
Percent revision to the IPO price 0.031[8.68]
0.031[8.60]
Constant -0.087[-2.96]
-0.087[-2.98]
-0.084[-2.87]
-0.084[-2.86]
-0.013[-0.42]
-0.021[-0.66]
Adjusted R2 0.125 0.128 0.123 0.123 0.205 0.205p-value of F-test 0.000 0.000 0.000 0.000 0.000 0.000Number of observations 812 812 812 812 765 765

Table VIII
Summary statistics for venture capital-backed IPOs sorted by investment banker affiliation. The sample is 885 venture capital-backed IPOs from 1972 through 1992 forwhich a venture capitalist could be identified as a five percent equity holder in or a director of the company prior to offering. [Medians in brackets.]
Characteristic
Any investment bankeris a venture capital
investor
Investment bank-affiliatedventure capital investor,
but not an underwriter
No investment bank-affiliated venture
capital investorMarket value of equity (millions of 1992 dollars) 191.6
[138.5]148.0[98.0]
159.5[92.1]
Offer price per share (1992 dollars) 17.44[14.42]
13.58[12.50]
14.60[12.75]
Underwriter rank 8.10[8.75]
7.73[8.75]
7.27[8]
IPO firm book-to-market ratio 0.293[0.256]
0.272[0.257]
0.292[0.249]
Percentage of firm owned by venture capitalists before IPO 38.1[37.7]
38.137.9
30.15[25.3]
Market capitalization of previous venture-backed IPOs (in 1992 dollars) in whichthe venture directors were serving on the board at the time of the IPO
114.1[66.7]
103.8[54.6]
94.9[65.7]
Mean age of the venture organizations who were directors (years) 13.08[12.78]
12.11[12.31]
11.23[10.90]
Mean age of the venture organizations who were investors (years) 12.44[12.08]
11.80[11.63]
11.50[11.20]
Mean reputational rank of the underwriters in the other IPOs in which the venturecapitalists were involved as directors
7.66[7.80]
7.70[7.83]
7.33[7.83]
Mean reputational rank of the underwriters in the other IPOs in which the venturecapitalists were involved as investors
7.67[7.85]
7.63[7.74]
7.40[7.83]
Number 127 259 499

Table IX
Regression analyses of affiliation between underwriters and venture investor at the time of the initial public offering. The sample is 885 venture capital-backed IPOs from1972 through 1992 for which a venture capitalist could be identified as a five percent equity holder in or a director of the company prior to offering. The dependentvariable is a dummy variable that equals one if any underwriter was a venture investor in the firm, if there is an investment bank-affiliated venture investor in the firm(regardless of whether they underwrite the offering), and if an investment bank chooses to underwrite an issue in which it holds an investment interest through a venturecapital affiliate. All regressions employ a logit specification. [t-statistics are in brackets.]
Dependent Variables
Independent VariablesIs any underwriter
a venture capital investor?Is there an investment bank-affiliated
venture capital investor?If an investment bank-affiliated
venture capital firm invested, does theinvestment bank also underwrite?
Logarithm of market value of equity(millions of 1992 dollars)
0.548[4.49]
0.412[4.18]
0.425[2.52]
Logarithm of IPO firm book-to-market ratio 0.239[1.98]
0.186[2.11]
0.141[0.99]
Mean age of the venture organizations whowere directors (years)
0.052[3.22]
2.029[1.98]
0.030[1.31]
Percentage of firm owned by venturecapitalists before IPO
0.010[2.06]
0.176[4.60]
-0.003[-0.52]
Constant -4.883[-7.63]
-2.0635[-5.42]
-2.675[-3.15]
Log likelihood -314.31 -417.52 -190.99p-value of χ2-statistic 0.000 0.000 0.051Number of observations 784 784 305