Embed Size (px)
Citation preview

IAB Discussion PaperArticles on labour market issues
ISSN 2195-2663
Marlene KnörrEnzo Weber
Labor Markets and Labor Mobility in the French-German Border Region
2/2018

IAB-Discussion Paper 2/2018 2
Labor Markets and Labor Mobility in the French-German Border Region
Marlene Knörr (IAB) Enzo Weber (IAB, Universität Regensburg)
Mit der Reihe „IAB-Discussion Paper“ will das Forschungsinstitut der Bundesagentur für Arbeit den Dialog mit der externen Wissenschaft intensivieren. Durch die rasche Verbreitung von Forschungsergebnissen über das Internet soll noch vor Drucklegung Kritik angeregt und Qualität gesichert werden.
The “IAB-Discussion Paper” is published by the research institute of the German Federal Em-ployment Agency in order to intensify the dialogue with the scientific community. The prompt publication of the latest research results via the internet intends to stimulate criticism and to ensure research quality at an early stage before printing.

IAB-Discussion Paper 2/2018 3
Content
Abstract .................................................................................................................... 5
Zusammenfassung ................................................................................................... 5
Résumé .................................................................................................................... 5
1 Introduction .......................................................................................................... 7
2 Structures of Cooperation in the Upper Rhine Region.......................................... 8
3 Labor Markets and Vocational Education in Alsace and Baden ......................... 14 3.1 Characteristics of Employment in the Border Regions ..................................... 14 3.2 Shortage Situations in the French-German Upper Rhine Region ..................... 20 3.2.1 Bottleneck Analysis of the Baden Labor Market ............................................ 20 3.2.2 Bottleneck Analysis of the Alsatian Labor Market .......................................... 30 3.2.3 Comparison of the Regional Shortages ......................................................... 38 3.3 Developments on the Market for Vocational Education .................................... 39 3.3.1 Trends in the Baden Dual System ................................................................. 39 3.3.2 Trends in the Alsatian School-Based and Apprenticeship System ................. 43
4 Descriptive Analysis of French Frontier Workers in Baden ................................. 46
5 Examination of the Effect of Labor Market Shortages on the Number of Frontier Workers ............................................................................................................. 54
5.1 Theoretical Framework .................................................................................... 55 5.2 Model Specification ......................................................................................... 56 5.3 Presentation and Interpretation of the Results ................................................. 61
6 Qualitative Assessment of Cross-Border Mobility ............................................... 66 6.1 Obstacles and Restrictions for Regional Labor Mobility ................................... 67 6.2 Challenges Regarding Cross-Border Vocational Education ............................. 72
7 Conclusion ......................................................................................................... 78
References ............................................................................................................. 80
Appendix ................................................................................................................ 93
IAB-Discussion Paper 2/2018 4
List of Tables and Figures
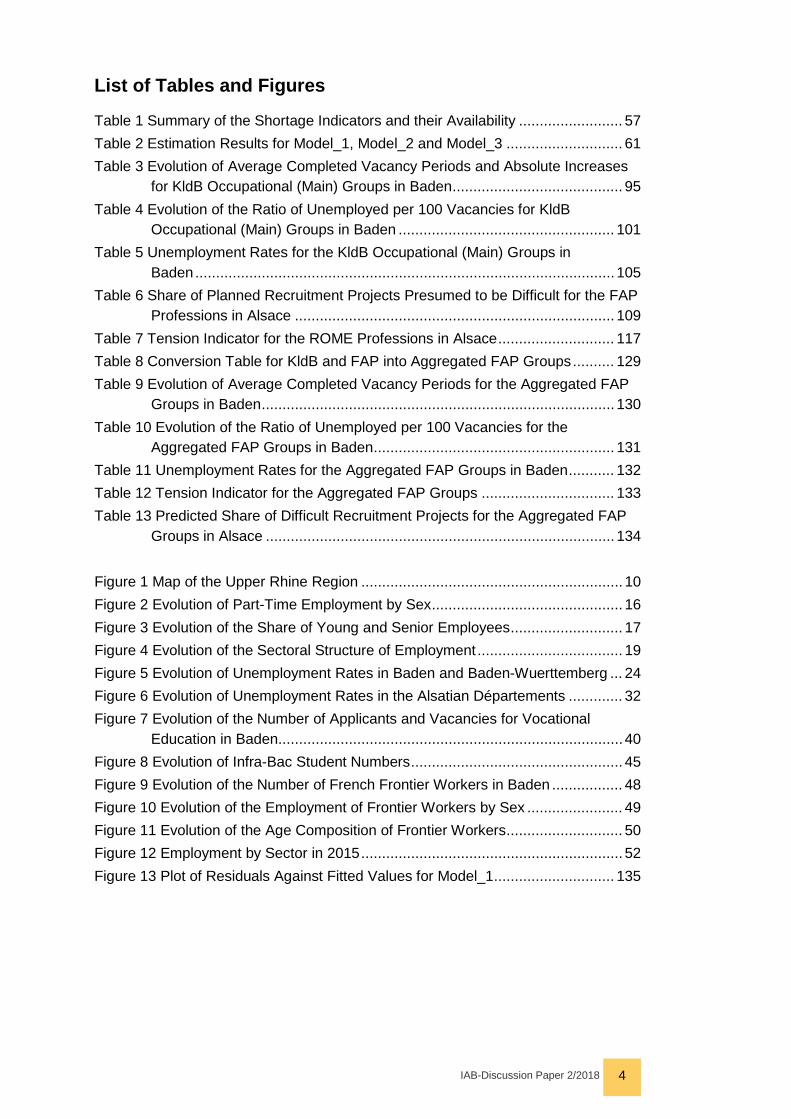
Table 1 Summary of the Shortage Indicators and their Availability ......................... 57 Table 2 Estimation Results for Model_1, Model_2 and Model_3 ............................ 61 Table 3 Evolution of Average Completed Vacancy Periods and Absolute Increases
for KldB Occupational (Main) Groups in Baden ......................................... 95 Table 4 Evolution of the Ratio of Unemployed per 100 Vacancies for KldB
Occupational (Main) Groups in Baden .................................................... 101 Table 5 Unemployment Rates for the KldB Occupational (Main) Groups in
Baden ..................................................................................................... 105 Table 6 Share of Planned Recruitment Projects Presumed to be Difficult for the FAP
Professions in Alsace ............................................................................. 109 Table 7 Tension Indicator for the ROME Professions in Alsace ............................ 117 Table 8 Conversion Table for KldB and FAP into Aggregated FAP Groups .......... 129 Table 9 Evolution of Average Completed Vacancy Periods for the Aggregated FAP
Groups in Baden ..................................................................................... 130 Table 10 Evolution of the Ratio of Unemployed per 100 Vacancies for the
Aggregated FAP Groups in Baden .......................................................... 131 Table 11 Unemployment Rates for the Aggregated FAP Groups in Baden ........... 132 Table 12 Tension Indicator for the Aggregated FAP Groups ................................ 133 Table 13 Predicted Share of Difficult Recruitment Projects for the Aggregated FAP
Groups in Alsace .................................................................................... 134 Figure 1 Map of the Upper Rhine Region ............................................................... 10 Figure 2 Evolution of Part-Time Employment by Sex .............................................. 16 Figure 3 Evolution of the Share of Young and Senior Employees ........................... 17 Figure 4 Evolution of the Sectoral Structure of Employment ................................... 19 Figure 5 Evolution of Unemployment Rates in Baden and Baden-Wuerttemberg ... 24 Figure 6 Evolution of Unemployment Rates in the Alsatian Départements ............. 32 Figure 7 Evolution of the Number of Applicants and Vacancies for Vocational
Education in Baden ................................................................................... 40 Figure 8 Evolution of Infra-Bac Student Numbers ................................................... 45 Figure 9 Evolution of the Number of French Frontier Workers in Baden ................. 48 Figure 10 Evolution of the Employment of Frontier Workers by Sex ....................... 49 Figure 11 Evolution of the Age Composition of Frontier Workers ............................ 50 Figure 12 Employment by Sector in 2015 ............................................................... 52 Figure 13 Plot of Residuals Against Fitted Values for Model_1 ............................. 135

IAB-Discussion Paper 2/2018 5
Abstract
This paper examines the cross-border labor market in the French-German Upper Rhine Region. Based on shortage analyses conducted for both sides of the border, a fixed effects panel regression estimates the impact of changing labor market situa-tions on the number of French frontier workers. Although some of the anticipated ef-fects are detected, their size is rather modest and insufficient to balance regional dis-parities in a way that would be expected in a fully integrated cross-border labor mar-ket. By the same token, the quantitative analysis identifies standardized certificates as a barrier to cross-border mobility and confirms a preference of frontier workers for routine tasks. In addition, insufficient public transportation and language skills, miss-ing information about the neighboring country as well as problems with the recognition of degrees are also found among the obstacles to an integrated labor market.
Zusammenfassung
Das Paper untersucht den grenzüberschreitenden Arbeitsmarkt in der französisch-deutschen Oberrheinregion. Basierend auf einer Engpassanalyse für beide Seiten der Grenze schätzt eine Panelregression mit fixen Effekten den Einfluss sich verändern-der Arbeitsmarktlagen auf die Anzahl der französischen Grenzgänger. Obwohl einige der erwarteten Effekte entdeckt werden, sind diese eher begrenzt und nicht ausrei-chend, um regionale Disparitäten in einer Weise auszugleichen, wie es auf einem vollständig integrierten grenzüberschreitenden Arbeitsmarkt erwartet werden würde. Genauso werden standardisierte Abschlusszertifikate als Barriere für grenzüber-schreitende Mobilität identifiziert und die Bevorzugung von Routinetätigkeiten durch die Grenzgänger bestätigt. Darüber hinaus stellen beispielsweise auch unzureichen-der öffentlicher Nahverkehr und ungenügende Sprachkenntnisse, fehlende Informati-onen über das Nachbarland sowie Probleme bei der Anerkennung von Abschlüssen Hindernisse für einen integrierten Arbeitsmarkt dar.
Résumé
Ce document étudie le marché du travail transfrontalier dans la région franco-alle-mande du Rhin Supérieur. En s’appuyant sur une analyse de pénurie de main d’œuvre qui est menée pour les deux côtés de la frontière, une régression en panel à effets fixes estime l’impact d’un changement des situations du marché du travail sur le nombre de travailleurs frontaliers français. Bien que certains des effets prévus soient trouvés, leur ampleur est plutôt modeste et ne suffit pas pour équilibrer les disparités régionales de manière d’un marché du travail transfrontalier complètement intégré. De même, les certificats standardisés sont identifiés comme une barrière à la mobilité transfrontalière et la préférence des travailleurs frontalières pour des tâches routinières est confirmée. En outre, des transports en commun et des compétences linguistiques insuffisants, un manque d’informations sur le pays voisin et des pro-blèmes concernant la reconnaissance des diplômes représentent aussi des obstacles à un marché du travail intégré.

IAB-Discussion Paper 2/2018 6
JEL-Klassifikation: F22, J2, J61
Keywords: Labor mobility, French-German Border Region
Acknowledgements: A special thanks goes to Katia Beck, Marlyce Breun, Katrin Distler, Simon Kaiser, Anna Melchior, Christian Ramm, Horst Sahrbacher, Klaus Schüle, Didier Taverne and Alexandra Walonislow for giving interviews, to Sonia Bourdin, Stephan Brunow, Jérôme Fornalczyk, Marie-Laure Kayali and Frédéric Leroy for providing key data, and to Uwe Blien, Stephan Brunow, Francesco Car-bonero, Silke Hamann, Tobias Hartl, Christian Hutter, Veronika Knize, Alexander Ku-bis, Johann Ludsteck, Laura Maillard, Norbert Mattusch, Christof Röttger and Rüdiger Wapler for giving valuable input and advice.

IAB-Discussion Paper 2/2018 7
1 Introduction „Free movement of persons is one of the fundamental freedoms guaranteed by Com-munity law. […] It is perhaps the most important right under Community law for indi-viduals, and an essential element of European citizenship” (European Commission 2002). In accordance with this statement included in a communication from the Euro-pean Commission, continuous efforts have been made to increase mobility among the EU member states and to remove obstacles preventing citizens from exercising their right of free movement (Eurofound 2014: 1-2; Pilger, Meindl, Hamann 2011: 38). For example, the European Employment Services (EURES) network links public em-ployment agencies, among others, and provides information and guidance for citizens searching or applying for a position in another member state; at the same time, legis-lative and judicial measures aim at facilitating mobility by clarifying administrative and legal uncertainties and by defining the rights of migrants, posted and frontier workers (Eurofound 2014: 7-9; Fries-Tersch, Tugran, Bradley 2017: 16-19, 142-143). Encour-aging the free movement of workers also aims at reducing disparities between na-tional labor markets, ranging from high levels of unemployment to shortages of skilled workers (Eurofound 2014: 1-2, 7; Pilger, Meindl, Hamann 2011: 38).
A special case of labor mobility can be observed in border regions of two or more states, where both job-related migration and cross-border commuting can occur. Whereas the former includes relocating to the neighboring country, the latter implies maintaining one’s place of residence in the country of origin and crossing the border on a regular basis to reach one’s place of work (Janssen 2000: 48). Given the legal framework on European level, it seems possible that cross-border regionally inte-grated labor markets could arise in these areas. Following the definition of Janssen, “a fully developed cross-border labour market can be said to exist when the supply side (employees) search for jobs and the demand side (employers) look for labour equally within the country and across the border” (2000: 48).
In the context of trying to expand the local labor market beyond the national territory, the French-German Upper Rhine border region constitutes a particularly interesting example. In the past decades, cross-border cooperation has been thriving in the re-gion, resulting in an institutionalization of the arising structures on both political and administrative level. Facilitating access to the neighboring labor market and voca-tional education system has received significant attention in the past years and a broad variety of measures and programs has been implemented for this purpose. Nevertheless, given the rather widely differing unemployment rates on both sides of the border, for example, it could be argued that an integrated cross-border labor mar-ket as defined by Janssen may not have been established yet, as also noted by 2014 study (dfi, EURO-Institut Kehl, Strasbourg Conseil 2014: 8). Taking furthermore into account that the two sides of the border continue to be linguistically separated and integrated into different states with idiosyncratic labor market institutions, policies and procedures, this question seems worth considering. Referring once again to the EU-level, research has in fact found labor mobility to remain comparatively low in spite of

IAB-Discussion Paper 2/2018 8
the political efforts (Arpaia, Kiss, Palvolgyi, Turrini 2016: 4; Eurofound 2014: 59). On a different note, whereas (further) integration can generally be useful to reduce dis-parities as mentioned above, it might also be the case that the border territories’ labor market situations do not complement each other in every respect, potentially prevent-ing exchange as well.
It is against this background that labor markets and labor mobility in the French-Ger-man Upper Rhine border region are to be examined more closely in the underlying study. At first, the labor markets on both sides of the border are analyzed separately, with a particular focus on identifying professions that tend to experience labor short-ages, based on the German Federal Employment Agency data and methodology on the one hand as well as the data and procedure used by the corresponding French institutions on the other hand. This way an impression can be gained as to how the labor supply and demand complement each other or stand in competition, thereby indicating in which fields further encouragement of cross-border mobility would be most productive. In a second step, the numbers and characteristics of current French frontier workers in Baden are examined based on data provided by the Institute for Employment Research. Both the labor market situations and cross-border mobility are then brought together: Interpreting the previously identified shortage indicators as push and pull factors, a fixed-effects panel regression model allows to assess the impact of changes in the labor supply and demand for different professions on the number of French frontier workers and thereby provides an impression of the extent to which workers take into account these kind of developments in the integrated labor market. The quantitative analysis is complemented by a synthesis of interviews with regional experts on the topic as well as existing research and points out which practi-cal obstacles are still encountered by cross-border workers as well as participants in vocational education programs. Together, they allow to determine to which extent an integrated labor market exists in the region and which obstacles would still needed to be addressed to further advance this state.
Correspondingly, this paper is structured as follows: First of all, section 2 is to give a brief overview of the precise geographical scale of the region and the institutional cross-border framework. Subsequently, after providing an impression of the employ-ment situation in both Baden and Alsace, detailed regional shortage analyses are conducted for the different professions. Apart from the labor markets, the situation in the two systems for vocational education is also addressed in section 3, but in a less comprehensive manner due to limited data availability. Following a descriptive analy-sis of French frontier workers in the German border region in section 4, the fixed ef-fects panel regression is presented in the subsequent section. Lastly, section 6 con-tains the results of the expert interviews on cross-border employment and vocational education, allowing for recommendations regarding future action.
2 Structures of Cooperation in the Upper Rhine Region During the past decades, structures of cooperation have been created in the region on numerous levels. In the following paragraphs, a short overview of both recent and

IAB-Discussion Paper 2/2018 9
historic developments – especially with regard to the promotion of labor and educa-tional mobility – is to be provided after briefly defining the region considered in this report in more detail.
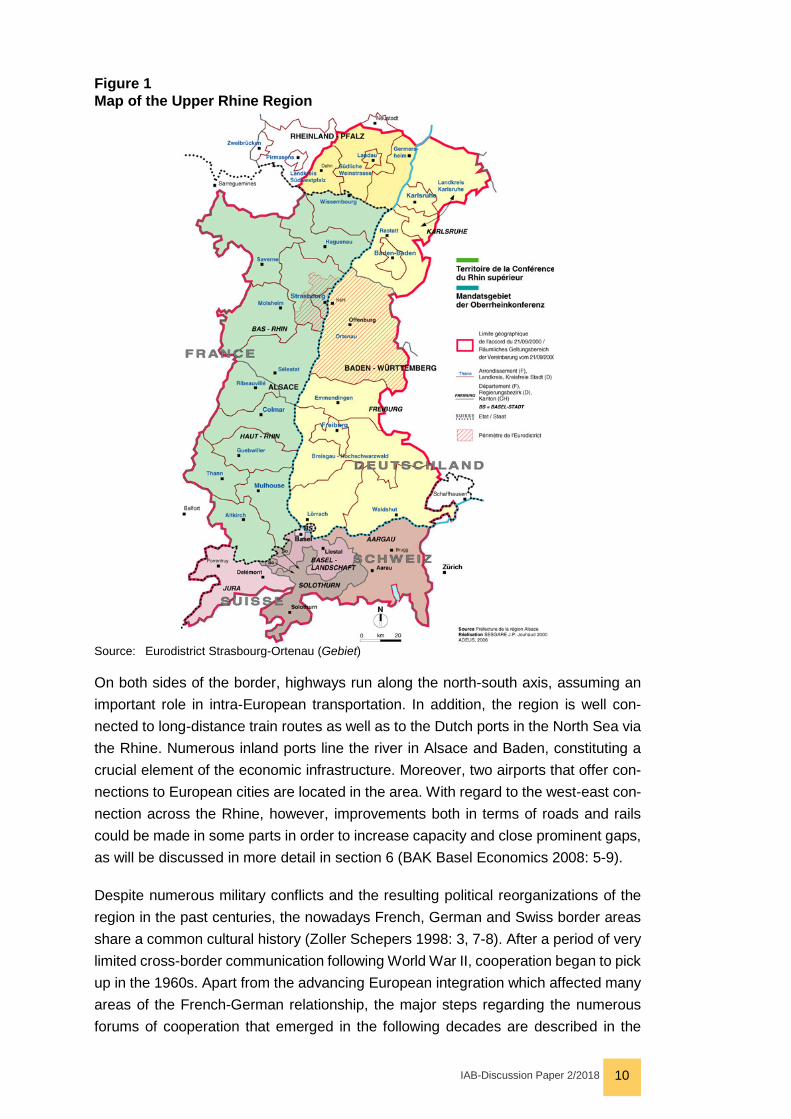
Although the Upper Rhine Region in its entirety is composed of the French Alsace, North-Western Switzerland and the German territories of Baden and Southern Palat-inate as depicted in figure 1 (Deutsch-Französisch-Schweizerische Oberrheinkonfer-enz 2016: 4), the paper will focus on the cross-border relations between Alsace and Baden exclusively, especially in the data-based sections. While the former consists of the two départements Haut-Rhin and Bas-Rhin (Upper and Lower Rhin) which are part of the larger région Grand Est, the latter includes the Landkreise Waldshut, Lö-rrach, Breisgau-Hochschwarzwald, Freiburg im Breisgau, Emmendingen, Ortenau, Rastatt, Baden-Baden as well as Karlsruhe city district and rural district (BAK Basel Economics 2008: 70). Together, Alsace and Baden account for 76 percent (16,427 km²) of the Upper Rhine Region’s total area and 71 percent (4,316,780)1 of its popu-lation (Deutsch-Französisch-Schweizerische Oberrheinkonferenz 2016: 6), which highlights their significance.
1 Combined population of Baden and Alsace in 2014
IAB-Discussion Paper 2/2018 10
Figure 1 Map of the Upper Rhine Region
Source: Eurodistrict Strasbourg-Ortenau (Gebiet)
On both sides of the border, highways run along the north-south axis, assuming an important role in intra-European transportation. In addition, the region is well con-nected to long-distance train routes as well as to the Dutch ports in the North Sea via the Rhine. Numerous inland ports line the river in Alsace and Baden, constituting a crucial element of the economic infrastructure. Moreover, two airports that offer con-nections to European cities are located in the area. With regard to the west-east con-nection across the Rhine, however, improvements both in terms of roads and rails could be made in some parts in order to increase capacity and close prominent gaps, as will be discussed in more detail in section 6 (BAK Basel Economics 2008: 5-9).
Despite numerous military conflicts and the resulting political reorganizations of the region in the past centuries, the nowadays French, German and Swiss border areas share a common cultural history (Zoller Schepers 1998: 3, 7-8). After a period of very limited cross-border communication following World War II, cooperation began to pick up in the 1960s. Apart from the advancing European integration which affected many areas of the French-German relationship, the major steps regarding the numerous forums of cooperation that emerged in the following decades are described in the

IAB-Discussion Paper 2/2018 11
following (BAK Basel Economics 2008: 15, 17-19; Pilger, Meindl, Hamann 14; Zoller Schepers 1998: 32-65).
The first local attempt aimed at creating a connected Upper Rhine Region originated in Switzerland: in 1963, the so-called Regio Basiliensis was founded, a private initia-tive aimed at supporting the creation of an integrated cross-border region that was soon to be followed by the French Regio du Haut-Rhin and in 1984 by the German Freiburger Regio Gesellschaft. Covering the southern part of today’s Upper Rhine Region, it is also known under the name of RegioTriRhena. In the northern part of the region, a corresponding Regio Pamina exists. In addition, the emerging trinational talks between the respective administrations were institutionalized in 1975 and the geographical boundaries of the region extended with the establishment of a govern-ment commission that was given a broad mandate. The commission oversaw two regional committees – for the northern and the southern part of the area, respectively – which were combined into the Franco-German-Swiss Conference of the Upper Rhine in 1991. At the time, such an agreement was one of the first of its kind in Europe (BAK Basel Economics 2008: 19-20; Deutsch-Französisch-Schweizerische Ober-rheinkonferenz Entstehung.; Pfeiffer 2000: 56, 59; Zoller Schepers 1998: 38-44, 51).
The Conference now plays a central role in coordinating cross-border cooperation and reports to the government commission. It allows for cooperation between the re-gional political and administrative organs, whereas the government commission pro-vides a link between the three national governments (Deutsch-Französisch-Schweizerische Oberrheinkonferenz Entstehung; Organisation). To address the vari-ety of fields relevant for coordination, several subject-specific working groups and ex-pert committees have been established (BAK Basel Economics 2008: 20). Starting in 1998, the newly created Upper Rhine Council has also provided a stronger political institutionalization of the trinational cooperation on regional level, in addition to the rather administrative focus of the Conference. It consists of 71 members who hold an elected office in their respective national political systems and thus provide demo-cratic legitimation. On the one hand, the Council supports the Conference; on the other hand, it represents the region’s interests on national and European level. Since 2010, both Conference and Council form part of the Upper Rhine Trinational Metro-politan Region (Oberrheinrat Rolle). Thematically, the Metropolitan Region consists of four pillars, covering politics, the economy, research and the civil society, respec-tively. It focuses on the long-term future development of the area (BAK Basel Eco-nomics 2008: 22; Trinationale Metropolregion Oberrhein EURES-T).
In 2013, 2015 and in April 2017, high-level conferences on cross-border cooperation between France and Germany assembled as another tool of communication and co-ordination, the most recent one announcing further steps in the common activities to, among others, strengthen mobility in education, labor and trade, promote the acqui-sition of skills in the neighboring countries’ language and increase efficiency of public transportation (Erklärung Hambach 2017).

IAB-Discussion Paper 2/2018 12
Moreover, as a part of the Trinational Metropolitan Region, four so-called Eurodistricts constitute an additional layer of coordination in the Upper Rhine Region, namely Strasbourg-Ortenau, Regio Pamina, Basel and Freiburg-Centre et Sud Alsace (Euro-district Region Freiburg/ Centre et Sud Alsace Eurodistrikte). To present a practical example of their cooperation, the Eurodistrict Strasbourg-Ortenau and employment agencies on both sides initiated a program in 2016 designed to reduce unemployment on the French side and to solve the difficulties of German enterprises regarding the supply of skilled workers, called Towards a 360° Labor Market (Maison d’Emploi Strasbourg 360°).
With regard to employment, one of the core instruments of sustained cooperation in this field is certainly the EURES-T Upper Rhine partnership, T being short for Trans-frontalier (cross-border). Forming part of the European Union’s EURES network, the partnership was established in 1999 and extended to include Switzerland in 2004 with the purpose of building and promoting a cross-border labor market. Employment ser-vices, social partners and regional authorities created this service to provide infor-mation for cross-border commuters, jobseekers, apprentices and employers on differ-ent aspects of cross-border mobility, such as social security and taxation issues (BAK Basel Economics 2008: 21; EURES-T Oberrhein Porträt; Oberrhein). Assistance is also offered on hiring or finding a job placement or apprenticeship across the border.
Moreover, the identification of obstacles to working in the neighboring country and the communication on difficulties regarding the employment of cross-border commuters is thereby facilitated (EURES-T Oberrhein Arbeitgeber; Oberrhein; European Com-mission EURES; Trinationale Metropolregion Oberrhein Ausbildung). For the custom-ers’ convenience, a one-stop shop acts as a first point of contact, from which the requests can be directed to specialized EURES advisors for questions on working or hiring abroad and finding a job placement or to EURES-T experts for the French-German cross-border dual vocational training programs and dual courses of study (EURES-T Oberrhein Beratungsteam; Dienstleistungsangebot). EURES-T Upper Rhine is coordinated by the regional section of the German Federal Employment Agency and receives funding from the EU budget as well as contributions from the Swiss and French regional authorities (EURES-T Oberrhein Organisation; Oberrhein; Strasbourg l’européenne EURES-T).
Another major step with respect to an integrated labor market was taken in 2013, when the German Federal Employment Agency and the French Pôle emploi estab-lished designated cross-border placement services in which employees from both in-stitutions work directly together to assist job seekers and employers. By 2017, these services have been set up for the neighboring areas of Strasbourg/Ortenau, Hague-nau/Karlsruhe/Rastatt/Landau/Wissembourg, Sélestat/Freiburg/Emmendingen and Haut-Rhin/Freiburg/Lörrach (Deutsch-Französisch-Schweizerische Oberrheinkonfer-enz 2013a: 2, 4, 6; Grand Est Emploi; Trinationale Metropolregion Oberrhein Ausbild-ung).

IAB-Discussion Paper 2/2018 13
An interesting feature of the French-German Upper Rhine cooperation is the previ-ously mentioned possibility of inscribing into a cross-border dual vocational training program or a cross-border dual course of study, apart from completing the entire pro-gram abroad. In 2013, a framework was established that allows apprentices or stu-dents to complete the company-based part of their education abroad and the school- or university-based part in their home country, where they also obtain their aspired degree.2 For participants in the dual vocational training program, it is also an option to obtain the respective degree in both countries (EURES-T Oberrhein 2016: 4; EURES-T Oberrhein Informationen). Moreover, some vocational education institu-tions on both sides now offer an “Azubi-BacPro” qualification, which adds language classes and experiences in a company across the border to the regular curriculum (Erklärung Metz 2015: 4; Ministerium für Kultus, Jugend und Sport Baden-Württem-berg 2015). 206 young Alsatians were registered in the Azubi-BacPro program in 2016/2017 (Rectorat de l’académie de Strasbourg Chiffres: 32). The Euregio certifi-cate, an initiative brought forward by the Conference of the Upper Rhine, aims at giving apprentices and other participants of vocational training programs the oppor-tunity to spend at least four weeks in an internship across the border in order to collect work experience in the neighboring country; it was awarded to 382 apprentices in 2016. At the same time, vocational educators can obtain intercultural training under this framework (BAK Basel Economics 2008: 47; Erklärung Hambach 2017: 8; Trina-tionale Metropolregion Oberrhein Ausbildung).
Other common cross-border measures in the realm of education include the ABIBAC, for example, a secondary graduation certificate that is recognized as school leaving certificate both in France and Germany. In Alsace as well as in Baden efforts were made to increase bilingual education from an early age and to establish programs that qualify teachers to give classes in both languages (BAK Basel Economics 2008: 48-50). At university level, a key role in trinational academic cooperation is assumed by EUCOR, an association promoting exchange stays, common research projects and programs of study. In addition, agreements between universities and similar institu-tions have led to the establishment of further cross-border courses of study (BAK Ba-sel Economics 2008: 45-47; Deutsch-Französisch-Schweizerische Oberrheinkonfer-enz 2013a: 23-29).
Plenty of other initiatives regarding exchanges between schools, dual degrees, voca-tional education and continuing education as well as linguistic proficiency can also be observed. Exchanges between employers and political or administrative actors in the field of employment occur in a variety of formats (Deutsch-Französisch-Schweizer-ische Oberrheinkonferenz 2013a). INFOBEST, a network of four information centers throughout the Upper Rhine Region, has served as a first point of contact for ques-
2 The agreement can be found under the reference Deutsch-Französisch-Schweizerische
Oberrheinkonferenz 2013b.
IAB-Discussion Paper 2/2018 14
tions on life and work in the border region and has assisted in identifying and contact-ing administrative authorities for more than 20 years (Infobest Infobest). TransInfoNet on the other hand offers consulting for builders and trade contractors operating on multiple sides of the border on issues such as regulations on providing services in another country (Réseau Transfrontalier d’Information Netzwerk). Moreover, initia-tives like the Alliance for Skilled Workers in the southern Upper Rhine Region resort to inter-country cooperation to address demographic developments with potentially disadvantageous effects for the labor market (FachkräfteAllianz Südlicher Oberrhein FachkräfteAllianz).
In terms of financing cross-border initiatives, a milestone that is still shaping inter-country cooperation today was the creation of the European Union’s INTERREG pro-gram in 1989, which promotes cross-border cooperation by providing funding from the European Regional Development Fund for transnational projects. For the 2014-2020 period, about 110 million euro have been allocated under INTERREG V to the Franco-German-Swiss border region surrounding the Upper Rhine (INTERREG Oberrhein INTERREG; Vierzehn; Zoller Schepers 1998: 31, 72). Regional political authorities in the three neighboring countries govern the implementation of the pro-gram in the area and have delegated operational responsibilities to several groups and institutions (INTERREG Oberrhein Organisation). To name an example, the To-wards a 360° Labor Market project’s 1.7 million euro budget is 50 percent co-financed by INTERREG (Maison d’Emploi Strasbourg 360°). Another project currently receiv-ing financial means from this program is Success without Borders (Réussir sans fron-tière/Erfolg ohne Grenzen), an initiative to advance the integrated cross-border labor market via coordination and promotion of vocational education. On its website, infor-mation on various issues such as cross-border internships, employment, public trans-portation etc. is provided, both for applicants as well as for companies (Grand Est Réussir; INTERREG Oberrhein Erfolg). New projects funded by INTERREG V were agreed on in December 2016, for instance, including an alliance for skilled workers in the PAMINA region focusing on integrating especially more senior jobseekers into the labor markets on both sides of the border and assisting companies in finding appli-cants (INTERREG Oberrhein Vierzehn).
3 Labor Markets and Vocational Education in Alsace and Baden
With these cooperation mechanisms promoting an integrated cross-border labor mar-ket in mind, an analysis of employment and vocational education with a particular focus on labor market shortages in both countries shall constitute the first data-based part of the project, aimed at determining to which extent the regions complement each other and offer potential for further interrelations.
3.1 Characteristics of Employment in the Border Regions When examining the German labor market in the previously defined border region of Baden, the statistical data provided by the German Federal Employment Agency (BA,

IAB-Discussion Paper 2/2018 15
short for Bundesagentur für Arbeit) offer a broad source for assessing the situation of employment and vocational education in different occupations. Data for the corre-sponding area of Alsace in France are mostly provided by INSEE, the national institute for statistics, and Pôle emploi (PE), the main employment agency in France.
To begin with, the current state of employment in Alsace and Baden are to be briefly discussed. In terms of structure and selection of indicators, this section strongly draws on the analysis of Pilger, Meindl & Hamann (2011). Since the purpose of the underly-ing study is to provide an overview rather than being the main focus of the paper, only selected indicators are taken into account. The comparisons between the two coun-tries are based on employees subject to mandatory social security contributions, i.e. sozialversicherungspflichtige Beschäftigte in Germany and salariés in France (Pilger, Meindl, Hamann 2011: 13). Contingent on the mode of publication of census data by INSEE, indicators will be discussed for the year 2014 in comparison to the year 2009 to include an impression of temporal developments (INSEE 2017n; 2017o).
A first feature that can be examined for both regions is the presence of women in the local labor market. According to the BA employment and population statistics, women accounted for 49.61 percent of the 15-64 year-old population in the region of Baden in 2014, whereas a slightly lower percentage of all employees of this age were female, namely 46.85 percent. Although the percentage of women in the population dropped by 0.1 percentage points compared to 2009, their representation among employees subject to mandatory social security contribution increased by 0.67 percentage points between 2009 and 2014. At the same time, the share of women in the corresponding Alsatian départements’ 15-64 year-old population increased from 50.09 percent in 2009 to 50.29 percent in 2014, with 48.91 percent of the employees in the region being female (as opposed to 48.22 percent in 2009) (INSEE 2012a,c; 2017a,c; 2012e,f; 2017h,i). Looking further at the share of women in this age group working part-time as presented in figure 2, similar differences between Alsace and Baden can be detected.

IAB-Discussion Paper 2/2018 16
Figure 2 Evolution of Part-Time Employment by Sex
Source: BA employment statistics & INSEE 2012a,c, 2017a,c; own depiction
In the Bas-Rhin and Haut-Rhin départements, 28.5 percent and 34.4 percent of women worked part-time in 2014 as opposed to 6.4 percent and 6.2 percent of men, respectively. Compared to 2009, a slight decrease in the share of women working part-time and a slight increase in the corresponding fraction of men between 15 and 64 years could be observed (INSEE 2012a,c; 2017a,c). Across the border, however, the opposite development took place, with the percentage of women working part-time increasing from 37.42 percent in 2009 to 46.76 percent. Starting from a signifi-cantly lower level, the share of men in part-time employment also increased, namely by 1.99 percentage points to 8.09 percent. These findings are somewhat in line with the 2011 research paper of Angela Luci who pointed out that a higher share of women worked part-time or in a marginal employment position in Germany than in France and that family and professional career could be better combined in the French sys-tem than in the neighboring country.
In order to obtain a more comprehensive impression of the local labor markets, the age structure of the population currently employed in a position subject to mandatory social security contributions can be examined. In 2009, 11.33 percent of the Alsatian employees were older than 14 and younger than 25 years, while the share of workers of 50 years and older amounted to 22.60 percent. Five years later, the share of young employees had dropped slightly by 1.28 percentage points, whereas an additional 4.54 percentage points now formed part of the 50 years and older age group (INSEE 2012b,d; 2017b,d). A similar trend can be observed across the border, with the share of young employees decreasing by 0.84 percentage points to 11.88 percent in 2014, for example. Moreover, workers of 50 years and older constituted a percentage of 25.94 percent in 2009 already and increased to 31.29 percent in 2014, following the current demographic trends (see figure 3). It has to be noted, however, that the retire-ment age is lower in France than in Germany (Pilger, Meindl, Hamann 2011: 20).
0%
10%
20%
30%
40%
50%
Men Women Men Women
Alsace Baden
Evolution of Part-Time Employment by Sex
2009 2014

IAB-Discussion Paper 2/2018 17
Figure 3 Evolution of the Share of Young and Senior Employees
Source: BA employment statistics & INSEE 2012b,d, 2017b,d; own depiction
In this context, it should also be mentioned that the 2015 birth rate defined as live births in relation to the total regional population amounted to 11.2 per mill and 11.3 per mill in the two Alsatian départements, whereas the Baden Landkreise for the most part exhibited rates of about 8 per mill or 9 per mill, indicating a faster demographic change on the German side of the border and the accompanying effects for the labor markets unless mitigated by immigration (INSEE 2016; 2017k; Pilger, Meindl, Hamann 2011: 20-21; Statistisches Landesamt Baden-Württemberg Geburtenrate; Regionaldaten).
Due to the profoundly different educational systems in France and Germany, a direct comparison between the levels of education of the respective population proves to be difficult to conduct. In Alsace, with regard to the total population of 15 years and older not currently in schooling, the number of residents with no degree or a very low one decreased in both départements by 3.9 and 3.7 percentage points to 27.1 percent and 29.5 percent in 2014, respectively. A minor increase could also be detected for the share of graduates holding a CAP or BEP, the first or basic vocational degrees, to 29.1 percent and 30.8 percent. At the same time, a larger percentage of individuals had passed an academically or vocationally oriented Baccalauréat (roughly compa-rable to a high school diploma or A-levels) or a higher educational degree (INSEE 2017e,f). Across the border – the numbers now referring to all types of employment to improve comparability – 16.01 percent did not hold a vocational degree at all, 55.44 percent had completed a vocational education and 16.09 percent an academic degree or an advanced professional degree in 2014. The share of highly qualified residents was thus higher in the Alsatian départements; on the other hand, the region of Baden could build on a large number of employees having obtained a vocational diploma.
0%
5%
10%
15%
20%
25%
30%
35%
15-24-year-olds 50-year-olds and older 15-24-year-olds 50-year-olds and older
Alsace Baden
Evolution of the Share of Young and Senior Employees
2009 2014
IAB-Discussion Paper 2/2018 18
Since one purpose of this paper is to determine if and how the labor markets on both sides of the border complement one another, directing attention to the sectoral struc-ture of employment constitutes the next step. Once again, for reasons of comparabil-ity, the data are limited to employees subject to mandatory social security contribu-tions; moreover, due to data availability, employment is now considered at the place of work instead of the place of residence. The French data refer to employment at the end of the year and the classifications used in this case are NAF (rév.2) and WZ 2008, respectively. Both the 2009 and the 2014 data for Alsace confirm the result at which Pilger, Meindl & Hamann (2011: 25-27) arrived in their analysis of the Strasbourg region: the tertiary sector, including profit-oriented and public services, accounted for the largest share of the region’s employment, 73.37 percent and 74.99 percent in 2009 and 2014, respectively. Whereas the importance of this sector increased slightly in the 5-year period in question, the share of the secondary sector, industry and con-struction, fell by 1.66 percentage points. Employment in agriculture in the area in-creased, but with the percentage still being lower than 1 percent continued to assume a marginal role (INSEE 2017g). In contrast, although accounting for the largest share of employment (64.47 percent and 66.53 percent, respectively), the tertiary sector in Baden did not present as dominant as in the neighboring region. While the agricultural primary sector also merely constituted a lower than 1 percent share of total employ-ment, industry and construction employed a share of 33.06 percent in 2014. Compar-ing the 2014 data to five years before (see figure 4), it can be noted that the im-portance of service provision increased as indicated above and role of the secondary sector in employment was reduced by 2.11 percentage points, continuing the struc-tural change in the region (Frank, Grimm 2010: 13; Pilger, Meindl, Hamann 2011: 25-27).

IAB-Discussion Paper 2/2018 19
Figure 4 Evolution of the Sectoral Structure of Employment
Source: BA employment statistics & INSEE 2017g; own depiction
Another angle allowing to assess the structure of the labor market consists of exam-ining the professions exercised by the individuals employed in the cross-border re-gion. As pointed out by Pilger, Meindl & Hamann (2011: 27-28), direct comparisons prove to be rather difficult due to the differences in the nomenclature used to catego-rize professions. Therefore, this section offers a rather rough comparison aimed at providing a general overview of the labor market situation from this perspective. More-over, Alsatian data are available for the active employed population; correspondingly, all types of employment are now considered in the BA statistics as well in order to create the greatest possible comparability. Once again, the place of work rather than the place of residence is considered.
The majority of the active Alsatian population in 2014 were employees (27.65 per-cent), closely followed by technicians and associate professionals (intermediate level) (26.39 percent) and workers (24.29 percent). Looking at a more detailed level of the nomenclature3 that categorizes the professions into 29 different classes, intermediate level administrative and business professionals in the private sector as well as civilian employees and officials of the public sector were represented with the highest share of the active population, followed by staff providing individual services, employees in company administrations and intermediate level healthcare and social services pro-fessionals (INSEE 2017l,m). This shows some change compared to the situation in 2009, when a slightly higher share of the active population were workers instead of intermediate level professionals. The top five vocations were largely the same, except that intermediate level healthcare and social services professionals then only ranked
3 INSEE uses the « nomenclature des Professions et Catégories Socioprofessionnelles
(PCS-2003) » ; a detailed overview can be found at https://www.insee.fr/fr/infor-mation/2400059
0%10%20%30%40%50%60%70%80%90%
100%
2009 2014 2009 2014
Alsace Baden
Evolution of the Sectoral Structure of Employment
Primary Sector Secondary Sector Tertiary Sector

IAB-Discussion Paper 2/2018 20
eighth, whereas unskilled industrial workers stood at fourth position (in 2014, this group of occupations ranked sixth). The most significant decreases could correspond-ingly be observed for unskilled industrial workers, followed by religious professionals and skilled industrial workers (INSEE 2012g,h). This development underlines the prevalence of the tertiary sector in the two départements mentioned before.
Across the river Rhine, the comparison of the two selected years faces some difficul-ties since the classification of professions was changed in 2010/2011. Nevertheless, even though the nomenclatures differ, a general impression can still be obtained. For 2009, the 1988 classification provides some insights into the structure of the Baden labor market. By far the largest share was employed in service-related professions (65.83 percent), followed by manufacturing occupations (24.79 percent). Among the category of service providers, most employees worked in an administration or an of-fice. More insights and thus more telling comparisons with Alsace are possible for the second year of this analysis. Using the 2010 classification, most individuals were em-ployed in professions related to production, manufacturing and extraction of raw ma-terials (2)4 (21.61 percent), followed by administrative jobs in a company (7) (18.48 percent), transportation and security (5) (15.67 percent), commercial and sales voca-tions (6) (15.22 percent) and healthcare/education/social occupations (8) (14.99 per-cent). Summarizing the level of expertise, it can be stated that in 2014, the majority of individuals employed in Baden were skilled workers (55.92 percent), followed by un-skilled labor (21.75 percent). From these observations, it could be concluded analo-gously to previously mentioned results that service-related professions also assumed an important role in Baden, but that occupations in manufacturing continued to be very relevant as well (Pilger, Meindl, Hamann 2011: 28-29).
3.2 Shortage Situations in the French-German Upper Rhine Re-gion
Whereas some characteristics of and differences between the Alsatian and Baden labor markets have already been touched upon in the previous section, a deeper per-spective will be developed on the following pages by means of an occupation-based analysis of regional shortages, allowing to approach the question of how the labor markets in Alsace and Baden can complement each other in the context of cross-border mobility.
3.2.1 Bottleneck Analysis of the Baden Labor Market In a first step, professions in which the Baden region exhibits a shortage of labor – which could potentially be alleviated by French commuters – will be identified, includ-ing their evolution over recent years.
4 The number in brackets indicates the corresponding section of the German Classification
of Occupations 2010 (Klassifikation der Berufe (KldB 2010))

IAB-Discussion Paper 2/2018 21
The bottleneck analysis will be conducted in accordance with the procedure used by the BA statistics department (Hartmann, Reimer 2011; Simon 2013; Statistik der BA 2017b; Statistik der BA Visualisierung). As stated before, its purpose is the identifica-tion of professions or groups of professions for which the demand for labor exceeds its supply, i.e. for which employers encounter difficulties in hiring sufficient labor in a timely manner (Hartmann, Reimer 2011: 5-6). In order to assess whether employers are facing a shortage in a certain profession, a number of different indicators can be considered, a selection of which will be presented in the following. Since each of these items comes with some restrictions to its explanatory power, relying on several indi-cators increases the likelihood of correctly assessing the situation (Statistik der BA 2017b: 21).
The data used for this analysis is drawn from the BA unemployment statistics as well as the statistics of vacancies registered with the institution. It should be noted at this point that the former statistics include data of individuals registered with the local in-stitutions associated with the BA (the integration of which can lead to distortions), whereas the latter do not (see Statistik der BA 2017a: 3). A loss of information can be expected since only positions subject to mandatory social security contributions are included in the analysis, thus ignoring self-employment, civil servants and marginal employment, for example. Moreover, it has to be kept in mind that the job vacancies reported to the BA constitute but a share of the total vacancies in the region (Hart-mann, Reimer 2011: 7-8). On average, about one in two vacancies in Germany is reported to the BA, and one in four or five for university graduates; this figure varies over the different professions, of course (Statistik der BA 2017b: 24).
With regard to categorizing professions, the German Classification of Occupations 2010 (Klassifikation der Berufe (KldB 2010)) will be applied.5 Introduced in 2011, which thus also constitutes the starting point for the observation period in this section, it provides a more up-to-date characterization of the professional variety in the mod-ern labor market. Each profession is allocated a five digit number, of which the first four digits hierarchically describe the kind of knowledge and skills related to the occu-pation and the final digit offers an indicator for the level of complexity of the associated tasks, ranging from unskilled/semi-skilled tasks over skilled to complex and highly complex tasks and linked to the typically required training or education (Paulus, Mat-thes 2013: 7-8, 10; Statistik der BA Visualisierung: 11-12). Given the size of the re-gional labor market in question, professions will partly only be considered at the sec-ond level of differentiation (Hartmann, Reimer 2011: 33). At this level, the occupations are categorized into 37 two-digit main groups, providing a general assessment of the task but without a detailed specification of the profession (Statistik der BA Visualisier-ung: 11). This way, a minimum number of 60 cases is ensured both for the annual average stock of registered job vacancies and the annual sum of deregistered vacan-cies for a profession, as recommended with regard to stability and relevance of the
5 The English translations are drawn from Statistik der BA (2015b).

IAB-Discussion Paper 2/2018 22
results (Statistik der BA 2017b: 21). Where possible with regard to the stability and relevance thresholds, however, the analysis will be conducted using the 144 three-digit KldB occupational groups (Paulus, Matthes 2013: 7).
Average Completed Vacancy Periods A first impression can be obtained by examining the average completed vacancy pe-riods of reported employment vacancies, i.e. the average time between the date at which the company intends to fill the position and the date at which the company deregisters the job offer with the BA. As opposed to a mere consideration of the num-ber of vacancies registered in a period of time or the total time during which a job offer remains with the institution, this figure best captures a shortage situation, provided that vacancies are deregistered quickly after having been filled. Since a certain de-gree of friction can be expected in filling open positions, only those professions will be characterized as bottlenecks whose average completed vacancy periods exceed the regular time span significantly, i.e. surpass the average of all professions by at least 40 percent. Moreover, in absolute terms, it will be checked whether the vacancy period increased by at least ten days compared to the previous year (Hartmann, Reimer 2011: 5-6, 11, 15; Statistik der BA 2017b: 22). In terms of the reference value, the geographical scope will be the Baden region.
To begin with, a glance on the reference category of all professions reveals that de-spite some oscillations, the average completed vacancy periods increased over the past six years, from an average of 72 days in 2011 to 102 days in 2016, or 71 to 94 days in the whole of Baden-Wuerttemberg. Applying the 40 percent and the 10 days criterion, professions in which companies have found it challenging to recruit staff can be identified for the region of Baden. It should be noted first that in 2016 a large amount of professions saw an increase of more than 10 days in their average com-pleted vacancy periods, which can partly be interpreted as a “normal” result of a pos-itive economic development in the region in general (Statistik der BA 2017a: 2); on the other hand, the high reference values caused by professions in the healthcare sector as shown below, for example, may result in some occupations not being cate-gorized as bottleneck professions albeit being subject to long average completed va-cancy values in absolute terms (Hartmann, Reimer 2011: 17).
Table 3 in the appendix shows detailed values for the occupational groups. At first glance, the presence of occupations belonging to the main groups medical and health care occupations (81) and occupations in non-medical healthcare, body care, well-ness and medical technicians (82) among the professions with the highest values is noticeable. A number of these vocations exhibited particularly high vacancy periods in the past years, among them technical occupations in medicine, orthopaedic and rehabilitation (825), professions in nursing, emergency medical care and obstetrics (813), in geriatric care (821) and in body care (823). Although different developments took place for the particular subgroups, the group’s vacancy periods mostly (noticea-bly) exceeded the average by 140 percent since 2011; for example, in 2016, the av-erage completed vacancy period in body care amounted to 165 days, in nursing to
IAB-Discussion Paper 2/2018 23
178 days. Looking at the increases in vacancy periods in absolute terms, in all years of the observation period, at least one and most often several health and body care related occupations surpassed the ten days threshold. In recent years, occupations in non-medical therapy and alternative medicine (817) also saw what appears to be an increasing bottleneck.
Rather constant values of noticeably high vacancy periods can also be observed for some occupations in building services engineering and technical building services (34), in particular for occupations in plumbing, sanitation, heating, ventilating and air conditioning (342). Especially since 2014, floor layers (331)6 also appeared to be dif-ficult to recruit, the process taking 181 days on average. Both (342) and (331) ex-ceeded the 40 percent threshold in five out of six years. Moreover, in recent years, vacancy periods were found to be above average e.g. for occupations in building con-structions (321), although not surpassing the 40 percent threshold. Further profes-sions with mostly persistent shortages – judging from the vacancy periods – include ICT related occupations such as computer science (431) and in particular software development and programming (434). In 2016, the relevant threshold is for the first time not hit anymore by the latter (the former only surpassing it in 2015) due to a decrease in their vacancy periods, but they continued to exhibit above average va-cancy periods of 119 and 116 days, respectively.
Some occupations falling in the main groups of metal-making and -working and metal construction (24) and of machine-building and the automotive industry (25) exhibited above average vacancy periods or increases in certain years. Occupations in mech-atronics, automation and control technology (261), energy technologies (262) and electrical engineering (263) witnessed absolute vacancy period increases that ex-ceeded 10 days significantly in 2011 and 2016, for example, and above average com-pleted vacancy periods throughout the observation period.
Moreover, especially in 2016, average completed vacancy periods increased rather strongly for different sales occupations (621 and 622) and especially for occupations selling foodstuffs (623), the latters’ indicator amounting to 138 days in that year, which could point towards an evolving shortage. Apart from that, above average completed vacancy periods can be observed for gastronomy (633), insurance and financial ser-vices professionals (721) and occupations in physical security, personal protection, fire protection and workplace safety (531) in most or all years. With regard to tax con-sultancy (723), average vacancy periods became increasingly prolonged in the past years.
In comparison, the shortest average completed vacancy periods in 2016 occurred in occupations in human resources management and personnel services (715) with 52
6 The (331) occupations fall below the threshold of an average stock of 60 registered vacan-
cies per year in 2014 (only 58 registered vacancies).

IAB-Discussion Paper 2/2018 24
days, public administration (732) with 60 days as well as warehousing and logistics, postal and other delivery services and cargo handling (513) with 62 days. Search periods also seemed to be relatively low for professionals working in hotels (632), for example.
Unemployment Turning to the unrealized labor supply (Hartmann, Reimer 2011: 26; Pilger, Meindl, Hamann 2011: 29-32), indicators are computed based on the unemployment statis-tics. At this point, it has to be noted that the actual amount of people looking for em-ployment is larger than the number of unemployed, for example due to the hidden reserve. Unrealized labor supply can for the purpose of this analysis nevertheless be measured by the stock of registered unemployed, with the occupational categorization describing the profession the individual would like to exercise (not the profession he or she used to work in before unemployment) (Hartmann, Reimer 2011: 10, 26; Statis-tik der BA Visualisierung: 12).
In general, unemployment rates have decreased over the past years (see figure 5). The trend in the Baden region is similar to the whole of Baden-Wuerttemberg: in 2011, average annual unemployment rates amounted to 4.01 percent in Baden (compared to 4.05 percent in Baden-Wuerttemberg). Unemployment rates are calculated as the number of unemployed over the civilian labor force (Pilger, Meindl, Hamann 2011: 32; Statistik der BA Arbeitslosenquoten). Except for a slight increase in 2013, the unem-ployment rate continued to fall until it reached 3.74 percent in 2016, the lowest value in the observation period. In the state of Baden-Wuerttemberg in total, a very similar trend resulted in a 2016 level of 3.78 percent unemployment.
Figure 5 Evolution of Unemployment Rates in Baden and Baden-Wuerttemberg
Source: BA labor market and employment statistics; own depiction
A closer look at the data from the BA unemployment statistics reveals the age struc-ture of the affected individuals in the Baden region. In 2016, young people of age 24
3,50%
3,60%
3,70%
3,80%
3,90%
4,00%
4,10%
2011 2012 2013 2014 2015 2016
Evolution of Unemployment Rates in Baden and Baden-Wuerttemberg
Baden Baden-Wuerttemberg

IAB-Discussion Paper 2/2018 25
or younger accounted for 8.68 percent of the total number of unemployed, which cor-responds to a lower than average unemployment rate of 2.71 percent. Throughout the observation period, their share saw some oscillations within a range of 0.40 per-centage points. A somewhat larger change in terms of the age structure of the unem-ployed took place with regard to individuals of age 50 and older. At the beginning of the observation period, they constituted a share of 33.09 percent, whereas in 2016, 34.95 percent of the unemployed counted 50 years or more.
Another interesting characteristic of a region’s unemployment figures is certainly the share of long-term unemployed (one year and longer) with regard to the total number of unemployed. Since the beginning of the observation period, this ratio has been lower for Baden than for Baden-Wuerttemberg as a whole, with 29.77 percent versus 32.25 percent in 2011, respectively. After some relatively small oscillations over the years, 29.07 percent of Baden’s unemployed in 2016 could be characterized as long-term unemployed compared to 30.47 percent in Baden-Wuerttemberg. Examining once again the occupational main groups for this feature, the highest shares of long-term unemployed can be found in occupations in building services engineering and technical building services (34), occupations in agriculture, forestry and farming (11), drivers and operators of vehicles and transport equipment (52) and sales occupations in retail trade (62). Numerous other occupations previously examined saw approxi-mately average or lower shares of long-term unemployed, among them industrial pro-fessions (24, 25 and 26), construction (32 and 33), ICT (43), finance and accounting (72) and healthcare (82 as well as 81, the latter showing a share of merely 16.80 percent in 2016). A low percentage of unemployed that have been in this state for a year or longer could potentially indicate a shortage of workers in this field, which would match conclusions drawn above with regard to healthcare professions, for example.
Ratio of Unemployed per Vacancy Unrealized labor supply and unrealized labor demand measured by inflow and stock of registered vacancies can be compared in order to assess the existence of short-ages for different professions. There are, however, some limitations to this approach: as mentioned before, only a part of the job vacancies and the jobseekers is registered with the BA, with especially the former varying between the professions. Moreover, the date at which the employer would like to hire and the date from which jobseekers are available might differ. It is also not taken into account that the stock of vacancies changes constantly and rather has to be perceived as a process; professional flexibil-ity is also neglected in this context (Hartmann, Reimer 2011: 26-29; Statistik der BA Visualisierung: 7).
The ratio used for this comparison is computed as the average stock of unemployed per year over the average stock of registered vacancies subject to mandatory social security contributions (Pilger, Meindl, Hamann 2011: 33; Statistik der BA Visualisier-ung: 9). If conducted for the different professions and after sorting out those profes-sions that cannot be analyzed in a reliable manner due to average vacancy stocks of lower than 60, the following indications for shortages can be observed:

IAB-Discussion Paper 2/2018 26
Table 4 in the appendix depicts the ratios of unemployed per 100 vacancies for the different occupations. What strikes the eye immediately is the persistence of occupa-tions in mechatronics, automation and control technology (261) in the top positions throughout the entire observation period, directly followed in almost all years by tech-nical occupations in energy technologies (262). To provide an example of the high degree of shortage of labor that this indicator suggests, the cited professions showed ratios of 34 and 40 unemployed per 100 vacancies in 2016, respectively. Other indus-trial professions also displayed noteworthy shortages according to this ratio. Both oc-cupations in metal construction and welding (244) as well as in precision mechanics and toolmaking (245) presented with a maximum of 162 unemployed per 100 regis-tered vacancies in recent years; moreover, technical professions in the automotive, aeronautic, aerospace and ship building industries (252) were almost constantly found among the vocations with the most severe ratios, with only 83 unemployed seeking this kind of job available for every 100 vacancies. Occupations in technical research and development, construction, and production planning and scheduling, in particular draftspersons, technical designers, and model makers (272) were also sub-ject to unemployed-vacancy-ratios of less than 3:1 (Statistik der BA Visualisierung: 4). In addition, occupations in color coating and varnishing (222) can be found among the professions with the lowest values for almost all years, with less than 100 unem-ployed individuals per 100 vacancies in five out of six years examined.
Moving on to professions in the field of healthcare, shortages are suggested also by the unemployed-per-vacancy indicator. Technical occupations in medicine, orthope-dic and rehabilitation (825), for example, counted only 72 unemployed for every 100 vacancies in 2016 and have been constantly low over the entire observation period. Especially in 2015 and 2016, occupations in geriatric care (821) and body care (823) also displayed very low results potentially indicating a tense situation from the em-ployers’ perspective, although the ratio increased slightly in 2016 (including for 825). In a similar way, professions in nursing, emergency medical services and obstetrics (813) exhibited very low and falling ratios (52:100 in 2016). With regard to occupations in non-medical therapy and alternative medicine (817), 84 unemployed individuals were available for 100 vacancies in 2016, as compared to 226 in 2011. Ratios for doctors’ receptionists and assistants (811) were also dropping over the course of the observation period to 94:100 in 2016.
Occupations in construction scheduling, architecture and surveying (311) experi-enced a similar development, with rates dropping to an average 84 unemployed per 100 job offers in 2016. Professions related to building construction above and below ground (32) presented potential shortages in recent years, as did several occupations in interior construction (33), among them floor layers (331), for example. Extremely low ratios could be observed for occupations in plumbing, sanitation, heating, venti-lating, and air conditioning (342) and to a lesser extent for occupations in building services and waste disposal (343) over the entire observation period. Persistently low ratios were also a characteristic for occupations in software development and pro-gramming (434) and especially for occupations in computer science (431) with 89

IAB-Discussion Paper 2/2018 27
unemployed per 100 vacant positions in 2016. To some extent, drivers and operators of construction and transportation vehicles and equipment (525) could also be added to the list with a ratio of 166:100 in 2016. In addition, for sales occupations (retail) selling foodstuffs (623), the ratio was below 1:1 in 2016. A more tense relationship of about 1:1 or below could also be recently observed for occupations in public admin-istration (732) and in particular for tax consultancy (723) over the last years.
In general terms, it might also be worth noting that a very large number of the exam-ined professions showed an unemployed-per-vacancy ratio of lower than 3:1, hinting at a generally rather low supply of unrealized labor when compared to the demand in the regional economy.
In line with the criteria applied by the BA, a shortage occurs if less than 200 unem-ployed individuals are available for 100 jobs including skilled and complex tasks, or less than 400 for 100 jobs demanding highly complex activities (Statistik der BA 2017b: 22). In addition to the previous analysis, this method is also to be briefly ap-plied for some of the professions examined above; it has to be kept in mind that case numbers will drop below the threshold more often especially for the level of the three-digit occupational groups when this further categorization according to the fifth digit of the KldB is introduced. Analyzing ratios for highly complex tasks is therefore often not possible.
In 2016, for example, the occupations in plastic-making and -processing and wood-working and -processing (22) main group’s ratio for skilled and complex tasks fell short of the 2:1 threshold with only 79 unemployed individuals available for 100 vacant po-sitions; a similar situation could be observed for the immediate subgroups. For all occupations in metal-making and -working and in metal construction (24), technical occupations in machine-building and automotive industry (25) and occupations in mechatronics, energy electronics and electrical engineering (26) groups, the 2:1 mark was undercut, most prominently but not exceptionally by the occupations in mecha-tronics, energy electronics and electrical engineering (261) group’s 30 or the technical occupations in energy technologies (262) group’s 34 unemployed for 100 jobs involv-ing skilled or complex tasks. This main group’s ratio for highly complex professions amounted to 96 per 100 positions, significantly below the threshold of 400. Critical values were also hit for draftspersons, technical designers and model makers (272), occupations in the production of foodstuffs, confectionary and tobacco products (292) and cooking occupations (293) with regard to skilled and complex tasks, for instance. On average, 80 experts were available for every 100 positions in occupations in con-struction scheduling and supervision and architecture (311), only 39 workers who could conduct skilled and complex tasks in professions in plumbing, sanitation, heat-ing, ventilating and air conditioning (342). In the field of ICT, both skilled workers/spe-cialists and experts fell below the threshold. 19 unemployed geriatric care profession-als (821) would on average have been available for 100 open positions with skilled or complex tasks, or 33 professionals in nursing, emergency medical services and ob-stetrics (813) respectively.

IAB-Discussion Paper 2/2018 28
Concluding the analysis of this indicator, the contrary extremes can be cited as a point of reference. Despite a major decrease in the past years, occupations in cleaning services (541) exhibited the highest ratios of unemployed to vacancies (1,528:100 in 2016). Other professions with high values for this indicator included office clerks and secretaries (714) as well as warehousing and logistics, postal and other delivery ser-vices and cargo handling (513), for instance.
Unemployment Rates per Occupation In addition, unemployment rates can be computed for the different professions. In this context, a bottleneck profession would be characterized by a rate of 3 percent and lower (Statistik der BA 2017b: 22). Contrary to the customary procedure, unemploy-ment rates for the respective professions are computed over the number of individuals with an employment subject to mandatory social security contributions (without ap-prentices) plus the number of unemployed in June every year, since the usual refer-ence value (“Erwerbstätige”) cannot be categorized by profession (Hartman, Reimer 2011: 26, 31). These data are, however, only available since June 2013; in addition, this technique can lead to distortions between the professions and is rather recom-mended for larger geographical areas (Hartmann, Reimer 2011: 31).
As can be concluded from table 5 in the appendix, with regard to production and man-ufacturing, several professions exhibited unemployment rates lower than the 3 per-cent threshold. Occupations in precision mechanics and toolmaking (245), technical occupations in energy technologies (262), draftspersons, technical designers and model makers (272) and technical occupations in production planning and scheduling (273) undercut the critical value every year of the 2013-2016 observation period, while occupations in mechatronics, energy electronics and electrical engineering (261) and occupations in machine-building and –operating (251) fell below the threshold in the past three or two years. Very low unemployment rates throughout the entire observa-tion period could also be observed for occupations in business organization and strat-egy (713), occupations in insurance and financial services (721) and in tax consul-tancy (723) as well as in occupations in public administration (732), which were con-stantly found among the five professions with the lowest values for this indicator.
Occupations in construction scheduling and supervision and architecture (311) con-tinuously displayed values of less than 3 percent, as did professions in plumbing, sanitation, heating, ventilating and air conditioning (342) and, since 2014, sales occu-pations (retail trade) selling clothing, electronic devices, furniture, motor vehicles and other durables (622). Both ICT related professions examined in this context show lowed unemployment rates for all four years. In terms of health care, the previous impression of an existing shortage is supported by the unemployment quotes for these professions: doctor’s receptionists and assistants (811) showed low unemployment quotes for all years, occupations in nursing, emergency medical services and obstet-rics (813) as low as 0.96 percent in 2016, as well as occupations in non-medical ther-apy and alternative medicine (817) for the last two years. For the main group of pro-fessions in non-medical healthcare and body care (82), only technical occupations in

IAB-Discussion Paper 2/2018 29
medicine, orthopaedic and rehabilitation (825) exhibited unemployment rates of less than 3 percent, yet they do so for all years.
Changing the focus, it is worth mentioning some comparably high profession-specific unemployment rates in 2016. For example, the previously identified potential shortage for professions in body care (823) is to some degree contradicted by an unemploy-ment rate of 7.82 percent, i.e. well above the regional average. Gastronomy occupa-tions (633) and occupations in hotels (632) showed rates of 6.80 percent and 11.08 percent and drivers and operators of construction and transportation vehicles and equipment (525) exhibitws an unemployment rate as high as 14.98 percent. Occupa-tions like painters, varnishers, etc. (332), too, stood out with a rather high unemploy-ment rate of 10.48 percent.
Summary Based on the previously calculated indicators, it is now possible to combine the results for the different professions in order to obtain a more well-rounded impression of the shortages that exist in the Baden regional labor market. It should be kept in mind that, as mentioned before, the analysis suggested a rather tight situation in many of the professions addressed, which will not all be listed in the following brief summary.
Starting with occupations related to health and body care, numerous indicators point towards a rather pronounced bottleneck in this field. In general, the professions con-sidered in this context showed long completed vacancy periods at least in recent years as well as a low ratio of unemployed per registered open position, making it seemingly difficult for employers to recruit qualified staff.
Although presenting with above average completed vacancy periods and increases of this figure, the unemployed-per-vacancy ratios and the unemployment rates calcu-lated specifically for production- and manufacturing-related professions constitute the stronger indication that the German side of the border region might witness a shortage of labor in these occupations. Based on these figures recruiting difficulties can be assumed in this area – ranging from mechatronics over metal-working to the automo-tive industry – although the vacancy periods not always hitting the threshold could also imply that hiring is facilitated by professional mobility or that individuals that al-ready have an employment are being hired (Hartmann, Reimer 2011: 30).
In a similar fashion, the availability of labor supply for the previously defined ICT pro-fessions suggests a shortage for the region, accompanied by above average vacancy periods. Furthermore, plumbers and workers with related areas of expertise are not available in sufficient numbers given the state of demand in the labor market; other professions related to construction, such as floor layers, find themselves in the same position. The picture is not as coherent as it is with healthcare professions, for in-stance: the labor market for painters seems to be comparably relaxed from the em-ployers’ perspective.

IAB-Discussion Paper 2/2018 30
Tax consultants, on the other hand appear to be in short supply in the Baden part of the Upper Rhine Region; related professions like insurances and financial services occupations draw attention with some indicators, but are not among the most severe results detected in this analysis. A similar conclusion can be drawn for some retail sales occupations, leaving a mixed impression at this point, especially since the va-cancy periods very rarely meet the shortage criteria (Hartmann, Reimer 2011: 30).
Plenty of other indicators could potentially be calculated in the course of this bottle-neck analysis (Statistik der BA 2017b: 22). The use of ratios characterizing the inflow or the stock of reported job vacancies, for example, are, however, recommended only for larger geographical areas. The question of whether identifying labor market bot-tlenecks for this comparably small region has much explanatory power – considering that workers at least from all of Baden-Wuerttemberg could also fill the vacant posi-tions – can, of course, be raised (Hartmann, Reimer 2011: 4, 18). Yet since it is the explicit purpose of this analysis to find (potential) complementary effects with the Al-satian labor market, an isolated examination seems justified at this point.
On a final note, it is not necessarily correct to automatically interpret a shortage in a certain profession identified by this method as a shortage of skilled labor, since other reasons such as unattractive working conditions or inefficient application procedures could also generate these results (Hartmann, Reimer 2011: 4; Statistik der BA 2017b: 21). Moreover, the data examined above can indicate shortages in skilled labor, but cannot provide a complete picture by themselves and have to be handled with some caution due to the restriction explained in the previous paragraphs (Bundesregierung 2011: 3-4).
3.2.2 Bottleneck Analysis of the Alsatian Labor Market In order to compare the previously described Baden labor market with its counterpart across the river Rhine, a closer examination of bottleneck professions in Alsace is to follow at this point. Due to differing availabilities of data, the indicators and observation periods used in this context do not correspond exactly to those applied to the German labor market; instead, a method used by the French labor administration, Pôle emploi (PE), is adopted. Therefore, the professions identified as labor shortages in this sec-tion should be qualitatively compared to the results for Baden rather than trying to match the indicators quantitatively.
To start with a brief description of the data, the offers registered with PE and the jobseekers or unemployed are drawn from the STMT statistics (short for monthly labor market statistics) that are prepared by PE and Dares, the labor department’s division in charge of statistics, studies and research, based on the PE operational data. For statistical purposes, the jobseekers registered with PE are categorized into five groups (Dares, Pôle emploi 2016: 4, 11, 13):
− Category A: Jobseekers who are obliged to actively search for employment and who are not employed during the month in question

IAB-Discussion Paper 2/2018 31
− Category B: Jobseekers who are obliged to actively search for employment and who have a short-time employment for 78 hours or less during the month in ques-tion
− Category C: Jobseekers who are obliged to actively search for employment and who have a short-time employment for more than 78 hours during the month in question
− Category D: Jobseekers who are not obliged to actively search for employment and who are not employed (due to doing an internship, sickness etc.)
− Category E: Jobseekers who are not obliged to actively search for employment and who are employed (e.g. entrepreneurs).
In general, the STMT data are available in a gross manner and in a version corrected for seasonal variation and working day effects (CVS-CJO), which is provided by the respective DIRECCTE (the regional department in charge of labor) and PE on re-gional level (Dares, Pôle emploi 2016: 20-21). The classification used by PE to cate-gorize professions is called ROME; it is composed of a three-level structure, starting with letters A to N for professional families, followed by two digits indicating one of 110 professional areas and two further digits identifying 532 descriptions of profes-sions including a total of 11,000 job titles (Pôle emploi ROME).
Unemployment Starting with the jobseekers reported in Alsace (following (Dares, Pôle emploi 2016: 12-13; Pilger, Meindl, Hamann 2011: 29-32), it has to be noted that the average un-employment rate for the two départements in 2016 increased compared to the 2011 levels of 7.7 percent and 8.6 percent, respectively7 (see figure 6). In comparison with the previous year, in which the average unemployment rate reached the highest value of the observation period in Bas-Rhin (8.9 percent) and in Haut-Rhin (9.9 percent, already observed in 2013), the 2016 rates each decreased by 0.2 percentage points but still remained at a rather high level, especially when compared to the neighboring Baden region (INSEE 2017p,q). Looking at unemployment among the 15-24 year-olds, rates of 20.7 percent and 24.0 percent can be observed in 2016, indicating a comparably tense situation for this age group. With some oscillations, the unemploy-ment rate for young people has been at this high level since 2012 (INSEE 2017r,s). Whereas average unemployment among the more senior workers of 50 years and older has also increased over the years, it has always remained below departmental average, including its 2016 values of 5.8 percent and 6.9 percent (INSEE 2017t,u).
7 It should be mentioned that different definitions of unemployment are used (PE’s definition,
be it category A only or categories ABC, as well as unemployment as defined by the ILO and calculated based on an INSEE survey, according to which an unemployed individual has no employment whatsoever, has searched actively for a job in the previous month and is available for work within 2 weeks); this paper combines both sources of information (Dares, Pôle emploi 2016: 5; Dares, Pôle emploi 2017: 3; INSEE 2017v; Pilger, Meindl, Hamann 2011: 13).

IAB-Discussion Paper 2/2018 32
Figure 6 Evolution of Unemployment Rates in the Alsatian Départements
Source: INSEE 2017p,q; own depiction
The evolution of the number of jobseekers can be examined in absolute terms as well. When comparing the 2016 to the 2011 level, an increase of 29.34 percent for category A and of 34.22 percent for category ABC can be found. Although slightly lower than in the previous year, the 2016 number of 98,954 category A jobseekers in Alsace is the second highest in the observation period; for category ABC, the numbers have been increasing constantly to a highpoint of 151,263 in 2016 (DIRECCTE Grand Est 2017).
Since the PE main shortage indicator is calculated based on ABC jobseekers, this group will be focused on in the following (Statistiques, Études et Évaluations de Pôle emploi 2017a: 11). Further differentiating the ABC jobseekers according to their age group, it should first be noted that the number of workers of 50 years and older looking for employment has increased steeply over the course of the observation period, from a 2011 level of 20,849 to a 2016 level of 36,150; this corresponded to a share of 23.90 percent, about ten percentage points lower than in the neighboring region of Baden; however, as mentioned above, the unemployment rate for this age group has re-mained below average. On the other hand, the number of ABC jobseeker of age 24 or younger has oscillated over the observation period with a slightly increasing trend to a 2016 level of 21,583, i.e. a share of 14.27 percent, leading to the high unemploy-ment rates described before (DIRECCTE Grand Est 2017). The share of ABC jobseekers registered with PE for at least one year (Dares, Pôle emploi 2016: 12), i.e. the long-term unemployed, amounted to an average of 44.85 percent and 42.97 per-cent for the two départements, a noticeably higher value than in Baden. This is the highest level of the observation period and a further increase by 0.65 and 0.27 per-centage points respectively with regard to the preceding year (DIRECCTE Grand Est 2017). Moreover, in terms of the level of education, 17.96 percent of the jobseekers held no or a very low degree, 40.84 percent a first professional degree, 19.67 percent a Baccalauréat and 21.70 percent a higher diploma (Pôle emploi Demandeurs). It
0,00%
2,00%
4,00%
6,00%
8,00%
10,00%
12,00%
2011 2012 2013 2014 2015 2016
Evolution of Unemployment Rates in the Alsatian Départements
Bas-Rhin Haut-Rhin

IAB-Discussion Paper 2/2018 33
must be noted, however, that with regard to the level of education of jobseekers only gross data are available instead of seasonally corrected data.
Indicator Measuring the Difficulty of Recruiting An important source of information used by the French authorities to achieve insights into potential bottlenecks in the labor market is the so-called BMO survey (short for Besoins en Main-d’œuvre, i.e. labor demand); initiated by PE, it captures the employ-ers’ recruitment plans for the following year and asks them, among others, for an assessment of the share of these positions that they assume to be difficult to fill (Statistiques, Études et Évaluations de Pôle emploi Grand Est 2017b). The results of the latter question can be found in table 6 in the appendix (Pôle emploi Enquête). When analyzing these data, it should be mentioned that these figures are relatively volatile over the years, suggesting some caution in putting too much emphasis on the developments described in this context alone, but rather consider them as one ele-ment of the shortage analysis as a whole. Some institutions, such as state administra-tions (e.g. government departments) and certain public employers like the Bank of France, for example, are not included in the otherwise rather broad survey. As op-posed to the ROME classification applied to the administrative data collected by Pôle emploi, the classification of professions used in this survey is a different one, namely Familles Professionnelles (FAP), which evolved from adapting both INSEE’s Profes-sions et Catégories Socioprofessionnelles (PCS) and PE’S Répertoire Operationnel des Métiers et des Emplois (ROME) classification (Pôle emploi Source). FAP was developed by Dares and has been used since 2010. The classification distinguishes between four main areas (agriculture, building, manufacturing and tertiary profes-sions) and 22 professional areas. On a deeper level, 87 professional families appear which can be further categorized into 225 more detailed families (Dares 2014; Dares La nomenclature).
Taking a look at the development of the number of recruitment projects planned over the years 2013 to 2017, for which the data is currently accessible, the number of pre-dicted hirings increased for most professions in the group of construction and public works (B), with some significant increases of 268.42 percent for construction electri-cians (B4Z43)8, 69.12 percent for construction site managers (B6Z73) and 52.42 per-cent for non-qualified finishing stage construction workers (B3Z20), among others. At the same time, many occupations in this field showed above average shares of re-cruitment projects presumed difficult by the companies, but not all of these shares increased when compared to 2013; a notable example for a major increase in hiring difficulties were qualified workers for painting and similar jobs (B4Z44). Demand for qualified and non-qualified workers in the field of electrics and electronics (C1Z40 and C0Z20) grew very strongly over the observation period, as did the number of recruit-ment projects of non-qualified workers forming or removing metal (D0Z20); satisfac-tion of this demand, on the other hand, was expected to be comparatively easy. For
8 The number in the brackets refers to the FAP 2009 code of the respective profession.

IAB-Discussion Paper 2/2018 34
the remaining professions related to mechanics and metal-working (D), hiring plans increased for welders (D2Z42) and assemblers (D4Z40), the former accompanied by a rise in difficulty, but fell for boilermakers and metal technicians (D2Z40) and non-qualified metalworking occupations (D3Z20) compared to the 2013 levels. The latter, however, were assumed to create above-average difficulties. In a similar fashion, qualified workers in electric and mechanical maintenance (G0A40 and G0A41) as well as car mechanics and electronic technicians (G0B41) witnessed strong increases in terms of predicted recruitment projects over the observation period, though with only the latter becoming presumably more difficult to hire. In the field of processing indus-tries (E) recruitment plans went up for several professions, e.g. by 83.95 percent for non-qualified workers in the food industry (E0Z21) and by 69.60 percent for other non-qualified industrial workers (E0Z24); hiring was, however, not believed to have be-come more difficult when compared to 2013 for many professions.
Production and quality control engineers (H0Z92) were in higher demand for 2017 as they were five years ago, as were non-qualified workers for packaging and warehouse workers (J0Z20), road-based public transport drivers (J3Z41) and road drivers (J3Z43), with the latter ones being believed to be difficult to hire for 2017 compared to the overall average. The number of planned hirings increased for most professions in the group of agricultural professions (A), except for a 63.86 percent drop for vege-table gardeners (A1Z40), for example.
Moving on to professional groups mostly related to the service industry, a strong in-crease in hiring projects with regard to bank technicians (Q1Z80) could be observed when comparing beginning and end of the observation period, whereas bank and in-surance employees (Q0Z60) were sought less, but were believed to be found only with higher difficulty. Predicted demand for many trade-related occupations increased partly considerably - including furniture salespersons (R1Z61), cashiers (R0Z61) and real estate agents (R4Z93), to mention some examples, among which positions of the latter were also perceived to be more difficult to fill than in 2013, for instance. Whereas bakers and pastry cooks (S0Z42), cooks (S1Z40) and waiters (S2Z61) (all showing above average shares of difficult recruitment projects for 2017) were increasingly looked for, hiring plans decreased for hotel employees (S2Z60). (Major) increases also occurred for professions like household staff (T1Z60), security and surveillance personnel (T3Z61), occupations in the maintenance of premises (T4Z60) and childminders (T2B60), among others; recruitment difficulties, on the other hand, seemed comparatively less severe in this context, except for domestic aides (T2A60). More recruitment projects than in 2013 were also counted for nurses (V1Z80) and several occupations such as specialized educators and social workers (V4Z85), with-out major concerns about recruitment difficulties.
Administrative and accounting managers (L5Z90) and receptionists (L2Z60) were in-creasingly in demand, whereas related professions have seen declines in this context. Companies were also in need of more professionals in the area of information tech-nology (e.g. M1Z81, M2Z90) and industrial research engineers and managers

IAB-Discussion Paper 2/2018 35
(N0Z90), of which especially the latter group seemed to present severe difficulties when it comes to hiring.
In general, with regard to the total share of recruitment projects that employers assess to be difficult, a decrease from 43.40 percent in 2013 to 37.90 percent in 2017 can be observed over all professions. When comparing the most recent BMO to the previous year, the difficulty of recruiting increased given the 2016 share of 30.00 percent (Pôle emploi Enquête).
Identification of Shortages The Pôle emploi statistics department uses two main indicators to identify professions with a shortage of labor: First, the tension is computed with the following formula:
34
∗ 𝑂𝑂𝑂𝑂𝑂𝑂 𝐷𝐷𝑂𝑂𝑂𝑂
+ 1 4∗
𝑂𝑂𝑂𝑂𝑂𝑂𝐷𝐷𝑂𝑂𝐷𝐷𝐷𝐷
with OEE (offres d’emploi collectées) being short for registered vacancies, DEE (flux d’entrée des demandeurs d’emploi) for inflow of registered ABC jobseekers and DEFM for demand for employment at the end of the month (demandeurs d’emploi en fin de mois), i.e. ABC jobseekers (DIRECCTE Grand Est 2017; Statistiques, Études et Évaluations de Pôle emploi 2017a: 11). With regard to the number of jobseekers for the different professions only gross data are available instead of seasonally cor-rected data. It has to be noted, however, that the analysis is necessarily restricted to vacancies and jobseekers registered with PE which constitute but a share of the labor market and that these shares vary among the different professions. Moreover, the indicator is also influenced by the turnover rate which is higher in some professions than in others. Due to these limitations, it is recommended to focus on the evolution of the tension indicator over time instead of comparing absolute levels between pro-fessions and to use additional indicators (Dares 2013: 2-3). The results for the tension indicator in ROME classification are provided in table 7 in the appendix (Pôle emploi Demandeurs; OEE and DEE were provided to the author directly by Pôle emploi).
As a second indicator, the difficulty of recruiting is taken into consideration based on the results of the yearly BMO survey, more precisely as the share of difficult projects with regard to the total number of recruitment projects as addressed in the previous section. A profession is deemed to be subject to a shortage if the tension measure exceeds 0.3 and the ratio describing difficulty is larger than 60 percent or if tension is greater than 0.75 and difficulty greater than 20 percent; in addition, the number of registered employment openings must be greater than 10 for the profession in the respective year (Statistiques, Études et Évaluations de Pôle emploi 2017a: 11). A direct comparison of the two indicators is, however, complicated by the use of different classifications for the professions; when conducting a conversion (using Dares La nomenclature), the difficulty arises that a ROME profession can correspond to several FAP families and vice versa. Therefore, when comparing the two shortage indicators, both classifications have been converted into the respective other one in order to

IAB-Discussion Paper 2/2018 36
achieve a more rounded identification of the Alsatian bottleneck professions. The fol-lowing paragraphs cite the results in the ROME classification. In terms of the temporal dimension, tension indicators calculated based on 2012 data, the earliest point at which they were available, will be compared with the results for the BMO 2013, which reflects the employers’ expectations in 2012; the following years are matched analo-gously (Pôle emploi Demandeurs; Enquête). Moreover, it should be kept in mind that the ROME classification differentiates between a higher number of professions than the KldB 2010 at the three-digit level, therefore the mere numbers of potential short-age occupations listed here should not be compared directly.
Looking first at the field of accommodation and gastronomy, shortages for at least four of the five years considered could be observed for general hotel employees (G1502), receptionists (G1703), individuals in charge of mass catering (G1404), and several professions in food preparation (G16), in particular cooks (G1602). Moreover, butchers (D1101, D1103) seemed to be in short supply especially during the first three years of the observation period, for example, whereas bakers (D1102, D1104) only surpassed the threshold in 2012 and 2016. Persistent shortages from 2012-2016 could be identified for several, but not all specializations of sales staff (D14).
Moving on to construction, Alsatian companies seemed to encounter difficulties hiring various professional groups in the area of construction design and analysis (F11, e.g. F1103, F1104, F1106) and management of construction sites (F1201 and F1202). At least for most years of the observation period, professions with a focus on assembling metallic structures (F1502) and installing wooden structures (F1503) as well as plumbers and heating installers (F1603), installers of electrical networks and telecom (F1605) and professionals fitting of doors and windows (F1607) appeared to face con-tinuing shortages. A similar bottleneck could also be observed for fitting and restoring roofing occupations (F1610), sealing and isolation works (F1613), canalization fitting (F1705) and, to some extent, concrete construction (F1701). This situation does not apply to all occupations in this group, there seemed to be a sufficient supply of paint-ers (F1606) and masonry (F1703), among others. Under consideration of the compa-rably low case numbers, processing and routing (E1304) can also be identified as a shortage in most years.
Other areas in the industrial sector that present with partly very pronounced shortages included technical client support (H11) and industrial design, research and develop-ment (H12), such as design of electric and mechanical products (H1202 and H1203) and R&D technicians for automatization (H1208). Some professions in industrial man-agement (H14) and industrial quality control and analyses (H15) should also be men-tioned in this context. At least in some years, occupations related to carpentry and cooperage (H2206), furniture and wood technicians (H2209) and electric wiring pro-fessionals (H2602) could be found among shortage professions as well. In addition, manufacturing assemblers (H2901), boilermakers (H2902), pipefitters (H2914) and related professions constituted rather persistent shortages. Occupations in the fields of industrial painting (H3404) and surface abrasion (H3401) were also highly sought

IAB-Discussion Paper 2/2018 37
for. Almost all of the ten professions summarized under the group of production and community facilities (I13), i.e. installation and maintenance of different types of equip-ment, presented with continuing severe shortages through all years of the observation period; somewhat less strong, but also noticeable were shortages in vehicle mainte-nance and repairing (belonging to I16).
According to the indicators examined in this context, doctors (J1102) were difficult to hire in Alsace over the past years, as were specialized medical experts such as phys-ical therapists (J1404) and others; to draw the connection to the previous section, shortages in the field of healthcare also appeared on the German side of the border. Although the tension measure indicated recruitment problems of nurses, (J1504-J1507), according to employers, no particular difficulties were be believed to be en-countered in hiring professionals with this background. Ambulance drivers (J1305) and pharmacists (J1202) did not experience bottlenecks either. In addition, educa-tional occupations displayed shortages as well, such as educators for young children (K1202) and assistants for adults (for the elderly, individuals with disabilities, etc.; K1302).
Applying the two indicators, shortages could be observed for insurance management (C1109) and insurance client consulting (C1102), most consistently for professions with a technical focus in this context, as can be concluded from a comparison with the indicators in FAP classification. Real estate agents and similar occupations seemed to have been persistently presenting shortages. A number of jobs in business admin-istration should also be put on the list of current bottleneck professions in Alsace, among them auditors (M1202), accountants (M1203), distribution agents (M1603), customer relations managers (M1704) and several occupations related to information systems (M1802, M1805 and M1810). Other professions in this field showed a similar lack of shortages as in Baden, including receptionists (M1601) and secretaries (M1607). With regard to logistics, some occupations such as conductors of heavy handling machines (N1104), affreightment professionals (N1201), road transport technicians (N4203) as well as organizers and managers were sought for (N1301 and N1302).
Both tension and difficulty indicator surpassed their upper thresholds for drivers of agricultural and forestry machines (A1101) indicating a rather severe shortage, alt-hough it has to be kept in mind that the number of registered vacancies was rather low for this profession, suggesting some caution with this result.9 In general, except for some isolated examples such as mentioned above, agricultural and related pro-fessions did not seem to have faced particular shortages in Alsace in the past years.
9 This is a constraint which applies to several professions mentioned in this context and
should generally be kept in mind.

IAB-Discussion Paper 2/2018 38
3.2.3 Comparison of the Regional Shortages Whereas the previous sections served to provide a rather differentiated impression of bottleneck professions in the two border regions, comparing them directly proved to be difficult due to differences between the KldB 2010 and the two French classifica-tions. Since a comparison is, however, crucial to assess potential synergies and to make the data usable for later computations, such an attempt was made at this point, albeit at a less differentiated level than before. Accordingly, the KldB occupational groups were matched with the FAP professional domains (using Dares La nomencla-ture; Statistik der BA 2013), resulting in a condensed list of the FAP domains that both the German and the French ROME data could be converted into (see table 8 in the appendix). It should be kept in mind that this comparison is an approximate and a highly aggregated one, which can lead to a diffusion of high values of bottleneck indi-cators for single professions.
Using the conversion mechanism, average completed vacancy periods, the relation between unemployed and vacancies as well as unemployment rates for the different aggregated professional groups were prepared for the Baden region. For Alsace, the tension and difficulty indicators were computed using the conversion table. The de-tailed results can be found in tables 9-13 in the appendix (since these indicators will be used in combination with the panel data set introduced in section 4, which covers the years 2010-2015, the aggregation was also conducted for these years or a shorter period in some cases according to data availability).
Based on the aggregated indicators as well as on the findings drawn from the more differentiated shortage analyses, the situation in Baden and Alsace can tried to be compared, creating a basis for the quantitative analysis of French frontier workers in the next section. The most pronounced shortages for Baden as suggested both by the detailed and aggregate analysis can be encountered in the areas of health care, computer science, manufacturing and construction, whereas, of course, not all pro-fessions in these groups are concerned to the same extent. It should also be noted at this point that almost none of the professional groups surpasses the 140 percent threshold for average completed vacancy periods in the aggregated form. On the French side of the border, the aggregate data indicate a noticeably lower degree of shortages as presented by the closer bottleneck analysis. Drawing on both sources, it seems that computer science, construction, accommodation and gastronomy as well as manufacturing/maintenance are among the most concerned fields in this con-text. The discrepancy between aggregate and detailed examination could potentially stem from a persistence of shortages in certain professions that constitute only part of the total occupational area; a definite explanation, however, cannot be given at this point. Some professions in healthcare and logistics are placed among the bottleneck vocations as well, especially when applying the differentiated perspective. Numeri-cally comparing the severity of the suggested shortages in the two regions, on the other hand, is rather difficult.
IAB-Discussion Paper 2/2018 39
Considering these results it can be noted that to some extent similar shortages seem to exist on both sides of the border. The Baden and Alsatian labor markets therefore do not complement each other in every regard, but stand in competition for labor in some fields from a pure market perspective. On the other hand, it was shown that unemployment rates and especially youth unemployment in Alsace have persistently exceeded the levels of the neighboring region in the past years and shown somewhat diverging trends, suggesting disparities that would at least in theory be mitigated by an integrated labor market.
3.3 Developments on the Market for Vocational Education Before further investigating the extent to which the cross-border labor market has been integrated, the focus is shifted briefly to the situation and developments on the markets for vocational education in Baden and Alsace. Due to limited data availability, the analysis cannot be conducted in the same depth as for the previous section.
3.3.1 Trends in the Baden Dual System Starting with the German side of the Rhine, vocational education in Baden is mostly conducted in the so-called dual system, which combines school- and company-based education and training. Any degree qualifies for taking up such an apprenticeship in a profession in manufacturing, trade or craft. Completion of the program usually takes two to three and a half years, depending on the occupation and the previous education of the candidate. Whereas the time spent in the companies serves the purpose of teaching practical skills, the curriculum at the vocational school contains both knowledge specifically relevant for the aspired profession and general education (Kissling 2005: 11-14). Another form of dual education takes place in the dual courses of study that combine training in a company with attending a university or similar in-stitution (dfi, EURO-Institut Kehl, Strasbourg Conseil 2014: 18). The educational sys-tem in total is, of course, somewhat more complex and includes a variety of types of schools which partly also differ between the states, but the focus of this analysis is put on the wide-spread dual apprenticeship system that involves a contract with an employer for the duration of the program (Kissling 2005: 15).
Data are drawn from the BA statistics on the market of vocational education; however, since registering for assistance with finding an apprenticeship placement is voluntary at least for a part of the applicants and since employers are also free to decide whether to use the agencies’ services, the data can be expected to provide an incom-plete picture of the market for apprenticeships. In addition, before using these statis-tics, the term “applicant” needs to be clarified. Following the concept titled Anwesen-heitsgesamtheit, every individual that registered at least once in a year to receive support in finding an apprenticeship placement is called an applicant for the respec-tive year, with years being measured from October 1st to September 30th in line with the starting dates for apprenticeships (Gehrike, Kahler, Kohlmann 2010: 1-2). The same concept applies to registered apprenticeship vacancies (Statistik der BA 2017d). With regard to data availability, the analysis will be conducted for the October

IAB-Discussion Paper 2/2018 40
2011 - September 2017 period, taking into account some smaller changes and inac-curacies that can potentially affect the results to some degree (see Statistik der BA 2015a; 2016b). Moreover, the analysis will be limited to dual apprenticeships (Berufsausbildungsstellen), i.e. company-based programs and vocational training in-stitutions for applicants with disabilities, and therefore excludes entirely school-based vocational educations, apprenticeships in public service or professions for which ap-prenticeships are not officially recognized (Gehrike, Kahler, Kohlmann 2010: 5; Statis-tik der BA 2017c; 2016a).
A first impression of the market for dual vocational education can be gained by exam-ining the development of applicants and vacant positions per year. In the Baden re-gion, the total number of applicants (15,317) in 2016/2017 almost reached the level of the peak year 2012/2013, after showing a decreasing trend in the years in between. This trend is somewhat similar to the development in the state of Baden-Wuerttem-berg as a whole, which was also characterized by some oscillations and a peak in the most recent year of the observation period. In terms of registered apprenticeship va-cancies, both Baden and Baden-Wuerttemberg showed a not quite continuous, but overall increasing trend over the observation period. By 2016/2017, the number of open positions had increased by 7.31 percent and 6.44 percent with regard to 2011/2012, respectively. Both regions also share a feature in the relation between applicants and total vacancies: Since 2011/2012, the number of open positions has constantly exceeded the number of registered candidates, although the difference became less pronounced in 2016/2017 (see figure 7).
Figure 7 Evolution of the Number of Applicants and Vacancies for Vocational Educa-tion in Baden
Source: BA statistics on vocational education; own depiction
13000
13500
14000
14500
15000
15500
16000
16500
17000
17500
2011/2012 2012/2013 2013/2014 2014/2015 2015/2016 2016/2017
Evolution of the Number of Applicants and Vacancies for Vocational Education in Baden
Applicants Vacancies

IAB-Discussion Paper 2/2018 41
Proceeding to the market for apprenticeships for the different professions, in absolute terms, apprentices were searched for in the main groups of metal-making and -work-ing and metal construction (24), machine-building and the automotive industry (25) and mechatronics, energy electronics and electrical engineering (26) as well as food-processing and -production (29), albeit partially with a decreasing trend. Moreover, companies employing professionals in traffic and logistics (without vehicle driving) (51) were (increasingly) looking for apprenticeship candidates. By far the most vacan-cies were offered in sales professions in retail trade (62), e.g. 2,064 positions for the general program (621) in 2016/2017, an area that saw a strong increase of 31.46 percent with regard to 2011/2012 and a peak in 2015/2016. The fields of purchasing, sales and trading (61), business management and organization (71) and tourism, ho-tels and restaurants (63) also constituted an important share of the vacancies regis-tered in this context. While especially the latter witnessed a continuous decrease, offers for a dual education in purchasing, sales and trading increased by an absolute number of 378. A comparably high and increasing number of applicants was also sought for doctors’ receptionists and assistants (811).
High absolute numbers of applicants could correspondingly be observed for metal-making and -working and metal construction (24), mechatronics, energy electronics and electrical engineering (26) and especially machine-building and the automotive industry (25). The latter in particular exhibited a noticeable increase over the obser-vation period. The field of traffics and logistics (51) saw a rise in popularity among candidates over the past years as well, whereas contrary to the trend in vacancies, sales professions in retail trade (62) registered significant losses (e.g. 19.08 percent for sales professions in retail trade (621)), as did to a less severe extent professions in gastronomy (633), for example. Interest in taking up an apprenticeship in the sales of clothing, electronic devices, furniture, motor vehicles and other durables (622) grew, however, over the course of the observation period. A similar development took place for occupations in law and public administration (73) as well. On the other hand, reductions in the number of applicants also occurred for business management and organization (71) as well as health- and body care- related professions until 2015/2016, whereas numbers increased by 14.80 percent for doctors’ receptionists and assistants (811) in the following year.
Merely judging from the absolute differences in 2016 between registered vacancies and applicants, the most severe lack of applicants occurred in mechatronics, energy electronics and electrical engineering (26), food-processing and -production (29), traf-fics and logistics (51), finance and accounting (72) as well as most professions in commercial services, trading, sales, the hotel business and tourism (6), excluding the sales of clothing, electronic devices, furniture, motor vehicles and other durables (622), however, which presented with the opposite situation. Similarly, neither occu-pations in machine-building and the automotive industry (25) nor in business man-agement and organization (71) did seem to witness a shortage of applicants. It should be kept in mind that these data only take into account applicants living in Baden – a

IAB-Discussion Paper 2/2018 42
position in this region can, of course, also be filled with an individual from a neighbor-ing district or potentially a cross-border candidate, to mention some possibilities. To obtain a more detailed impression, applicants who did not find a placement and va-cancies that could not be filled are to be examined more closely in the following.
Firstly, the stock of unfilled apprenticeship positions at the end of September and its development over time are to be examined (Statistik der BA 2015c). Over all profes-sions, the Baden region has witnessed a drastic increase in positions that were still vacant at the end of the year (i.e. in September), namely of 51.11 percent to 1,635 openings when comparing the first and the last year of the observation period. To provide some of the most pronounced examples, 20.25 percent of the 2015/2016 va-cancies remained unfilled for occupations in food-processing and -production (29), 24.17 percent of the offered positions in gastronomy (633), 19.67 percent in hotel-related occupations (632) and 28.40 percent in sales occupations selling foodstuffs (623). Contrary to that, a share of less than 3 percent of unfilled vacancies could be observed for some professions in metal-making and -working and metal construction (24), occupations in machine-building and -operating (251), mechatronics, automation and control technology (261) and electrical engineering (263) as well as law and public administration (73), for instance.
Unplaced applicants, on the other hand, are defined as registered applicants who did not secure an apprenticeship placement, who are not about to continue school and who do not participate in a support program or have reported any other alternative by September 30th, but continue to be registered to receive assistance (Gehrike, Kahler, Kohlmann 2010: 2). Starting with a look at the year 2016/2017, in only few of the considered occupational groups did more than 20 applicants remain unplaced, such as sales professions in retail trade (621) with a number of 40 applicants without an apprenticeship position and business management and organization (71) with 23 can-didates. In total, the share of unplaced applicants with regard to all applicants amounted to 1.29 percent in the past year, which constitutes a small increase com-pared to the 2011/2012 ratio of 1.10 percent but is still noticeably low.10
If unplaced applicants and unfilled apprenticeship positions are compared directly for the 30th September 2017, then the unfilled positions exceed the number of applicants without a placement for the overwhelming majority of professions. Taking further into account that not every candidate might be sufficiently qualified for the profession he or she is applying for, the Baden market for vocational education presents itself as rather tight from the employers’ perspective, potentially creating an incentive for cross-border recruiting. This trend cannot be observed equally for all professions, of course, as detailed above; whereas the situation seems comparably relaxed for busi-ness management and organization (71), the sales of clothing, electronic devices,
10 Due to the frequent occurrence of case numbers smaller than 10, tables for unfilled vacan-
cies and unplaced applicants are not included in the appendix with regard to statistical secrecy.
IAB-Discussion Paper 2/2018 43
furniture, motor vehicles and other durables (622) and some manufacturing profes-sions, tensions or increasing tensions can be detected for food-processing and -pro-duction (29), purchasing, sales and trading (61) and hotel- or gastronomy-related oc-cupations (632 and 633), as well as doctors’ receptionists and assistants (811) and selected sales professions (62), among others.
3.3.2 Trends in the Alsatian School-Based and Apprenticeship System
Preparation for exercising a vocation in France is labeled enseignement profession-nel, i.e. professional education; in contrast to that, the so-called technological educa-tion (enseigenment technologique) paves the way for a university-level education (Zettelmeier 2005: 16). To be more precise, after finishing the collège, students can choose to attend a lycée with general or technological focus in order to obtain their Baccalauréat, the equivalent to the German Abitur, which qualifies for entering uni-versity; completing the lycée takes three years. Alternatively, the lycée professionnel, a vocational high-school so to say, teaches both contents specifically related to the professional life as well as general knowledge. Students can graduate from this type of school by obtaining a Baccalauréat (Bac) professionnel after three years, which allows for starting up a professional occupation or continuing education towards a Brevet de technicien supérieur (BTS), for example, or by obtaining a Certifcat d’apti-tude professionnelle (CAP) after two years which prepares for working in a particular profession (Ministère de l’Éducation Nationale 2017). The vocational education of-fered at the lycée professionnel is school-based with short practical training periods in a company (dfi, EURO-Institut Kehl, Strasbourg Conseil 2014: 17 based on a pub-lication of the Robert Bosch Stiftung; Zettelmeier 2005: 17-19).
Moreover, a dual vocational education is offered in the centres de formation d’appren-tis (CFA), the educational centers for apprentices. Students who attend these institu-tions have an apprenticeship contract with an employer and can obtain any profes-sional degree at the CFA, i.e. Bac professionnel, CAP, BTS and several more (thus diplomas of both secondary and higher education). In general, individuals of ages 16-25 are eligible for taking up an apprenticeship; in some cases, this regulation can be lifted (Ministère de l’Éducation Nationale 2015; Ministère du Travail 2017). A dual course of study, on the other hand, can be taken up after obtaining a Baccalauréat and can lead to the degrees of BTS or DUT (diplôme universitaire de technologie) after two years or the licence professionnelle after three years, and ultimately to a master professionnel (dfi, EURO-Institut Kehl, Strasbourg Conseil 2014: 17-18 based on a publication of the Robert Bosch Stiftung; Zettelmeier 2005: 18). The educational system is, of course, somewhat more differentiated, but for the purpose of this report the most relevant types of institutions have been presented (Ministère de l’Éducation Nationale 2017). In general, one difference between Germany and France is the greater role of school-based instead of dual vocational education in the latter country (dfi, EURO-Institut Kehl, Strasbourg Conseil 2014: 17 based on a publication of the Robert Bosch Stiftung).

IAB-Discussion Paper 2/2018 44
Using the data available and taking into account that shortages as previously de-scribed for the German market for vocational education do not play an equally im-portant role in the more school-based French system, an overview of recent develop-ments in Alsatian professional education is to follow, focusing on infra-bac education (i.e. leading up to a Baccalauréat or a lower degree, although this level is not directly comparable with the German dual vocational education programs as specified in more detail in section 6). The data are drawn from publications of the Académie de Stras-bourg as well as the région Grand Est and its employment and professional education observatory.
At the beginning of the 2016/2017 school year, a total of 18,354 Alsatian students were registered in a lycée professionnel (see figure 8), which constituted a drop both compared to the previous year (0.6 percent) and in comparison to 2011/2012 (2.84 percent), although the development in between was not continuous. The overwhelm-ing majority of the students were preparing a Bac Professionnel (14,325), followed by the CAP (3,001) in 2016/2017. Students in both types of programs were mostly en-rolled in the areas of mechanics, electrics and electronics, trade and management as well as services for individuals; in addition, the general group of different service spe-cializations counted a rather high number of students (Rectorat de l’académie de Strasbourg Chiffres 16-17). For the school year 2015/2016, student numbers are available for more detailed professional fields. Looking first at the production-related professions, most students in public and private lycées professionnels decided for electrics and electronics (27.07 percent), followed by food and nutrition (12.33 per-cent), car mechanics (8.34 percent) as well as general mechanics and electrics (8.18 percent). Occupations working with wood and furniture accounted for 6.04 percent of the students. In the area of services, trade and sales were most popular (38.20 per-cent), followed by general sanitary and social services (21.85 percent), and general services (20.47 percent). Tourism and accommodation accounted for 6.11 percent of the students and transportation, materials handling and storage for 4.95 percent (Ob-servatoire Régional Emploi Formation 2015a: 6-7).

IAB-Discussion Paper 2/2018 45
Figure 8 Evolution of Infra-Bac Student Numbers
Source: Rectorat de l’académie de Strasbourg Chiffres; own depiction
Shifting the focus to the apprentices in Alsace (see figure 8), it can be observed that 15,270 students had registered for this course of education starting in 2016, i.e. 2.51 percent more than in the previous year and 1.40 percent less than in 2011. With re-gard to the different kinds of degrees an apprentice can seek to obtain, the share of higher education diplomas increased noticeably (from 27.52 percent in 2011 to 37.23 percent), whereas the share of students preparing a CAP or another diploma at the same level (i.e. level V) decreased by 6.45 percentage points to a remaining 38.65 percent. Compared to the 2011 situation, the share of students aiming at a Bac Pro-fessionnel via an apprenticeship declined by 3.26 percentage points. The share of higher education diplomas was largest in professional groups like trade and manage-ment, communication and information and general production and public services. Aspirants for level V diplomas were mainly found in processing as well as civil engi-neering, wood and construction, and agriculture, fishery and forestry, i.e. more man-ually oriented vocations (Rectorat de l’académie de Strasbourg Chiffres 20).
In terms of absolute student numbers, most young people were enrolled in a program in trade and management (21.94 percent), followed by processing, mechanics, elec-trics and electronics as well as services for individuals (Rectorat de l’académie de Strasbourg Chiffres 20). More detailed numbers are available for the beginning of the 2014/2015 school year. With regard to production-related professions, the most pop-ular programs among apprentices were food and nutrition (25.86 percent), followed by electrics and electronics (8.80 percent) and car mechanics (7.48 percent), some-what similar to their fellow students at the lycées professionnels; construction finishing (6.87 percent) and work with metal structures (6.71 percent) were also popular among apprentices. In terms of services, occupations in trade and sales (34.29 percent),
0
2000
4000
6000
8000
10000
12000
14000
16000
18000
20000
2011 2012 2013 2014 2015 2016
Evolution of Infra-Bac Student Numbers
Lycée professionnel CFA

IAB-Discussion Paper 2/2018 46
tourism and accommodation (10.86 percent) as well as hairdressing, styling and sim-ilar services (10.35 percent) counted the highest number of students (Observatoire Régional Emploi Formation 2015c).
Comparing the two models of vocational education more directly, it can be found that out of the total number of students pursuing a Bac Professionnel in 2016/2017, 88 percent were enrolled in school-based education whereas only 12 percent were work-ing to obtain this degree via an apprenticeship; for the CAP degrees, 38 percent of the students had decided for a school and 62 percent had entered an apprenticeship, suggesting a stronger association of the dual education model with a lower degree (Rectorat de l’académie de Strasbourg Chiffres 17). As mentioned before, however, the share of higher education diplomas has increased over the past years, potentially pointing at a change in the use of the apprenticeship option. Moreover, looking at the year 2014/2015, for instance, school-based public vocational education counted slightly more first-year students in services than in production, whereas in the CFAs the relation was vice versa and the difference more profound (Observatoire Régional Emploi Formation 2015b). According to the media, some fields are lacking appren-tices in Alsace as well, like gastronomy and accommodation or building and construc-tion, in total 500 briefly before the start of the 2016/2017 year (France Télévisions 2017; Raso 2017).
4 Descriptive Analysis of French Frontier Workers in Baden Having obtained an impression of the respective labor market situations in Alsace and Baden in section 3.2, a next step examines the existing cross-border mobility in order to start addressing the question as to which extent transnational integration can be observed in this context. More precisely, the characteristics of the frontier workers are presented and compared to the employment structures on both sides of the border, drawing on the structure of Pilger, Meindl, Hamann (2011) and Buch, Niebuhr, Schmidt, Stuwe (2008). The data used for this purpose are drawn from the IAB em-ployment history (BeH), i.e. administrative data from the German pension insurance institutes, for the years 2010-2015 and include both employment subject to mandatory social security contributions and marginal employment (but exclude vocational train-ing) (IAB 2016: 8).
To begin with some specifications, the data that are available for the region allow for an examination of the French individuals that are employed in Germany, but not for the other direction, i.e. Germans working in France; the main flow occurs indeed from France to Germany, however (IAB Baden-Württemberg Grenzgänger; Pilger, Meindl, Hamann 2011: 13, 38). Within the German data used for this purpose, it is easily possible to restrict the analysis to the region of Baden as previously defined; a differ-entiation between the regions of origin in France cannot be made in the IAB data. INSEE, on the other hand, provides data from which the exact number of commuters from Alsace to Baden can be extracted. Due to the highly aggregate measurement of professions used in this set, however, they cannot be used for the further analysis in
IAB-Discussion Paper 2/2018 47
this context. Yet a comparison for 2014, the most recent year available, shows a rel-atively minor loss of information when using the German data not differentiating for the French regions of origin: whereas INSEE identified 21,414 commuters from Al-sace to Baden, including salariés and temporary employment without apprentices, interns and similar contracts (INSEE 2017j; Statistisches Landesamt Baden-Württem-berg Regionalverzeichnisse), the BA employment statistics on commuting counted 22,164 employees subject to mandatory social security contributions from France in Baden. Taking also into account some deviations in the groups considered11, the share of French employees commuting to Baden from regions other than Alsace seems comparably small (BAK Basel Economics 2008: 78).
The criterion for identifying the target population that is used in the IAB data is the employee’s nationality: all French citizens that are working in the Baden region, be it via commuting or following a change of residence, are labelled and examined as fron-tier workers in this context. To gain an impression of the dimensions, another glance at the BA employment statistics on commuting reveals that in 2014, for example, 17,246 French citizens subject to mandatory social security contributions (excluding vocational education) lived in France and worked in Baden. An additional 2,740 also lived in the latter region and 510 worked in Baden but lived neither there nor in France.
Given the specification mentioned above, non-French citizens living in Alsace and working across the border in Germany are therefore not captured in this context. Re-ferring once again to the BA employment statistics for a rough assessment, lifting the restriction of French nationality increases the number of commuters to Baden from the previous 17,246 to the 22,164 mentioned above, i.e. reveals a difference of 4,918. This figure appears to be of rather significant size; as 4,418 of these individuals are German citizens, however, the loss of information becomes manageable regarding the focus of this paper. Having checked for these potential deviations, the IAB em-ployment history data will be used for the remaining part of the section.
In a first step, the general development of the number of frontier workers over the observation period is to be examined, frontier workers describing French citizens working in Baden as specified above (see figure 9).12 Over all types of employment, a continuous moderate upward trend could be noted from 2010 to 2014, with the amount of French employees across the border increasing from 19,751 to 21,028 (i.e. a 6.47 percent increase). In 2015, however, numbers fell back to 20,733, slightly
11 At this point it also has to be remarked that no INSEE data were found for the Gemeinde
Sasbach am Kaiserstuhl at the French border in the Landkreis Emmendingen, which prob-ably led to a slight underestimation of the number of cross-border commuters (22 commut-ers from France according to BA statistics). On the other hand, it could not be unequivocally determined which code corresponded to the Gemeinde Eschbach since there exist also two Eschbachs in Rhineland-Palatinate. In both Eschbachs for which INSEE data were available, a combined number of 9 Alsatians were employed as frontier workers, thereby not changing the numbers significantly.
12 The official EU definition only counts commuters as frontier workers (European Parliament, & Council of the European Union 2004: 12).

IAB-Discussion Paper 2/2018 48
below the 2013 level. Looking separately at the different types of employment, a very similar development took place with regard to full-time employment and marginal em-ployment, except for a small dent in 2011. The amount of French part-time employees continuously increased over the entire observation period, concluding at 2,411 indi-viduals in 2015 or 47.19 percent more than five years before. In comparison, the num-ber of full-time employees barely changed when comparing beginning and end of the observation period (0.65 percent). It has to be remarked, however, that in the decade before the number of cross-border commuters from Alsace to Baden decreased no-ticeably, by 21 percent between 2002 and 2014, for instance (Deutsch-Französisch-Schweizerische Oberrheinkonferenz 2016: 11); the relatively stable level presented above could only be observed recently (Statistiques, Études et Évaluations de Pôle emploi 2017b: 8).
Figure 9 Evolution of the Number of French Frontier Workers in Baden
Source: IAB employment history (BeH); own depiction
Full-time employment constituted the largest share of the frontier workers with 82.19 percent in 2015, followed by part-time employees (11.63 percent) and individuals in marginal employment (6.18 percent). Measured against the total number of (civil) em-ployees in Baden drawn from the BA employment statistics, the French frontier work-ers constituted a share of 1.52 percent in 2015 (BAK Basel Economics 2008: 78).
Distinguishing further between male and female frontier workers, the situation differed significantly for the different types of employment. On the one hand, three quarters of the French full-time employees in Baden were men in 2015; on the other hand, they accounted for only 16.46 percent of the part-time employees. Whereas the unequal distribution became slightly more pronounced over the observation period in the first case (starting from a 73.31 percent share of male workers in 2010), the high share of female workers in part-time employment was 4.02 percentage points lower than five years before, the development not being continuous in both cases, however. These
0
5000
10000
15000
20000
25000
2010 2011 2012 2013 2014 2015
Evolution of the Number of French Frontier Workers in Baden
Full-time Part-time Marginal employment Total

IAB-Discussion Paper 2/2018 49
data compare to a total 68.86 percent share of men among all full-time employees working in Baden in 2015 and a 16.39 percent share in part-time employment, thereby implying a generally more pronounced presence of men in full-time employment among the frontier workers than in the region of destination. Marginal employment proved to be more balanced, with almost equal shares in 2015 (49.68 percent men and 50.32 percent women) – a converging trend, given that the number of female frontier workers surpassed their male counterparts’ by 9.42 percentage points in 2010 (see figure 10). This result also differs from the general situation in Baden, where women represented a share of 62.71 percent in marginal employment in 2015. Due to the predominance of full-time employment among this group, the total relation of male to female frontier workers amounted to 67.04 percent : 32.96 percent in 2015, indicating a noticeable overrepresentation of men among the French employees in Baden, especially when compared to the overall ratio in the region (50.47 percent : 49.53 percent). Pilger, Meindl, Hamann (2011: 41) cite the role of the industrial sector in the Baden economy as one of the potential reasons for this disparity by noting that men are still dominant among the employees in this industry. With regard to the dis-tribution among sexes the group of frontier workers thus differs substantially from both region of origin and destination when looking at full-time employment in particular.
Figure 10 Evolution of the Employment of Frontier Workers by Sex
Source: IAB employment history (BeH); own depiction
Focusing next on the age structure of full-time French frontier workers in Baden, a rather strong trend towards a larger share of more senior employees can be detected (see figure 11). In 2015, 56.86 percent of the group in question counted 45 years or more (and 18.87 percent 55 years and more), as opposed to 46.48 percent (12.07 percent) in 2010. The share of young people between 15 and 24 years grew steadily, but remained at a low level of 4.76 percent in the most recent year of the observation period. The development of the age structure of part-time employees presented itself in a similar way, although a stronger increase of young workers needs to be pointed out (to a final level of 5.08 percent). Combining the two types of employment, French
0
0,2
0,4
0,6
0,8
1
Full-time Part-Time MarginalEmployment
Full-time Part-Time MarginalEmployment
2010 2015
Evolution of the Employment of Frontier Workers by Sex
Men Women

IAB-Discussion Paper 2/2018 50
employees of 45 years and older represented 56.70 percent of the frontier workers or 18.70 percent of the 55-year-olds and older in 2015; in comparison, among the total number of employees working in Baden, these groups held a share of 48.72 percent and 19.62 percent, respectively, or 36.54 percent and 10.09 percent of all workers in Alsace. Moreover, 9.90 percent of the total number of Baden employees were be-tween 15 and 24 years old, further confirming the impression that French frontier workers were, on average, older than both the total Baden and Alsatian workforce. With regard to marginal employment, however, the distribution has a more balanced shape: young people accounted for a noticeably higher share in this type of employ-ment, namely 17.96 percent in 2015. On the other hand, the group of senior workers at age 65 or higher was also strongly represented in this section, their share amount-ing to 13.13 percent in the final year of the observation period. While it seems logical that individuals in retirement age rather accept a marginal employment position than a different type of job, it should be noted that their numbers have increased since 2010, when this group constituted 8.06 percent of all French citizens with marginal employment in Baden; without a closer examination, it could only be speculated if, for example, an increasing wish to keep skilled workers in the companies as long as possible or insufficient retirement payments are among the reasons for this develop-ment. A similar, yet slightly younger distribution can also be observed for Baden in total for this type of employment. On average, frontier workers in marginal employ-ment have aged as well throughout the observation period, yet most dominantly driven by the 65 plus group; especially the share of 45-55-year-olds remained below the increasing values of the other types of employment.
Figure 11 Evolution of the Age Composition of Frontier Workers
Source: IAB employment history (BeH); own depiction
Examining the education of the frontier workers based on this dataset proves to be somewhat difficult, since for 37.85 percent of the 2015 full-time French employees, no information on the educational degree could be provided; part of this high value
0
0,2
0,4
0,6
0,8
1
2010 2015
Evolution of the Age Composition of Frontier Workers
0-24 years 25-44 years 45-54 years 55 years and older

IAB-Discussion Paper 2/2018 51
most likely results from the differences in the educational systems of the two neigh-boring countries. Drawing on the INSEE data on commuters from Alsace to Baden for 2014 instead (salariés and temporary employment, without apprentices, interns and similar contracts), it can be noted that 42.78 percent held a CAP or similar certificate as their highest diploma, i.e. a first and comparably low professional degree. 23.75 percent had completed a program of higher education, 14.83 percent held a Bacca-lauréat and 18.64 percent did not have any degree or a very low one (INSEE 2017j; Statistisches Landesamt Baden-Württemberg Regionalverzeichnisse). Compared to employees residing in Alsace in general as extracted from the same data set, CAP or similar graduates were strongly overrepresented (with regard to just 29.97 percent in their home region), as were to some extent individuals without a degree (14.94 per-cent in general Alsace). An issue that should be addressed in this context is the phe-nomenon of brain-drain which could occur if a large number of high-qualified individ-uals would commute to Baden instead of working in Alsace. Given the distribution of educational degrees among the frontier workers, however, it seems probable to as-sume that the cross-border labor market is rather offering a chance for lower qualified workers than draining highly qualified experts (Pilger, Meindl, Hamann 2011: 43). An-other indicator can be derived from comparing the composition of the frontier workers to the working population in the region of Alsace with regard to their professional cat-egory. In 2014, 48.78 percent of the former could be categorized as workers, followed by 19.58 percent intermediate professionals and 16.52 percent employees (INSEE 2017j; Statistisches Landesamt Baden-Württemberg Regionalverzeichnisse). In con-trast, most people working in Alsace in that year were employees (27.65 percent), closely followed by intermediate professionals (26.39 percent) and workers on third place with only 24.29 percent, thus confirming the impression outlined above (INSEE 2017l,m).
Another perspective under which the French frontier workers can be examined is their distribution into the different industries (see figure 12); for this section, the „Klassifika-tion der Wirtschaftszweige (WZ 2008)“ is used as a categorization of the industries. In the most recent year of the observation period, the largest portion of all French citizens in Baden was employed in manufacturing industries (48.06 percent), followed by commerce/vehicle maintenance (14.48 percent), construction (7.37 percent) and other services (7.01 percent). This order has not changed very much in comparison to 2010. Looking only at the part-time employees, manufacturing and commerce/ve-hicle maintenance each accounted for 25 percent of the frontier workers in 2015. In-dividuals in marginal employment mostly exercised a profession in commerce/vehicle maintenance (19.48 percent), gastronomy (18.61 percent) and other services (12.09 percent). On a more aggregated scale (Frank, Grimm 2010: 13), 56.08 percent of all French frontier workers were employed in the secondary sector in 2015 (as opposed to 58.12 percent in 2010) and 43.19 percent in the tertiary sector (41.06 percent in 2010). Contrary to that, when looking at total employment in Baden, the distribution presents itself quite differently with 29.15 percent of the jobs in manufacturing and

IAB-Discussion Paper 2/2018 52
70.33 percent in services, allowing to conclude that French employees are compara-tively overrepresented in the industrial sector. As pointed out in section 3.1, this sector also accounts for a considerably smaller share of employment in the Alsatian econ-omy.
Figure 12 Employment by Sector in 2015
Source: IAB employment history (BeH) and BA employment statistics; own depiction
Turning to the corresponding professions of the frontier workers, it should first be noted that especially for the year 2011, data on numerous individuals’ occupations cannot be provided due to the introduction of the new classification for professions (KldB 2010). More precisely, 5,456 observations lack this information in 2011, i.e. 26.94 percent of the French employees in this year. For 2010 and 2012, numbers are more manageable (860 and 708 observations, respectively).13 In 2015, most French frontier workers in Baden exercised a technical vocation in machine-building and the automotive industry (25) (11.76 percent), followed by occupations in traffic and logis-tics (without vehicle driving) (51) (10.61 percent), occupations in metal-making and -working and in metal construction (24) (9.07 percent) and business management and organization (71) (8.75 percent). On a higher level of aggregation, 42.24 percent of the frontier workers were employed in the production of raw materials and goods and manufacturing (2), 11.04 percent in commercial services, trading, sales, the hotel business and tourism (6) and 7.48 percent in construction, architecture, surveying and technical building services (3). Healthcare, the social sector, teaching and education (8) as well as natural sciences, geography and informatics (4) accounted for about 4 percent of the employees, respectively.
13 For further context see also IAB 2016: 25-26; information on the quality of the data can also
be found in this document.
0
0,2
0,4
0,6
0,8
1
Frontier Workers Total Employment in Baden
Employment by Sector in 2015
Primary Sector Secondary Sector Tertiary Sector

IAB-Discussion Paper 2/2018 53
At this point, some disparities can be detected when compared to total employment in Baden in 2015: for example, the production of raw materials and goods and manu-facturing (2) only constituted a share of 21.74 percent, i.e. about half of the share found among the frontier workers. This matches the results obtained for the different industries as outlined above. Similarly, a mere 6.79 percent of the Baden employees worked in traffic and logistics (without vehicle driving) (51) and 5.88 percent in con-struction, architecture, surveying and technical building services (3). Some of the pro-fessions in these fields were previously identified as shortages in Alsace; it has to be taken into account that this does not apply to all occupations in this family, i.e. with regard to manufacturing many of the bottleneck professions are related to mainte-nance or management and technical supervision as well as research. On the other hand, French employees are comparatively strongly underrepresented in occupations in commercial services, trading, sales, the hotel business and tourism (6) (15.31 per-cent) as well as healthcare, the social sector, teaching and education (8) (14.78 per-cent in Baden).14 Referring back to section 3, some of these professional families were found to be among the more demanded ones in Alsace, thus lowering the in-centive or pressure to look for work across the border. With respect to the complexity of the tasks conducted by the frontier workers in their professions, the vast majority can be categorized as skilled workers (58.84 percent), followed by unskilled workers (21.12 percent) in 2015. In comparison, when considering total employment in Baden in that year, the distribution differed only slightly with 54.97 percent skilled and 22.56 percent unskilled workers. 10.06 percent and 9.97 percent of the French employees were hired for complex or highly complex tasks, respectively, which corresponds ap-proximately to the share of these tasks in the total Baden employment as well.
Another appealing question concerns the average salaries of the frontier workers in Baden, usually a relevant factor in the decision on the place of employment. As can be extracted from the IAB employment history data set, French employees earned a slightly lower gross daily salary than the Baden average. In 2015, full-time frontier workers received an average of 113.05 Euro per day, as compared to 114.18 Euro among the general Baden population. With regard to part-time work, on the other hand, frontier workers earned on average 12.26 Euro more than usually paid in Ba-den, with regard to marginal employment 0.52 Euro more. Since commuting costs weigh in even more strongly for reduced-time employment, this difference might be necessary to attract workers from Alsace for these positions. For instance, above av-erage wages for frontier workers were paid in occupations related to transportation and security (5), commercial services, trading, sales, the hotel business and tourism (6) as well as healthcare, the social sector, teaching and education (8), i.e. in occu-pations for which the labor market was found to be rather tight and therefore promising
14 Applying the comparative FAP classification introduced in section 3.3 leads to similar re-
sults; in this context, however, the KldB was preferred because it allows for a more differ-entiated analysis.

IAB-Discussion Paper 2/2018 54
for jobseekers in Alsace, who thus probably required incentives for taking up commut-ing. For manufacturing and building sector occupations ((2) and (3)), on the other hand, paying higher wages for full-time employees did not seem necessary (yet), po-tentially since comparable jobs do not exist in sufficient numbers in Alsace, and the lower than average wages presumably reflected the rather low educational levels identified above. Although very interesting in this context, a comparison to the level of salaries in the Alsatian region of origin proves to be rather difficult and will therefore not be taken into account in this context (Pilger, Meindl, Hamann 2011: 14, 34).
The IAB employment history data set at hand does not include information on voca-tional education. Drawing on the BA employment statistics (Kropp, Sujata, Weyh 2007: 22-23), in 2015, for example, Baden counted a total 199 apprentices subject to mandatory social security contributions that held the French nationality, with a com-muter share of 53.77 percent; their number saw a continuous increase over the course of the observation period – starting from 56 individuals in 2010 – which might be to some extent attributed to increased efforts on the political and operative level as men-tioned in section 2. Contrary to dominant professions among the frontier workers, most of the 2015 French apprentices had chosen a program in healthcare, the social sector and education (8) (26.13 percent) and the production of raw materials/manu-facturing (2) (25.13 percent). 16.58 percent had decided for a vocational education in commerce/accommodation/tourism (6) and another 14.07 percent for business organ-ization, accounting, law and administration (7). These four occupational fields were also favored by the group of all Baden apprentices in 2015, although healthcare (8) accounted for a lower share (20.25 percent) and business-related professions (7) were somewhat more popular (18.06 percent).
To sum up the characteristics of the French frontier workers in Baden identified in the previous paragraphs, the findings are largely similar to the results of Pil-ger/Meindl/Hamann (2011): from a very condensed perspective, many cross-border workers are male, of comparably advanced age, holding a rather low vocational de-gree and working in a manufacturing-related profession. Whereas the imbalance with regard to sex and age has persisted or even become more pronounced, a slight re-verse trend in the prevalence of manufacturing jobs among frontier workers could be detected. Given that the industrial sector accounts for a smaller share of the Alsatian industry relative to the situation in Baden, the German labor market might prevent a portion of the frontier workers from going out of work in their home region, which can be interpreted as an element of an integrated cross-border labor market. A more com-prehensive quantitative analysis will be provided in section 5.
5 Examination of the Effect of Labor Market Shortages on the Number of Frontier Workers
Having provided a brief descriptive analysis of French nationals working in the Baden region, the following section aims at combining these data with the preceding short-age analyses in an attempt to discover a connection between labor market conditions

IAB-Discussion Paper 2/2018 55
and commuters or permanently relocated individuals and to assess to which extent an integrated labor market can be observed.
5.1 Theoretical Framework Before conducting the computations, some theoretical foundations for labor mobility are to be provided as a framework against which the situation in the French-German Upper Rhine Region can be assessed, most prominently the concept of push and pull factors. Labor mobility thereby includes both migrating to another region and commut-ing without changing the place of residence, as already defined in the previous section (Huber, Nowotny 2013: 1463).
An early description of the push and pull factor concept was presented by Everett S. Lee (1966). Based on his definition of migration necessarily including a location of origin, a location of destination and a number of “intervening obstacles” (118) in be-tween (such as distance) he determined four groups of factors with regard to migration decisions that have a pushing, a pulling or no influence on a particular individual: factors related to the location of origin and destination, the intervening obstacles as well as personal factors. According to Lee, it has to be taken into account, however, that the conditions at the destination might not be entirely known to the individual when considering migration, and that in general, the perception of the push and pull factors at the region of origin and destination rather than the actual situation is deci-sive. Yet he warns against assuming a simple addition and comparison of positive and negative circumstances for both locations, but points out that generally speaking, the situation in the potential region of destination must be somewhat significantly bet-ter in order to motivate migration (115-129). In a similar spirit, Pilger, Meindl, Hamann (2011: 29) name labor market conditions as a crucial determinant of the choice of the location of employment. In their study on the cross-border labor market in the Stras-bourg-Ortenau region, they cite low levels of unemployment as potential pull factors, i.e. forces of attraction towards a regional labor market, and identify vice versa high unemployment as a push factor that rather triggers individuals to look for employment in another location. Apart from the employment situation, further parameters identified as push and pull factors by Pilger, Meindl, Hamann (2011: 34-35) as well as by a study of Buch, Niebuhr, Schmidt, Stuwe (2008: 18) on cross-border commuting in-clude differences in income levels, the cost of living, taxes, institutional reforms and personal factors. According to a 2009 paper on mobility in the EU, regional infrastruc-ture as well as numerous other factors also play an important role in the determination of cross-border commuting streams (Nerb, Hitzelsberger, Woidich, Pommer, Hem-mer, Heczko 2009: 8-9).
Correspondingly, the following section is to examine quantitatively whether – analo-gously to Lee’s factors associated with the regions of origin and destination – labor market and shortage situations constitute potential push and pull factors for French frontier workers in the French-German Upper Rhine Region. For this purpose, the IAB panel data introduced in section 4 are combined with the results from the shortage analyses conducted in section 3 and thus form the foundation for a fixed effects panel

IAB-Discussion Paper 2/2018 56
estimation. It should be noted at this point that barriers affecting cross-border work – such as insufficient infrastructure, negative perceptions of the neighboring country and administrative challenges, or “intervening obstacles” in Lee’s wording –will be addressed qualitatively in section 6. Whether the perception of shortage situations among (potential) frontier workers equals the actual realities as questioned by Lee, however, cannot be examined more closely in this context.
5.2 Model Specification To begin with, the variables on which the model is based are to be specified in some-what more detail. First of all, the number of French frontier workers in Baden extracted from the IAB employment history panel data set will serve as the dependent variable potentially to be explained by various shortage indicators. In the data set, the number of days worked per individual (Personentage in the original terminology) are provided for the respective professions, differentiated into full-time, part-time and marginal em-ployment as described in the previous section. The different categories are weighted and aggregated according to the following formula:
Total days worked = Days worked in full-time employment + 0.5*Days worked in part-time employment + 0.2*Days worked in marginal employment
Since the objective consists in determining potential push factors in the Alsatian labor market and pull factors in the Baden equivalent, the aggregated FAP classification from section 3.3 is used rather than KldB or ROME in order to allow shortage indica-tors from both regions to be integrated into the model. Consequently, the number of days worked by French frontier workers differentiated according to the 13 professional families that are distinguished by the aggregated FAP classification form the panel observations for every year of the observation period. It is therefore not individuals, but professional groups that are examined over the years, which seems particularly appropriate given that the shortage indicators also refer to occupational aggregates.
Taking into account that the data sources and computations of the bottleneck measures were described in detail in section 3, the following table (Table 1) should suffice to briefly summarize the explanatory variables available for the model and the period for which the data have been obtained:

IAB-Discussion Paper 2/2018 57
Table 1 Summary of the Shortage Indicators and their Availability Alsace Period Baden Period
Tension 2012-2015 Average completed vacancy periods 2011-
2015
Difficulty 2012-2015 Ratio of unemployed to vacancies 2011-
2015
Unemployment rates per profession 2013-
2015
Source: Author’s own depiction
Since the two core Alsatian shortage indicators were only available from 2012 on-wards, the analysis will be conducted for the years 2012-2015. To make full use of this time period, the unemployment rate per profession needs to be omitted as an explanatory variable since it is not available for all years in question.
In addition to the variables listed in the table, the model was controlled for age groups (in brackets of ten years), sex and education (in levels ranging from 0: no vocational education, 1: unknown education, and 2: Abitur and/or dual vocational education to 3: higher education) by integrating the shares of number of days worked by the respec-tive groups as regressors into the model (excluding a reference category). Due to collinearity, the share of days worked by over 65-year-olds was also omitted. The daily gross wages earned by the Baden workers in general in the different occupations were also taken into account as an explanatory variable, since, as mentioned above, income has the potential to constitute an important push or pull factor. The control variables and the wages are drawn from the IAB employment history panel data set.
Both the number of days worked by French frontier workers in Baden as well as the general daily wages are logarithmized for the purpose of the model. The same trans-formation is conducted for the average completed vacancy periods, the ratio of un-employed to vacancies in Baden and the Alsatian tension indicator; the resulting co-efficients will therefore provide elasticities. On the other hand, the control variables (which are integrated as percentage shares) and the difficulty indicator (which repre-sents the share of difficult recruiting projects with regard to all hiring endeavors) are included into the model in their original form.
Apart from the labor market variables specified above, other (unobserved) factors might be related to both the number of frontier workers and the shortage indicators in the different occupations (Frees 2004: 23; Giesselmann, Windzio 2012: 33-35; Kohler, Kreuter 2017: 343; Verbeek 2012: 374). For example, particularly positive or negative perceptions of a professional field are likely to influence the number of both foreign and local applicants as well as employees in some of the professional families, thus potentially exerting an effect on both the number of frontier workers and the shortage indicators. Staff turnover, the length of screening processes or the option to

IAB-Discussion Paper 2/2018 58
work some days of the week from home might differ among the occupational groups as well, influencing both sides of the model. In some fields, recruitment might be standardized or digitalized to a higher degree, making vacancies more easily acces-sible to Alsatians and at the same time possibly resulting in faster reporting of new and filled vacancies to the employment vacancies. In addition, some years of the ob-servation period might have witnessed events or developments that affected the num-ber of frontier workers as well (Frees 2004: 23; Torres-Reyna 2007: 12). Referring back to section 2, in 2013 joint offices of the German Federal Employment Agency and Pôle emploi were established, for example, which can be assumed to have had an effect on commuting statistics in the following years. Given that the structures of cooperation are constantly being enhanced and adapted in the region, their effect should be accounted for in the computations as well.
Consequently, in order to account for these and other related time-invariant differ-ences between the professional groups and the years of observation, a two-way fixed effects model is estimated on the panel data set (Frees 2004: 23; Giesselmann, Win-dzio 2012: 33-35; Kohler, Kreuter 2017: 343; Verbeek 2012: 374), according to the following specification (Model_1):
𝑦𝑦𝑖𝑖𝑖𝑖 = 𝛼𝛼𝑖𝑖 + 𝜆𝜆𝑖𝑖 + 𝑥𝑥’𝑖𝑖𝑖𝑖 ∗ 𝛽𝛽 + 𝑢𝑢𝑖𝑖𝑖𝑖
As presented above, 𝑦𝑦𝑖𝑖𝑖𝑖 denotes the number of French frontier workers in Baden per professional aggregate and year, 𝑥𝑥𝑖𝑖𝑖𝑖 includes the shortage indicators, control varia-bles and wages for each occupation and time as detailed above and 𝑢𝑢𝑖𝑖𝑖𝑖 represents the respective error term. Heterogeneity among the FAP groups is captured by the profession-specific fixed effects 𝛼𝛼𝑖𝑖, while time fixed effects are included via 𝜆𝜆𝑖𝑖 (Frees 2004: 23; Verbeek 2012: 377).
Whereas an adapted Durbin-Watson test does not conclusively suggest the presence of autocorrelation (Bhargava, Franzini, Narendranathan 1982; StataCorp 2017: 456; Verbeek 2012: 391-392)15, a modified Wald statistic16 rejects the hypothesis of homo-scedasticity at any level of significance (Torres-Reyna 2007: 35). A non-homoscedas-tic variance of the error terms is also suggested by a plot of the fixed effects residuals against the fitted values as depicted in figure 13 in the appendix (Verbeek 2012: 83-85). To account for this issue, robust standard errors will be used for the estimation of the model.
15 Exact threshold values are not available for this combination of parameters; the estimation
provides the following results: modified Bhargava et al. Durbin-Watson = 1.8286891; Baltagi-Wu LBI = 2.3754102.
16 Do-file retrieved from Baum, C. F. (2001) XTTEST3: Stata module to compute Modified Wald statistic for groupwise heteroscedasticity [Do-file]. Boston College Department of Economics: Statistical Software Components S414801. https://ideas.repec.org/c/boc/bo-code/s414801.html; the estimation provides the following results: H0: sigma(i)^2 = sigma^2 for all i chi2 (13) = 1115.18, Prob>chi2 = 0.0000.
IAB-Discussion Paper 2/2018 59
Moreover, a Hausman test was conducted to verify whether the use of the fixed effects model over the random effects model is justified. The test is based on the observation that the latter model would produce consistent and efficient estimators only if the ex-planatory variables and the profession-specific fixed effects were uncorrelated. Con-sequently, under the null hypothesis stating the absence of such a correlation, these estimators should not to differ substantially from the fixed effects estimators, which are consistent irrespective of the existence of a correlation. If, however, a significant difference between the estimators was detected, the null hypothesis could be rejected and a correlation between the regressors and the unobservable fixed effects could be assumed, rendering the random effects model unsuitable in this context. The resulting chi-squared test statistic17 led to a rejection of the null hypothesis on any level of significance, clearly indicating a correlation between the explanatory variables and the unobserved profession-specific effects and thus the inadequacy of the random effects model in this case (Verbeek 2012: 374, 381, 385-386).
By using a fixed effects model, all time-invariant characteristics of the professions are omitted as explanatory variables since they are subsumed by the profession-specific effects (Giesselmann 2012: 44; Verbeek 2012: 374, 387). Nevertheless, especially when examining the extent of labor market integration, it would be interesting to ex-plicitly analyze the effect of such idiosyncratic occupational features as well. For ex-ample, apart from the shortage indicators discussed above, the degree to which a certain profession requires a specific certificate or education to be exercised in Ger-many might also have an immediate effect on the number of foreign frontier workers – or constitute an “intervening obstacle” – who can be assumed to hold a French education for the most part which might hamper employment in these professions. Vicari (2014) developed several variables reflecting the standardization and regula-tion of German professions, namely an indicator measuring whether a standardized certificate is associated with a profession (thus excluding academic degrees, for in-stance, but covering occupations learned in a dual education program), a further in-dicator capturing whether a certain qualification is legally mandatory to work in a vo-cation or carrying the respective title and a combination of the two which allocates the value “1” to an occupation if at least one of the two previous variables was assigned
17 Due to the computation of robust standard errors, the straightforward Stata command could
not be used in this context; instead, the fixed effects model was computed using an ordinary regression command with profession dummies and compared to the pooled OLS model (whose coefficients corresponded to the random effects model as shown by the xtoverid and ivreg29 commands, see Schaeffer, M. E., & Stillman, S. (2006) XTOVERID: Stata module to calculate tests of overidentifying restrictions after xtreg, xtivreg, xtivreg2, xthtay-lor [Do-file]. Boston College Department of Economics: Statistical Software Components S456779. https://ideas.repec.org/c/boc/bocode/s456779.html and Baum, C. F., Schaeffer, M. E., & Stillman, S. (2002) IVREG2: Stata module for extended instrumental varia-bles/2SLS and GMM estimation [Do-file]. Boston College Department of Economics: Sta-tistical Software Components S425401. https://ideas.repec.org/c/boc/bo-code/s425401.html), using the suest and test commands (see https://www.stata.com/man-uals13/rsuest.pdf); the estimation provides the following results: chi2( 17) = 1877.37, Prob > chi2 = 0.0000.
IAB-Discussion Paper 2/2018 60
this number. Whereas these indicators can only take the values zero or one on the most detailed level of professional categorization (one meaning a standardized certif-icate or regulation exists in this case), they are aggregated as a weighted average for the KldB 2010 occupational groups which allows them to adopt any value between zero and one. Drawing on the data set provided by Vicari (2014) and using the same aggregation technique, the values for the KldB groups were further condensed to the FAP groups for the purpose of this paper. Since the combination variable reflects the information from the first two indicators, it will be omitted in this estimation, leaving the measures for certificate standardization and regulation to be included into the model.
In addition, the composition of tasks associated with a certain professional group may also constitute an influencing factor on the attractiveness and thus the number of French frontier workers in this field. With regard to the language barrier, for instance, it seems likely that occupations which mostly include manual tasks might be easier accessible to non-native German speakers than professions demanding linguistically complex conversations with colleagues or clients. Weber (2016), for example, opera-tionalizes the language requirements for a certain profession by means of the share of interactive tasks associated with this occupation. For this paper, the distribution of tasks for the KldB occupational groups as identified by Dengler/Matthes/Paulus (2014) will be adhered to. In their approach they distinguish between five types of tasks – analytical non-routine tasks, interactive non-routine tasks, cognitive routine tasks, manual routine tasks and manual non-routine tasks – and compute the share for which every type of tasks accounts with regard to a certain profession. To apply their concept to the frontier worker data, a further aggregation from KldB to FAP level was conducted using technique and 2013 data from their paper as well as employ-ment data from the BA employment statistics.
As pointed out before, since the degree of certification and regulation as well as the tasks shares remain (relatively) constant for the different professions over time, their impact cannot be measured separately in the fixed effects model. Instead, an alter-native technique will be used to integrate these regressors into the model: the Haus-man-Taylor estimator is based on an instrumental variable approach and allows to estimate coefficients for time-invariant variables while taking into account the correla-tion between a number of explanatory variables and the profession-specific effects (Model_2). For this purpose, the independent variables are categorized into time-var-iant vs. time-invariant and exogenous vs. endogenous regressors, the latter distinc-tion describing whether a correlation with the profession-specific effects exists or whether it does not. In this context, the newly integrated regressors measuring certif-icate standardization and task composition as well as the time fixed effects are con-sidered to be exogenous, as opposed to the other explanatory variables who are pre-sumed to be endogenous. Robust standard errors are, however, not available for this estimator in Stata, which should be taken into account when interpreting the results (StataCorp 2017: 200-212; Verbeek 2012: 387-388).

IAB-Discussion Paper 2/2018 61
Lastly, an additional alternative estimation of the fixed effects model (i.e. Model_1) will be conducted using a slightly differently aggregated dependent variable. Instead of computing the total number of days worked by French frontier workers in Baden by using the weights mentioned above (1 for full-time jobs, 0.5 for part-time jobs and 0.2 for marginal employment), part-time employment will be weighted with 0.6 in the al-ternative model, taking into account that a share of part-time employees might work more hours than 50 percent of a full-time position would entail (Model_3). Based on this new formula, it can then be checked if and how the results of the estimation change.
5.3 Presentation and Interpretation of the Results Estimating the models specified above using Stata, the results depicted in table 2 can be obtained, showing the estimated coefficients for the two models as well as the p-values:
Table 2 Estimation Results for Model_1, Model_2 and Model_3
Variable Model_1 (Fixed
Effects)
Model_2 (Hausman-
Taylor)
Model_3 (Fixed Effects with different
weight for part-time
work) Gross daily wages in Baden (ln) 0.5192
0.5790 0.5192 0.5060
0.4902 0.5984
Average completed vacancy peri-ods (ln) in Baden
0.1325 0.0663
0.1325 0.0073
0.1400 0.0648
Ratio of unemployed to vacancies (ln) in Baden
0.0710 0.2064
0.0710 0.1482
0.0655 0.2282
Tension indicator (ln) in Alsace (ratio of vacancies to inflow and stock of unemployed)
-0.0668 0.0529
-0.0668 0.0461
-0.0650 0.0627
Difficulty indicator in Alsace -0.0134 0.7188
-0.0134 0.7218
-0.0144 0.6901
Share of days worked by female frontier workers
0.6931 0.2955
0.6931 0.1840
0.5754 0.3816
Share of days worked by individu-als with education level 1
2.2921 0.1142
2.2921 0.0166
2.1719 0.1258
Share of days worked by individu-als with education level 2
0.6138 0.6722
0.6138 0.5803
0.5570 0.7000
Share of days worked by individu-als with education level 3
1.2848 0.3242
1.2848 0.2043
1.1613 0.3559
Share of days worked by individu-als with age 15-24
3.4396 0.3370
3.4396 0.4235
2.9655 0.4112
Share of days worked by individu-als with age 25-34
2.9818 0.3828
2.9818 0.4897
2.6620 0.4375
Share of days worked by individu-als with age 35-44
1.9842 0.5329
1.9842 0.6338
1.6412 0.6068

IAB-Discussion Paper 2/2018 62
Variable Model_1 (Fixed
Effects)
Model_2 (Hausman-
Taylor)
Model_3 (Fixed Effects with different
weight for part-time
work) Share of days worked by individu-als with age 45-54
1.7756 0.5890
1.7756 0.6653
1.3626 0.6793
Share of days worked by individu-als with age 55-64
1.5998 0.6332
1.5998 0.7004
1.0579 0.7530
Year fixed effect for 2013 0.0068 0.8723
0.0068 0.8410
0.0121 0.7634
Year fixed effect for 2014 0.0176 0.7922
0.0176 0.7562
0.0279 0.6662
Year fixed effect for 2015 -0.0062 0.9450
-0.0062 0.9331
0.0057 0.9480
Weighted share of professions with standardized certificates
-3.4271 0.2043
Weighted share of regulated pro-fessions
1.3830 0.6106
Share of interactive non-routine tasks
6.3158 0.1344
Share of cognitive routine tasks 18.4055 0.0036
Share of manual routine tasks 9.5105 0.0255
Share of manual non-routine tasks
7.9161 0.0095
Constant 5.2590 0.4256
-0.8098 0.8851
5.9432 0.3628
Source: Stata output; own depiction
The table lists the logarithmized number of days worked by French frontier workers, followed by the Baden gross daily wages, the four shortage indicators listed above, the control variables for sex, level of education and age as well as the year fixed effects. In addition, the Hausman-Taylor estimation of Model_2 also provides coeffi-cients for the impact of standardization and regulation as well as the distribution of task types. The profession-specific fixed effects have been taken into account in the computations despite not being listed separately.
These estimates can now be interpreted against the background of the push and pull model and the cross-border labor market in the French-German Upper Rhine Region. The panel regression makes it possible to identify the effects of the shortage indica-tors on the number of French frontier workers in Baden, showing how individuals in Alsace react to changes in the labor markets on both sides. As stated above, other potential influences like age, education and sex, extraordinary events in certain years and particular characteristics have been controlled for so that a more precise estima-tion of the isolated effect of each indicator could be provided. The accompanying p-values allow an assessment of whether the identified effect is likely to have occurred

IAB-Discussion Paper 2/2018 63
by coincidence in the data and thus may not exist in reality or whether the results would have hardly been encountered if the variables did not actually exert such ef-fects.
Starting with the Baden shortage indicators, the coefficients for both the average com-pleted vacancy periods and the ratio of unemployed to vacancies exhibit a positive sign (Model_1). The positive effect of the former confirms the expectations: if vacancy periods become longer, this can indicate a shortage of labor and, all else equal, should thus attract – or “pull” - more cross-border workers to the region under the assumption of an integrated market. Moreover, the coefficient is significant at the 10 percent level, suggesting the presence of such an effect beyond coincidence. The ratio of unemployed to vacancies, on the other hand, would have been expected to negatively impact the number of frontier workers. It seems counter-intuitive that the number of French frontier workers would increase if more unemployed were available for one vacancy in a certain profession. The coefficient is not significant at the 10 percent level in this estimation, neither in the other two models, potentially hinting at some coincidental patterns in the data.
With regard to the Alsatian shortage indicators, both coefficients signal a negative effect on the number of frontier workers as to be expected: if the tension in a certain profession increases in the home regions, i.e. if more vacancies are available for the unemployed, then Alsatians have less incentive to work across the border, at least not from a labor market perspective; they are not “pushed” towards cross-border com-muting or migration. Analogously, if recruitment is deemed to have become more dif-ficult on the French side of the Rhine by the local companies, it presumably implies that the respective professionals have greater chances of finding employment in their region and do not need to work in the neighboring country. Whereas the former indi-cator is significant at the 10 percent level, the effect of the latter cannot be assumed to be observed in reality with sufficient confidence. A potential explanation might be found in the compilation of the indicator which synthesizes (subjective) assessments voiced by companies; their impressions and expectations are influenced by factors beyond the mere labor market situation (e.g. inadequate skills of applicants) (Statis-tiques, Études et Évaluations de Pôle emploi Grand Est 2017a: 3-4) which might therefore not always concur with how the situation is perceived by the Alsatian work-ers and employees facing the decision of cross-border commuting or relocation. The predicted positive effect of the wages earned in Baden presents as anticipated, but has to be considered somewhat cautiously with regard to the high uncertainty accom-panying the estimation of this coefficient.
Having discussed the direction of the shortage indicators’ impact, the size of their estimated effect on the number of days worked by French frontier workers can also be taken a closer look at. Since except for the (insignificant) difficulty ratio all shortage variables have been included into the model in their logarithmic form, the coefficients represent elasticities, as stated above. For example, the estimation would predict that
IAB-Discussion Paper 2/2018 64
if the average completed vacancy period of a profession were to increase by 1 per-cent, the number of frontier workers would grow by 0.13 percent; the effects of the ratio of unemployed to vacancies and the tension indicator can be interpreted analo-gously.
When comparing the development between the first and final year of the observation period, for instance, the average completed vacancy periods in Baden increased by 45.00 percent between 2010 and 2015, whereas the Alsatian tension indicator as computed before fell by 17.74 percent (DIRECCTE Grand Est 2017; Pôle emploi De-mandeurs). According to the estimation, these complementary developments would have motivated an additional 1,412 Alsatians to work across the border, all else equal. These numbers therefore illustrate that the impact of changes in these indicators re-mains rather modest in terms of absolute numbers of frontier workers in the border region.
Moving on to the impact of education on the number of French employees in Baden, it should first be recalled that a rather large portion of the individuals in this data set was assigned category 1 of this variable, i.e. their degree was unknown, most likely due to the differences between the educational systems in Germany and France. Nevertheless, the estimation results suggest a positive effect of university-level de-grees on commuting and relocation to Baden, more precisely that a profession with a larger share of highly educated individuals (e.g. by one percentage point) and a cor-responding smaller share of workers with no vocational degree is accompanied by a 1.28 percent higher number of frontier workers than the baseline, all else equal. Con-trary to that, the effect of an Abitur or a dual vocational degree according to the Ger-man system appears to be less pronounced in this context with a noticeably higher p-value.
Moreover, the Hausman-Taylor estimation (Model_2) conveys an idea of whether the number of frontier workers is affected by the existence of certain access qualifications for the different professions. The estimation was conducted under the assumption that the newly integrated variables are not correlated with the unobserved profession-spe-cific effects (StataCorp 2017: 200-212), which could, of course, represent a potentially serious restriction in this context. Keeping also in mind that the respective standard errors might be distorted due to heteroscedasticity, it cannot be concluded that regu-lated professions are more or less favored by French frontier workers since the cor-responding coefficient is found to be insignificant. With regard to professions that are associated with a standardized certificate, the direction of the estimated effect follows the expectations for a cross-border market: The higher the degree of standardization, the lower the number of French frontier workers in this professional field who will in most cases not have obtained this specific German qualification. Expressed numeri-cally, if one occupation’s degree of standardization exceeded another one’s by one percentage point (0.01), then the number of frontier workers in the two professions would be expected to differ by 3.43 percent, which constitutes a noticeable effect. The coefficient cannot be found to be significant at the 5 percent or 10 percent level in this

IAB-Discussion Paper 2/2018 65
estimation, so it cannot be confirmed within these levels of confidence that such an effect actually exists, although it seems likely from a theoretical point of view.
To name some examples, the highest degree of standardization of certificates can be observed for public administration and related occupations (0.91, with 1 occurring if all professions are associated with a standardized certificate), followed by trade and commerce (0.79), manufacturing professions (0.76), and occupations in health, edu-cation and social services (0.74). To illustrate the size of the identified effect, looking at the 0.12 difference between the first two occupational groups of this list, the model would predict a considerable 41.13 percent fewer frontier workers in public admin-istration than in trade and commerce. The regulation indicator, on the other hand, takes on considerably lower values, the maximum amounting to 0.46 for healthcare and education occupations. It therefore seems that noticeably more professions are affected by certificate standardization than regulation and that this feature constitutes a barrier with regard to cross-border mobility. Moreover, regulated professions have received attention on EU-level, resulting in the creation of a database and a collection of points of contacts, which potentially reduces the adverse effect of this characteristic at the French-German border (European Commission Database).
Regarding the composition of tasks for the different professions, the coefficients are to be interpreted relative to the omitted reference category, i.e. task type 1: analytical non-routine tasks. So if a certain professional group contained a one percentage point higher share of type 5 tasks and a corresponding lower share of type 1 tasks, all else equal, then the model predicts a 7.92 percent higher number of frontier workers in the former profession than in the latter. According to this prediction it thus seems that occupations with high shares of analytical non-routine tasks attract comparably fewer frontier workers, which might partly result from the particular presence of the language barrier for these activities. The highest shares for this type of tasks can be found in occupations related to information technology and computer science as well as public administration or judicial professions. Interactive non-routine tasks – most prominently required in trade and commerce as well as healthcare and education professions – are somewhat favored as compared to the former, presumably because a portion of the frontier workers in these jobs may be hired explicitly to interact with French clients or customers.
Professions with a high share of routine tasks, cognitive as well as manual ones, rel-atively attract the highest number of cross-border commuters, which can also possibly be traced back to the lower importance of spontaneous and non-habitual communi-cation generally associated with such tasks. Examples for occupations with important shares of these tasks include manufacturing jobs, professions in business administra-tion and banking as well as agriculture. Except for task type 2, these effects are very significant based on the non-robust standard errors. A closer look at the role of lan-guage skills, which might constitute the foundation for these discrepancies as sug-gested above, is taken in section 6. On the other hand, it should be noted at this point

IAB-Discussion Paper 2/2018 66
that given the high number of observations for which the level of education was la-belled 1 (i.e. unknown) as explained before, this influence might not have been suffi-ciently controlled for, which could become relevant when considering that type 1 tasks require in general a higher level of education than type 4 tasks and that the average French frontier worker in Baden tends to be rather low qualified as outlined in section 4. The positive effects could therefore also partly result from frontier workers favoring manual professions over analytical ones due to their level of qualification.
Lastly, when aggregating the independent variable in a different way as described above, the direction and magnitude of the effects bear close resemblance to the first model, although some small changes in the coefficients can be observed (Model_3). The robust standard errors increase for most variables, but especially with regard to the shortage indicators these changes are rather small. In general, the alternative model identifies by and large the same effects as the original one and thus allows assuming that the aggregation technique of the independent variable plays a compar-atively minor role in determining the estimation results.
Summarizing the findings of this section under the perspective of labor market inte-gration, it can be stated that the estimated models do suggest a balancing cross-border reaction to labor market disparities, yet on a modest scale in terms of absolute numbers. Alsatian workers seem to be “pulled” to Baden by occupational shortages as implied by long average completed vacancy periods or “pushed” from their home region by the absence of bottlenecks suggested by low tension indicators as expected in an integrated market, but the associated coefficients were shown to be comparably small. At the same time, perfect integration seems to be hampered by the impact of standardized degrees as shown above, which can cautiously be assumed to exert a negative effect on the number of frontier workers with all other factors remaining un-changed. Moreover, the effect of the task distributions on the number of frontier work-ers also appears to somewhat contradict a perfectly integrated labor market, poten-tially pointing towards the prevalence of a language barrier between the regions.
6 Qualitative Assessment of Cross-Border Mobility Having analyzed the push and pull effect of the labor market situations on both sides of the Rhine, the previous section already started to examine some barriers for cross-border mobility between Alsace and Baden. In the following section, further obstacles and restrictions for a regionally integrated labor market will be addressed in a more qualitative manner, both with regard to general cross-border employment and with regard to cross-border vocational education.
The section combines findings from existing research with assessments obtained from ten expert interviews conducted for this project. Representatives from regional employment administrations, chambers of industry and commerce as well as political and municipal institutions, among others, were asked to give their opinion on cross-border employment and vocational programs. As recommended by Meuser/Nagel (2009) and adhered to by many researchers for this purpose, the expert interviews

IAB-Discussion Paper 2/2018 67
were conducted based on a guideline of questions thematically structuring the con-versation, which was meant to ensure that the focus was kept on obtaining the rele-vant information on the one hand and to allow the experts to narrate and point out relevant issues themselves on the other hand (Liebold/Trinczek 2009: 32, 35-37). Limitations of this method generally include the difficulty of balancing structure and openness in the interviews and in the analysis as well as the fact that the interviewees are naturally not mere containers of subject-related knowledge but also factor in their own experiences and attitudes (Liebold/Trinczek 2009: 53-54). The guideline ques-tions were sent to the interviewees 2-3 weeks in advance. A list of the questions can be found in the appendix, as well as a list of the interview partners; following Liebold/Trinczek (2009: 41-44), pauses, laughter, etc. have not been included in the latter. In a next step, the interviews were categorized and the resulting sections la-belled according to their main points; these thematic sections were then analyzed in a comparative manner.
6.1 Obstacles and Restrictions for Regional Labor Mobility Starting with a rather basic question, it is worth asking, for example, whether Baden constitutes an attractive region of destination for Alsatian jobseekers and employees. One point that was repeatedly mentioned in the interviews was the higher level of salaries in Germany conditioned by the higher level of taxes, which leads to a higher net income for frontier commuters when combined with the French system of taxation, as also pointed out by Pilger, Meindl, Hamann (2011: 35). One French interviewee also remarked that manual occupations were valued more highly across the border. On the other hand, working hours tend to be longer in Baden and the minimum wage is lower.
Moreover, especially in Southern Alsace, an important portion of the labor force is attracted to Switzerland. Numerous interview partners cited the significantly higher levels of salaries, also for unskilled work, as the primary motivation for the decision to commute, accompanied by the favorable exchange rate and the lower cost of living faced in the Alsatian place of residence. An excellent train connection from Mulhouse to Basel and attractive working conditions in the field of nursing, for instance, are also found among the pull factors that render Switzerland a more attractive destination than Germany where salaries cannot compete and are paid in euro, thus forgoing exchange rate advantages. Whereas this constellation helps to explain comparably low commuting numbers to Germany, frontier workers also face some conditions that could discourage them from taking up employment in Switzerland. For example, for-eign nationals are subject to different regulations regarding termination; in addition, the recently adopted initiative against mass immigration resulted in insecurity about the future situation of foreign workers, one interviewee also mentioned an increase in mobbing in this context. The statements regarding Switzerland’s attractiveness match the results of a 2015 joint study which found that more than eight times as many 15-29-year-olds from the département Haut-Rhin chose the Swiss over the German labor market (Agentur für Arbeit Freiburg, Maison de l’Emploi 2015: 14). Their motivation

IAB-Discussion Paper 2/2018 68
was examined in another project: especially low-skilled young people cited high sala-ries as their principal motivation to commute to Switzerland. Although Baden is well-known to young people living near the border due to free-time activities, often no per-sonal connection exists and lower salaries paid in euro seem to demotivate potential young commuters (Goulet 2015: 3).
The conversations with the regional experts confirmed that given the demographic development, the Ortenau district in Baden would increasingly depend on migration and frontier workers, also to fill open positions for apprentices; at the same time, re-tirement effects are also starting to be felt in Alsace. Whereas the unemployment fig-ures seem to clearly motivate increasing numbers of Alsatian frontier workers in Ger-many, the issue of imperfect complementarity of the labor markets as examined in section 3 was addressed in the interviews as well. One interviewee presented the situation in the following way: according to him, many of the Alsatian unemployed are rather poorly qualified and thus not immediately needed across the border where the corresponding type of occupations is filled with local low-skilled individuals and po-tentially a share of the newly arrived migrants in some years in the future; on the other hand, well-qualified Alsatians can easily find a job in their home region as well, creat-ing rather a situation of competition in some areas as confirmed by a 2011 study (Beck, Rihm 2011: 34-35). This matches the numerical results obtained in the prior analysis. Therefore it was informally agreed upon that, for example, Baden employ-ment agencies refrain from actively trying to attract Alsatians working in occupations that also represent bottlenecks across the border. It was also emphasized that the Upper Rhine Region as a whole stood in competition for qualified professionals with other regions in Europe, a context in which the border could serve as an attractive element.
Eventually, as pointed out by interviewees on both sides of the border, the decision to work in the neighboring country is a rational one motivated by factors such as sal-ary, job security, etc. in comparison to the necessary effort rather than by an innate desire to cross the border. A major obstacle frequently cited in this context is the cost and time of commuting from Alsace to Baden. The interview partners rather broadly agreed that cross-border public transportation was not sufficiently available, but was indeed rather an exception that occurred in cases actively pushed by politicians, like the bus line connecting Alsace to a new Zalando site in Baden. Whereas a new street-car line has just been opened between Kehl and Strasbourg, problems occur espe-cially in areas between the agglomerations, and even the connection between Frei-burg and Mulhouse was described as unsatisfying and not featuring enough daily trains, in particular when compared to the frequent and direct service between Mul-house and Basel. At the same time, while Freiburg offers a comparably large labor market, many firms are also located in Black Forest valleys that are not easily acces-sible without a car. Moreover, both public transportation and commuting with a private car are expensive and time-consuming, taking also into account traffic jams at the limited number of bridges across the Rhine which can further deter potential frontier workers.

IAB-Discussion Paper 2/2018 69
Correspondingly, the previously mentioned study on young Southern Alsatian frontier workers found that many of the commuters lived close to a bridge over the border river. Numbers of young commuters from border-adjacent towns were low because of the satisfying local employment situation, whereas according to the study those work-ers who lived further away from the border were prevented from commuting due to insufficient public transportation, for example to Freiburg; in fact, it was stated that 90 percent of the frontier workers in Germany used a private car (Agentur für Arbeit Frei-burg, Maison de l’Emploi 2015: 24-25). High commuting costs, unsatisfying public transportation and the preference for workplaces close by are also found among the general reasons for the low commuting flows from Southern Alsace to Germany listed in a 2015 regional study (Maison de l’Emploi et de la Formation du Pays de la Région Mulhousienne 2015: 16). While the issue receives political attention and plans exist for a new train connection between Colmar and Freiburg, for instance, these projects take time given that both countries need to agree and settle questions regarding fund-ing. To mention a related case, with regard to the recently completed project of re-building the streetcar line between Strasbourg and Kehl, an EU working group found a significant loss of time and the emergence of high costs because the French street-cars did not meet all German regulations for these vehicles (Working Group on Inno-vative Solutions to Cross-Border Obstacles 2017: 5).
Whereas transportation was broadly perceived as an obstacle by the contacted ex-perts, the issue of language skills received a somewhat more mixed feedback in the interviews. It was agreed upon that German skills had deteriorated in Alsace during the past decades and that the language was mostly not taught within the families anymore. This impression is confirmed by findings of the Office pour la langue et les cultures d’Alsace et de Moselle (Office for the language and cultures of Alsace and Moselle), stating that 43 percent of the population identified themselves as dialect speakers18 in 2012, in comparison to 61 percent in 2001, 63 percent in 1997 and 90.8 percent in 1946. Apart from the 43 percent who had good knowledge of the dialect in 2012, an additional 33 percent answered that they could speak or understand a little bit of Alsatian. Within the families, most participants spoke Alsatian (almost) always with their grandparents or parents rather than with their children. Correspondingly, in 2012, 74 percent of the senior Alsatians (60 years and older) had a profound knowledge of the dialect, as opposed to 12 percent of the 18-29 year-olds and 3 per-cent of the 3-17-year-olds (Office pour la langue et les cultures d’Alsace et de Moselle Le dialecte). As stated in the conversations with the regional experts, efforts are made in the educational system, where bilingual classes are promoted and many or at least more students than before do learn German, although the discrepancy between stud-ying a language at school and using it in the working life must be taken into account at this point. Another interviewee pointed out, however, that English was usually the first foreign language taught on both sides of the border. Looking at the numbers,
18 In Alsace, different dialects are spoken whose written form is standard German (Finck,
Hartweg, Matzen, Philipp, M. Definition).

IAB-Discussion Paper 2/2018 70
almost all students in the Alsatian primary level received either three hours of German classes a week or participated in a bilingual program including an equal number of classes in French and German in 2016/2017. 74.1 percent of the students continued to learn German in the collège and started to learn English at the same time. In total, 82.73 percent of the students in the collège or the lycée, including the lycée profes-sionnel, studied German at school in 2016, compared to 94.61 percent who studied English (Rectorat de l’académie de Strasbourg Chiffres: 32).
As to whether insufficient German language skills constituted a practical obstacle to cross-border work, some disagreement could be observed: while some interview part-ners mentioned this issue, another one pointed out that given the high number of commuters from Southern Alsace to the German-speaking part of Switzerland, lan-guage could not represent a major barrier. Both arguments can also be found in recent studies. For example, it seems that young frontier workers from southern Alsace are partly exercising jobs below their level of education potentially due to insufficient lan-guage skills. Despite mostly having been come into contact with German during their education, they perceive the language as a substantial obstacle (Goulet 2015: 4-5, 7). Furthermore, another project identified changes in the required qualifications for frontier workers (i.e. fewer employment opportunities in sectors requiring a low level of German language skills and increasing employment opportunities in sectors requir-ing a high level of language skills) as one of the key challenges for the cross-border labor market (Beck, Rihm 2011: 31-33). On the other hand, the former paper also admitted that the overwhelming majority of young Alsatian commuters to Switzerland worked in the German-speaking part of the country, weakening the language barrier as an argument for the low numbers of young French frontier workers in Germany (Goulet 2015: 2-3); a study on the Southern Alsatian region in general arrived at a similar conclusion (Maison de l’Emploi et de la Formation du Pays de la Région Mul-housienne 2015: 16). The results of section 5 indicated indeed an impact of language requirements for a certain profession on the corresponding number of frontier work-ers, but their estimation was also subject to some limitations. Without being able to draw a definite conclusion, it seems likely that especially the perception of German skills as an obstacle to working across the border should not be neglected when con-sidering determinants of cross-border mobility.
Other factors often presented as an obstacle for frontier workers include differences in national administrations such as taxation systems and social security regulations (Nerb, Hitzelsberger, Woidich, Pommer, Hemmer, Heczko 2009: 47, 52, 54-55). Whereas several interviewees reflected on this topic and pointed out the existing com-plications – one example would be the different definitions of the frontier worker status in social security and taxation laws - , it was also the common opinion that these particularities did not present an actual deterring obstacle, especially given the estab-lished network of consultants in this field.
A somewhat stronger negative influence on cross-border mobility seems to be exerted by insufficient or distorted information on the neighbor’s labor market. Two interview

IAB-Discussion Paper 2/2018 71
partners explained that employment in Germany was often reduced to 1 Euro-jobs, 400 Euro-jobs, fixed-term contracts and, until recently, the lack of a minimum salary in the perception of French workers. Moreover, differences regarding the customary application documents or the company culture, for example, create additional poten-tial for misperceptions. An issue that was brought up frequently in the interviews was the practical lack of comparability of degrees and qualifications maintained in the very different educational systems, which made it difficult for employers to determine the competences of a cross-border applicant. A 2009 study confirmed this negative effect of insufficient information and difficulties regarding the recognition of diplomas at the French-German border, as do the results on the effect of standardized certificates computed in the previous section (Nerb, Hitzelsberger, Woidich, Pommer, Hemmer, Heczko 2009: 45, 49-51). One interviewee from Southern Alsace also gave an as-sessment of the general stance towards mobility in the region, which according to him had the least mobile population in France: in his opinion, many people as well as authorities had not yet recognized or admitted the problem of comparably high re-gional unemployment, given that the situation used to be rather favorable until the 2000s, and maintained a mindset in which the necessity for a mobile workforce was not predominant.
Regarding the cross-border cooperation between the relevant institutions in the fields of employment, vocational education and vocational guidance, the feedback was highly positive on the status quo as well as on the development over the past years. The region seems to be well-equipped with instruments for dealing with cross-border challenges, as also elaborated on in section 2. In addition, representatives of the Ger-man regional employment agencies of Freiburg and Offenburg are members of the board of the French employment institution Maison d’Emploi; in turn, the French insti-tutions attend the corresponding board meetings in Baden as well. In terms of imple-mentation, one example for the increasing coordination in the region would be the consideration of German labor market needs by the région Grand Est when designing their skill development programs. The cooperation was described as on the point ra-ther than vague or non-binding; on the other hand, some challenges occur due to the different political structures and distribution of competences in the two countries. Given the multitude of actors involved, careful coordination and inclusion of all rele-vant institutions seems crucial and can give rise to duplications of effort or frictions if neglected. In some cases, cross-border work is also complicated by national policies. A recent example includes the posting directive adopted by the French government, which significantly increases the cost of sending workers to Alsace for Baden compa-nies; on the other hand, toll charges on German roads prompted a corresponding reaction in Alsace.
Some of the measures recently taken in the region to face these challenges have already been described in section 2 of this paper; to mention all programs and initia-tives in detail would exhaust the scope of this project. According to the interviewees, the focus is, among others, currently placed on remedying the lack of information on

IAB-Discussion Paper 2/2018 72
employment in Baden, by means of informational events, publicity campaigns, com-pany visits, an image movie, etc. Moreover, the services for cross-border placement jointly operated by Pôle emploi and the BA are cited as a continuing tool for integration of the Baden and Alsatian labor market, which can serve as a supraregional locational advantage as seen in the case of the newly opened Zalando site. A common website for the different cross-border placement services is also envisaged. In addition, nu-merous services are available for individuals interested in working in the neighboring country, although one interviewee also suggested some further improvements with respect to this process. Furthermore, drawing on a previously mentioned study, one approach to reduce the demotivating effect of private commuting cost that is experi-mented with in the Mulhouse region is incentivizing car-sharing; the study also asks for an improvement of public transportation, however (Agentur für Arbeit Freiburg, Maison de l’Emploi 2015: 24, 26).
The interview partners were also asked to name potential measures or starting points for further reducing the obstacles outlined above and increasing mobility across the Rhine. Their answers included increasing information, providing more language clas-ses in addition to the existing ones offered by the région Grand Est (which is currently being discussed), promoting continuing education also with regard to German labor market needs and expanding cross-border public transportation, for example. The recognition of diplomas or their equivalence was wished for as well, but at the same time characterized as extremely difficult to achieve.
6.2 Challenges Regarding Cross-Border Vocational Education Apart from the general case of frontier employment, special attention should also be directed towards cross-border vocational training at this point, whose framework was outlined in section 2 of this paper. Given the increasing tensions between vacancies and applicants in some professions in Baden as examined in section 3, remaining obstacles encountered by applicants and participants are to be discussed in the fol-lowing to assess further potential for mobility in this area.
Before analyzing barriers associated with the cross-border vocational education model, a brief overview of the characteristics of the participants in these programs helps to gain a more comprehensive impression of the concept. First of all, it should be noted that of the 340 contracts regarding cross-border dual vocational education or dual courses of study that were concluded between 2010 and 2017, 13 placed a German applicant in a French company whereas the remaining 327 brought together German companies and young Alsatians. This distribution is in line with the discrep-ancy in youth unemployment rates between both sides of the border and matches the recruiting difficulties in some occupations in Baden. Participant numbers increased steadily to a total 87 newly concluded contracts in 2015 and fell to 67 in the following year. Since 2014, the shares of contracts over dual vocational education programs and dual courses of studies according to the German definition has been approxi-mately equal; yet it should be pointed out, that the vast majority of the participants
IAB-Discussion Paper 2/2018 73
(70.88 percent) aims at achieving a post-bac degree, i.e. is already in possession of a Baccalauréat (Leroy, Seitz, Hilligardt 2017).
As stated before, one of most important steps taken in this area was the framework agreement adopted in 2013, which created a framework for completing the school-based portion of the program in the home country and the practical elements in a company on the other side of the river Rhine. According to one interviewee, this meas-ure constituted a reaction to the high youth unemployment in Alsace, the lack of ap-prentices in Baden and the decreasing German skills of Alsatians which made the completion of the entire program in Baden very difficult. The agreement was assessed as a pragmatic step that reduced various the obstacles by some of the experts; the immediate extension to all professions, however, was believed to have created more difficulties than a scenario in which the model would have applied only to a few pro-fessions at first, for example the 16 occupations identified as sufficiently similar in educational structure during an earlier project in the Eurodistrict Strasbourg-Ortenau.
Analogously to cross-border employment, insufficient language skills constitute an obstacle to the success of this approach, although the interviewees somewhat disa-greed about the degree of severity of this effect. Missing (efficient) public transporta-tion in some regions, on the other hand, particularly affects apprentices, since espe-cially when aiming at a Baccalauréat or a lower degree this group often does not possess a driver’s license or cannot afford a private car. It was also presented as questionable if the monthly mobility grant of 70 Euro that cross-border apprentices can obtain would cover the cost of a vehicle. In addition, the point was made that due to their young age, some potential candidates for such programs were not mature enough or did not dare to face this challenge in another country; support of the family, also with regard to physical mobility, seems to be crucial in this context.
Furthermore, several interviewees described the tangible conditions of doing an ap-prenticeship in a German company as rather unattractive for young Alsatians on the first glance: payment is usually lower than in Alsace, working hours are longer, the number of vacation days lower; moreover, according to the cross-border model, the apprentices do not automatically receive the German vocational degree and are con-sequently potentially hired on a lower level than their German counterparts after fin-ishing the program. Of course, the program also comes with advantages, such as comparable job security, but it was also questioned by one interviewee if enough ad-ditional value was created by the program for apprentices that will later often work locally in Alsace (such as bakers, etc.), given the difficulty and required effort associ-ated with the participation. According to the interviewee, this did not apply for cross-border academic studies which received a much higher interest, as confirmed by the disparity between infra-bac and post-bac participants.
The interview partners also commented on the issue that apprentices who complete the school-based portion of their education in their home country and the practical part with a company in the neighboring region received the respective degree of their
IAB-Discussion Paper 2/2018 74
home country, not (automatically) of the neighboring country. Once a French appren-tice finishes the two years often required for the French degree, for example, they can either discontinue the vocational education with the Baden company since the Ger-man program usually takes longer, potentially become regularly employed in the com-pany they trained in or continue their education including attending school in Germany until they obtain the German degree as well. When asked about the model, several interviewees favored an automatic double qualification with regard to the effort re-quired from the apprentice and the better chances on the German labor market. As pointed out in one conversation, asking French apprentices to continue their educa-tion in Germany after having already graduated in their home country, at the same level as local students who are not required to have passed an Abitur, proves to be very difficult since it does not sufficiently value their degree in their perspective. On the other hand, since in terms of absolute numbers more French professional degrees exist than German ones, which are moreover awarded by a variety of institutions, comparability continues to be extremely challenging, as explained by another inter-viewee.
Another point that was strongly emphasized by almost all interview partners was the major discrepancy in the image of dual or company-based vocational education in the two regions. Whereas in Germany these programs constitute a valid alternative to university studies and often offer bright career perspectives, they are usually consid-ered as a path (only) for students not qualified to continue on the academic course in Alsace. The French educational system was described as rather hierarchical, making the academically highest degrees the most desirable ones and filtering out students to less prestigious options on the way. This depiction matches the findings outlined in section 3, i.e. the higher share of apprentices among participants in lower infra-bac degree programs than students at a lycée professionnel, for example. Also with re-gard to a political directive from the 1980s which set the target for the share of stu-dents passing a Baccalauréat at 80 percent or more, the preference for a school-based education and further studies is rather pronounced among the French popula-tion, stronger than in Germany where a similar development has started more re-cently, however. Consequently, given that especially apprenticeships leading up to a Baccalauréat or a lower degree (i.e. infra-bac) are mostly considered as a path for academically weaker students, cross-border apprenticeships seem equally little at-tractive. As one interviewee put it, the educational systems are incompatible to a cer-tain degree: whereas the German dual education does not correspond to the CAP degrees, i.e. the first and rather low professional degrees, it would also be inadequate to automatically subsume programs organized as academic studies in France into the dual vocational system even if these occupations were taught that way in Germany. It might be the case that a post-bac young Alsatian, which holds for the majority of the participants, interprets their program as a dual course of study due to the French de-gree they are pursuing, whereas the German company employs them as a regular apprentice, a status applying to about 50 percent of the participants (Leroy, Seitz, Hilligardt 2017: 2). According to the interviewed experts, the challenge consists in

IAB-Discussion Paper 2/2018 75
communicating the prestige and career possibilities of a German-type dual education, which of course represents an almost opposite stance to the perception that has de-veloped in France over the past decades.
Other factors that were cited in the interviews as curbing the success of cross-border vocational education included a lack of knowledge and interest among young people for the neighboring country and a lack of information among German employers about the material taught in the French schools, rendering the education of an Alsatian ap-prentice more complicate from their perspective. In addition, two interviewees pointed out the different application timelines: Whereas in the French system, students only apply for apprenticeships or continuing schools in the summer of the year they grad-uate, German companies often receive applications one year before the starting date of the program. Apart from the practical issues arising from this constellation, presum-ably “late” applications might give potential German employers a wrong impression about the quality of the candidate. On an administrative and political level, it was re-marked by one interviewee that an event like the award ceremony of the previously mentioned Euregio certificates, which was meant to create encounters between young French and German citizens, was scheduled for a date during the French school vacations. Criticism was also voiced by this interviewee that more effort by German employers was required to use short internships to advertise vocational ed-ucation programs in their company and to provide more assistance to French appren-tices regarding the difficulties they face and that a lack of readiness to adapt to the French mentality and educational system could be observed. A positive example men-tioned more than once was the program conducted by the Badische Stahlwerke, who recruited young Alsatians with a difficult background and offered a year of preparation for taking on a vocational education in Germany.
A study in the Eurodistrict Strasbourg-Ortenau, which categorizes frontier workers and examines the resulting types with regard to their potential to be activated for cross-border vocational education, finds the most promising target group to be hold-ers of a Baccalauréat who are pursuing a dual or partly company-based course of study in France and who are both mobile and have acquired some German and Eng-lish skills at school. These individuals need to be provided with an attractive offer from a German company which advances their career in order to participate. In contrast, among those who are studying at a university and have access to international expe-rience, it seems that Germany is not perceived as the most attractive destination as compared to Switzerland, for example. Low-skilled workers without German or dialect language skills, on the other hand, are difficult to activate for cross-border work or education. A key demand voiced by the authors of the study is the need for German companies to better understand and accept the French educational system and to adapt their reception in order to attract workers and qualified applicants for cross-border vocational education programs early on, which was also mentioned in the in-terviews. In general, a positive attitude towards cross-border mobility existed among both the companies and the candidates, yet both parties lacked important information

IAB-Discussion Paper 2/2018 76
about the other region. The report also confirms the ambiguities in terminology men-tioned above: according to the study, the concept of cross-border vocational educa-tion as defined in the 2013 agreement is interpreted differently by the contracting par-ties. Whereas in Germany the term is associated with a dual apprenticeship after the German model, in France all kinds of company-based vocational education in different programs is included. Three possibilities for reducing obstacles related to the different systems are presented: an informal adjustment of the companies towards the French approach, the recognition of equivalent programs or the creation of new programs taking into account both French and German idiosyncrasies (dfi, EURO-Institut Kehl, Strasbourg Conseil 2014: 4-7, 12-14, 53).
Measures mentioned in the interviews that promote cross-border apprenticeships in-clude the Euregio certificate and Azubi-BacPro, for example, as explained in section 2. Moreover, much effort is put into outreach and communication, i.e. the promotion of the cross-border model, presentation at fairs, communication of positive examples, training of apprentices to inform their peers about their program, etc. By cooperating with the Académie Strasbourg and Alsatian schools, awareness for such a path is tried to be increased in the professional orientation phase of Alsatian students. Visits or one-week internships in German companies funded by INTERREG have also been conducted. In spite of the discrepancies in youth unemployment, however, an inter-viewee also warned about an exaggerated perception of the situation. Not all indus-tries in Baden lack skilled workers as confirmed before, not all young Alsatians are unemployed, but these more extreme impressions can lead to the expectation that the respective other side needs to adapt, since it is presumably them who face the shortage of apprentices or jobs. Correspondingly, one interviewee voiced the concern that it often seemed to be regarded as the French obligation to take action because of the higher unemployment rates in the region.
With regard to the future, continuing the communication efforts, professionalizing and broadening candidate recruitment in Alsace and promoting exchange were listed as important measures, given that the necessary framework already exists. Despite the associated difficulties, the cross-border vocational education model was described as fulfilling an important function by allowing young Alsatians with German skills insuffi-cient for a Baden school to participate and by also ensuring the French interest in keeping young workers in their region. As mentioned before, an automatic double degree would make the model more attractive in the opinion of several interviewees; Azubi-BacPro is understood as a first step into this direction. This format could be further improved, as mentioned in one conversation, given that the young participants and the hosting companies seem to have different perceptions of the program’s ob-jective. In general, having completed an Azubi-BacPro program, which ends with a French degree for a young Alsatian, for example, might make a German degree re-dundant in some cases in industries like gastronomy or accommodation, since the vocational programs are rather similar on both sides of the border and the company had a chance to experience the work of the graduate. On the other hand, as outlined in the same interview, in manufacturing industries or professions with numerous

IAB-Discussion Paper 2/2018 77
norms, safety instructions, etc., a French degree will usually not be sufficient for a Baden company. Close examination and subsequent recognition of each degree or a partial recognition are possible options for the future in this context. Creating entirely new regional diplomas was deemed possible for trade and commerce by one inter-viewee and assessed as rather unlikely by another one, illustrating once again the complicated nature of the issue.
Correspondingly, a recent study conducted on the Azubi-BacPro program found that the chance of the young Alsatians to be employed by the German company they had already spent some time with depended on the recognition of their French degree and thus on the profession they were training in (with positive results for gastronomy and accommodation rather than for electrical engineering, for instance). Difficulties were observed regarding German language skills and the lacking readiness of the receiving companies to recognize the efforts made in the Alsatian educational system in this context, although the stay abroad gave the students some chance to practice. Both the uncertainty of recognition and insufficient knowledge about the French system proved to be somewhat challenging, and the project demanded intensive commitment from many actors, with cross-border cooperation also reaching its limits at certain points (Goulet, Seidendorf 2017).
Finally, it was emphasized in several conversations that cross-border apprenticeships were set up case by case, since (time-consuming) arrangements between the respec-tive vocational school and company usually needed to be made for each applicant individually with the assistance and consulting of the experts for the French-German cross-border dual vocational training and dual courses of study programs. The pro-cess requires explaining and convincing to and of many parties and a high motivation on all sides to take on the necessary efforts. Consequently, the situation was as-sessed insofar as that the current, in absolute terms rather modest numbers were a great success, but that it seemed unlikely that entire classes would complete a cross-border vocational education in the future. In addition, an interviewee voiced the ne-cessity of a higher financial investment in the program by increasing the number of experts for the cross-border dual vocational training with respect to the time-intensive consulting and by offering permanent instead of fixed-term employment contracts for the experts, also with regard to preserving the knowledge about processes, cooper-ating institutions, contact partners, etc. A stronger financial contribution from the Ger-man side would also signal commitment to the project, taking into account as well that the experts have until now been funded by France via EURES.
To conclude this section, various obstacles have been described which can deter po-tential frontier workers and suggest that in spite of the extended efforts deficiencies in the integration of the two regional labor markets as well as markets for vocational education continue to exist. These conclusions are somewhat in line with the study of Janssen (2000: 67) who observed, among others, that regional economic factors and personal unemployment did not explain the willingness for mobility as assumed but that other determinants had to play an important role as well. Taking into account the

IAB-Discussion Paper 2/2018 78
restrictions imposed by issues of lacking complementarity of the labor markets in some fields, the obstacles listed above can likewise be understood as opportunities to increase cross-border mobility and thus reduce disparities in unemployment be-tween Alsace and Baden, for example. In a similar spirit, given that apprenticeship vacancies have exceeded the number of applicants in Baden for the past years, as outlined in section 3, and given the continuing high youth unemployment in Alsace, the cross-border vocational education seems to have the potential to alleviate both situations, in addition to the intercultural experiences gained in the process. Since detailed data on corresponding shortages in Alsace were not available for this paper, it might also be possible that competition instead of complementarity arises with re-gard to some occupations.
7 Conclusion Summing up the results from both the separate examination of the Alsatian and Baden labor and vocational education markets as well as the analysis of cross-border inte-gration and mobility obstacles, a somewhat mixed conclusion can be drawn. On the one hand, the regression in section 5 confirmed that two of the shortage indicators – tension in Alsace and average completed vacancy periods in Baden – included in the model acted as push and pull factors for French frontier workers; not all results met the pre-estimation expectations, however. Given that individuals thus seem to react to a modest extent to the situation on both sides of the border, these results suggest a certain degree of integration between the two labor markets, but also reveal that regional discrepancies are not fully balanced by the comparatively low number of commuters triggered by local developments. On the other hand, both the quantitative and the qualitative analysis identified a number of obstacles potentially preventing or deterring the flow of commuters between the regions, including among others the ex-istence of standardized certificates as well as issues related to language, mobility and information. Contrary to that, individuals in regulated professions do not seem to en-counter significant additional barriers. Considering the continuing discrepancy in un-employment rates between Alsace and Baden, for instance, the effects of these ob-stacles appear to be somewhat noticeable.
At the same time, it was also shown that despite the overall discrepancies, the labor markets did not complement each other in every field. To mention just a few exam-ples, several occupations in healthcare and education as well as computer science seem to be among the more tense professions on both sides of the Rhine. Whereas French frontier workers were underrepresented relatively to general employment in Baden in some of the shortage professions, they exceeded the Baden shares in oth-ers, although the high levels of aggregation should be kept in mind in both contexts. The profile of the “average” Alsatian commuter as a male, rather low-skilled and older worker in a manufacturing profession identified in previous studies (Pilger, Meindl, Hamann 2011: 40-46; Statistiques, Études et Évaluations de Pôle emploi 2017b: 4, 10) was confirmed, indicating the relevance of the cross-border market as well when

IAB-Discussion Paper 2/2018 79
considering the relatively higher importance of the industrial sector in Baden. The dif-fering structures and characteristics of the respective labor markets were also as-sessed as offering potential for mutually beneficial mobility by Pilger, Meindl, Hamann (2011: 46-47), for example. With regard to cross-border vocational education and dual courses of study, comparatively modest numbers could be observed despite increas-ing tensions in Baden in some areas and high youth unemployment in Alsace, sug-gesting a continuing focus on reducing the obstacles outlined above. According to media reports, apprentices are also missing for some professions on the French side of the Rhine, but detailed data were not available in this context.
While integration of the labor markets has not been completed yet, a well-developed network of cooperation and coordination structures has been established in the Upper Rhine Region. The past years have witnessed new measures and initiatives aimed at promoting both cross-border labor mobility and cross-border educational programs and saw a stabilization of the level of frontier workers and an increase of participant numbers in vocational programs, albeit at a moderate level. It was emphasized by several interviewees that the regions were focusing on areas where cooperation promised to be productive and were considering the competitiveness of the region as a whole as opposed to promoting competition among each other. Moreover, it was stressed that the direction of the labor market disparities could also turn around in some years, making it important for both sides to ensure that a balancing integration can take place. In the near future, however, the number of Alsatian frontier workers is expected to drop with the current commuters reaching retirement age (Statistiques, Études et Évaluations de Pôle emploi 2017b: 1, 10). It should also be taken into ac-count that some share of the traditional frontier worker jobs accessible with a low professional degree such as CAP will likely disappear in the next years according to a 2011 study (Beck, Rihm 39, 43). The shares of higher diplomas among apprentices and lycée students are increasing as shown in section 3; nevertheless, regardless of the level of qualification obtained, recognition will continue to constitute a barrier in many cases. In addition, a previously mentioned study also found that that given the change towards a stronger tertiary sector in Germany at cost of the secondary sector, language skills will tend to become more important in the future, which should be met by a corresponding educational focus (dfi, EURO-Institut Kehl, Strasbourg Conseil 2014: 12-14).
In order to exploit the remaining potential for integration in the region, taking into ac-count the potential frictions mentioned above, the remaining obstacles could be worked on to render frontier work more attractive. Some suggestions offered by the interview partners were cited in section 6, including increasing information and aware-ness as well as addressing insufficient language skills and missing public transporta-tion. In addition, the recognition of qualifications and the design of the cross-border dual vocational education seem in need to be further evolved. With regard to the latter, especially the negative image of dual programs in France and the difficulties in com-paring degrees seem to constitute barriers that are complicated to reduce. At the

IAB-Discussion Paper 2/2018 80
same time, the results of the estimation in section 5 regarding the impact of standard-ized certificates on cross-border mobility strongly suggests further action in this area, either in the formal recognition process or by increasing information about and ac-ceptance of French degrees among German employers. A model of cross-border vo-cational education in which the participant automatically receives both degrees was deemed difficult to implement, and the understanding for continuing as an apprentice in Baden despite the completed French degree seems to be limited. A future-oriented compromise might consist in providing the possibility for French applicants to acquire the missing German qualifications while already being employed in Baden company in extra occupational modules. This way, the barrier of incomparable certificates could be lowered for apprentices and individuals with working experience, both with regard to their chances of employment as well as an adequate valorization of the degrees in the neighboring country.
On the other hand, a possibility to improve the sensitivity regarding the neighbor’s labor market situation might constitute in better communication of vacancies and re-gional recruitment strategies under consideration of competing shortage situations, as addressed by the regional experts. Yet as one interviewee pointed out, one should not expect major leaps through these kinds of reforms, but limit the efforts to measures sans regrets, i.e. measures that have a positive impact by themselves even in case they did not result in significant change. Cross-border intercultural exchange accompanying vocational educational programs was mentioned as an example in this context, but this perspective can easily be extended to the provision of language courses, the creation of cross-border public transportation or the implementation of information campaigns.
The identification of a qualification mismatch between the comparably large number of unemployed Alsatians and the needs of the German labor market as briefly ad-dressed in section 6 would provide an interesting starting point for further research in this context. Examining in more detail how certain obstacles to cross-border mobility are perceived in Alsace, as already conducted with regard to vocational education (dfi, EURO-Institut Kehl, Strasbourg Conseil 2014), can also be assumed to provide further valuable insights. Given that a 2015 analysis at EU-level found that “[v]ery positive progress was made, considering all the projects achieved”, but that at the same time “cross-border development is still hampered by obstacles” and that “[o]ver-coming them appears then to be more important than ever” (Mission Opérationnelle Transfrontalière Préparation: 3), cross-border cooperation is certain to receive con-tinued attention in the future.
References Agentur für Arbeit Freiburg, & Maison de l’Emploi et de la Formation du Pays de la Région Mulhousienne (05/2015). Portrait des jeunes transfrontaliers / Portrait der jungen Grenzgänger. http://www.mef-mulhouse.fr/uploads/pdf/etudes/2015_3e_Bro-chureTransnationale.pdf [Provided to the author by the Agentur für Arbeit Freiburg].

IAB-Discussion Paper 2/2018 81
Arpaia, A., Kiss, A., Palvolgyi, B., Turrini, A. (2016). Labour mobility and labour mar-ket adjustment in the EU. IZA Journal of Development and Migration 5:21. Retrieved from https://izajodm.springeropen.com/articles/10.1186/s40176-016-0069-8
BAK Basel Economics for EURES-Transfrontalier Oberrhein-Rhin Supérieur and the Expertenausschuss Statistik der Oberrheinkonferenz. (2008). Regionalprofil Ober-rhein – 2008: Statistische Daten, Analyse der wirtschaftlichen Lage und des Arbeits-marktes. Retrieved from https://www.eures-t-oberrhein.eu/download-center/
Beck, J. & Rihm, S. (16/11/2011). Bilinguisme et l’emploi transfrontalier : Etude sur l’impact économique du multilinguisme pour le marché de l’emploi dans le Rhin su-périeur et la Grande Région (SAARLORLUX) : Rapport final / Zweisprachigkeit und grenzüberschreitende Beschäftigung : Studie zur wirtschaftlichen Bedeutung der Mehrsprachigkeit für den Arbeitsmarkt am Oberrhein und in der Großregion (SAARLORLUX) : Schlussbericht. Retrieved from http://www.euroinsti-tut.org/wDeutsch/3-Studien/index.php?navanchor=2110015
Bhargava, L., Franzini, L., & Narendranathan, W. (10/1982). Serial Correlation and the Fixed Effects Model. The Review of Economic Studies, Vol 49, No. 4, 533-549. https://www.jstor.org/stable/pdf/2297285.pdf
Buch, T., Niebuhr, A., Schmidt, T. D., & Stuwe, M. (2008). Grenzpendeln in der deutsch-dänischen Grenzregion: Entwicklung und Struktur 1998-2005. IAB regional: IAB Nord, 04/2008. http://doku.iab.de/regional/N/2008/regional_n_0408.pdf
Bundesregierung. (15/02/2011). Antwort auf die Kleine Anfrage der Abgeordneten Sabine Zimmermann, Jutta Krellmann, Sevim Dağdelen, weiterer Abgeordneter und der Fraktion DIE LINKE: Fakten und Position der Bundesregierung zum so genann-ten Fachkräftemangel [Drucksache 17/4784]. Retrieved from https://www.google.de/url?sa=t&rct=j&q=&esrc=s&source=web&cd=1&cad=rja&uact=8&ved=0ahUKEwi5l5XugO7XAhWI8RQKHeZPDZUQFggu-MAA&url=http%3A%2F%2Fdip21.bundes-tag.de%2Fdip21%2Fbtd%2F17%2F047%2F1704784.pdf&usg=AOv-Vaw3wHJ1sKJk7PV0LT53N9Ohk
Dengler, K., Matthes, B., & Paulus, W. (12/2014). Occupational Tasks in the Ger-man Labour Market: An alternative measurement on the basis of an expert data-base. FDZ Methodenreport, 12/2014. http://doku.iab.de/fdz/reporte/2014/MR_12-14_EN.pdf
Deutsch-Französisches Institut (dfi), EURO-Institut Kehl, & Strasbourg Conseil. (2014). Grenzüberschreitende Berufsbildung und Beschäftigung junger Menschen am Oberrhein: Eine Pilotstudie im Eurodistrikt Strasbourg-Ortenau. http://www.euro-institut.org/pdf/Download-Unterlagen/2014-Spracherwerb/Abschlussbe-richt_GUe_Berufsbildung___Beschaeftigung_PUBLIC_Version.pdf
Deutsch-Französisch-Schweizerische Oberrheinkonferenz. (n.d.) Die Entstehung der Oberrheinkonferenz. http://www.oberrheinkonferenz.org/de/oberrheinkonfe-renz/entstehung.html
Deutsch-Französisch-Schweizerische Oberrheinkonferenz. (n.d.) Die Organisation der Oberrheinkonferenz. http://www.oberrheinkonferenz.org/de/oberrheinkonfe-renz/organisation.html
Deutsch-Französisch-Schweizerische Oberrheinkonferenz. (12/2013a). Grenzüber-schreitende Bildungswege zu Arbeit und Beschäftigung am Oberrhein: Eine Be-standsaufnahme der Akteure, Projekte, Maßnahmen und Studien. Retrieved from http://www.oberrheinkonferenz.org/de/wirtschaft/uebersicht-news/aktuelle-infor-mationen/items/aktualisierung-der-brochuere-grenzueberschreitende-bildungswege-zu-arbeit-und-beschaeftigung-am-oberrhein.html

IAB-Discussion Paper 2/2018 82
Deutsch-Französisch-Schweizerische Oberrheinkonferenz. (2016). Oberrhein/Rhin Supérieur: Zahlen und Fakten/Faits et chiffres 2016. Retrieved from: http://www.oberrheinkonferenz.org/de/wirtschaft/zahlenundfakten.html
Deutsch-Französisch-Schweizerische Oberrheinkonferenz. (12/09/2013b). Rahmen-vereinbarung über die grenzüberschreitende Berufsausbildung am Oberrhein. Re-trieved from http://www.oberrheinkonferenz.org/de/wirtschaft/uebersicht-news/ak-tuelle-informationen/items/rahmenabkommen-zur-grenzueberschreitenden-berufsbildung.html
Direction de l’animation de la recherché, des études et des statistiques (Dares). (n.d.). La nomenclature des familles professionnelles: Version 2009: Table de cor-respondance FAP/PCS/ROME. http://travail-emploi.gouv.fr/IMG/pdf/FAP-2009_Introduction_et_table_de_correspondance.pdf
Direction de l’animation de la recherché, des études et des statistiques (Dares). (06/03/2014). Le marché du travail par métier. Retrieved from http://dares.travail-emploi.gouv.fr/dares-etudes-et-statistiques/statistiques-de-a-a-z/article/le-marche-du-travail-par-metier
Direction de l’animation de la recherché, des études et des statistiques (Dares). (10/2013). L’indicateur de tension par familles professionnelles. Retrieved from http://dares.travail-emploi.gouv.fr/dares-etudes-et-statistiques/statistiques-de-a-a-z/article/le-marche-du-travail-par-metier
Direction de l’animation de la recherché, des études et des statistiques (Dares), & Pôle emploi. (02/2017). Comment interpréter les statistiques mensuelles sur les de-mandeurs d’emploi inscrits à Pôle emploi ? Retrieved from http://dares.travail-em-ploi.gouv.fr/dares-etudes-et-statistiques/statistiques-de-a-a-z/article/la-statistique-mensuelle-du-marche-du-travail-stmt
Direction de l’animation de la recherché, des études et des statistiques (Dares), & Pôle emploi. (08/2016). Statistiques sur les demandeurs d’emploi inscrits et les offres collectées par Pôle emploi : Documentation méthodologique. http://da-res.travail-emploi.gouv.fr/IMG/pdf/documentation_stmt_methodo.pdf
Direction régionale des entreprises de la concurrence, de la consommation, du tra-vail et de l’emploi du Grand-Est (DIRECCTE Grand Est). (25/07/2017). Les séries (données historiques) [Data file]. Retrieved from http://grand-est.di-reccte.gouv.fr/Les-series-donnees-historiques-18187
Erklärung von Hambach zur deutsch-französischen Zusammenarbeit in den Grenz-regionen. (06/04/2017). Retrieved from http://www.auswaertiges-amt.de/DE/Europa/Zusammenarbeit_Staaten/Frankreich/Aktuelles/170406-Hambach.html?nn=753306
Erklärung von Metz über die grenzüberschreitende deutsch-französische Zusam-menarbeit. (07/07/2015). Retrieved from https://www.auswaertiges-amt.de/DE/Europa/Zusammenarbeit_Staaten/Frankreich/Aktuelles/151031-StM_R_Desir_Strassburg.html
EURES-T Oberrhein. (n.d.). Arbeitgeber. https://www.eures-t-oberrhein.eu/arbeitge-ber/
EURES-T Oberrhein. (n.d.). EURES-T Oberrhein. https://www.eures-t-ober-rhein.eu/?cmpref=1703&lang=fr&module=media&action=Dis-play&cHash=f156b0f8ec7bf096e688850c145df736
EURES-T Oberrhein. (01/2016). Grenzüberschreitende Ausbildung und duales Stu-dium am Oberrhein: Informationen für Arbeitgeber in Deutschland. https://www.eu-res-t-oberrhein.eu/ausbildung/informationen-fuer-ausbildungs-unternehmen/

IAB-Discussion Paper 2/2018 83
EURES-T Oberrhein. (n.d.). Informationen für Ausbildungsunternehmen. https://www.eures-t-oberrhein.eu/ausbildung/informationen-fuer-ausbildungs-unter-nehmen/
EURES-T Oberrhein. (n.d.). Über EURES-T: Beratungsteam. https://www.eures-t-oberrhein.eu/ueber-eures-t/beratungsteam/
EURES-T Oberrhein. (n.d.). Über EURES-T: Dienstleistungsangebot. https://www.eures-t-oberrhein.eu/ueber-eures-t/dienstleistungsangebot/
EURES-T Oberrhein. (n.d.). Über EURES-T: Organisation und Partner. https://www.eures-t-oberrhein.eu/ueber-eures-t/organisation-und-partner/
EURES-T Oberrhein. (n.d.). Über EURES-T: Porträt. https://www.eures-t-oberrhein.eu/ueber-eures-t/portraet
Eurodistrict Region Freiburg / Centre et Sud Alsace. (n.d.) Die vier Eurodistrikte am Oberrhein. http://www.eurodistrict-freiburg-alsace.eu/de/presentation-des-4-eurodi-stricts-du-rhin-superieur/
Eurodistrict Strasbourg-Ortenau. (n.d.). Gebiet. Retrieved from http://www.eurodis-trict.eu/de/gebiet
Eurofound. (2014). Labour mobility in the EU: Recent trends and policies. Luxem-bourg: Publications Office of the European Union. Retrieved from https://www.euro-found.europa.eu/de/publications/report/2014/eu-member-states/labour-market-so-cial-policies/labour-mobility-in-the-eu-recent-trends-and-policies
European Commission. (2002). Communication from the Commission – Free move-ment of workers: achieving the full benefits and potential. http://eur-lex.europa.eu/le-gal-content/en/TXT/?uri=CELEX%3A52002DC0694
European Commission. (2002). (n.d.). Database of regulated professions. https://ec.europa.eu/growth/single-market/services/free-movement-professionals/re-gulated-professions-database_en
European Commission. (2002). (n.d.). EURES in cross-border regions. https://ec.eu-ropa.eu/eures/public/en/eures-in-cross-border-regions#/list
European Parliament, & Council of the European Union. (30.04.2004). Regulation (EC) No 883/2004 of the European Parliament and of the Council of 29 April 2004 on the coordination of social security systems. Official Journal of the European Un-ion, L166/2004. http://eur-lex.europa.eu/legal-con-tent/EN/TXT/?qid=1507984570895&uri=CELEX:32004R0883
FachkräfteAllianz Südlicher Oberrhein. (n.d.). FachkräfteAllianz Südlicher Ober-rhein. https://www.fachkraefte-allianz-oberrhein.de/ueber-uns/
Finck, A., Hartweg, F., Matzen, R., & Philipp, M. (n.d.). Definition der Regionalspra-che. http://www.olcalsace.org/de/definition-der-regionalsprache
France Télévisions. (08/10/2017). L’apprentissage est l’un des chantiers du gouver-nement [Video]. Dimanche en politique en régions. Retrieved from http://france3-re-gions.francetvinfo.fr/grand-est/emissions/dimanche-en-politique
Frank, T., & Grimm, C. (01/2010). Beschäftigungsstatistik: Umstellung der Klassifi-kation der Wirtschaftszweige von WZ 2003 auf WZ 2008. Statistik der Bundesagen-tur für Arbeit: Methodenbericht. https://statistik.arbeitsagentur.de/cae/servlet/conten-tblob/4370/publicationFile/116196/Methodenbericht-Beschaeftigungsstatistik-Um-stellung-Klassifikation.pdf

IAB-Discussion Paper 2/2018 84
Frees. E. W. (2004). Longitudinal and Panel Data: Analysis and Applications in the Social Sciences. Cambridge: Cambridge University Press.
Fries-Tersch, E., Tugran, T., & Bradley, H. for the European Commission. (05/2017). 2016 Annual Report on intra-EU Labour Mobility (2nd ed.). Publications Office of the European Union. Retrieved from https://publications.europa.eu/en/pub-lication-detail/-/publication/ddaa71cc-3e9a-11e7-a08e-01aa75ed71a1
Gehrike, M., Kahler, A., & Kohlmann, A. (08/2010). Statistiken über den Ausbil-dungsstellenmarkt: Bewerber aus früheren Berichtsjahren im aktuellen Ausbildungs-jahr. Statistik der Bundesagentur für Arbeit: Methodenbericht. https://statistik.ar-beitsagentur.de/cae/servlet/contentblob/23152/publicationFile/4254/Methodenbe-richt-Statistiken-ueber-den-Ausbildungsstellenmarkt-Bewerber-aus-frueheren-Be-richtsjahren.pdfl
Giesselmann, M., & Windzio, M. (2012). Regressionsmodelle zur Analyse von Pa-neldaten. Wiesbaden: Springer VS.
Goulet, V. (01/2015). Junge Menschen im südlichen Elsass und die berufliche, grenzüberschreitende Mobilität. [Summary]. http://www.fefa.fr/sites/fefa/files/files/documents/01_resume_rapport_jfsa_gou-let_janvier_2015_all.pdf
Goulet, V., & Seidendorf, S. (05/2017). L’Azubi-Bacpro. Retour sur une expérience de coopération transfrontalière dans le domaine de formation / Azubi-Bacpro : Rück-blick auf eine grenzüberschreitende Kooperation in der Berufsbildung [Summary]. dfi compact, 15/2017. [Provided to the author by the dfi]
Grand Est: Alsace Champagne-Ardenne Lorraine. (n.d.) Réussir sans frontière. https://reussirsansfrontiere.eu/
Grand Est. (n.d.). Réussir sans frontière : Emploi. https://reussirsansfron-tiere.eu/emploi-stage/emploi-transfrontalier/
Hartmann, M., & Reimer, K. (08/2011). Möglichkeiten und Grenzen einer statisti-schen Engpassanalyse nach Berufen. Statistik der Bundesagentur für Arbeit: Metho-denbericht. https://statistik.arbeitsagentur.de/Statischer-Content/Grundlagen/Metho-denberichte/Uebergreifend/Generische-Publikationen/Methodenbericht-Statistische-Engpassanalyse-nach-Berufen.pdf
Huber, P., & Nowotny, K. (2013). Moving across Borders: Who is Willing to Migrate or to Commute? Regional Studies, Vol 47, No. 9, 1462-1481. http://dx.doi.org/10.1080/00343404.2011.624509
Infobest. (n.d.). Über Infobest. https://www.infobest.eu/de/ueber-infobest/#article
Institut für Arbeitsmarkt- und Berufsforschung (IAB) Baden-Württemberg. (n.d.). Grenzgänger in der Region EURES-T Oberrhein [Internal Document].
Institut für Arbeitsmarkt- und Berufsforschung (IAB): Geschäftsbereich ITM. (02/09/2016). BeH: Beschäftigtenhistorik: Version 10.01.00-160816. ITM-Datenreport [Internal Document].
Institut national de la statistique et des études économiques (INSEE). (30/06/2012a). Caractéristiques de l’emploi en 2009 : Département du Bas-Rhin (67) [Data file]. Retrieved from https://www.insee.fr/fr/statis-tiques/2043990?geo=DEP-67

IAB-Discussion Paper 2/2018 85
Institut national de la statistique et des études économiques (INSEE). (30/06/2012b). Caractéristiques de l’emploi en 2009: Département du Bas-Rhin (67): ACT2A V2 – Population active de 15 ans ou plus ayant un emploi par sexe, statut, temps de travail et âge quinquennal en 2009 [Data file]. Retrieved from https://www.insee.fr/fr/statistiques/2043996?sommaire=2131681&geo=DEP-67
Institut national de la statistique et des études économiques (INSEE). (30/06/2012c). Caractéristiques de l’emploi en 2009 : Département du Haut-Rhin (68) [Data file]. Retrieved from https://www.insee.fr/fr/statis-tiques/2043990?geo=DEP-68
Institut national de la statistique et des études économiques (INSEE). (30/06/2012d). Caractéristiques de l’emploi en 2009: Département du Haut-Rhin (68): ACT2A V2 – Population active de 15 ans ou plus ayant un emploi par sexe, statut, temps de travail et âge quinquennal en 2009 [Data file]. Retrieved from https://www.insee.fr/fr/statistiques/2043996?sommaire=2131681&geo=DEP-68
Institut national de la statistique et des études économiques (INSEE). (29/06/2017a). Caractéristiques de l’emploi en 2014 : Département du Bas-Rhin (67) [Data file]. Retrieved from https://www.insee.fr/fr/statis-tiques/2873427?geo=DEP-67
Institut national de la statistique et des études économiques (INSEE). (29/06/2017b). Caractéristiques de l’emploi en 2014: Département du Bas-Rhin (67): ACT2A V2 – Population active de 15 ans ou plus ayant un emploi par sexe, statut, temps de travail et âge quinquennal en 2014 [Data file]. Retrieved from https://www.insee.fr/fr/statistiques/2873433?sommaire=2873503&geo=DEP-67
Institut national de la statistique et des études économiques (INSEE). (29/06/2017c). Caractéristiques de l’emploi en 2014 : Département du Haut-Rhin (68) [Data file]. Retrieved from https://www.insee.fr/fr/statis-tiques/2873427?geo=DEP-68
Institut national de la statistique et des études économiques (INSEE). (29/06/2017d). Caractéristiques de l’emploi en 2014: Département du Haut-Rhin (68): ACT2A V2 – Population active de 15 ans ou plus ayant un emploi par sexe, statut, temps de travail et âge quinquennal en 2014 [Data file]. Retrieved from https://www.insee.fr/fr/statistiques/2873433?sommaire=2873503&geo=DEP-68
Institut national de la statistique et des études économiques (INSEE). (29/06/2017e). Diplômes – Formation en 2014: Département du Bas-Rhin (67) [Data file]. Retrieved from https://www.insee.fr/fr/statistiques/2874000?geo=DEP-67#tableau-FOR_G2
Institut national de la statistique et des études économiques (INSEE). (29/06/2017f). Diplômes – Formation en 2014: Département du Haut-Rhin (68) [Data file]. Re-trieved from https://www.insee.fr/fr/statistiques/2874000?geo=DEP-68#tableau-FOR_G2
Institut national de la statistique et des études économiques (INSEE). (09/03/2017g). Estimations d’emploi en 2015: Estimations – Insee Résultats : L’em-ploi localisé en 2015 [Data file]. Retrieved from https://www.insee.fr/fr/statis-tiques/2491855?sommaire=2491904&q=t201
Institut national de la statistique et des études économiques (INSEE). (30/06/2012e). Évolution et structure de la population en 2009: Département du Bas-Rhin (67) : POP1B - Population par sexe et âge en 2009 [Data file]. Retrieved from https://www.insee.fr/fr/statistiques/2044220?sommaire=2131882&geo=DEP-67
IAB-Discussion Paper 2/2018 86
Institut national de la statistique et des études économiques (INSEE). (29/06/2017h). Évolution et structure de la population en 2014: Département du Bas-Rhin (67) : POP1B- Population par sexe et âge en 2014 [Data file]. Retrieved from https://www.insee.fr/fr/statistiques/2874204?sommaire=2874226&geo=DEP-67
Institut national de la statistique et des études économiques (INSEE). (30/06/2012f). Évolution et structure de la population en 2009: Département du Haut-Rhin (68) : POP1B - Population par sexe et âge en 2009 [Data file]. Retrieved from https://www.insee.fr/fr/statistiques/2044220?sommaire=2131882&geo=DEP-68
Institut national de la statistique et des études économiques (INSEE). (29/06/2017i). Évolution et structure de la population en 2014: Département du Haut-Rhin (68) : POP1B - Population par sexe et âge en 2014 [Data file]. Retrieved from https://www.insee.fr/fr/statistiques/2874204?sommaire=2874226&geo=DEP-68
Institut national de la statistique et des études économiques (INSEE). (29/06/2017j). Logements, individus, activité, mobilités scolaires et professionnelles, migrations ré-sidentielles en 2014 : Mobilités professionnelles des individus : déplacements com-mune de résidence/ commune de travail en 2014 : Recensement de la population – Fichier détail [Data file]. Retrieved from https://www.insee.fr/fr/statis-tiques/2866308?sommaire=2866354
Institut national de la statistique et des études économiques (INSEE). (09/03/2017k). Natalité en 2015: Comparaisons régionales et départementales [Data file]. Retrieved from https://www.insee.fr/fr/statistiques/2012761#tableau-TCRD_053_tab1_departements
Institut national de la statistique et des études économiques (INSEE). (30/06/2012g). Population active, emploi et chômage en 2009: Département du Bas-Rhin (67) : EMP3 V2 – Emplois au lieu de travail par sexe, secteur d’activité économique et catégorie socioprofessionnelle en 2009 [Data file]. Retrieved from https://www.insee.fr/fr/statistiques/2044056?sommaire=2131771&geo=DEP-67
Institut national de la statistique et des études économiques (INSEE). (30/06/2012h). Population active, emploi et chômage en 2009: Département du Haut-Rhin (68) : EMP3 V2 – Emplois au lieu de travail par sexe, secteur d’activité économique et catégorie socioprofessionnelle en 2009 [Data file]. Retrieved from https://www.insee.fr/fr/statistiques/2044056?sommaire=2131771&geo=DEP-68
Institut national de la statistique et des études économiques (INSEE). (29/06/2017l). Population active, emploi et chômage en 2014: Département du Bas-Rhin (67) : EMP3 V2 – Emplois au lieu de travail par sexe, secteur d’activité économique et ca-tégorie socioprofessionnelle en 2014 [Data file]. Retrieved from https://www.in-see.fr/fr/statistiques/2873759?sommaire=2873834&geo=DEP-67
Institut national de la statistique et des études économiques (INSEE). (29/06/2017m). Population active, emploi et chômage en 2014: Département du Haut-Rhin (68) : EMP3 V2 – Emplois au lieu de travail par sexe, secteur d’activité économique et catégorie socioprofessionnelle en 2014 [Data file]. Retrieved from https://www.insee.fr/fr/statistiques/2873759?sommaire=2873834&geo=DEP-68
Institut national de la statistique et des études économiques (INSEE). (29/06/2017n). Présentation du recensement de la population. https://www.in-see.fr/fr/information/2383265
Institut national de la statistique et des études économiques (INSEE). (29/06/2017o). Résultats du recensement: calendrier et produits. https://www.in-see.fr/fr/information/2383180

IAB-Discussion Paper 2/2018 87
Institut national de la statistique et des études économiques (INSEE). (11/07/2017p). Taux de chômage localisés (moyenne annuelle) – Ensemble – Bas-Rhin [Data file]. Retrieved from https://www.insee.fr/fr/statistiques/serie/001784679
Institut national de la statistique et des études économiques (INSEE). (11/07/2017q). Taux de chômage localisés (moyenne annuelle) – Ensemble – Haut-Rhin [Data file]. Retrieved from https://www.insee.fr/fr/statistiques/serie/001784680
Institut national de la statistique et des études économiques (INSEE). (11/07/2017r). Taux de chômage localisés (moyenne annuelle) – Ensemble des 15 à 24 ans – Bas-Rhin [Data file]. Retrieved from https://www.insee.fr/fr/statistiques/serie/001784436
Institut national de la statistique et des études économiques (INSEE). (11/07/2017s). Taux de chômage localisés (moyenne annuelle) – Ensemble des 15 à 24 ans– Haut-Rhin [Data file]. Retrieved from https://www.insee.fr/fr/statis-tiques/serie/001784437
Institut national de la statistique et des études économiques (INSEE). (11/07/2017t). Taux de chômage localisés (moyenne annuelle) – Ensemble des 50 ans ou plus – Bas-Rhin [Data file]. Retrieved from https://www.insee.fr/fr/statis-tiques/serie/001784788
Institut national de la statistique et des études économiques (INSEE). (11/07/2017u). Taux de chômage localisés (moyenne annuelle) – Ensemble des 50 ans ou plus– Haut-Rhin [Data file]. Retrieved from https://www.insee.fr/fr/statis-tiques/serie/001784789
Institut national de la statistique et des études économiques (INSEE). (19/05/2017v). Taux de chômage localisés (par régions, départements, et zones d’emploi). https://www.insee.fr/fr/metadonnees/source/s1323
Institut national de la statistique et des études économiques (INSEE). (13/10/2016). Taux de natalité. https://www.insee.fr/fr/metadonnees/definition/c1766
INTERREG Oberrhein. (n.d.). Erfolg ohne Grenze: Den Zugang zum grenzüber-schreitenden Arbeitsmarkt durch Ausbildungs und Qualifizierungsmaßnahmen er-leichtern. http://www.interreg-oberrhein.eu/projet/erfolg-ohne-grenze-den-zugang-zum-grenzuberschreitenden-arbeitsmarkt-durch-ausbildungs-und-qualifizierungs-masnahmen-erleichtern/
INTERREG Oberrhein. (n.d.). Organisation. http://www.interreg-oberrhein.eu/das-programm/praesentation/http://www.interreg-oberrhein.eu/das-programm/organisation/
INTERREG Oberrhein. (12/12/2016). Vierzehn neue Projekte der grenzüberschrei-tenden Zusammenarbeit genehmigt. http://www.interreg-oberrhein.eu/das-pro-gramm/praesentation/
INTERREG Oberrhein. (n.d.). Was ist INTERREG? http://www.interreg-ober-rhein.eu/das-programm/praesentation/
Janssen, M. (2000). Borders and Labour-market Integration: Where is the Difference between Interregional and Cross-Border Mobility? In Van der Velde, M., & Van Hou-tum, H. (Eds.), Borders, Regions, and People (pp. 47-68). London: Pion.
Kissling, H. J. (2005). Struktur des Bildungs- und Berufsbildungssystems in Deutschland. In Bundesinstitut für Berufsbildung, & Deutsch-Französisches Institut (Eds.). Berufliche Bildung in Deutschland und Frankreich: Dossier für die Jahresta-gung des Club d’Affaires Franco-Allemand. Wissenschaftliche Diskussionspapiere 74 (pp. 11-15). Retrieved from https://www.bibb.de/veroeffentlichungen/de/publica-tion/show/2111

IAB-Discussion Paper 2/2018 88
Kohler, U., & Kreuter, F. (2017). Datenanalyse mit Stata: Allgemeine Konzepte der Datenanalyse und ihre praktische Anwendung (5th ed.). Berlin: De Gruyter Olden-bourg.
Kropp, P., Sujata, U., & Weyh, A. (2007). Ausbildung und Ausbildungsmobilität in Sachsen. IAB regional: IAB Sachsen, 01/2007. http://doku.iab.de/regional/s/2007/re-gional_s_0107.pdf
Lee, E. S. (1966). Eine Theorie der Wanderung In G. Széll (Ed.). (1972). Regionale Mobilität (pp. 115-129). Nymphenburger Texte zur Wissenschaft. München: Nym-phenburger Verlagshandlung.
Leroy, F., Seitz, S., & Hilligardt, C. (15/11/2017). Grenzüberschreitende Ausbildung am Oberrhein: Bilanz 2010-2017. [Provided to the author by the Fachexperten Grenzüberschreitende Ausbildung].
Liebold, R., & Trinczek, R. (2009). Experteninterview. In S. Kühl, P. Strodtholz & A. Taffertshofer (Eds.), Handbuch Methoden der Organisationsforschung: Quantitative und Qualitative Methoden (pp. 32-56). Wiesbaden: VS Verlag für Sozialwissen-schaften| GWV Fachverlage GmbH.
Luci, A. (2011). Frauen auf dem Arbeitsmarkt in Deutschland und Frankreich: Wa-rum es Französinnen besser gelingt, Familie und Beruf zu vereinbaren. Berlin: Frie-drich-Ebert-Stiftung.
Maison de l’Emploi et de la Formation du Pays de la Région Mulhousienne. (11/2015). Diagnostic territorial partagé 2015 : Gros plans pour mieux comprende l’économie du Sud Alsace. Retrieved from https://www.aurm.org/document/diagnos-tic-territorial-partage-2015-gros-plan-pour-mieux-comprendre-l-economie-du-sud-alsace/show
Maison d’Emploi Strasbourg. (n.d.) Vers un marché de l’emploi à 360° sur le terri-toire Strasbourg-Ortenau. http://www.maisonemploi-strasbourg.org/actualites/vers-un-marche-de-lemploi-360deg-sur-le-territoire-strasbourg-ortenau
Meuser, M., & Nagel, U. (2009). Experteninterview und Wandel der Wissensproduk-tion. In A. Bogner, B. Littig & W. Menz (Eds.), Experteninterviews: Theorien, Metho-den, Anwendungsfelder (pp. 35-60). 3rd ed. Wiesbaden: VS Verlag für Sozialwis-senschaften| GWV Fachverlage GmbH.
Ministère de l’Éducation Nationale. (05/2015). Les niveaux et les établissements d’enseignement : Le centre de formation d’apprentis (CFA) : création, fonctionne-ment, personnels et apprentis. http://www.education.gouv.fr/cid216/le-centre-de-for-mation-d-apprentis-c.f.a.html
Ministère de l’Éducation Nationale. (08/2017). Les niveaux et les établissements d’enseignement : Le lycée. http://www.education.gouv.fr/cid215/le-lycee-enseigne-ments-organisation-et-fonctionnement.html
Ministère du Travail. (14/09/2017). Le contrat d’apprentissage. http://travail-emploi.gouv.fr/formation-professionnelle/formation-en-alternance/contrat-apprentis-sage
Ministerium für Kultus, Jugend und Sport Baden-Württemberg. (23/01/2015). Deutsch-französische Zusammenarbeit im Modellprojekt „Azubi-BacPro“. https://www.baden-wuerttemberg.de/de/service/presse/pressemittei-lung/pid/deutsch-franzoesische-zusammenarbeit-im-modellprojekt-azubi-bacpro/

IAB-Discussion Paper 2/2018 89
Mission Opérationnelle Transfrontalière / Transfrontier Operational Mission. (n.d.). Preparation of the Luxembourgish Presidency of the EU Council: Cross-Border Co-operation: Obstacles to Overcome. Retrieved from http://www.espaces-trans-frontaliers.org/en/the-mot/partnerships/presidency-of-the-eu-coun-cil/?print=y&cHash=7234bcf88a166bb1fad6768a53255626
Nerb, G., Hitzelsberger, F., Woidich, A., Pommer, S., Hemmer S., & Heczko, P. (01/2009). Scientific Report on the Mobility of Cross-Border Workers within the EU-27/EEA/EFTA Countries. Retrieved from https://www.google.de/url?sa=t&rct=j&q=&esrc=s&source=web&cd=1&cad=rja&uact=8&ved=0ahUKEwi3z_OKqvDWAh-VDAsAKHS7GDMMQFggtMAA&url=http%3A%2F%2Fec.europa.eu%2Fso-cial%2FBlobServlet%3FdocId%3D3459%26langId%3Den&usg=AOvVaw32f8Or-pOqg2Rr86spsusv3
Oberrheinrat. (n.d.). Rolle des Oberrheinrats in der Kooperation am Oberrhein. http://www.oberrheinrat.org/de/der-oberrheinrat/rolle-in-der-kooperation-am-ober-rhein.html
Observatoire Régional Emploi Formation Alsace, & Région Alsace Champagne-Ar-denne Lorraine. (11/2015a). Effectifs et formations en lycées : 2 – Entrée par forma-tion : ALSACE – rentrée 2015-2016. http://www.oref-alsace.org/sites/default/files/do-cuments/do-eff-lyc-group-document.pdf
Observatoire Régional Emploi Formation Alsace, & Région Alsace Champagne-Ar-denne Lorraine. (11/2015b). Les entrées dans l’enseignement professionnel en Al-sace. http://www.oref-alsace.org/sites/default/files/documents/tb-entrees-enseign-pro.pdf
Observatoire Régional Emploi Formation Alsace, & Région Grand Est. (08/2015c). Synthèse des effectifs d’apprentis par groupe de spécialité. http://www.oref-al-sace.org/document/synthese-des-effectifs-dapprentis-par-groupe-de-specialite
Office pour la langue et les cultures d’Alsace et de Moselle. (n.d.). Le dialecte en chiffres. http://www.olcalsace.org/fr/observer-et-veiller/le-dialecte-en-chiffres
Paulus, W., & Matthes, B. (08/2013). Klassifikation der Berufe 2010 – Struktur, Co-dierung und Umsteigeschlüssel. Forschungdatenzentrum der Bundesagentur für Ar-beit im Institut für Arbeitsmarkt- und Berufsforschung: Methodenreport. http://doku.iab.de/fdz/reporte/2013/MR_08-13.pdf
Pfeiffer, T. (2000). Erfolgsbedingungen grenzüberschreitender regionaler Zusam-menarbeit: Eine ökonomische Analyse am Beispiel des südlichen Oberrheins und der EUREGIO Gronau. Europäische Hochschulschriften, Reihe V: Volks- und Be-triebswirtschaft, Vol. 2646. Frankfurt am Main: Peter Lang.
Pilger, C., Meindl, M., & Hamann, S. (2011). Grenzüberschreitender Arbeitsmarkt Straßburg-Ortenau, 1999 und 2007: Entwicklung und Struktur der Einpendlerzahlen nach Deutschland. IAB-Regional: IAB Baden-Württemberg, 01/2011. http://doku.iab.de/regional/BW/2011/regional_bw_0111.pdf
Pôle emploi. (n.d.). Demandeurs d’emploi inscrits en fin de mois à Pôle emploi par Département – France entière- Août 2017 – Données brutes [Database]. Retrieved from http://statistiques.pole-emploi.org/stmt/geo?nj=0&pp=las&ss=1
Pôle emploi. (n.d.). Enquête Besoins en Main-d’Œuvre [Data file]. Retrieved from http://statistiques.pole-emploi.org/bmo/bmo?pp=2013-2017
Pôle emploi. (n.d.). Le ROME (Répertoire Opérationnel des Métiers et des Emplois) et les fiches métiers. Retrieved from http://www.pole-emploi.fr/employeur/les-nouvelles-fiches-metiers-@/article.jspz?id=60703

IAB-Discussion Paper 2/2018 90
Pôle emploi. (n.d.). Source et méthode. http://statistiques.pole-emploi.org/bmo/sta-tic/methode
Raso, A. (06/09/2017). Apprentissage: des centaines de places encore disponibles dans les entreprises alsaciennes. France Bleu Alsace. https://www.francebleu.fr/in-fos/economie-social/des-centaines-de-places-encore-disponibles-en-apprentissage-dans-les-entreprises-alsaciennes-1504717564
Rectorat de l’académie de Strasbourg. (n.d.). Chiffres clés 2017/18 : Tous les chiffres de la maternelle à l’université. http://www.ac-strasbourg.fr/filead-min/acad/Ressources/publications/Chiffres_cles_2017.pdf
Réseau Transfrontalier d'Information. (n.d.). Das Netzwerk. http://www.transinfo-net.org/de-de/das_netzwerk
Simon, S. (08/2013).Grenzüberschreitende Arbeitsvermittlung zur Linderung von Ar-beitskräfteengpässen? Eine Analyse in der Region Straßburg-Ortenau [Unpublished Bachelor’s thesis].
StataCorp. (2017). Longitudinal Data / Panel Data Reference Manual (15th ed.). Col-lege Station, TX: StataCorp LLC. https://www.stata.com/manuals/xt.pdf
Statistik der Bundesagentur für Arbeit (BA). (01/2017a). Analyse der gemeldeten Ar-beitsstellen nach Berufen (Engpassanalyse): Baden-Württemberg. Retrieved from https://statistik.arbeitsagentur.de/nn_980704/SiteGlobals/Forms/Rubrikensuche/Ru-brikensuche_Suchergebnis_Form.html?view=processForm&resourceId=210358&in-put_=&pageLocale=de&topicId=888662®ionInd=08&re-gion=&year_month=201701&year_month.GROUP=1&search=Suchen
Statistik der Bundesagentur für Arbeit (BA). (n.d.). Arbeitslosenquoten. https://sta-tistik.arbeitsagentur.de/Navigation/Statistik/Grundlagen/Berechnung-der-Arbeitslo-senquote/Berechnung-der-Arbeitslosenquote-Nav.html
Statistik der Bundesagentur für Arbeit (BA). (28/01/2016a) Dimensionsbeschrei-bung: Ausbildungsmarkt: BBiG Kenner (AusbM) [Internal BA Website]. http://statis-tik.web.dst.baintern.de/cms/index.php?id=553&ba_metadata%5Bdimen-sion_uid%5D=131&cHash=0bfa448010ce072caac0e575ef8f58e6
Statistik der Bundesagentur für Arbeit (BA). (27/03/2015a). Dokumentation der vor-genommenen Änderungen und Korrekturen von Produkten des Ausbildungsstellen-marktes. https://statistik.arbeitsagentur.de/Statischer-Content/Statistik-nach-The-men/Ausbildungsstellenmarkt/Generische-Publikationen/Logbuch-Ausbildungsstel-lenmarktstatistik.pdf
Statistik der Bundesagentur für Arbeit (BA). (n.d.). Einführung in die Visualisierung der Engpassanalyse. https://statistik.arbeitsagentur.de/Statischer-Content/Statisti-sche-Analysen/Interaktive-Visualisierung/Engpassanalyse/Generische-Publikatio-nen/Engpass-Visualisierung-Hilfe.pdf
Statistik der Bundesagentur für Arbeit (BA). (06/2017b). Fachkräfteengpassanalyse. Berichte: Blickpunkt Arbeitsmarkt. https://statistik.arbeitsagentur.de/Statischer-Con-tent/Arbeitsmarktberichte/Fachkraeftebedarf-Stellen/Fachkraefte/BA-FK-Engpassanalyse-2017-06.pdf
Statistik der Bundesagentur für Arbeit (BA). (07/01/2015b). German Classification of Occupations 2010. Retrieved from https://statistik.arbeitsagentur.de/Naviga-tion/Statistik/Grundlagen/Klassifikation-der-Berufe/KldB2010/Ar-beitshilfen/EnglischeKldB2010/KldBEnglischl-Nav.html

IAB-Discussion Paper 2/2018 91
Statistik der Bundesagentur für Arbeit (BA). (26/09/2013). Klassifikation der Berufe 2010 – Systematisches Verzeichnis. Retrieved from https://statistik.arbeitsagen-tur.de/Navigation/Statistik/Grundlagen/Klassifikation-der-Berufe/KldB2010/Sys-tematik-Verzeichnisse/Systematik-Verzeichnisse-Nav.html
Statistik der Bundesagentur für Arbeit (BA). (19/04/2017c). Kurzinformationen – Ausbildungsstellenmarkt. https://statistik.arbeitsagentur.de/Statischer-Con-tent/Grundlagen/Kurzinformationen/Generische-Publikationen/Kurzinformation-Aus-bildungsstellenmarktstatistik.pdf
Statistik der Bundesagentur für Arbeit (BA). (09/2015c) Measurebeschreibung: Aus-bildungsmarkt: Anz Off Stellen (Ausbildungsstellen) [Internal BA Website]. http://sta-tistik.web.dst.baintern.de/cms/index.php?id=681&ba_metadata%5Bmea-sure_uid%5D=178&cHash=b4ff20f12b397ee65ae9e6fbfac43a7b
Statistik der Bundesagentur für Arbeit (BA). (10/2017d) Würfelbeschreibung: Ausbil-dungsmarkt: Ausbildungsstellen traditionelle Kennzahlen [Internal BA Website]. http://statistik.web.dst.baintern.de/cms/index.php?id=663&ba_meta-data%5Bcube_uid%5D=132&cHash=39b68f8c9a0d89f0a00d0d61690bea9e
Statistik der Bundesagentur für Arbeit (BA). (08/2016b) Würfelbeschreibung: Ausbil-dungsmarkt: BB BAX [Internal BA Website]. http://statistik.web.dst.bain-tern.de/cms/index.php?id=663&ba_meta-data%5Bcube_uid%5D=106&cHash=b6ef3f20fbc1da166308fdd124b9789b
Statistiques, Études et Évaluations de Pôle emploi. (06/2017a). Les métiers en ten-sion à la Réunion en 2017. Éclairages et synthèses, Juin 2017, no. 32. Retrieved from http://www.pole-emploi.fr/region/reunion-mayotte/informations/les-metiers-en-tension-en-2017-@/region/reunion-mayotte/article.jspz?id=491918
Statistiques, Études et Évaluations de Pôle emploi. (03/2017b). Les travailleurs fron-taliers dans le Grand Est. Eclairages et Synthèses, Mars 2017 http://www.mef-mul-house.fr/uploads/pdf/etudes/2015_3e_BrochureTransnationale.pdf [Provided to the author by Pôle emploi].
Statistiques, Études et Évaluations de Pôle emploi Grand Est. (04/2017a). Enquête complémentaire « Besoins en Main D’Œuvre 2017 ». Éclairages et Synthèses, Avril 2017. Retrieved from http://www.statsemploi-grandest.fr/asp/mai_actua-lites/act_dtl.asp?actid=1370&rubid=0
Statistiques, Études et Évaluations de Pôle emploi Grand Est. (06/2017b). Enquête Besoins en Main D’Œuvre : Région Grand Est. Éclairages et Synthèses, Juin 2017. Retrieved from http://www.statsemploi-acal.fr/asp/mai_actualites/act_dtl.asp?ac-tid=1424&rubid=0
Statistisches Landesamt Baden-Württemberg. (n.d.). Adress- und Regionalverzeich-nisse. https://www.statistik-bw.de/Service/Gemeindeverzeichnis/Reg.jsp?K
Statistisches Landesamt Baden-Württemberg. (n.d.). Geburtenrate. https://www.sta-tistik-bw.de/Glossar/369
Statistisches Landesamt Baden-Württemberg. (n.d.). Regionaldaten [Data file]. Re-trieved from https://www.statistik-bw.de/SRDB/
Strasbourg l’européenne: Centre d’information sur les institutions européennes. (n.d.). EURES-T – Transfrontalier Oberrhein/Rhin Supérieur. http://www.strasbourg-europe.eu/?module=eurodirectory&action=ViewDetail&eurodirectoryPa-ram%5Bcmpref%5D=4986&lang=fr

IAB-Discussion Paper 2/2018 92
Torres-Reyna, O. (2007). Panel Data Analysis: Fixed and Random Effects using Stata (v. 4.2) [Presentation]. Princeton University. https://www.princeton.edu/~otor-res/Panel101.pdf
Trinationale Metropolregion Oberrhein. (n.d.). Ausbildung und Arbeitsmarkt. http://www.rmtmo.eu/de/wirtschaft/projekte/ausbildung-und-arbeitsmarkt.html
Trinationale Metropolregion Oberrhein. (n.d.). EURES-T Oberrhein, Europäisches Informationsnetzwerk zu den Fragen der beruflichen grenzüberschreitenden Mobili-tät. http://www.rmtmo.eu/de/de/rmt-tmo/informationsstellen/eures-t-oberrhein.html
Verbeek, M. (2012). A Guide to Modern Econometrics (4th ed.). Chichester: Wiley.
Vicari, B. (2014). Grad der standardisierten Zertifizierung des Berufs: Ein Indikator zur Messung institutioneller Eigenschaften von Berufen (KldB 2010, KldB 1988). FDZ Methodenreport, 04/2014. http://doku.iab.de/fdz/reporte/2014/MR_04-14.pdf
Weber, E. (23/06/2016). Schätzung der Zahl der für Flüchtlinge relevanten Arbeits-stellen. IAB Aktuelle Berichte, 12/2016. http://doku.iab.de/aktuell/2016/aktueller_be-richt_1612.pdf
Working Group on Innovative Solutions to Cross-Border obstacles. (2017). Report. Retrieved from http://www.espaces-transfrontaliers.org/en/european-activities/work-ing-group-on-innovative-solutions-to-cross-border-obstacles/
Zettelmeier, W. (2005). Berufliche Bildung in Frankreich. In Bundesinstitut für Be-rufsbildung, & Deutsch-Französisches Institut (Eds.). Berufliche Bildung in Deutsch-land und Frankreich: Dossier für die Jahrestagung des Club d’Affaires Franco-Alle-mand. Wissenschaftliche Diskussionspapiere 74 (pp. 16-25). Retrieved from https://www.bibb.de/veroeffentlichungen/de/publication/show/2111
Zoller Schepers, R. (1998). Grenzüberschreitende Zusammenarbeit am Oberrhein: Analyse der politischen Strukturen, Prozesse und Leistungen in grenzüberschreiten-den Kooperationsorganen (Doctoral dissertation). St Gallen: n.p.

IAB-Discussion Paper 2/2018 93
Appendix
List of the interview partners and their positions
- Katia Beck : Chargée de mission Relation Ecole-Entreprise et Transfrontalier (Direction Apprentissage et Orientation) at Chambre de Commerce et d’In-dustrie Alsace Eurométropole
- Marlyce Breun : Directrice des affaires générales at Pôle emploi Grand Est - Katrin Distler: EURES-Beraterin, Deutscher Gewerkschaftsbund Bezirk Ba-
den-Württemberg: Büro für Europäische Regionalpolitik, Internationale Ge-werkschaftsräte Dreiländereck
- Simon Kaiser: Leiter Geschäftsbereich Aus- und Weiterbildung at Industrie- und Handelskammer Südlicher Oberrhein
- Anna Melchior: Ressortleiterin Europäische Angelegenheiten at Bunde-sagentur für Arbeit: Regionaldirektion Baden-Württemberg
- Christian Ramm: Vorsitzender der Geschäftsführung at Agentur für Arbeit Freiburg
- Horst Sahrbacher: Vorsitzender der Geschäftsführung at Agentur für Arbeit Offenburg
- Klaus Schüle : Stellvertretender Leiter der Stabsstelle Grenzüberschreitende Zusammenarbeit und europäische Angelegenheiten at Regierungspräsidium Freiburg
- Didier Taverne : Directeur des études at Agence d’Urbanisme de la Région Mulhousienne
- Alexandra Walonislow : Directrice at Maison de l’emploi et de la formation Mulhouse

IAB-Discussion Paper 2/2018 94
Guideline of Questions Sent Out to the Interviewees
English Version19:
How would you currently assess cross-border cooperation in the Upper Rhine Re-gion? In your opinion, how did the cooperation develop in recent years?
What kind of difficulties can be observed regarding cross-border cooperation?
How would you characterize the role of cross-border labor and educational mobility at the French-German border?
In your opinion, what kind of obstacles exist with respect to employment and voca-tional education at the French-German border?
Can you recall an example of how such an obstacle was successfully overcome in the past?
Which project(s) are currently most efficiently promoting cross-border mobility from your point of view?
To your knowledge, which measures are planned for the near future, for example based on the declaration of Hambach?
Which other measures would you think useful to further promote the mobility of workers and apprentices towards the neighboring country? What kind of obstacles could you imagine with regard to the adoption or implementation of these measures?
In your opinion, what would be the most beneficial design of the cross-border voca-tional education program?
How would you characterize the perception of the option of cross-border mobility by workers and apprentices – by those who have already gained some experience in this regard as well as by those who have not been active across the border so far?
(How would you evaluate the current labor market/market for vocational education in Baden/Alsace?) if applicable
In your opinion, what makes the cross-border labor and educational market attrac-tive for workers/apprentices, and which factors make it seem less appealing?
(How would you assess the attractiveness of cross-border mobility between Ger-many and France in comparison to Switzerland?) if applicable
19 The questions were provided either in French or in German to the interview partners.

IAB-Discussion Paper 2/2018 95
Table 3 Evolution of Average Completed Vacancy Periods and Absolute Increases for KldB Occupational (Main) Groups in Baden
KldB Occupational Groups and Occupa-tional Main Groups
2011 2012 2012-2011
2013 2013-2012
2014 2014-2013
2015 2015-2014
2016 2016-2015
12 Occupations in gardening and floristry 58,84 85,28 26,44 70,01 -15,27 87,52 17,52 98,44 10,92 108,79 10,35
121 Occupations in gardening 55,96 81,97 26,00 66,84 -15,12 84,02 17,18 92,65 8,63 96,38 3,73 22 Occupations in plastic-making and -processing, and wood-working and -pro-cessing
69,70 97,50 27,80 89,60 -7,91 79,65 -9,94 86,36 6,70 96,95 10,60
221 Occupations in plastic- and rubber-making and -processing
58,69 92,46 33,77 76,09 -16,37 67,23 -8,86 74,95 7,72 81,85 6,91
222 Occupations in colour coating and varnishing
85,07 99,76 14,69 107,67 7,91 85,02 -22,65 100,08 15,06 96,61 -3,47
223 Occupations in wood-working and -processing
75,31 102,23 26,92 100,61 -1,62 95,13 -5,49 98,12 3,00 117,56 19,44
23 Occupations in paper-making and -processing, printing, and in technical me-dia design
63,83 66,85 3,02 59,49 -7,36 65,16 5,67 73,62 8,45 74,27 0,65
24 Occupations in metal-making and -working, and in metal construction
79,84 111,31 31,47 88,42 -22,89 75,66 -12,76 93,73 18,07 100,23 6,50
242 Occupations in metalworking 74,25 104,29 30,04 76,38 -27,91 67,88 -8,50 86,13 18,24 93,99 7,86 244 Occupations in metal constructing and welding
83,04 115,79 32,75 105,68 -10,11 85,27 -20,41 104,72 19,45 115,35 10,63
245 Occupations in precision mechanics and tool making
91,63 127,20 35,57 93,25 -33,95 87,31 -5,94 105,14 17,83 96,14 -9,00
25 Technical occupations in machine-building and automotive industry
74,08 110,64 36,56 101,44 -9,20 86,99 -14,45 95,44 8,44 105,94 10,51
251 Occupations in machine-building and -operating
72,20 109,54 37,34 99,38 -10,16 78,51 -20,87 89,29 10,78 96,23 6,94
252 Technical occupations in the automo-tive, aeronautic, aerospace and ship building industries
77,16 112,19 35,03 104,42 -7,76 102,25 -2,17 106,59 4,34 121,77 15,18
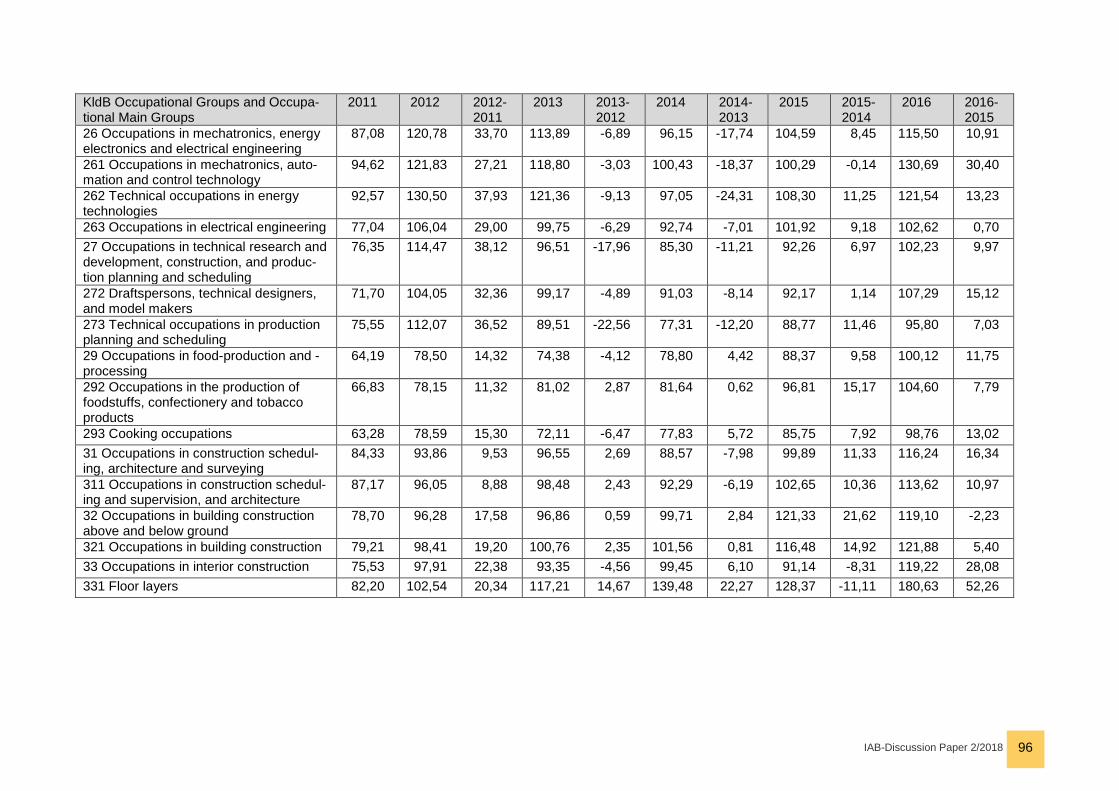
IAB-Discussion Paper 2/2018 96
KldB Occupational Groups and Occupa-tional Main Groups
2011 2012 2012-2011
2013 2013-2012
2014 2014-2013
2015 2015-2014
2016 2016-2015
26 Occupations in mechatronics, energy electronics and electrical engineering
87,08 120,78 33,70 113,89 -6,89 96,15 -17,74 104,59 8,45 115,50 10,91
261 Occupations in mechatronics, auto-mation and control technology
94,62 121,83 27,21 118,80 -3,03 100,43 -18,37 100,29 -0,14 130,69 30,40
262 Technical occupations in energy technologies
92,57 130,50 37,93 121,36 -9,13 97,05 -24,31 108,30 11,25 121,54 13,23
263 Occupations in electrical engineering 77,04 106,04 29,00 99,75 -6,29 92,74 -7,01 101,92 9,18 102,62 0,70 27 Occupations in technical research and development, construction, and produc-tion planning and scheduling
76,35 114,47 38,12 96,51 -17,96 85,30 -11,21 92,26 6,97 102,23 9,97
272 Draftspersons, technical designers, and model makers
71,70 104,05 32,36 99,17 -4,89 91,03 -8,14 92,17 1,14 107,29 15,12
273 Technical occupations in production planning and scheduling
75,55 112,07 36,52 89,51 -22,56 77,31 -12,20 88,77 11,46 95,80 7,03
29 Occupations in food-production and -processing
64,19 78,50 14,32 74,38 -4,12 78,80 4,42 88,37 9,58 100,12 11,75
292 Occupations in the production of foodstuffs, confectionery and tobacco products
66,83 78,15 11,32 81,02 2,87 81,64 0,62 96,81 15,17 104,60 7,79
293 Cooking occupations 63,28 78,59 15,30 72,11 -6,47 77,83 5,72 85,75 7,92 98,76 13,02 31 Occupations in construction schedul-ing, architecture and surveying
84,33 93,86 9,53 96,55 2,69 88,57 -7,98 99,89 11,33 116,24 16,34
311 Occupations in construction schedul-ing and supervision, and architecture
87,17 96,05 8,88 98,48 2,43 92,29 -6,19 102,65 10,36 113,62 10,97
32 Occupations in building construction above and below ground
78,70 96,28 17,58 96,86 0,59 99,71 2,84 121,33 21,62 119,10 -2,23
321 Occupations in building construction 79,21 98,41 19,20 100,76 2,35 101,56 0,81 116,48 14,92 121,88 5,40 33 Occupations in interior construction 75,53 97,91 22,38 93,35 -4,56 99,45 6,10 91,14 -8,31 119,22 28,08 331 Floor layers 82,20 102,54 20,34 117,21 14,67 139,48 22,27 128,37 -11,11 180,63 52,26

IAB-Discussion Paper 2/2018 97
KldB Occupational Groups and Occupa-tional Main Groups
2011 2012 2012-2011
2013 2013-2012
2014 2014-2013
2015 2015-2014
2016 2016-2015
332 Painters and varnishers, plasterers, occupations in the waterproofing of build-ings, preservation of structures and wooden building components
72,02 101,55 29,53 85,48 -16,08 81,19 -4,29 87,37 6,18 97,48 10,11
333 Occupations in the interior construc-tion and dry walling, insulation, carpentry, glazing, roller shutter and jalousie instal-lation
78,00 90,92 12,92 96,53 5,61 109,36 12,84 85,44 -23,92 130,83 45,38
34 Occupations in building services engi-neering and technical building services
90,62 113,51 22,88 107,95 -5,56 96,70 -11,24 101,72 5,02 111,75 10,03
342 Occupations in plumbing, sanitation, heating, ventilating, and air conditioning
108,68 128,54 19,86 129,52 0,98 117,44 -12,07 120,82 3,38 144,26 23,43
343 Occupations in building services and waste disposal
83,39 132,72 49,32 95,26 -37,45 86,16 -9,10 89,72 3,55 84,13 -5,59
41 Occupations in mathematics, biology, chemistry and physics
70,11 98,87 28,76 75,90 -22,97 65,48 -10,42 68,70 3,21 67,77 -0,92
413 Occupations in chemistry 68,36 100,44 32,08 76,49 -23,95 63,14 -13,35 69,24 6,10 67,65 -1,59 43 Occupations in computer science, in-formation and communication technology
91,03 115,92 24,89 113,91 -2,01 102,43 -11,49 117,88 15,46 115,81 -2,07
431 Occupations in computer science 92,45 115,77 23,33 113,65 -2,12 105,08 -8,58 127,51 22,44 116,41 -11,11 434 Occupations in software develop-ment and programming
115,02 146,12 31,10 136,79 -9,32 126,09 -10,71 136,48 10,39 119,24 -17,24
51 Occupations in traffic and logistics (without vehicle driving)
53,52 64,68 11,16 61,70 -2,98 57,41 -4,29 62,66 5,24 65,11 2,45
513 Occupations in warehousing and lo-gistics, in postal and other delivery ser-vices, and in cargo handling
50,43 63,36 12,93 61,25 -2,11 54,63 -6,63 60,05 5,43 61,64 1,58
516 Management assistants in transport and logistics
69,28 74,20 4,93 58,05 -16,15 62,01 3,96 76,18 14,17 81,05 4,87
52 Drivers and operators of vehicles and transport equipment
65,09 85,66 20,57 84,73 -0,93 74,69 -10,04 83,28 8,59 91,47 8,20
521 Driver of vehicles in road traffic 64,35 83,23 18,88 80,03 -3,20 81,94 1,91 94,77 12,82 106,24 11,47

IAB-Discussion Paper 2/2018 98
KldB Occupational Groups and Occupa-tional Main Groups
2011 2012 2012-2011
2013 2013-2012
2014 2014-2013
2015 2015-2014
2016 2016-2015
525 Drivers and operators of construction and transportation vehicles and equip-ment
65,79 89,04 23,25 90,84 1,80 64,38 -26,46 70,06 5,68 75,38 5,31
53 Occupations in safety and health pro-tection, security and surveillance
74,89 104,84 29,95 95,96 -8,87 111,59 15,63 95,45 -16,15 112,65 17,21
531 Occupations in physical security, per-sonal protection, fire protection and work-place safety
74,95 104,78 29,83 98,02 -6,76 113,52 15,50 96,14 -17,38 112,84 16,70
54 Occupations in cleaning services 44,73 54,60 9,87 61,61 7,01 63,85 2,24 74,10 10,26 72,36 -1,74 61 Occupations in purchasing, sales and trading
77,63 80,57 2,95 79,01 -1,56 83,60 4,59 84,32 0,71 84,15 -0,16
611 Occupations in purchasing and sales 80,70 81,80 1,10 81,31 -0,49 86,47 5,16 87,24 0,77 86,06 -1,18 62 Sales occupations in retail trade 61,38 73,71 12,34 80,88 7,16 84,44 3,57 99,46 15,02 127,02 27,56 621 Sales occupations in retail trade (without product specialisation)
55,65 69,65 14,00 73,54 3,89 84,96 11,42 102,80 17,84 127,96 25,16
622 Sales occupations (retail trade) sell-ing clothing, electronic devices, furniture, motor vehicles and other durables
62,21 83,07 20,86 94,67 11,60 82,65 -12,02 84,30 1,65 114,93 30,63
623 Sales occupations (retail) selling foodstuffs
78,29 79,96 1,67 91,28 11,32 86,30 -4,98 107,16 20,86 137,50 30,34
63 Occupations in tourism, hotels and restaurants
69,71 85,09 15,38 85,18 0,09 81,64 -3,54 89,92 8,27 97,09 7,17
632 Occupations in hotels 51,99 68,29 16,29 59,71 -8,57 57,98 -1,73 63,03 5,05 64,65 1,62 633 Gastronomy occupations 77,34 92,27 14,93 96,48 4,21 93,28 -3,20 106,94 13,67 114,55 7,61 71 Occupations in business management and organisation
46,21 52,51 6,30 50,31 -2,20 47,66 -2,65 49,75 2,09 74,97 25,22
713 Occupations in business organisation and strategy
59,49 66,89 7,40 64,89 -2,00 59,12 -5,77 65,11 5,99 92,26 27,15
714 Office clerks and secretaries 40,50 45,10 4,60 44,81 -0,29 42,39 -2,42 44,45 2,07 73,04 28,58 715 Occupations in human resources management and personnel service
49,07 62,72 13,65 53,74 -8,98 56,27 2,53 48,97 -7,30 52,14 3,18

IAB-Discussion Paper 2/2018 99
KldB Occupational Groups and Occupa-tional Main Groups
2011 2012 2012-2011
2013 2013-2012
2014 2014-2013
2015 2015-2014
2016 2016-2015
72 Occupations in financial services, ac-counting and tax consultancy
66,17 77,59 11,42 73,04 -4,54 66,91 -6,13 78,94 12,03 91,36 12,42
721 Occupations in insurance and finan-cial services
106,55 102,68 -3,87 86,10 -16,59 85,40 -0,70 107,66 22,27 120,29 12,62
722 Occupations in accounting, control-ling and auditing
53,73 63,99 10,26 59,40 -4,59 53,10 -6,30 58,76 5,66 66,59 7,84
723 Occupations in tax consultancy20 x 65,20 x 93,78 28,58 96,85 3,07 110,07 13,22 136,65 26,58 73 Occupations in law and public admin-istration
44,91 50,42 5,51 51,84 1,42 46,72 -5,12 49,22 2,50 72,06 22,84
732 Occupations in public administration 45,66 44,16 -1,50 51,42 7,27 42,13 -9,29 44,89 2,76 59,72 14,83 81 Medical and health care occupations 72,96 86,25 13,29 86,56 0,31 86,07 -0,49 100,30 14,23 122,47 22,17 811 Doctors’ receptionists and assistants 45,86 54,03 8,17 64,80 10,77 67,23 2,43 79,23 12,00 80,91 1,68 813 Occupations in nursing, emergency medical services and obstetrics
107,84 124,46 16,62 119,71 -4,75 116,36 -3,35 116,42 0,06 177,65 61,22
817 Occupations in non-medical therapy and alternative medicine
58,49 66,62 8,13 73,92 7,30 86,79 12,87 123,47 36,68 138,87 15,40
82 Occupations in non-medical healthcare, body care, wellness and med-ical technicians
107,87 133,21 25,34 122,11 -11,11 115,41 -6,70 148,84 33,44 155,34 6,50
821 Occupations in geriatric care 111,64 139,94 28,29 125,46 -14,48 102,76 -22,70 142,79 40,02 154,30 11,51 823 Occupations in body care 93,03 129,75 36,73 118,77 -10,99 142,05 23,29 162,86 20,80 164,64 1,78 825 Technical occupations in medicine, orthopedic and rehabilitation
126,70 122,91 -3,79 125,28 2,37 110,31 -14,97 155,39 45,08 152,25 -3,14
83 Occupations in education and social work, housekeeping, and theology
42,84 50,39 7,56 55,43 5,04 58,78 3,35 68,38 9,60 72,57 4,18
20 Please note that occupations in tax consultancy (723) only meet the relevance criteria from 2012 onwards and have thus not been taken into account for 2011

IAB-Discussion Paper 2/2018 100
KldB Occupational Groups and Occupa-tional Main Groups
2011 2012 2012-2011
2013 2013-2012
2014 2014-2013
2015 2015-2014
2016 2016-2015
831 Occupations in education and social work, and pedagogic specialists in social care work
41,40 50,07 8,67 55,71 5,64 58,70 2,99 68,83 10,13 73,57 4,74
92 Occupations in advertising and mar-keting, in commercial and editorial media design
87,26 86,50 -0,76 84,40 -2,10 81,37 -3,03 85,71 4,34 111,54 25,83
921 Occupations in advertising and mar-keting
89,59 87,12 -2,47 85,27 -1,85 81,12 -4,16 86,54 5,42 116,79 30,26
Average over all professions 69,10 88,25 83,81 78,68 87,48 99,18 140% Threshold 96,74 123,55 117,34 110,16 122,47 138,85
Source: BA labor market statistics; own depiction
(Only those professional groups were included in the table that meet the relevance and stability criteria.)
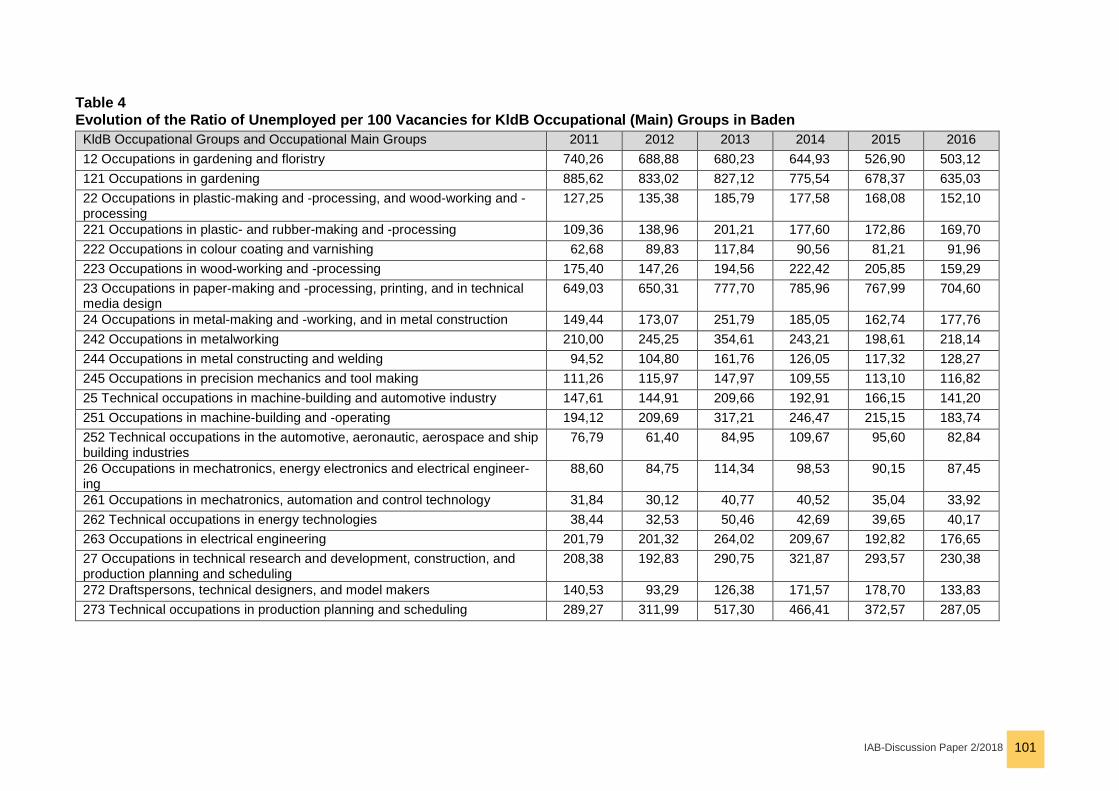
IAB-Discussion Paper 2/2018 101
Table 4 Evolution of the Ratio of Unemployed per 100 Vacancies for KldB Occupational (Main) Groups in Baden
KldB Occupational Groups and Occupational Main Groups 2011 2012 2013 2014 2015 2016 12 Occupations in gardening and floristry 740,26 688,88 680,23 644,93 526,90 503,12 121 Occupations in gardening 885,62 833,02 827,12 775,54 678,37 635,03 22 Occupations in plastic-making and -processing, and wood-working and -processing
127,25 135,38 185,79 177,58 168,08 152,10
221 Occupations in plastic- and rubber-making and -processing 109,36 138,96 201,21 177,60 172,86 169,70 222 Occupations in colour coating and varnishing 62,68 89,83 117,84 90,56 81,21 91,96 223 Occupations in wood-working and -processing 175,40 147,26 194,56 222,42 205,85 159,29 23 Occupations in paper-making and -processing, printing, and in technical media design
649,03 650,31 777,70 785,96 767,99 704,60
24 Occupations in metal-making and -working, and in metal construction 149,44 173,07 251,79 185,05 162,74 177,76 242 Occupations in metalworking 210,00 245,25 354,61 243,21 198,61 218,14 244 Occupations in metal constructing and welding 94,52 104,80 161,76 126,05 117,32 128,27 245 Occupations in precision mechanics and tool making 111,26 115,97 147,97 109,55 113,10 116,82 25 Technical occupations in machine-building and automotive industry 147,61 144,91 209,66 192,91 166,15 141,20 251 Occupations in machine-building and -operating 194,12 209,69 317,21 246,47 215,15 183,74 252 Technical occupations in the automotive, aeronautic, aerospace and ship building industries
76,79 61,40 84,95 109,67 95,60 82,84
26 Occupations in mechatronics, energy electronics and electrical engineer-ing
88,60 84,75 114,34 98,53 90,15 87,45
261 Occupations in mechatronics, automation and control technology 31,84 30,12 40,77 40,52 35,04 33,92 262 Technical occupations in energy technologies 38,44 32,53 50,46 42,69 39,65 40,17 263 Occupations in electrical engineering 201,79 201,32 264,02 209,67 192,82 176,65 27 Occupations in technical research and development, construction, and production planning and scheduling
208,38 192,83 290,75 321,87 293,57 230,38
272 Draftspersons, technical designers, and model makers 140,53 93,29 126,38 171,57 178,70 133,83 273 Technical occupations in production planning and scheduling 289,27 311,99 517,30 466,41 372,57 287,05

IAB-Discussion Paper 2/2018 102
KldB Occupational Groups and Occupational Main Groups 2011 2012 2013 2014 2015 2016 29 Occupations in food-production and -processing 460,55 424,20 503,27 426,69 345,30 347,64 292 Occupations in the production of foodstuffs, confectionery and tobacco products
224,08 215,56 272,95 227,13 201,01 187,05
293 Cooking occupations 546,78 497,41 585,63 502,63 393,77 404,97 31 Occupations in construction scheduling, architecture and surveying 187,67 157,74 161,40 100,44 86,50 83,54 311 Occupations in construction scheduling and supervision, and architecture 182,76 151,85 155,39 101,39 88,99 83,66 32 Occupations in building construction above and below ground 328,94 299,56 306,50 298,72 257,45 249,26 321 Occupations in building construction 345,80 333,43 355,67 328,67 299,69 277,35 33 Occupations in interior construction 236,12 228,47 280,71 294,02 276,40 259,03 331 Floor layers 176,57 153,27 172,02 180,92 150,70 134,78 332 Painters and varnishers, plasterers, occupations in the waterproofing of buildings, preservation of structures and wooden building components
296,23 278,78 378,09 392,61 321,81 356,21
333 Occupations in the interior construction and dry walling, insulation, car-pentry, glazing, roller shutter and jalousie installation
180,00 189,31 214,02 234,79 271,59 217,89
34 Occupations in building services engineering and technical building ser-vices
276,37 236,39 276,00 258,84 244,88 222,20
342 Occupations in plumbing, sanitation, heating, ventilating, and air condi-tioning
49,02 36,64 45,84 46,50 47,87 50,19
343 Occupations in building services and waste disposal 144,64 135,15 181,88 191,90 217,39 149,32 41 Occupations in mathematics, biology, chemistry and physics 281,02 313,81 483,47 512,40 520,13 456,15 413 Occupations in chemistry 245,02 257,57 350,65 404,77 370,20 333,40 43 Occupations in computer science, information and communication tech-nology
195,75 158,25 205,62 213,72 223,53 150,23
431 Occupations in computer science 132,55 108,97 131,47 142,45 147,98 89,16 434 Occupations in software development and programming 134,32 112,30 141,09 165,68 189,01 166,69 51 Occupations in traffic and logistics (without vehicle driving) 675,05 705,78 826,91 766,68 573,33 489,02 513 Occupations in warehousing and logistics, in postal and other delivery services, and in cargo handling
805,19 850,85 981,23 915,49 672,07 556,59
516 Management assistants in transport and logistics 130,61 153,30 202,64 212,26 162,69 152,13

IAB-Discussion Paper 2/2018 103
KldB Occupational Groups and Occupational Main Groups 2011 2012 2013 2014 2015 2016 52 Drivers and operators of vehicles and transport equipment 376,99 361,92 458,39 445,45 337,74 257,21 521 Driver of vehicles in road traffic 435,82 428,56 518,22 520,78 391,08 333,14 525 Drivers and operators of construction and transportation vehicles and equipment
278,23 262,96 378,27 323,63 255,14 166,21
53 Occupations in safety and health protection, security and surveillance 1218,09 785,74 760,77 569,36 574,60 312,07 531 Occupations in physical security, personal protection, fire protection and workplace safety
1256,81 793,79 779,06 576,38 582,48 313,13
54 Occupations in cleaning services 2447,98 2306,76 2133,73 2056,75 1773,60 1527,78 61 Occupations in purchasing, sales and trading 279,11 261,69 332,03 348,26 333,65 254,54 611 Occupations in purchasing and sales 246,37 245,84 295,12 313,88 312,56 239,26 62 Sales occupations in retail trade 751,61 598,12 589,72 494,25 323,88 274,41 621 Sales occupations in retail trade (without product specialisation) 1139,39 924,91 861,44 703,60 434,95 365,50 622 Sales occupations (retail trade) selling clothing, electronic devices, furni-ture, motor vehicles and other durables
193,41 183,30 258,18 248,96 165,87 149,81
623 Sales occupations (retail) selling foodstuffs 285,27 184,65 166,42 128,61 95,93 77,34 63 Occupations in tourism, hotels and restaurants 349,72 279,33 355,19 352,09 264,55 257,86 632 Occupations in hotels 535,57 480,43 654,64 509,88 414,67 362,94 633 Gastronomy occupations 285,54 211,71 273,36 278,53 202,29 209,30 71 Occupations in business management and organisation 876,72 838,70 1010,62 894,15 723,86 447,26 713 Occupations in business organisation and strategy 357,32 366,68 512,51 435,68 359,40 209,24 714 Office clerks and secretaries 1302,05 1227,63 1401,41 1260,79 951,51 565,66 715 Occupations in human resources management and personnel service 178,84 187,83 227,84 206,19 249,30 212,40 72 Occupations in financial services, accounting and tax consultancy 246,45 194,67 211,68 200,91 173,64 205,13 721 Occupations in insurance and financial services 277,55 290,58 340,51 332,17 237,17 279,81 722 Occupations in accounting, controlling and auditing 289,58 217,53 248,22 237,29 214,02 241,49 723 Occupations in tax consultancy
63,29 60,00 52,53 46,94 61,45
73 Occupations in law and public administration 301,30 240,72 274,74 232,56 169,12 102,61 732 Occupations in public administration 228,95 157,50 184,11 160,60 112,89 88,91

IAB-Discussion Paper 2/2018 104
KldB Occupational Groups and Occupational Main Groups 2011 2012 2013 2014 2015 2016 81 Medical and health care occupations 184,06 163,43 159,00 126,94 101,13 93,07 811 Doctors’ receptionists and assistants 268,31 175,33 162,31 133,56 112,42 94,00 813 Occupations in nursing, emergency medical services and obstetrics 103,32 98,07 102,39 82,14 55,97 51,52 817 Occupations in non-medical therapy and alternative medicine 225,73 235,43 160,94 108,22 97,03 83,69 82 Occupations in non-medical healthcare, body care, wellness and medical technicians
194,28 172,40 175,78 154,23 122,47 133,17
821 Occupations in geriatric care 192,02 179,09 188,04 162,59 112,79 120,05 823 Occupations in body care 231,06 181,62 161,45 150,72 140,77 157,56 825 Technical occupations in medicine, orthopedic and rehabilitation 83,52 72,29 104,79 71,01 65,19 72,51 83 Occupations in education and social work, housekeeping, and theology 474,36 399,64 359,41 342,73 278,59 253,83 831 Occupations in education and social work, and pedagogic specialists in social care work
307,93 249,59 222,23 212,16 183,67 171,95
92 Occupations in advertising and marketing, in commercial and editorial me-dia design
263,43 246,35 323,66 323,76 265,12 250,11
921 Occupations in advertising and marketing 216,95 200,38 265,65 278,26 223,64 210,33
Source: BA labor market statistics; own depictions
(Only those professional groups were included in the table that meet the relevance and stability criteria.)
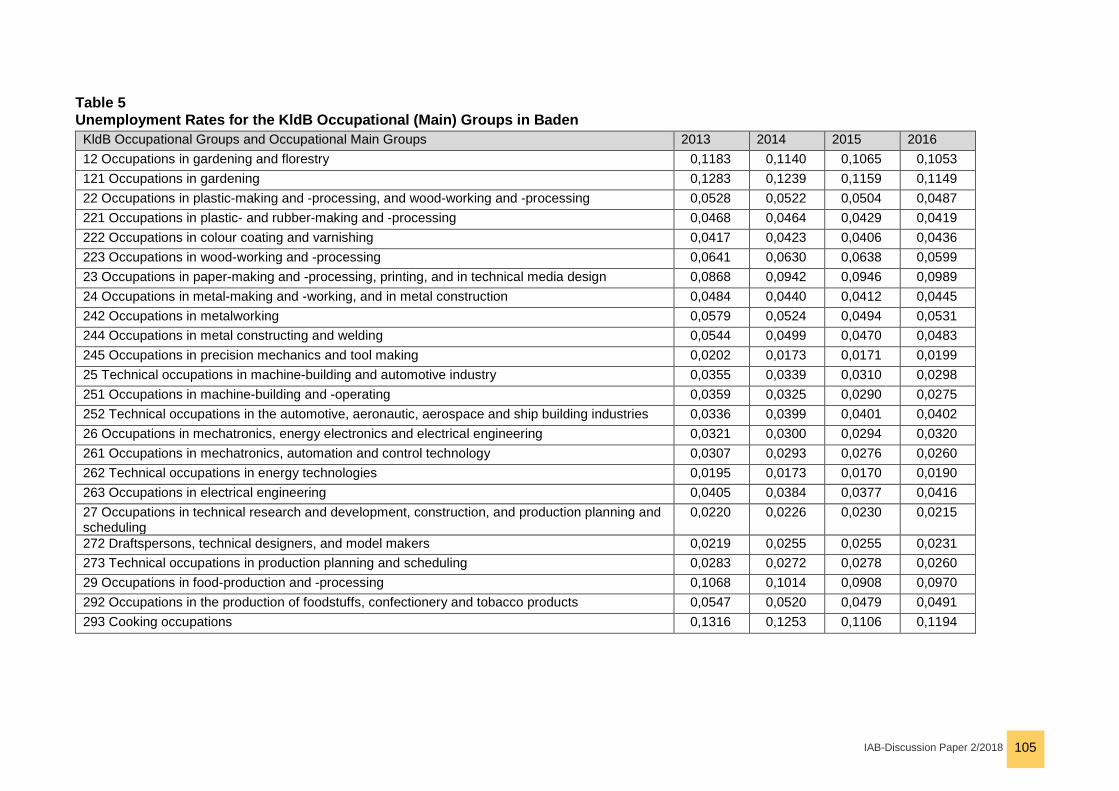
IAB-Discussion Paper 2/2018 105
Table 5 Unemployment Rates for the KldB Occupational (Main) Groups in Baden
KldB Occupational Groups and Occupational Main Groups 2013 2014 2015 2016 12 Occupations in gardening and florestry 0,1183 0,1140 0,1065 0,1053 121 Occupations in gardening 0,1283 0,1239 0,1159 0,1149 22 Occupations in plastic-making and -processing, and wood-working and -processing 0,0528 0,0522 0,0504 0,0487 221 Occupations in plastic- and rubber-making and -processing 0,0468 0,0464 0,0429 0,0419 222 Occupations in colour coating and varnishing 0,0417 0,0423 0,0406 0,0436 223 Occupations in wood-working and -processing 0,0641 0,0630 0,0638 0,0599 23 Occupations in paper-making and -processing, printing, and in technical media design 0,0868 0,0942 0,0946 0,0989 24 Occupations in metal-making and -working, and in metal construction 0,0484 0,0440 0,0412 0,0445 242 Occupations in metalworking 0,0579 0,0524 0,0494 0,0531 244 Occupations in metal constructing and welding 0,0544 0,0499 0,0470 0,0483 245 Occupations in precision mechanics and tool making 0,0202 0,0173 0,0171 0,0199 25 Technical occupations in machine-building and automotive industry 0,0355 0,0339 0,0310 0,0298 251 Occupations in machine-building and -operating 0,0359 0,0325 0,0290 0,0275 252 Technical occupations in the automotive, aeronautic, aerospace and ship building industries 0,0336 0,0399 0,0401 0,0402 26 Occupations in mechatronics, energy electronics and electrical engineering 0,0321 0,0300 0,0294 0,0320 261 Occupations in mechatronics, automation and control technology 0,0307 0,0293 0,0276 0,0260 262 Technical occupations in energy technologies 0,0195 0,0173 0,0170 0,0190 263 Occupations in electrical engineering 0,0405 0,0384 0,0377 0,0416 27 Occupations in technical research and development, construction, and production planning and scheduling
0,0220 0,0226 0,0230 0,0215
272 Draftspersons, technical designers, and model makers 0,0219 0,0255 0,0255 0,0231 273 Technical occupations in production planning and scheduling 0,0283 0,0272 0,0278 0,0260 29 Occupations in food-production and -processing 0,1068 0,1014 0,0908 0,0970 292 Occupations in the production of foodstuffs, confectionery and tobacco products 0,0547 0,0520 0,0479 0,0491 293 Cooking occupations 0,1316 0,1253 0,1106 0,1194
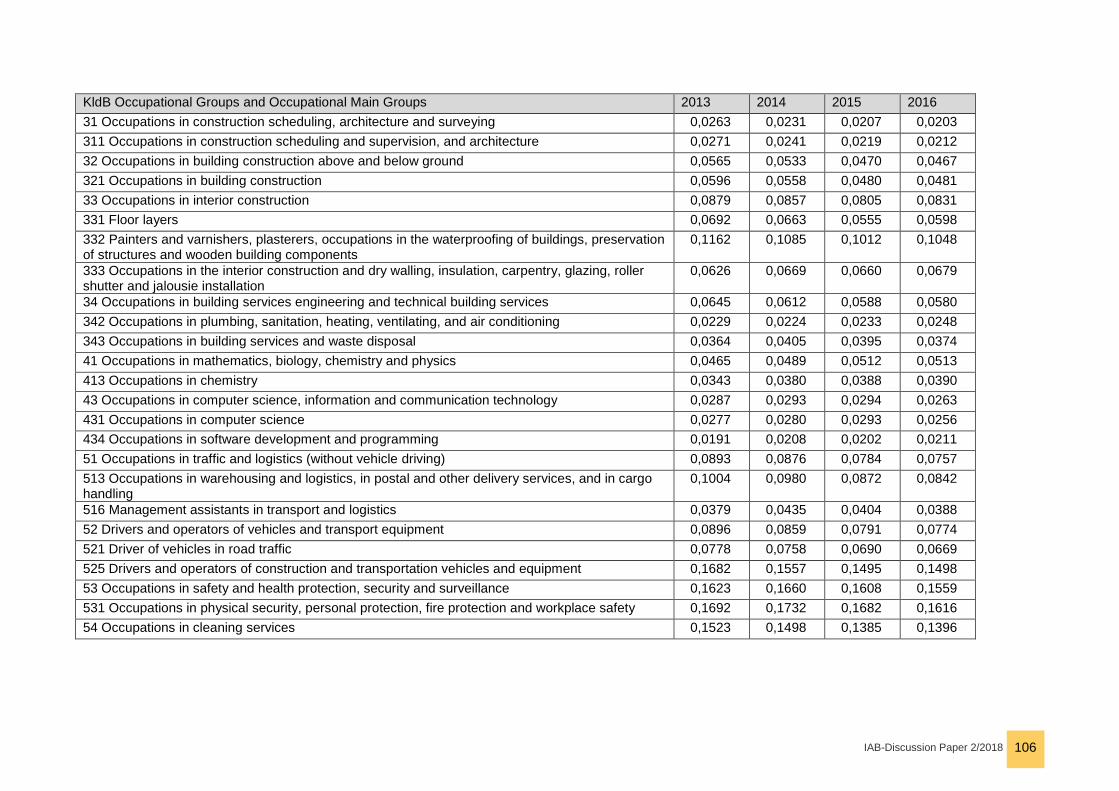
IAB-Discussion Paper 2/2018 106
KldB Occupational Groups and Occupational Main Groups 2013 2014 2015 2016 31 Occupations in construction scheduling, architecture and surveying 0,0263 0,0231 0,0207 0,0203 311 Occupations in construction scheduling and supervision, and architecture 0,0271 0,0241 0,0219 0,0212 32 Occupations in building construction above and below ground 0,0565 0,0533 0,0470 0,0467 321 Occupations in building construction 0,0596 0,0558 0,0480 0,0481 33 Occupations in interior construction 0,0879 0,0857 0,0805 0,0831 331 Floor layers 0,0692 0,0663 0,0555 0,0598 332 Painters and varnishers, plasterers, occupations in the waterproofing of buildings, preservation of structures and wooden building components
0,1162 0,1085 0,1012 0,1048
333 Occupations in the interior construction and dry walling, insulation, carpentry, glazing, roller shutter and jalousie installation
0,0626 0,0669 0,0660 0,0679
34 Occupations in building services engineering and technical building services 0,0645 0,0612 0,0588 0,0580 342 Occupations in plumbing, sanitation, heating, ventilating, and air conditioning 0,0229 0,0224 0,0233 0,0248 343 Occupations in building services and waste disposal 0,0364 0,0405 0,0395 0,0374 41 Occupations in mathematics, biology, chemistry and physics 0,0465 0,0489 0,0512 0,0513 413 Occupations in chemistry 0,0343 0,0380 0,0388 0,0390 43 Occupations in computer science, information and communication technology 0,0287 0,0293 0,0294 0,0263 431 Occupations in computer science 0,0277 0,0280 0,0293 0,0256 434 Occupations in software development and programming 0,0191 0,0208 0,0202 0,0211 51 Occupations in traffic and logistics (without vehicle driving) 0,0893 0,0876 0,0784 0,0757 513 Occupations in warehousing and logistics, in postal and other delivery services, and in cargo handling
0,1004 0,0980 0,0872 0,0842
516 Management assistants in transport and logistics 0,0379 0,0435 0,0404 0,0388 52 Drivers and operators of vehicles and transport equipment 0,0896 0,0859 0,0791 0,0774 521 Driver of vehicles in road traffic 0,0778 0,0758 0,0690 0,0669 525 Drivers and operators of construction and transportation vehicles and equipment 0,1682 0,1557 0,1495 0,1498 53 Occupations in safety and health protection, security and surveillance 0,1623 0,1660 0,1608 0,1559 531 Occupations in physical security, personal protection, fire protection and workplace safety 0,1692 0,1732 0,1682 0,1616 54 Occupations in cleaning services 0,1523 0,1498 0,1385 0,1396

IAB-Discussion Paper 2/2018 107
KldB Occupational Groups and Occupational Main Groups 2013 2014 2015 2016 61 Occupations in purchasing, sales and trading 0,0406 0,0433 0,0406 0,0376 611 Occupations in purchasing and sales 0,0367 0,0393 0,0370 0,0350 62 Sales occupations in retail trade 0,0809 0,0779 0,0700 0,0694 621 Sales occupations in retail trade (without product specialisation) 0,1090 0,1058 0,0944 0,0938 622 Sales occupations (retail trade) selling clothing, electronic devices, furniture, motor vehicles and other durables
0,0306 0,0297 0,0279 0,0287
623 Sales occupations (retail) selling foodstuffs 0,0412 0,0370 0,0328 0,0310 63 Occupations in tourism, hotels and restaurants 0,0961 0,0923 0,0814 0,0767 632 Occupations in hotels 0,1433 0,1375 0,1216 0,1108 633 Gastronomy occupations 0,0847 0,0818 0,0704 0,0680 71 Occupations in business management and organisation 0,0448 0,0432 0,0395 0,0379 713 Occupations in business organisation and strategy 0,0148 0,0140 0,0131 0,0122 714 Office clerks and secretaries 0,0679 0,0658 0,0602 0,0584 715 Occupations in human resources management and personnel service 0,0369 0,0379 0,0377 0,0357 72 Occupations in financial services, accounting and tax consultancy 0,0157 0,0162 0,0157 0,0168 721 Occupations in insurance and financial services 0,0094 0,0106 0,0101 0,0121 722 Occupations in accounting, controlling and auditing 0,0297 0,0290 0,0284 0,0280 723 Occupations in tax consultancy 0,0119 0,0117 0,0102 0,0110 73 Occupations in law and public administration 0,0165 0,0164 0,0148 0,0147 732 Occupations in public administration 0,0082 0,0088 0,0080 0,0087 81 Medical and health care occupations 0,0200 0,0187 0,0174 0,0179 811 Doctors’ receptionists and assistants 0,0251 0,0240 0,0222 0,0206 813 Occupations in nursing, emergency medical services and obstetrics 0,0108 0,0100 0,0091 0,0096 817 Occupations in non-medical therapy and alternative medicine 0,0348 0,0307 0,0287 0,0273 82 Occupations in non-medical healthcare, body care, wellness and medical technicians 0,0563 0,0573 0,0516 0,0518 821 Occupations in geriatric care 0,0523 0,0531 0,0465 0,0459 823 Occupations in body care 0,0832 0,0850 0,0759 0,0782

IAB-Discussion Paper 2/2018 108
KldB Occupational Groups and Occupational Main Groups 2013 2014 2015 2016 825 Technical occupations in medicine, orthopaedic and rehabilitation 0,0274 0,0243 0,0238 0,0239 83 Occupations in education and social work, housekeeping, and theology 0,0440 0,0434 0,0395 0,0392 831 Occupations in education and social work, and pedagogic specialists in social care work 0,0310 0,0297 0,0283 0,0283 92 Occupations in advertising and marketing, in commercial and editorial media design 0,0491 0,0525 0,0501 0,0474 921 Occupations in advertising and marketing 0,0516 0,0564 0,0528 0,0487
Source: BA labor market and employment statistics; own depictions
(Only those professional groups were included in the table that meet the relevance and stability criteria.)

IAB-Discussion Paper 2/2018 109
Table 6 Share of Planned Recruitment Projects Presumed to be Difficult for the FAP Professions in Alsace
Occupation (FAP) 2013 2014 2015 2016 2017 A0Z40 Agriculteurs salariés 52,90% 12,50% 19,70% 24,60% 26,00% A0Z41 Eleveurs salariés 78,00% 12,50% 59,10% 59,70% 48,00% A0Z42 Bûcherons, sylviculteurs salariés et agents forestiers 76,80% 2,70% 0,00% 15,50% 96,60% A0Z43 Conducteurs d'engins agricoles ou forestiers 100,00% 84,50% 19,80% 68,90% 78,50% A1Z40 Maraîchers, horticulteurs salariés 14,40% 12,90% 42,20% 15,90% 6,40% A1Z41 Jardiniers salariés 24,80% 25,80% 31,90% 18,70% 29,20% A1T42 Viticulteurs, arboriculteurs salariés 15,40% 10,50% 6,60% 13,50% 12,10% A2Z70 Techn. et agents d'encadrement d'exploitations agricoles 0,00% 83,20% 41,20% 0,00% 55,90% A2T90 Ingénieurs, cadres techniques de l'agriculture 64,50% 86,00% 0,00% 0,00% 0,00% A3Z41 Marins salariés 0,00% 100,00% 100,00% 0,00% 0,00% B0Z20 Ouvriers non qualifiés des travaux publics, du béton et de l'extraction 26,90% 62,90% 20,90% 39,50% 10,70% B0Z21 Ouvriers non qualifiés du gros œuvre du bâtiment 67,40% 67,60% 66,20% 36,10% 50,00% B1Z40 Ouvriers qualifiés des travaux publics, du béton et de l'extraction 56,50% 62,80% 57,10% 63,70% 60,20% B2Z40 Maçons 54,90% 66,50% 57,10% 45,50% 64,20% B2Z41 Professionnels du travail de la pierre et des matériaux associés 0,00% 0,00% 100,00% 63,70% 100,00% B2Z42 Charpentiers (métal) 100,00% 0,00% 0,00% 100,00% 100,00% B2Z43 Charpentiers (bois) 100,00% 86,70% 87,50% 83,00% 100,00% B2Z44 Couvreurs 74,80% 71,70% 64,80% 75,00% 75,00% B3Z20 Ouvriers non qualifiés du second œuvre du bâtiment 40,90% 54,30% 52,00% 26,20% 45,10% B4Z41 Plombiers, chauffagistes 74,60% 64,70% 76,90% 52,30% 70,60% B4Z42 Menuisiers et ouvriers de l'agencement et de l'isolation 52,70% 60,30% 70,90% 55,90% 70,40% B4Z43 Electriciens du bâtiment 46,60% 71,80% 71,90% 18,20% 43,20% B4Z44 Ouvriers qualifiés de la peinture et de la finition du bâtiment 38,40% 69,80% 30,50% 36,60% 71,10% B5Z40 Conducteurs d'engins du BTP 44,00% 66,70% 33,50% 59,50% 63,80%

IAB-Discussion Paper 2/2018 110
Occupation (FAP) 2013 2014 2015 2016 2017 B6Z70 Géomètres 0,00% 100,00% 100,00% 13,60% 82,40% B6Z71 Techniciens et chargés d'études du BTP 37,30% 24,50% 45,20% 36,50% 43,30% B6Z72 Dessinateurs en BTP 66,30% 36,00% 57,30% 67,90% 41,30% B6Z73 Chefs de chantier, conducteurs de travaux (non cadres) 63,90% 55,80% 94,40% 79,60% 51,60% B7Z90 Architectes 94,20% 0,00% 23,20% 66,20% 12,10% B7Z91 Ingénieurs du BTP, chefs de chantier et conducteurs de travaux (cadres) 59,30% 53,60% 72,50% 43,70% 61,40% C0Z20 Ouvriers non qualifiés de l'électricité et de l'électronique 100,00% 29,50% 22,00% 18,80% 9,70% C1Z40 Ouvriers qualifiés de l'électricité et de l'électronique 58,70% 29,70% 33,80% 10,00% 32,90% C2Z70 Techniciens en électricité et en électronique 63,90% 34,50% 71,30% 35,30% 85,70% C2Z71 Dessinateurs en électricité et en électronique 20,80% 52,50% 100,00% 35,00% 70,30% C2Z80 Agents de maîtrise et assimilés en fabrication de matériel élec., électron. 0,00% 17,80% 0,00% 46,30% 58,30% D0Z20 Ouvriers non qualifiés travaillant par enlèvement ou formage de métal 69,90% 69,10% 43,40% 33,20% 40,90% D1Z40 Régleurs 43,70% 16,30% 100,00% 77,90% 66,10% D1Z41 Ouvriers qualifiés travaillant par enlèvement de métal 80,60% 65,70% 50,20% 66,10% 51,30% D2Z40 Chaudronniers, tôliers, traceurs, serruriers, métalliers, forgerons 63,30% 62,40% 95,90% 47,30% 78,50% D2Z41 Tuyauteurs 100,00% 78,80% 100,00% 0,00% 100,00% D2Z42 Soudeurs 47,40% 76,30% 91,70% 86,30% 52,80% D3Z20 Ouvriers non qualifiés métallerie, serrurerie, montage 15,70% 21,00% 23,10% 13,20% 47,10% D4Z40 Monteurs, ajusteurs et autres ouvriers qualifiés de la mécanique 97,00% 34,10% 71,20% 32,10% 37,40% D4Z41 Agents qualifiés de traitement thermique et de surface 0,00% 88,60% 82,50% 100,00% 36,20% D6Z70 Techniciens en mécanique et travail des métaux 100,00% 43,40% 43,50% 53,10% 84,10% D6Z71 Dessinateurs en mécanique et travail des métaux 58,70% 76,30% 100,00% 48,90% 57,70% D6Z80 Agents de maîtrise et assimilés en fabrication mécanique 28,70% 100,00% 100,00% 65,00% 43,40% E0Z20 Ouvriers non qualifiés des industries chimiques et plastiques 29,60% 10,00% 59,10% 9,70% 22,90% E0Z21 Ouvriers non qualifiés des industries agro-alimentaires 61,40% 21,00% 27,60% 29,50% 57,60% E0Z22 Ouvriers non qualifiés en métallurgie, verre, céramique et matériaux de construction 7,80% 0,00% 0,00% 45,30% 51,40%

IAB-Discussion Paper 2/2018 111
Occupation (FAP) 2013 2014 2015 2016 2017 E0Z23 Ouvriers non qualifiés du papier-carton et du bois 0,00% 0,00% 8,10% 61,60% 30,10% E0Z24 Autres ouvriers non qualifiés de type industriel 28,20% 49,10% 48,60% 45,50% 6,50% E1Z40 Pilotes d'installation lourde des industries de transformation 100,00% 83,90% 100,00% 79,40% 16,20% E1Z41 Autres ouvriers qualifiés des industries chimiques et plastiques 42,90% 31,90% 59,60% 6,70% 42,60% E1Z42 Autres ouvriers qualifiés des industries agro-alimentaires (hors transformation des viandes)
44,20% 36,00% 66,90% 56,40% 41,20%
E1Z43 Autres ouvriers qualifiés en verre, céramique, métallurgie, matériaux de construction et énergie
5,50% 100,00% 33,80% 19,10% 90,60%
E1Z44 Ouvriers qualifiés des industries lourdes du bois et de la fabrication de papier-carton 100,00% 0,00% 7,30% 50,10% 53,00% E1Z46 Agents qualifiés de laboratoire 71,30% 0,00% 19,20% 18,70% 32,20% E1Z47 Autres ouvriers qualifiés de type industriel 21,70% 41,30% 37,10% 76,00% 0,00% E2Z70 Techniciens des industries de process 16,50% 53,20% 55,10% 35,90% 53,10% E2Z80 Agents de maîtrise et assimilés des industries de process 34,30% 36,60% 9,50% 38,40% 0,00% F0Z20 Ouvriers non qualifiés du textile et du cuir 38,50% 18,80% 60,60% 58,30% 59,70% F1Z40 Ouvriers qualifiés du travail industriel du textile et du cuir 0,00% 19,60% 0,00% 59,10% 0,00% F1Z41 Ouvriers qualifiés du travail artisanal du textile et du cuir 28,30% 43,00% 100,00% 18,60% 19,70% F2Z20 Ouvriers non qualifiés du travail du bois et de l'ameublement 27,50% 31,80% 24,30% 10,00% 7,00% F3Z41 Ouvriers qualifiés du travail du bois et de l'ameublement 37,20% 14,30% 19,80% 24,10% 54,70% F4Z20 Ouvriers non qualifiés de l'imprimerie, de la presse et de l'édition 0,00% 22,40% 100,00% 20,60% 0,00% F4Z41 Ouvriers qualifiés de l'impression et du façonnage des industries graphiques 100,00% 12,70% 21,80% 49,40% 89,60% F5Z70 Techn. et agents de maîtrise des matériaux souples, du bois et des indust. graphiques 32,40% 100,00% 67,60% 65,90% 57,90% G0A40 Ouvriers qualifiés de la maintenance en mécanique 62,10% 56,30% 71,80% 46,90% 44,70% G0A41 Ouvriers qualifiés de la maintenance en électricité et en électronique 58,30% 64,60% 72,80% 61,20% 38,60% G0A42 Mainteniciens en biens électrodomestiques 0,00% 21,60% 11,30% 0,00% 100,00% G0A43 Ouvriers qualifiés polyvalents d'entretien du bâtiment 53,50% 43,00% 32,50% 13,20% 49,40% G0B40 Carrossiers automobiles 80,00% 87,40% 71,70% 9,60% 92,20% G0B41 Mécaniciens et électroniciens de véhicules 58,20% 67,90% 79,20% 44,60% 63,90%

IAB-Discussion Paper 2/2018 112
Occupation (FAP) 2013 2014 2015 2016 2017 G1Z70 Techn. et agents de maîtrise de la maintenance et de l'environnement 52,70% 77,60% 67,30% 51,80% 62,30% G1271 Techniciens experts 15,80% 26,50% 100,00% 67,80% 100,00% G1Z80 Agents de maîtrise en entretien 58,10% 13,40% 7,60% 44,00% 100,00% H0Z90 Ingénieurs et cadres de fabrication et de la production 63,30% 31,70% 64,00% 23,60% 34,60% H0Z91 Cadres techniques de la maintenance et de l'environnement 38,00% 16,50% 16,50% 49,60% 28,00% H0Z92 Ingénieurs des méthodes de production, du contrôle qualité 45,50% 31,80% 47,70% 17,00% 41,40% J0Z20 Ouvriers non qualifiés de l'emballage et manutentionnaires 45,20% 33,30% 31,30% 16,60% 11,30% J1Z40 Ouvriers qualifiés du magasinage et de la manutention 29,10% 38,80% 29,40% 32,40% 26,20% J1Z80 Responsables magasinage 74,10% 32,50% 91,60% 39,90% 16,20% J2Z40 Conducteurs de véhicules légers 72,60% 65,40% 41,40% 66,40% 32,50% J3Z41 Conducteurs de transport en commun sur route 59,70% 30,00% 32,60% 31,00% 65,40% J3Z42 Conducteurs et livreurs sur courte distance 32,60% 34,80% 35,50% 14,30% 56,30% J3Z43 Conducteurs routiers 55,50% 29,40% 33,50% 48,10% 54,80% J3Z44 Conducteurs sur rails et d'engins de traction 0,00% 20,70% 25,10% 100,00% 0,00% J2Z40 Agents d'exploitation des transports 52,90% 0,00% 46,90% 43,60% 89,10% J4Z60 Contrôleurs des transports 0,00% 0,00% 0,00% 0,00% 0,00% J4Z80 Responsables logistiques (non cadres) 38,70% 37,90% 3,30% 42,70% 27,80% J5Z60 Agents et hôtesses d'accompagnement 69,80% 37,00% 75,40% 63,50% 3,30% J5Z61 Agents administratifs des transports 100,00% 63,40% 39,50% 7,10% 16,60% J5Z62 Employés des transports et du tourisme 59,50% 31,40% 15,40% 8,10% 68,70% J5Z80 Techniciens des transports et du tourisme 19,50% 78,10% 0,00% 0,00% 100,00% J6Z90 Cadres des transports 100,00% 12,20% 65,10% 0,00% 100,00% J6Z92 Ingén. et cadres de la logistique, du planning et de l'ordonnancement 64,80% 33,40% 100,00% 76,30% 68,20% K0Z20 Ouvriers non qualifiés divers de type artisanal 41,50% 42,00% 53,50% 0,00% 89,10% K0Z40 Artisans et ouvriers qualifiés divers de type artisanal 19,40% 0,00% 100,00% 39,50% 47,70% L0Z60 Secrétaires bureautiques et assimilés 30,70% 30,80% 29,90% 24,40% 28,00%
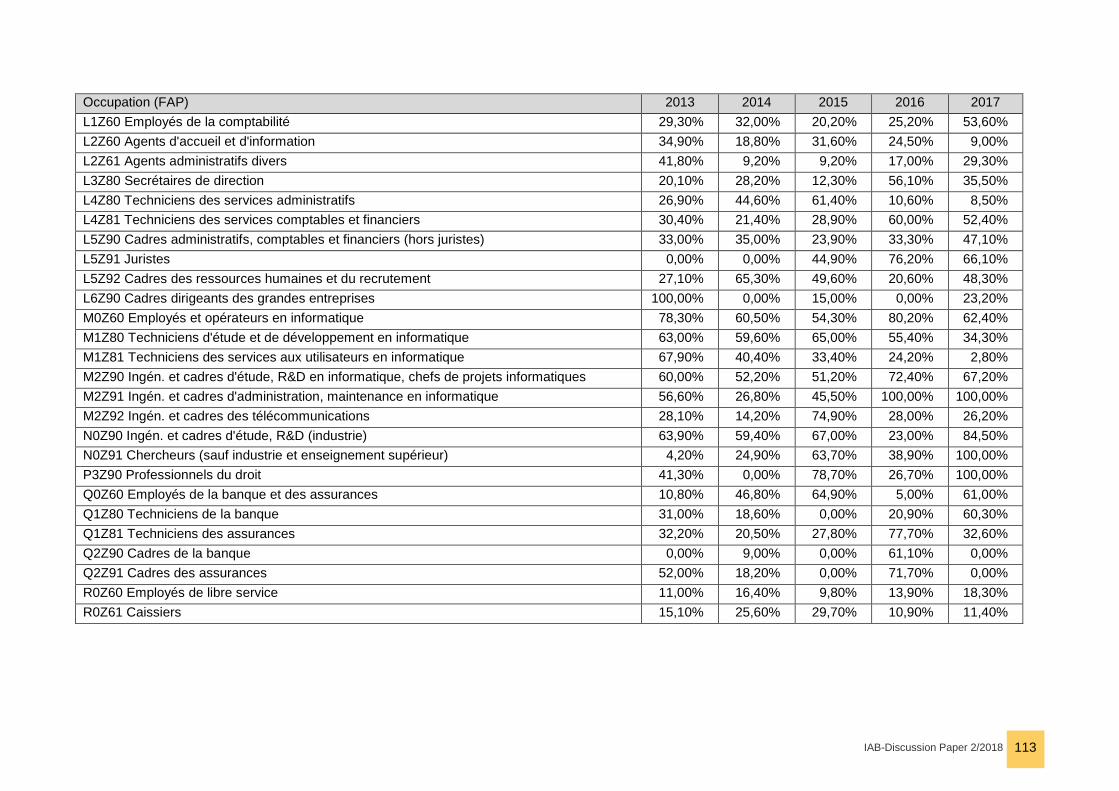
IAB-Discussion Paper 2/2018 113
Occupation (FAP) 2013 2014 2015 2016 2017 L1Z60 Employés de la comptabilité 29,30% 32,00% 20,20% 25,20% 53,60% L2Z60 Agents d'accueil et d'information 34,90% 18,80% 31,60% 24,50% 9,00% L2Z61 Agents administratifs divers 41,80% 9,20% 9,20% 17,00% 29,30% L3Z80 Secrétaires de direction 20,10% 28,20% 12,30% 56,10% 35,50% L4Z80 Techniciens des services administratifs 26,90% 44,60% 61,40% 10,60% 8,50% L4Z81 Techniciens des services comptables et financiers 30,40% 21,40% 28,90% 60,00% 52,40% L5Z90 Cadres administratifs, comptables et financiers (hors juristes) 33,00% 35,00% 23,90% 33,30% 47,10% L5Z91 Juristes 0,00% 0,00% 44,90% 76,20% 66,10% L5Z92 Cadres des ressources humaines et du recrutement 27,10% 65,30% 49,60% 20,60% 48,30% L6Z90 Cadres dirigeants des grandes entreprises 100,00% 0,00% 15,00% 0,00% 23,20% M0Z60 Employés et opérateurs en informatique 78,30% 60,50% 54,30% 80,20% 62,40% M1Z80 Techniciens d'étude et de développement en informatique 63,00% 59,60% 65,00% 55,40% 34,30% M1Z81 Techniciens des services aux utilisateurs en informatique 67,90% 40,40% 33,40% 24,20% 2,80% M2Z90 Ingén. et cadres d'étude, R&D en informatique, chefs de projets informatiques 60,00% 52,20% 51,20% 72,40% 67,20% M2Z91 Ingén. et cadres d'administration, maintenance en informatique 56,60% 26,80% 45,50% 100,00% 100,00% M2Z92 Ingén. et cadres des télécommunications 28,10% 14,20% 74,90% 28,00% 26,20% N0Z90 Ingén. et cadres d'étude, R&D (industrie) 63,90% 59,40% 67,00% 23,00% 84,50% N0Z91 Chercheurs (sauf industrie et enseignement supérieur) 4,20% 24,90% 63,70% 38,90% 100,00% P3Z90 Professionnels du droit 41,30% 0,00% 78,70% 26,70% 100,00% Q0Z60 Employés de la banque et des assurances 10,80% 46,80% 64,90% 5,00% 61,00% Q1Z80 Techniciens de la banque 31,00% 18,60% 0,00% 20,90% 60,30% Q1Z81 Techniciens des assurances 32,20% 20,50% 27,80% 77,70% 32,60% Q2Z90 Cadres de la banque 0,00% 9,00% 0,00% 61,10% 0,00% Q2Z91 Cadres des assurances 52,00% 18,20% 0,00% 71,70% 0,00% R0Z60 Employés de libre service 11,00% 16,40% 9,80% 13,90% 18,30% R0Z61 Caissiers 15,10% 25,60% 29,70% 10,90% 11,40%

IAB-Discussion Paper 2/2018 114
Occupation (FAP) 2013 2014 2015 2016 2017 R1Z60 Vendeurs en produits alimentaires 66,20% 40,30% 49,10% 23,00% 35,60% R1Z61 Vendeurs en ameublement, équipement du foyer, bricolage 56,00% 52,60% 53,30% 22,00% 21,60% R1Z62 Vendeurs en habillement et accessoires (luxe, sport, loisirs et culturels) 28,60% 34,30% 27,20% 37,50% 16,80% R1Z63 Vendeurs en gros de matériel et équipements 56,10% 70,60% 0,00% 51,00% 59,10% R1Z66 Vendeurs généralistes 20,70% 59,60% 39,00% 35,10% 45,20% R1Z67 Télévendeurs 12,60% 57,80% 68,70% 18,00% 75,10% R2Z80 Attachés commerciaux 54,90% 58,90% 37,60% 44,70% 55,50% R2Z83 Représentants auprès des particuliers 63,50% 61,30% 52,40% 69,20% 57,90% R3Z80 Maîtrise des magasins 23,00% 15,80% 1,70% 38,80% 17,70% R3Z82 Professions intermédiaires commerciales 20,00% 72,50% 67,90% 43,30% 13,70% R4Z90 Cadres commerciaux, acheteurs et cadres de la mercatique 61,90% 53,20% 46,20% 56,60% 66,20% R4Z91 Ingénieurs et cadres technico-commerciaux 70,00% 57,90% 57,70% 53,70% 56,90% R4Z92 Cadres des magasins 74,60% 19,30% 38,50% 95,00% 23,90% R4Z93 Agents immobiliers, syndics 75,10% 64,20% 59,00% 53,30% 75,60% S0Z20 Apprentis et ouvriers non qualifiés de l'alimentation (hors industries agro-alimentaires) 77,30% 53,80% 43,80% 37,80% 52,90% S0Z40 Bouchers 47,20% 78,50% 61,90% 58,40% 31,70% S0Z41 Charcutiers, traiteurs 56,70% 72,20% 28,90% 18,20% 43,90% S0Z42 Boulangers, pâtissiers 65,30% 49,40% 58,00% 58,50% 71,90% S1Z20 Aides et apprentis de cuisine, employés polyvalents de la restauration 44,60% 21,20% 32,90% 36,30% 53,90% S1Z40 Cuisiniers 81,70% 63,40% 73,00% 48,70% 72,10% S1Z80 Chefs cuisiniers 93,70% 44,00% 81,00% 20,70% 59,90% S2Z60 Employés de l'hôtellerie 39,10% 48,40% 47,10% 55,80% 46,30% S2Z61 Serveurs de cafés restaurants 53,30% 59,70% 46,50% 57,90% 55,80% S2Z80 Maîtres d'hôtel 52,30% 100,00% 34,30% 26,50% 75,10% S2Z81 Maîtrise de l'hôtellerie 83,90% 100,00% 0,00% 0,00% 100,00% S3Z90 Cadres de l'hôtellerie et de la restauration 59,50% 42,30% 12,20% 59,50% 76,40%

IAB-Discussion Paper 2/2018 115
Occupation (FAP) 2013 2014 2015 2016 2017 T0Z60 Coiffeurs, esthéticiens 50,80% 57,70% 62,50% 57,00% 53,60% T1Z60 Employés de maison et personnels de ménage 44,60% 44,90% 69,50% 55,20% 44,60% T2A60 Aides à domicile et aides ménagères 84,40% 66,30% 42,00% 30,80% 83,50% T2B60 Assistantes maternelles 50,30% 8,30% 24,20% 58,50% 26,80% T3Z60 Concierges 33,70% 0,00% 0,00% 58,30% 24,80% T3Z61 Agents de sécurité et de surveillance 23,20% 45,90% 42,60% 21,70% 8,10% T4Z60 Agents d'entretien de locaux 44,40% 12,80% 58,50% 28,60% 15,70% T4Z61 Agents de services hospitaliers 16,60% 0,90% 10,00% 1,50% 3,90% T4Z62 Ouvriers de l'assainissement et du traitement des déchets 18,50% 8,50% 34,50% 5,70% 39,00% T6Z61 Employés des services divers 26,10% 11,40% 15,50% 12,20% 24,00% U0Z80 Assistants de communication 39,40% 70,70% 33,60% 17,60% 25,20% U0Z81 Interprètes 0,00% 0,00% 100,00% 0,00% 0,00% U0Z90 Cadres de la communication 52,60% 5,80% 0,00% 0,00% 16,70% U0Z91 Cadres et techniciens de la documentation 6,30% 50,90% 30,30% 0,00% 0,00% U0Z92 Journalistes et cadres de l'édition 13,50% 63,40% 0,00% 9,50% 0,00% U1Z80 Professionnels des spectacles 61,60% 7,50% 39,10% 13,60% 21,00% U1Z81 Photographes 0,00% 0,00% 0,00% 0,00% 0,00% U1Z82 Créateurs de supports de communication visuelle, stylistes, décorateurs 35,90% 40,00% 48,40% 48,10% 36,30% U1Z91 Artistes (musique, danse, spectacles) 25,70% 23,80% 4,50% 5,20% 12,30% U1Z92 Ecrivains 0,00% 100,00% 0,00% 0,00% 0,00% U1Z93 Artistes plasticiens 0,00% 0,00% 0,00% 0,00% 0,00% V0Z60 Aides-soignants 51,80% 41,90% 40,20% 23,30% 40,40% V1Z80 Infirmiers 28,00% 13,60% 46,30% 10,80% 14,50% V1Z81 Sages-femmes 0,00% 0,00% 100,00% 0,00% 0,00% V2Z90 Médecins 97,10% 85,60% 91,50% 73,40% 52,10% V2Z91 Dentistes 100,00% 70,80% 0,00% 100,00% 87,80%

IAB-Discussion Paper 2/2018 116
Occupation (FAP) 2013 2014 2015 2016 2017 V2Z92 Vétérinaires 100,00% 74,50% 100,00% 100,00% 80,30% V2Z93 Pharmaciens 49,10% 52,90% 24,90% 28,00% 44,80% V3Z70 Techniciens médicaux et préparateurs 60,90% 38,80% 53,70% 24,10% 24,90% V3Z71 Spécialistes de l'appareillage médical 52,10% 60,70% 71,90% 67,00% 50,80% V3Z80 Autres professionnels para-médicaux 70,70% 67,30% 81,30% 35,70% 69,30% V3Z90 Psychologues, psychothérapeutes 53,30% 27,00% 0,00% 18,00% 5,90% V4Z80 Professionnels de l'orientation 28,20% 20,30% 42,30% 84,10% 23,80% V4Z83 Educateurs spécialisés 38,70% 22,30% 25,50% 33,40% 21,70% V4Z85 Professionnels de l'action sociale 37,90% 32,10% 13,50% 19,40% 22,00% V5Z81 Professionnels de l'animation socioculturelle 37,10% 23,00% 22,40% 23,10% 37,20% V5Z82 Sportifs et animateurs sportifs 44,20% 62,20% 49,20% 35,20% 46,70% V5Z84 Surveillants d'établissements scolaires 49,00% 10,60% 11,00% 22,20% 30,60% W0Z80 Professeurs des écoles 100,00% 18,60% 0,00% 0,00% 0,00% W0Z90 Professeurs du secondaire 62,80% 60,40% 45,00% 58,40% 13,40% W0Z91 Directeurs d'établissement scolaire et inspecteurs 0,00% 100,00% 0,00% 100,00% 0,00% W0Z92 Professeurs du supérieur 11,60% 54,10% 0,00% 100,00% 77,10% W1Z80 Formateurs 31,50% 15,70% 36,20% 42,70% 46,80%
Source: Pôle emploi Enquête; own depiction
(Since no English translation was found, the French terminology was kept to ensure accuracy.)

IAB-Discussion Paper 2/2018 117
Table 7 Tension Indicator for the ROME Professions in Alsace
Occupation (ROME) 2012 2013 2014 2015 2016 A1101 : Conduite d'engins d'exploitation agricole et forestière 3,0500 2,9742 1,8254 0,9314 1,7471 A1201 : Bûcheronnage et élagage 0,3869 0,4525 0,4237 0,2994 0,2757 A1202 : Entretien des espaces naturels 0,2139 0,2039 0,2320 0,1709 0,2122 A1203 : Entretien des espaces verts 0,3892 0,3609 0,2806 0,2325 0,2628 A1301 : Conseil et assistance technique en agriculture 0,3398 0,1632 0,4704 0,4520 0,3124 A1401 : Aide agricole de production fruitière ou viticole 10,4392 7,6341 7,5373 7,1815 9,0727 A1402 : Aide agricole de production légumière ou végétale 0,5242 0,2005 0,3820 0,1413 0,1538 A1403 : Aide d'élevage agricole et aquacole 0,6469 0,3373 0,2588 0,1878 0,2594 A1405 : Arboriculture et viticulture 0,5839 0,3885 0,3514 0,3356 0,4477 A1413 : Fermentation de boissons alcoolisées 0,5720 1,0848 0,4170 0,8063 1,2122 A1414 : Horticulture et maraîchage 0,2805 0,1696 0,2101 0,1582 0,2378 A1416 : Polyculture, élevage 0,2057 0,1789 0,2867 0,4043 0,5120 A1501 : Auxiliaire de soins aux animaux 0,2175 0,2957 0,3117 0,2623 0,3280 B1603 : Réalisation d'ouvrages en bijouterie, joaillerie et orfèvrerie 0,4969 0,8890 1,1167 0,6959 0,2232 B1604 : Réparation - montage en systèmes horlogers 0,5486 0,4773 0,3109 0,7795 0,0984 B1803 : Réalisation de vêtements sur mesure ou en petite série 0,2008 0,2172 0,2039 0,1711 0,1092 B1806 : Tapisserie - décoration en ameublement 0,4926 0,5271 0,3405 0,4005 0,3952 C1102 : Conseil clientèle en assurances 2,5177 1,2035 1,0411 0,8928 0,6198 C1109 : Rédaction et gestion en assurances 1,3466 1,3888 1,9597 2,3222 1,1966 C1201 : Accueil et services bancaires 0,3346 0,3598 0,2405 0,3319 0,3786 C1206 : Gestion de clientèle bancaire 0,2702 0,4426 0,3022 0,5580 0,5441 C1401 : Gestionnaire administratif banque et assurance 0,6745 0,4099 0,4098 0,6780 0,2117 C1501 : Gérance immobilière 0,5421 0,5400 0,4418 0,5869 0,3685 C1502 : Gestion locative immobilière 0,6339 0,9284 1,1864 1,3765 0,8047

IAB-Discussion Paper 2/2018 118
Occupation (ROME) 2012 2013 2014 2015 2016 C1504 : Transaction immobilière 0,6248 0,4497 0,6623 0,7077 0,4905 D1101 : Boucherie 0,8290 0,6537 0,7671 0,7439 0,6695 D1102 : Boulangerie - viennoiserie 0,6336 0,5850 0,5918 0,5618 0,5909 D1103 : Charcuterie - traiteur 1,3647 0,9071 1,4931 2,1232 1,5712 D1104 : Pâtisserie, confiserie, chocolaterie et glacerie 0,5409 0,4441 0,4702 0,4738 0,4479 D1105 : Poissonnerie 3,1043 2,6825 1,8767 1,7730 2,0193 D1106 : Vente en alimentation 0,3531 0,2939 0,2895 0,3177 0,3100 D1107 : Vente en gros de produits frais 0,2938 0,3222 0,9912 0,3741 0,2672 D1202 : Coiffure 0,6359 0,3597 0,3907 0,3824 0,4666 D1204 : Location de véhicules ou de matériel de loisirs 2,6415 5,8500 17,7625 12,1618 8,5625 D1205 : Nettoyage d'articles textiles ou cuirs 0,7718 0,8305 0,5992 0,7175 0,6765 D1206 : Réparation d'articles en cuir et matériaux souples 1,4048 0,5525 0,5125 1,0800 0,6217 D1208 : Soins esthétiques et corporels 0,3466 0,2944 0,4089 0,3573 0,2940 D1209 : Vente de végétaux 0,4624 0,4115 0,5425 0,4001 0,4593 D1211 : Vente en articles de sport et loisirs 0,2223 0,1442 0,1579 0,1839 0,2160 D1212 : Vente en décoration et équipement du foyer 0,4853 0,4624 0,3682 0,4234 0,4736 D1213 : Vente en gros de matériel et équipements 0,8357 1,0844 0,8773 0,6170 0,6019 D1214 : Vente en habillement et accessoires de la personne 0,2625 0,1605 0,1980 0,1441 0,1303 D1301 : Responsable de magasin de détail 0,4264 0,3529 0,4167 0,2614 0,3034 D1401 : Assistanat commercial 0,8517 0,5956 0,6725 0,7981 0,8594 D1402 : Commercial auprès de grands comptes et entreprises 0,9049 0,8111 1,3329 1,3744 1,1075 D1403 : Commercial auprès de particuliers 2,7348 3,0221 3,7236 6,0938 2,9414 D1404 : Commercial en véhicules 0,3750 0,2941 0,3402 0,3179 0,3739 D1406 : Responsable de la force de vente 0,1774 0,1869 0,1770 0,2041 0,2833 D1407 : Technico-commercial 1,2671 1,1638 0,9908 1,1407 1,3252 D1408 : Téléconseil et télévente 1,4468 1,3713 1,4438 1,6114 1,3494

IAB-Discussion Paper 2/2018 119
Occupation (ROME) 2012 2013 2014 2015 2016 D1501 : Animation de vente 2,2858 0,7351 0,7127 0,5959 0,2242 D1502 : Chef de rayon produits alimentaires 0,8179 0,9660 1,1101 1,0637 1,1315 D1503 : Chef de rayon produits non alimentaires 0,5121 0,4546 0,3227 0,3570 0,3403 D1504 : Direction de magasin de grande distribution 0,4767 0,6563 0,3284 0,5543 0,3393 D1505 : Hôte de caisse 0,2857 0,2942 0,2254 0,2238 0,2320 D1507 : Mise en rayon libre-service 0,3018 0,2032 0,1995 0,1994 0,2142 D1508 : Responsable de caisses 0,6339 0,4540 0,5042 0,5861 0,6703 D1509 : Responsable de département en grande distribution 0,7880 0,4294 0,3585 0,3182 0,3923 E1101 : Animation de site multimédia 1,2486 0,8839 0,4962 0,4704 1,1500 E1103 : Communication 0,2040 0,1888 0,2065 0,1748 0,1851 E1104 : Conception de contenus multimédias 0,4775 0,1975 0,3258 0,1756 0,1781 E1108 : Traduction, interprétariat 0,0984 0,0792 0,2004 0,1383 0,1253 E1205 : Réalisation de contenus multimédias 0,1900 0,1748 0,1503 0,1052 0,1645 E1301 : Conduite de machines d'impression 0,2587 0,2553 0,3234 0,4111 0,3093 E1304 : Façonnage et routage 1,5188 1,9928 2,2381 0,7297 0,6589 E1306 : Prépresse 0,2382 0,2209 0,1997 0,1521 0,1233 F1101 : Architecture du BTP 0,1562 0,0967 0,0569 0,0603 0,1266 F1103 : Contrôle et diagnostic technique du bâtiment 1,9414 1,8298 1,3736 1,2571 1,0833 F1104 : Dessin BTP 1,4536 0,9498 0,8416 0,5548 0,8156 F1106 : Ingénierie et études du BTP 1,2535 0,8418 1,0118 0,5689 0,7392 F1107 : Mesures topographiques 0,7997 0,3426 0,2975 0,6065 0,9998 F1108 : Métré de la construction 0,5655 0,3434 0,3255 0,2925 0,4058 F1201 : Conduite de travaux du BTP 1,0316 0,9277 0,7936 0,5372 0,7031 F1202 : Direction de chantier du BTP 1,2321 1,0401 0,8565 0,6933 0,6292 F1301 : Conduite de grue 0,5525 0,5876 0,4212 0,4298 0,4813 F1302 : Conduite d'engins de terrassement et de carrière 0,6791 0,6741 0,4377 0,2617 0,3528

IAB-Discussion Paper 2/2018 120
Occupation (ROME) 2012 2013 2014 2015 2016 F1501 : Montage de structures et de charpentes bois 1,0428 0,5772 0,2897 0,1609 0,4443 F1502 : Montage de structures métalliques 0,8281 0,5697 0,4440 0,6910 0,7504 F1503 : Réalisation - installation d'ossatures bois 0,8615 0,5787 0,3836 0,5947 0,6370 F1601 : Application et décoration en plâtre, stuc et staff 0,3571 0,2145 0,1553 0,1800 0,2241 F1602 : Électricité bâtiment 0,4046 0,3364 0,3271 0,3565 0,4001 F1603 : Installation d'équipements sanitaires et thermiques 0,7116 0,6825 0,4991 0,4379 0,4867 F1604 : Montage d'agencements 0,4500 0,3851 0,2726 0,3063 0,3755 F1605 : Montage réseaux électriques et télécoms 1,8360 1,5332 0,9060 0,8152 0,8060 F1606 : Peinture en bâtiment 0,2569 0,2197 0,1712 0,1630 0,2143 F1607 : Pose de fermetures menuisées 0,9135 0,8401 0,7608 0,6993 0,9307 F1608 : Pose de revêtements rigides 0,4136 0,3264 0,2498 0,2946 0,2856 F1609 : Pose de revêtements souples 1,1125 0,9068 0,6788 0,6900 0,8038 F1610 : Pose et restauration de couvertures 0,9478 0,7760 0,5535 0,6030 0,7179 F1611 : Réalisation et restauration de façades 0,3427 0,3877 0,1936 0,2353 0,2661 F1613 : Travaux d'étanchéité et d'isolation 0,8670 0,8336 0,8498 0,4650 0,5133 F1701 : Construction en béton 0,5870 0,5149 0,2991 0,4836 0,7827 F1702 : Construction de routes et voies 0,5043 0,5463 0,3802 0,2240 0,4860 F1703 : Maçonnerie 0,3444 0,3007 0,1614 0,1873 0,2401 F1704 : Manoeuvre du gros œuvre et des travaux publics 0,2361 0,2103 0,1284 0,1194 0,1559 F1705 : Pose de canalisations 0,9645 0,9205 0,5176 0,3694 0,9702 G1101 : Accueil touristique 0,3575 0,3823 0,4943 0,3057 0,3189 G1202 : Animation d'activités culturelles ou ludiques 0,3741 0,4761 0,4099 0,3911 0,3308 G1203 : Animation de loisirs auprès d'enfants ou d'adolescents 0,8550 0,7124 0,6525 0,6258 0,6674 G1204 : Éducateur d'activités sportives 0,3410 0,5723 0,5198 0,4969 0,5514 G1205 : Employé d'attractions ou de structures de loisirs 0,9773 0,9175 1,0029 0,9000 1,1942 G1303 : Vente de voyages 0,2936 0,3637 0,4658 0,4579 0,3419

IAB-Discussion Paper 2/2018 121
Occupation (ROME) 2012 2013 2014 2015 2016 G1401 : Assistant à la direction d'hôtel-restaurant 0,7274 0,4418 0,4828 0,5124 0,4451 G1402 : Directeur d'hôtel-restaurant 0,1078 0,1849 0,1307 0,1484 0,1061 G1404 : Responsable d'établissement de restauration collective 1,6595 2,0975 1,5242 0,8689 0,9021 G1501 : Employé d'étage 0,6897 0,5193 0,4996 0,5079 0,5047 G1502 : Employé polyvalent d'hôtellerie 1,0758 1,1269 0,9759 1,2414 1,2029 G1503 : Gouvernante en hôtellerie 0,2662 0,2686 0,2708 0,5121 0,3158 G1601 : Chef de cuisine 0,9815 0,8447 0,8216 0,8653 0,7343 G1602 : Cuisinier 1,3363 0,9810 0,9431 1,0190 0,9222 G1603 : Employé polyvalent de restauration 0,7481 0,6358 0,6461 0,6430 0,6807 G1604 : Fabrication de crêpes ou pizzas 1,0229 0,9302 0,8833 0,8303 0,8314 G1605 : Plongeur en restauration 0,3709 0,2755 0,2171 0,2447 0,2378 G1703 : Réceptionniste en hôtellerie 0,8697 0,6502 0,8532 0,7547 0,7784 G1801 : Café, bar brasserie 0,4376 0,2794 0,3143 0,3957 0,3261 G1802 : Maître d'hôtel 0,8465 0,3427 0,4733 0,6776 0,7811 G1803 : Serveur en restauration 1,0093 0,7289 0,7028 0,7813 0,7314 H1101 : Assistance et support technique client 3,1915 1,6000 2,1983 2,0731 1,7588 H1102 : Management et ingénierie d'affaires 1,2019 0,7241 0,7639 0,9149 0,8191 H1202 : Conception et dessin produits électriques et électroniques 3,7448 3,2114 3,2695 3,6563 2,2977 H1203 : Conception et dessin produits mécaniques 1,4563 1,2009 1,3321 1,2898 1,1427 H1206 : Management et ingénierie études, recherche et développement industriel 0,3541 0,2642 0,3202 0,4133 0,4015 H1207 : Rédaction technique 6,1200 3,6000 2,3636 --- 2,0188 H1208 : Technicien en études et conception en automatisme 1,9073 1,1073 1,7473 1,0351 1,3108 H1209 : Technicien en études et développement électronique 1,3074 0,8837 1,1728 0,5308 0,4071 H1210 : Technicien en études, recherche et développement 0,4144 0,3617 0,3693 0,4551 0,4640 H1302 : Management et ingénierie Hygiène Sécurité Environnement -HSE- indus-triels
0,1670 0,2114 0,1645 0,2422 0,2380
H1303 : Technicien en Hygiène Sécurité Environnement -HSE- industriel 0,6501 0,2869 0,4771 0,5361 0,4861

IAB-Discussion Paper 2/2018 122
Occupation (ROME) 2012 2013 2014 2015 2016 H1401 : Management et ingénierie gestion industrielle et logistique 0,3530 0,3181 0,3157 0,4813 0,3185 H1402 : Management et ingénierie méthodes et industrialisation 0,5437 0,8378 0,9065 0,7499 0,7640 H1403 : Technicien en gestion industrielle et logistique 1,4225 1,0673 0,8744 1,2227 1,3424 H1404 : Technicien en méthodes et industrialisation 0,8204 0,5187 0,6008 0,5471 0,7261 H1502 : Management et ingénierie qualité industrielle 0,5792 0,6721 0,5012 0,6726 0,5425 H1503 : Technicien de laboratoire d'analyse industrielle 0,4584 0,4396 0,4793 0,5883 0,4000 H1504 : Technicien en contrôle essai qualité en électricité et électronique 0,6758 0,3537 0,5980 0,3244 0,4399 H1506 : Technicien qualité en mécanique et travail des métaux 0,7371 0,8099 1,0951 0,6909 1,0861 H2101 : Abattage et découpe des viandes 1,6719 1,7632 1,9647 1,0873 1,7111 H2102 : Conduite d'équipement de production alimentaire 0,8676 0,6025 0,5276 0,4291 0,4635 H2201 : Assemblage d'ouvrages en bois 1,0191 0,7536 0,7511 1,2385 1,0902 H2202 : Conduite d'équipement de fabrication de l'ameublement et du bois 0,6699 0,4130 0,3597 0,3201 0,6099 H2203 : Conduite d'installation de production de panneaux bois 1,0500 --- 1,1884 --- 2,4000 H2205 : Première transformation de bois d'œuvre 0,4841 0,6038 0,5996 0,8700 0,3110 H2206 : Réalisation de menuiserie bois et tonnellerie 0,5105 0,4944 0,4003 0,5227 0,5717 H2207 : Réalisation de meubles en bois 0,4110 0,2704 0,2546 0,1039 0,1522 H2209 : Technicien de l'ameublement et du bois 0,8182 0,5805 0,5107 0,3870 0,8797 H2301 : Conduite d'équipement de production chimique ou pharmaceutique 0,6618 0,4878 0,4748 0,4058 0,3880 H2402 : Assemblage - montage de vêtements et produits textiles 0,5942 0,2932 0,3560 0,3439 0,2610 H2502 : Management et ingénierie de production 0,5066 0,2955 0,3169 0,3388 0,4378 H2503 : Pilotage d'unité élémentaire de production mécanique 0,5960 0,9339 0,8017 0,7940 0,5419 H2504 : Responsable d'équipe en industrie de transformation 0,5992 0,5166 1,1439 0,4222 0,6542 H2602 : Câblage électrique et électromécanique 1,0491 0,9830 1,2410 1,0792 0,8110 H2603 : Conduite d'installation automatisée de production électrique, électronique et microélectronique
0,1830 0,3097 0,1460 0,1384 0,2422
H2604 : Montage de produits électriques et électroniques 0,0960 0,1345 0,1720 0,2477 0,1652 H2605 : Montage et câblage électronique 0,6364 0,8557 0,4556 0,7092 0,3160

IAB-Discussion Paper 2/2018 123
Occupation (ROME) 2012 2013 2014 2015 2016 H2901 : Ajusteur de fabrication 0,8360 0,9032 1,2339 1,4529 1,1646 H2902 : Chaudronnerie - tôlerie 0,8526 0,8183 0,8425 0,9453 0,6525 H2903 : Conduite d'équipement d'usinage 0,8925 0,7155 1,0671 0,7352 0,6927 H2905 : Conduite d'équipement de formage et découpage des matériaux 0,3440 0,3198 0,4580 0,6638 0,6752 H2906 : Conduite d'installation automatisée ou robotisée de fabrication mécanique 0,0742 0,0553 0,2258 0,1384 0,1308 H2909 : Montage - assemblage mécanique 0,4534 0,3218 0,2360 0,1948 0,2083 H2911 : Réalisation de structures métalliques 0,7036 0,6106 0,5753 0,6179 0,5161 H2912 : Réglage d'équipement de production industrielle 0,9431 1,0776 0,9358 1,2996 0,8069 H2913 : Soudeur manuel 0,4945 0,4194 0,5347 0,5271 0,3307 H2914 : Tuyauteur 1,3310 1,3842 1,5350 1,6752 1,1895 H3101 : Conduite d'équipement de fabrication de papier ou de carton 0,5494 1,1515 0,8116 0,6864 0,3972 H3201 : Conduite d'équipement de formage des plastiques et caoutchoucs 0,3005 0,2586 0,6035 0,7754 0,5063 H3202 : Réglage d'équipement de formage des plastiques et caoutchoucs 0,9534 0,4957 1,7178 1,0863 0,9127 H3301 : Conduite d'équipement de conditionnement 0,2446 0,1759 0,3220 0,3456 0,5063 H3302 : Opérations manuelles d'assemblage, tri ou emballage 0,1862 0,2098 0,1865 0,1555 0,2443 H3303 : Préparation de matières et produits industriels (broyage, mélange, …) 0,5722 1,1864 0,8714 1,4875 1,0070 H3401 : Conduite de traitement d'abrasion de surface 1,0199 0,8755 1,1635 1,4595 0,8116 H3404 : Peinture industrielle 1,2117 1,2880 1,1008 1,2645 0,9821 I1101 : Direction et ingénierie en entretien infrastructure et bâti 1,4875 1,1880 1,1429 0,7631 0,6457 I1102 : Management et ingénierie de maintenance industrielle 0,6532 0,4519 0,5408 0,7832 0,7484 I1103 : Supervision d'entretien et gestion de véhicules 1,2913 0,3229 0,5743 0,8322 0,8646 I1201 : Entretien d'affichage et mobilier urbain 1,2469 0,7360 1,1991 1,7636 0,8750 I1203 : Maintenance des bâtiments et des locaux 0,0343 0,0107 0,0279 0,0268 0,0150 I1302 : Installation et maintenance d'automatismes 0,8470 0,8048 0,8621 1,3177 1,0282 I1303 : Installation et maintenance de distributeurs automatiques 2,6833 0,7582 --- 1,3309 0,6776 I1304 : Installation et maintenance d'équipements industriels et d'exploitation 1,1738 0,9920 1,0498 1,1636 1,3483

IAB-Discussion Paper 2/2018 124
Occupation (ROME) 2012 2013 2014 2015 2016 I1305 : Installation et maintenance électronique 0,8973 0,5838 0,9771 0,9467 0,8271 I1306 : Installation et maintenance en froid, conditionnement d'air 0,9043 0,9909 1,1965 1,1952 1,2740 I1307 : Installation et maintenance télécoms et courants faibles 1,9317 0,8790 0,9010 0,7605 1,2642 I1308 : Maintenance d'installation de chauffage 1,8644 1,7230 2,1964 1,8763 1,5147 I1309 : Maintenance électrique 0,5935 0,6156 0,7366 0,7125 0,7803 I1310 : Maintenance mécanique industrielle 0,7189 0,5256 0,8649 0,8034 0,6624 I1401 : Maintenance informatique et bureautique 0,4648 0,2760 0,2992 0,3994 0,5766 I1501 : Intervention en grande hauteur 2,1682 2,9832 9,2571 1,6848 1,6250 I1503 : Intervention en milieux et produits nocifs 1,0671 0,8342 0,2114 0,4738 0,2887 I1603 : Maintenance d'engins de chantier, de levage, manutention et agricoles 2,2101 2,2063 1,9196 1,2388 1,4868 I1604 : Mécanique automobile 0,7586 0,6013 0,5894 0,7512 0,8404 I1606 : Réparation de carrosserie 0,4177 0,4115 0,4095 0,5095 0,5879 I1607 : Réparation de cycles, motocycles et motoculteurs de loisirs 0,4369 0,4477 0,5306 0,5483 0,5224 J1102 : Médecin praticien 0,5084 0,6446 1,1464 1,5373 1,4590 J1202 : Pharmacien 0,2324 0,1411 0,0987 0,1821 0,2325 J1301 : Agent des services hospitaliers 0,2959 0,3703 0,2606 0,2348 0,2819 J1302 : Analyses médicales 0,9550 0,4759 0,4599 0,4032 0,3267 J1303 : Assistance médico-technique 0,7166 0,6254 0,5480 0,5957 0,6610 J1304 : Auxiliaire de puériculture 0,4850 0,4168 0,5970 0,5228 0,3578 J1305 : Conduite de véhicules sanitaires 0,3419 0,2634 0,1785 0,1677 0,2890 J1307 : Préparateur en pharmacie 0,3343 0,2163 0,2887 0,2749 0,3074 J1402 : Diététique 0,8170 0,7471 0,4497 0,3857 0,3607 J1403 : Ergothérapie --- --- 9,9969 11,6438 6,0067 J1404 : Kinésithérapie 4,1649 2,2853 2,5700 3,9628 2,5631 J1405 : Optique - lunetterie 0,1603 0,1658 0,1798 0,2521 0,1924 J1406 : Orthophonie 2,3318 2,1083 1,4898 2,1250 1,1605

IAB-Discussion Paper 2/2018 125
Occupation (ROME) 2012 2013 2014 2015 2016 J1410 : Prothèses dentaires 0,6352 0,3438 0,3554 0,5931 0,5454 J1412 : Rééducation en psychomotricité --- 4,1167 6,4750 2,3833 2,1750 J1501 : Aide-soignant 0,6926 0,4654 0,6067 0,5456 0,5846 J1502 : Coordination de services médicaux ou paramédicaux 0,5514 0,4540 0,3524 0,3425 0,3424 J1504 : Infirmier de bloc opératoire 2,8000 1,8417 5,0143 1,4479 0,7341 J1505 : Infirmier de prévention 1,5607 1,3888 1,1227 0,9884 0,9948 J1506 : Infirmier de soins généraux 1,3550 0,5997 0,7324 0,7732 0,6862 J1507 : Infirmier en puériculture 1,1048 0,8900 0,5900 0,6697 0,3678 K1104 : Psychologue 0,1874 0,1310 0,1576 0,2454 0,4355 K1201 : Action sociale 0,3634 0,4377 0,4095 0,4314 0,5425 K1202 : Éducation de jeunes enfants 0,7373 0,8444 0,9552 0,9120 1,1711 K1203 : Encadrement technique en insertion professionnelle 0,7936 0,6097 0,5901 1,0925 0,8991 K1204 : Facilitation de la vie sociale 0,7964 0,4429 0,7427 1,0584 0,5023 K1205 : Information et médiation sociale 0,2101 0,3646 0,2151 0,3250 0,3477 K1206 : Intervention socioculturelle 0,3667 0,4402 0,4484 0,5978 0,4838 K1207 : Intervention socioéducative 0,3539 0,3055 0,2605 0,3075 0,4405 K1301 : Accompagnement médico-social 0,4996 0,4420 0,6104 0,3922 0,6154 K1302 : Assistance auprès d'adultes 0,6464 0,7055 0,7570 0,9104 0,8336 K1303 : Assistance auprès d'enfants 0,2552 0,2759 0,4636 0,3978 0,3120 K1304 : Services domestiques 0,5905 0,5167 0,4977 0,6616 0,6892 K1305 : Intervention sociale et familiale 0,4943 1,1056 0,6734 0,5113 1,0983 K1403 : Management de structure de santé, sociale ou pénitentiaire 0,3931 0,4800 0,3822 0,7015 0,7998 K1404 : Mise en œuvre et pilotage de la politique des pouvoirs publics 0,1812 0,1407 0,1257 0,1026 0,1214 K1601 : Gestion de l'information et de la documentation 0,1806 0,1977 0,1823 0,1578 0,1924 K1707 : Surveillance municipale 0,4929 0,7000 0,8415 0,3118 0,5903 K1801 : Conseiller en emploi et insertion socioprofessionnelle 0,4174 0,6998 0,5537 0,5481 0,5406

IAB-Discussion Paper 2/2018 126
Occupation (ROME) 2012 2013 2014 2015 2016 K1802 : Développement local 0,2655 0,2760 0,2203 0,2578 0,4278 K1902 : Collaborateur juridique 0,3187 0,3271 0,2159 0,3027 0,2552 K1903 : Défense et conseil juridique 0,2552 0,2480 0,1833 0,1969 0,1711 K2101 : Conseil en formation 0,5238 0,6070 0,4599 0,6589 0,6501 K2104 : Éducation et surveillance au sein d'établissements d'enseignement 0,9326 0,9779 0,7145 0,5875 0,5594 K2106 : Enseignement des écoles 0,2108 0,1847 0,3660 0,4427 0,3734 K2107 : Enseignement général du second degré 0,7059 0,4694 0,6686 0,5712 0,6542 K2109 : Enseignement technique et professionnel 0,5670 1,0507 1,6380 1,1532 1,0449 K2110 : Formation en conduite de véhicules 0,7754 0,4061 0,5902 0,5023 0,5495 K2111 : Formation professionnelle 0,5527 0,4164 0,5726 0,7066 0,6615 K2201 : Blanchisserie industrielle 0,6347 0,4859 0,5099 0,4573 0,4235 K2202 : Lavage de vitres 0,7855 1,0979 1,0379 0,9228 0,8814 K2203 : Management et inspection en propreté de locaux 0,9350 1,9365 0,9600 1,0641 1,3260 K2204 : Nettoyage de locaux 0,2970 0,2841 0,2505 0,2965 0,2664 K2301 : Distribution et assainissement d'eau 0,8878 0,7860 0,8868 0,7513 0,7875 K2303 : Nettoyage des espaces urbains 1,1168 0,9020 0,5520 0,4966 0,4742 K2304 : Revalorisation de produits industriels 2,0671 1,8525 1,9037 0,9967 1,0969 K2501 : Gardiennage de locaux 0,1735 0,1845 0,1117 0,2132 0,1893 K2502 : Management de sécurité privée 0,4320 0,6480 0,3711 0,3833 0,8244 K2503 : Sécurité et surveillance privées 0,8952 0,7193 0,6105 0,5121 0,4450 M1101 : Achats 0,6999 0,4767 0,5816 0,5676 0,5078 M1102 : Direction des achats 0,2223 0,1139 0,2113 0,2783 0,3263 M1202 : Audit et contrôle comptables et financiers 1,5503 0,9625 1,4680 2,7627 1,9447 M1203 : Comptabilité 0,7418 0,6866 0,8673 0,8433 0,8739 M1204 : Contrôle de gestion 0,5113 0,4366 0,4700 0,4785 0,6371 M1205 : Direction administrative et financière 0,3055 0,2448 0,3064 0,3454 0,2848

IAB-Discussion Paper 2/2018 127
Occupation (ROME) 2012 2013 2014 2015 2016 M1206 : Management de groupe ou de service comptable 0,5052 0,4509 0,5722 1,1006 1,2265 M1302 : Direction de petite ou moyenne entreprise 0,4786 0,3043 0,2387 0,1613 0,4346 M1401 : Agent d'enquêtes 2,8324 1,8703 3,5621 1,4079 2,6080 M1402 : Conseil en organisation et management d'entreprise 0,2475 0,1644 0,1927 0,1494 0,2228 M1501 : Assistanat en ressources humaines 0,6828 0,6436 0,6495 0,7205 0,7674 M1502 : Développement des ressources humaines 0,4308 0,4225 0,4872 0,5828 0,6340 M1503 : Management des ressources humaines 0,2418 0,3520 0,3207 0,3507 0,2995 M1601 : Accueil et renseignements 0,3221 0,2819 0,2585 0,3053 0,3238 M1602 : Agent administratif 0,2789 0,2905 0,2232 0,2334 0,2349 M1603 : Agent de distribution 1,9275 1,3740 0,7297 1,0300 1,3786 M1604 : Assistanat de direction 0,2776 0,2533 0,2538 0,2808 0,2717 M1605 : Assistanat technique et administratif 0,6710 0,7037 0,7129 0,5424 0,5918 M1606 : Saisie de données 0,3548 0,3398 0,4556 0,3686 0,5238 M1607 : Secrétariat 0,2380 0,2977 0,3125 0,2982 0,2734 M1608 : Secrétariat comptable 0,4555 0,3888 0,4162 0,4437 0,3531 M1609 : Secrétariat et assistanat médical ou médico-social 0,3726 0,3583 0,3793 0,3732 0,3302 M1701 : Administration des ventes 0,1391 0,3840 0,5846 0,5314 0,2037 M1703 : Chef de produit 0,1399 0,2664 0,2035 0,2326 0,2135 M1704 : Management relation clientèle 0,5754 0,3126 0,5462 0,4184 0,7239 M1705 : Marketing 0,2163 0,1889 0,1848 0,1850 0,2068 M1707 : Stratégie commerciale 0,1905 0,1313 0,1238 0,1878 0,2082 M1801 : Administration de systèmes d'information 0,5941 0,3516 0,4066 0,2963 0,4522 M1802 : Conseil et maîtrise d'ouvrage en systèmes d'information 0,8153 0,3601 0,3467 0,6242 0,9063 M1803 : Direction des systèmes d'information 0,3983 0,1652 0,2365 0,2112 0,3638 M1805 : Études et développement informatique 1,1678 0,9191 0,7032 0,9472 0,7018 M1806 : Expertise et support technique en systèmes d'information 0,5133 0,4152 0,6852 0,3880 0,2984

IAB-Discussion Paper 2/2018 128
Occupation (ROME) 2012 2013 2014 2015 2016 M1810 : Production et exploitation de systèmes d'information 1,3671 1,0342 0,9675 1,0242 0,8270 N1101 : Conduite d'engins de déplacement des charges 0,3893 0,2788 0,3397 0,3275 0,2933 N1102 : Déménagement 0,3327 0,5767 0,1638 0,2612 0,2417 N1103 : Magasinage et préparation de commandes 0,3272 0,2771 0,2748 0,2236 0,2579 N1104 : Manœuvre et conduite d'engins lourds de manutention 0,8347 0,8906 0,9290 0,9798 1,2853 N1105 : Manutention manuelle de charges 0,2632 0,2167 0,2501 0,1490 0,2672 N1201 : Affrètement transport 1,1932 0,9375 1,2289 1,0881 0,6903 N1202 : Gestion des opérations de circulation internationale des marchandises 0,3747 0,3029 0,6006 0,4124 0,4583 N1301 : Conception et organisation de la chaîne logistique 0,3071 0,2680 0,3813 0,3623 0,3036 N1302 : Responsable de site logistique 0,4709 0,3232 0,3169 0,4787 0,5139 N1303 : Technicien logistique 0,6715 0,4306 0,5626 0,5192 0,7212 N4101 : Conduite de transport de marchandises sur longue distance 0,6120 0,5552 0,4405 0,5064 0,5829 N4102 : Conduite de transport de particuliers 0,6003 0,6925 0,6814 0,7918 0,6864 N4103 : Conduite de transport en commun sur route 0,5344 0,6638 0,3118 0,2077 0,3429 N4104 : Courses et livraisons express 0,4727 1,1760 0,6056 0,5305 0,5429 N4105 : Conduite et livraison par tournées sur courte distance 0,2829 0,2521 0,2278 0,2171 0,2289 N4203 : Technicien d'exploitation des transports routiers de marchandises 0,9518 0,7448 1,0227 0,7756 0,8966 N4401 : Circulation du réseau ferré --- --- 17,5500 --- ---
Source: Pôle emploi Demandeurs, OEE and DEE (provided to the author directly by Pôle emploi); own depiction
(Since no English translation was found, the French terminology was kept to ensure accuracy.)
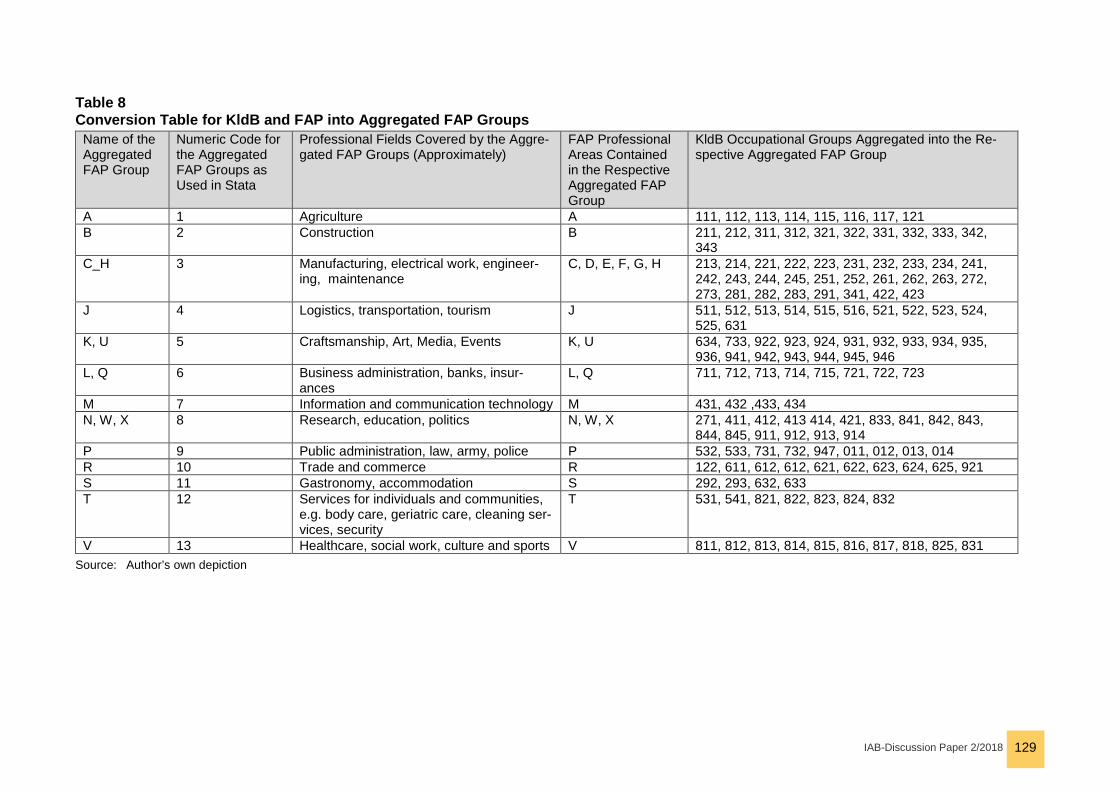
IAB-Discussion Paper 2/2018 129
Table 8 Conversion Table for KldB and FAP into Aggregated FAP Groups
Name of the Aggregated FAP Group
Numeric Code for the Aggregated FAP Groups as Used in Stata
Professional Fields Covered by the Aggre-gated FAP Groups (Approximately)
FAP Professional Areas Contained in the Respective Aggregated FAP Group
KldB Occupational Groups Aggregated into the Re-spective Aggregated FAP Group
A 1 Agriculture A 111, 112, 113, 114, 115, 116, 117, 121 B 2 Construction B 211, 212, 311, 312, 321, 322, 331, 332, 333, 342,
343 C_H 3 Manufacturing, electrical work, engineer-
ing, maintenance C, D, E, F, G, H 213, 214, 221, 222, 223, 231, 232, 233, 234, 241,
242, 243, 244, 245, 251, 252, 261, 262, 263, 272, 273, 281, 282, 283, 291, 341, 422, 423
J 4 Logistics, transportation, tourism J 511, 512, 513, 514, 515, 516, 521, 522, 523, 524, 525, 631
K, U 5 Craftsmanship, Art, Media, Events K, U 634, 733, 922, 923, 924, 931, 932, 933, 934, 935, 936, 941, 942, 943, 944, 945, 946
L, Q 6 Business administration, banks, insur-ances
L, Q 711, 712, 713, 714, 715, 721, 722, 723
M 7 Information and communication technology M 431, 432 ,433, 434 N, W, X 8 Research, education, politics N, W, X 271, 411, 412, 413 414, 421, 833, 841, 842, 843,
844, 845, 911, 912, 913, 914 P 9 Public administration, law, army, police P 532, 533, 731, 732, 947, 011, 012, 013, 014 R 10 Trade and commerce R 122, 611, 612, 612, 621, 622, 623, 624, 625, 921 S 11 Gastronomy, accommodation S 292, 293, 632, 633 T 12 Services for individuals and communities,
e.g. body care, geriatric care, cleaning ser-vices, security
T 531, 541, 821, 822, 823, 824, 832
V 13 Healthcare, social work, culture and sports V 811, 812, 813, 814, 815, 816, 817, 818, 825, 831 Source: Author’s own depiction

IAB-Discussion Paper 2/2018 130
Table 9 Evolution of Average Completed Vacancy Periods for the Aggregated FAP Groups in Baden
Aggregated FAP Group
2010 2011 2012 2013 2014 2015
A 137,79 85,92 90,83 86,43 78,58 85,90 B 62,42 84,04 105,95 102,88 100,67 104,73
C_H 59,29 76,70 107,41 94,93 82,39 93,35 J 41,78 58,73 74,16 71,80 65,20 71,19
K, U 53,80 43,03 51,64 52,85 66,92 64,18 L, Q 55,02 51,08 59,05 56,95 53,09 57,46 M 83,16 91,03 115,92 113,91 102,43 117,88
N, W, X 63,44 70,15 100,57 76,38 67,93 70,07 P 51,54 45,15 50,92 64,83 47,39 48,16 R 59,56 70,77 77,96 81,12 84,11 94,78 S 56,52 66,72 81,87 80,39 80,22 89,87 T 74,00 76,85 99,98 95,57 95,98 110,81 V 64,51 64,44 74,45 76,44 76,81 90,08
Source: BA labor market statistics; own depiction

IAB-Discussion Paper 2/2018 131
Table 10 Evolution of the Ratio of Unemployed per 100 Vacancies for the Aggregated FAP Groups in Baden
Aggregated FAP Group
2010 2011 2012 2013 2014 2015
A 370,50 651,04 707,46 866,16 846,25 649,85 B 321,16 194,79 173,44 202,12 201,58 179,17
C_H 369,66 173,70 180,28 249,49 243,57 195,91 J 953,51 526,09 528,08 632,32 627,72 458,81
K, U 1097,23 664,30 615,23 678,73 691,57 429,21 L, Q 942,38 678,25 618,93 721,21 643,93 527,49 M 380,10 195,75 158,25 205,62 213,72 223,53
N, W, X 651,10 464,45 501,14 691,41 667,50 594,75 P 474,89 251,71 205,50 245,26 220,55 166,18 R 770,20 516,41 439,81 476,32 428,60 308,46 S 592,48 399,83 339,06 422,32 381,56 296,05 T 1076,72 858,21 757,97 757,96 648,69 541,59 V 290,75 211,06 183,65 178,17 150,94 125,52
Source: BA labor market statistics; own depiction

IAB-Discussion Paper 2/2018 132
Table 11 Unemployment Rates for the Aggregated FAP Groups in Baden
Aggregated FAP Group 2013 2014 2015 A 0,1034 0,0962 0,0899 B 0,0524 0,0505 0,0468
C_H 0,0448 0,0431 0,0411 J 0,0887 0,0864 0,0781
K, U 0,0543 0,0521 0,0518 L, Q 0,0374 0,0364 0,0335 M 0,0287 0,0293 0,0294
N, W, X 0,0374 0,0382 0,0384 P 0,0151 0,0154 0,0142 R 0,0669 0,0663 0,0602 S 0,1052 0,1007 0,0886 T 0,1252 0,1253 0,1153 V 0,0240 0,0227 0,0215
Source: BA labor narket and employment statistics; own depiction

IAB-Discussion Paper 2/2018 133
Table 12 Tension Indicator for the Aggregated FAP Groups
Aggregated FAP Group 2012 2013 2014 2015 A 0,9190 0,7171 0,6995 0,6076 B 0,5159 0,4529 0,3476 0,3324
C_H 0,5879 0,5121 0,5490 0,5403 J 0,4068 0,3546 0,3413 0,3115
K,U 0,1686 0,1429 0,1505 0,1373 L, Q 0,4726 0,4249 0,4776 0,4953 M 0,7542 0,5250 0,5162 0,6102
N,W,X 0,3946 0,2990 0,4110 0,4217 P 0,3417 0,3289 0,1942 0,2324 R 0,4966 0,4171 0,4472 0,5064 S 0,7773 0,5883 0,5823 0,6232 T 0,4393 0,4162 0,4467 0,4621 V 0,6338 0,5511 0,4846 0,4837
Source: Pôle emploi Demandeurs, OEE and DEE (provided to the author directly by Pôle emploi); own depiction

IAB-Discussion Paper 2/2018 134
Table 13 Predicted Share of Difficult Recruitment Projects for the Aggregated FAP Groups in Alsace
Aggregated FAP Group 2013 (BMO 2012) 2014 (BMO 2013) 2015 (BMO 2014) 2016 (BMO 2015) A 0,2168 0,1302 0,1282 0,1651 B 0,5584 0,6109 0,6012 0,4485
C-H 0,5245 0,4316 0,4922 0,3509 J 0,4697 0,3588 0,3478 0,2581
K,U 0,3885 0,2676 0,2888 0,1170 L, Q 0,3036 0,2479 0,2832 0,2406 M 0,6279 0,5108 0,5240 0,5958
N,W,X 0,3761 0,3137 0,5023 0,3712 P 0,4130 0,0000 0,7870 0,2670 R 0,4127 0,4052 0,3493 0,3173 S 0,5585 0,4288 0,4742 0,4588 T 0,5601 0,3616 0,4951 0,3107 V 0,4550 0,3292 0,3631 0,2492
Source: Pôle emploi Enquête; own depiction

IAB-Discussion Paper 2/2018 135
Figure 13 Plot of Residuals Against Fitted Values for Model_1
Source: Stata
-2-1
01
23
Res
idua
ls
12 12.2 12.4 12.6 12.8Linear prediction

IAB-Discussion Paper 2/2018 136
Recently published
No. Author(s) Title Date
21/2017 Kropp, P. Schwengler, B.
Stability of functional labour market regions 7/17
22/2017 Brunow, S. Hammer, A. Mc Cann, P.
Innovation and location in German knowledge in-tensive business service firms
7/17
23/2017 Gehrke, B. Weber, Enzo
Identifying asymmetric effects of labor market re-forms
7/17
24/2017 Brunow; S. externe
Creative and science oriented employees and firm innovation: A key for Smarter Cities?
8/17
25/2017 Brixy, U. Brunow, S. extern
Ethnic diversity in start-ups and its impact on in-novation
8/17
26/2017 Broszeit, S. Laible, M.-Ch.
Examining the Link Between Health Measures, Management Practices and Es-tablishment Per-formance
8/17
27/2017 Gehrke, B. Hochmuth, B.
Counteracting unemployment in crises - non-lin-ear effects of short-time work policy
9/17
28/2017 Carbonero, F. Weber, E. extern
The Fall of the Labour Income Share: the Role of Technological Change and Imperfect Labour Markets
9/17
29/2017 Weber, E. Zimmert, F.
The creation and resolution of working hour dis-crepancies over the life course
9/17
30/2017 Dauth, W. externe
German Robots – The Impact of Industrial Ro-bots on Workers
10/17
31/2017 Peters, C. Quantifying the effect of labor market size on learning externalities
10/17
32/2017 Hutter, C. Weber, E.
The Effects of Skill-Biased Technical Change on Productivity Flattening and Hours Worked
11/17
33/2017 Rebien, M. Stops, M. extern.
Formal Search and Referrals from a Firm’s Per-spective
11/17
34/2017 Schierholz, M. Kreuter, F. externe
Learning from Mouse Movements: Improving Questionnaire and Respondents’ User Experi-ence through Passive Data Collection
12/17
35/2017 Fedorets, A. Stops, M. Lottmann, F.
Job Matching on Connected Regional and Occu-pational Labor Markets
12/17
1/2018 Grimpe, C. Murmann, M. Sofka, W.
The Organizational Design of High-Tech Startups and Product Innovation
1/18
As per: 2018-01-04
For a full list, consult the IAB website http://www.iab.de/de/publikationen/discussion-paper.aspx

For further inquiries contact the authors:
Marlene KnörrPhone +49.911.179.8725E-mail [email protected]
Enzo WeberPhone +49.911.179 7643E-mail [email protected]
Imprint
IAB-Discussion Paper 2/201822 January 2018
Editorial addressInstitute for Employment Research of the Federal Employment AgencyRegensburger Straße 104D-90478 Nuremberg
Editorial staffRicardo Martinez Moya, Jutta Palm-Nowak
Technical completionRenate Martin
All rights reservedReproduction and distribution in any form, also in parts, requires the permission of IAB Nuremberg
Websitehttp://www.iab.de
Download of this Discussion Paperhttp://doku.iab.de/discussionpapers/2018/dp0218.pdf
ISSN 2195-2663