Embed Size (px)
Citation preview
Global Warming
L. David Roper [email protected]
Discovery of Global Warming: http://www.aip.org/history/climate/
http://tinyurl.com/GlobalWarmingRoper
I prefer “Global Warming” rather
than “Climate Change”, because “Climate Change” does not specify the direction of
the change.
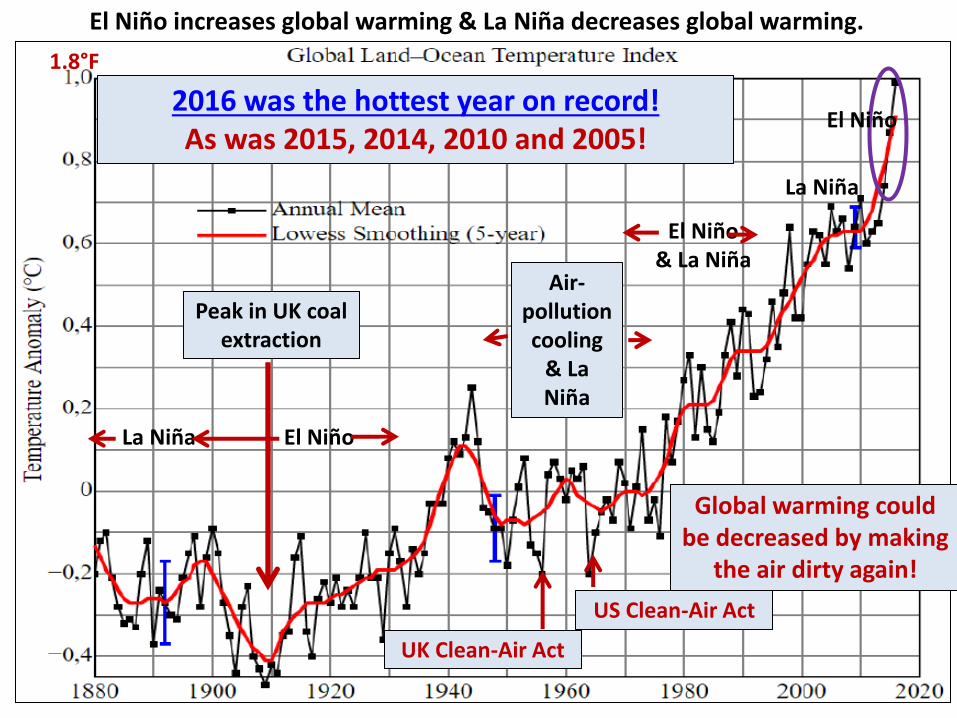
US Clean-Air Act
Air-pollution cooling
& La Niña
La Niña El Niño
El Niño & La Niña
El Niño increases global warming & La Niña decreases global warming.
El Niño
La Niña
2016 was the hottest year on record! As was 2015, 2014, 2010 and 2005!
Peak in UK coal extraction
Global warming could be decreased by making
the air dirty again!
UK Clean-Air Act
1.8°F
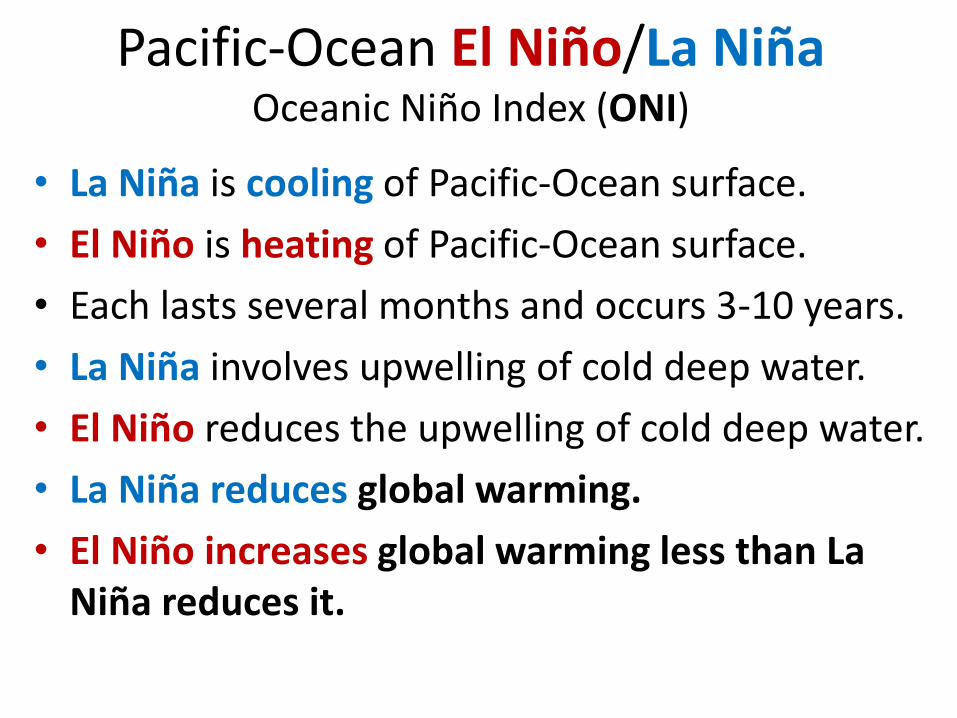
Pacific-Ocean El Niño/La Niña Oceanic Niño Index (ONI)
• La Niña is cooling of Pacific-Ocean surface.
• El Niño is heating of Pacific-Ocean surface.
• Each lasts several months and occurs 3-10 years.
• La Niña involves upwelling of cold deep water.
• El Niño reduces the upwelling of cold deep water.
• La Niña reduces global warming.
• El Niño increases global warming less than La Niña reduces it.
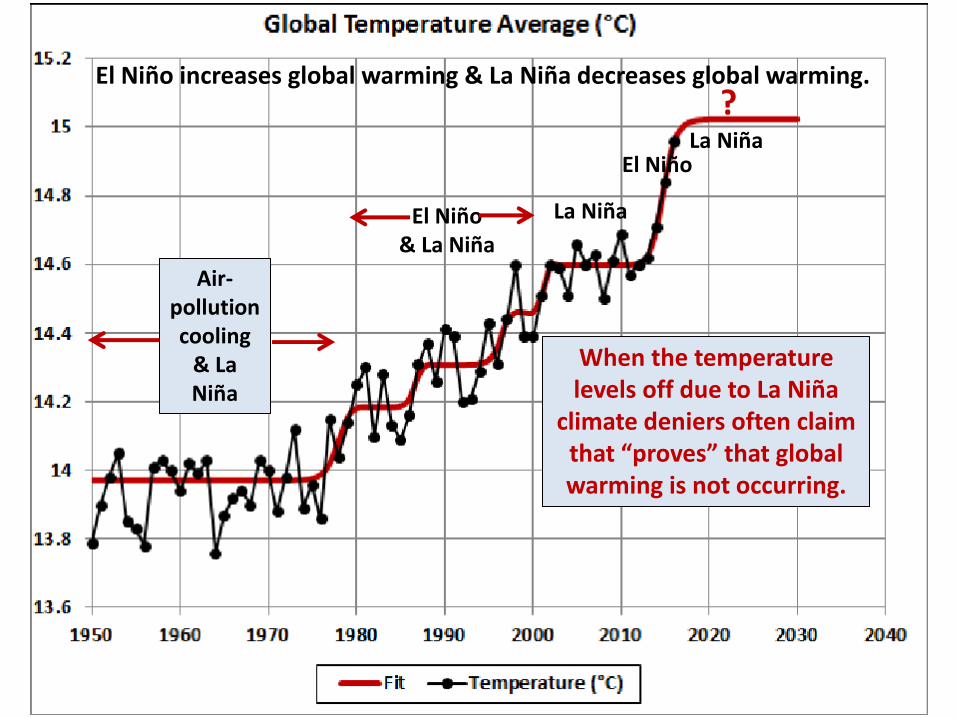
Air-pollution cooling
& La Niña
El Niño & La Niña
La Niña
El Niño
?
When the temperature levels off due to La Niña
climate deniers often claim that “proves” that global warming is not occurring.
La Niña
El Niño increases global warming & La Niña decreases global warming.
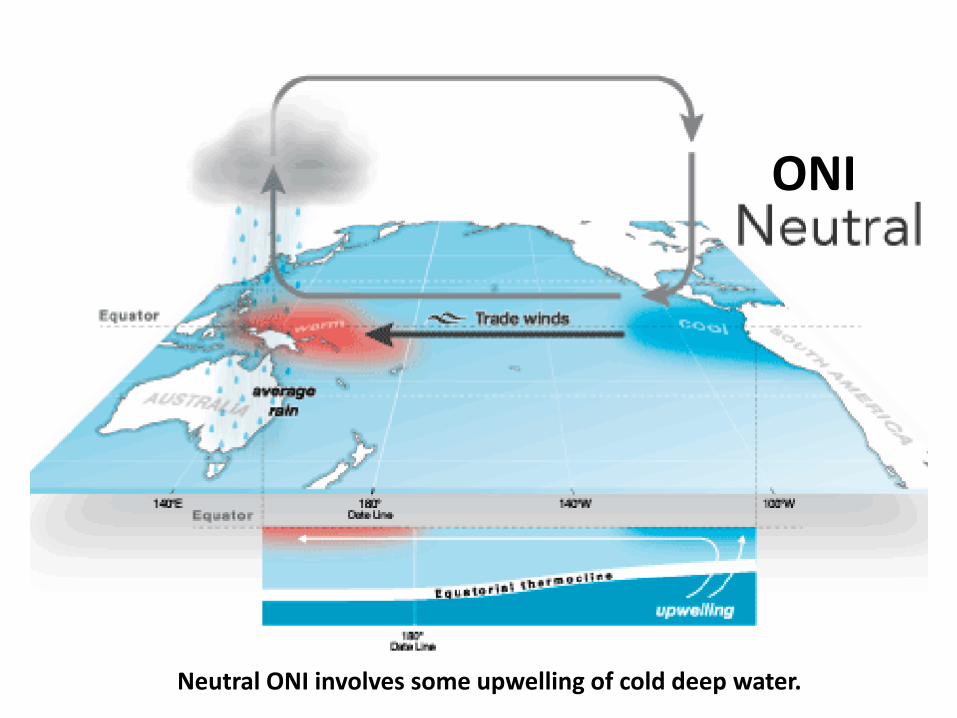
ONI
Neutral ONI involves some upwelling of cold deep water.
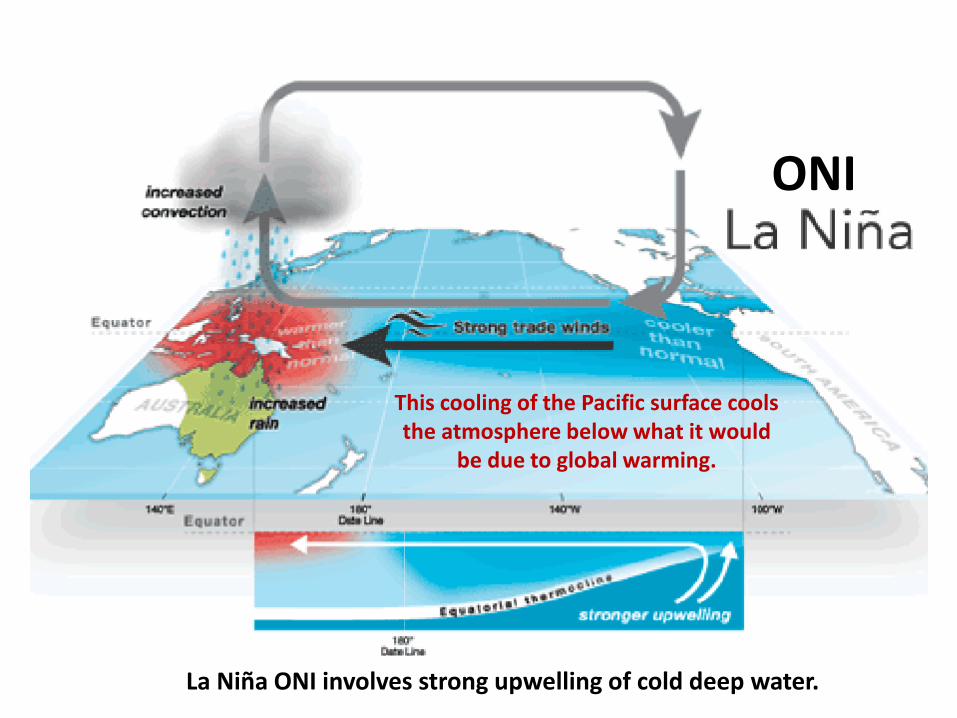
This cooling of the Pacific surface cools the atmosphere below what it would
be due to global warming.
ONI
La Niña ONI involves strong upwelling of cold deep water.
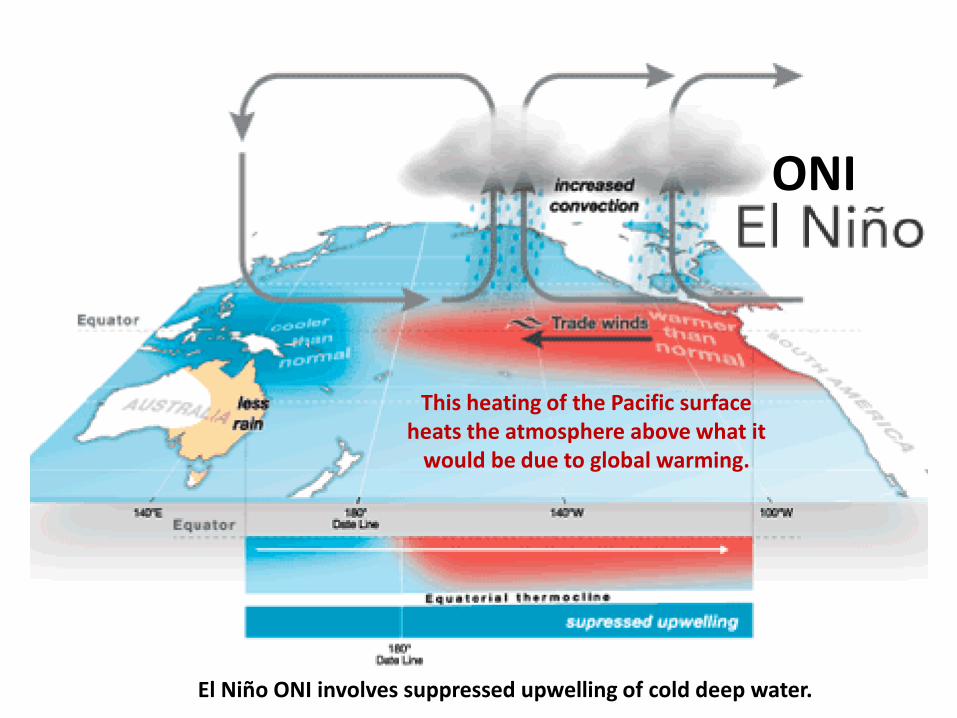
This heating of the Pacific surface heats the atmosphere above what it
would be due to global warming.
ONI
El Niño ONI involves suppressed upwelling of cold deep water.
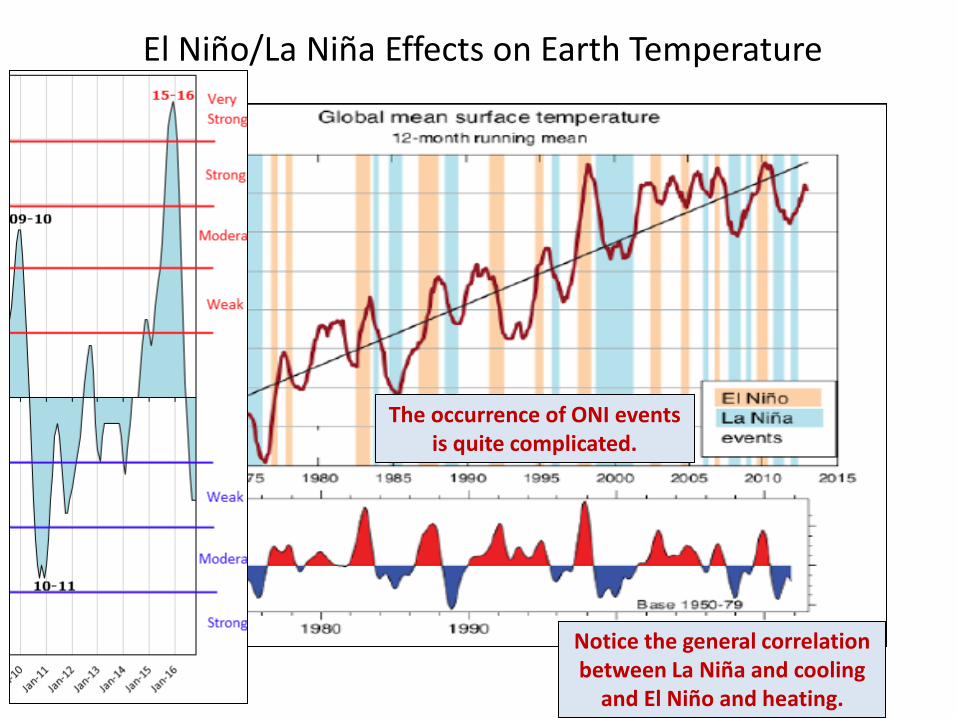
El Niño/La Niña Effects on Earth Temperature
The occurrence of ONI events is quite complicated.
Notice the general correlation between La Niña and cooling
and El Niño and heating.
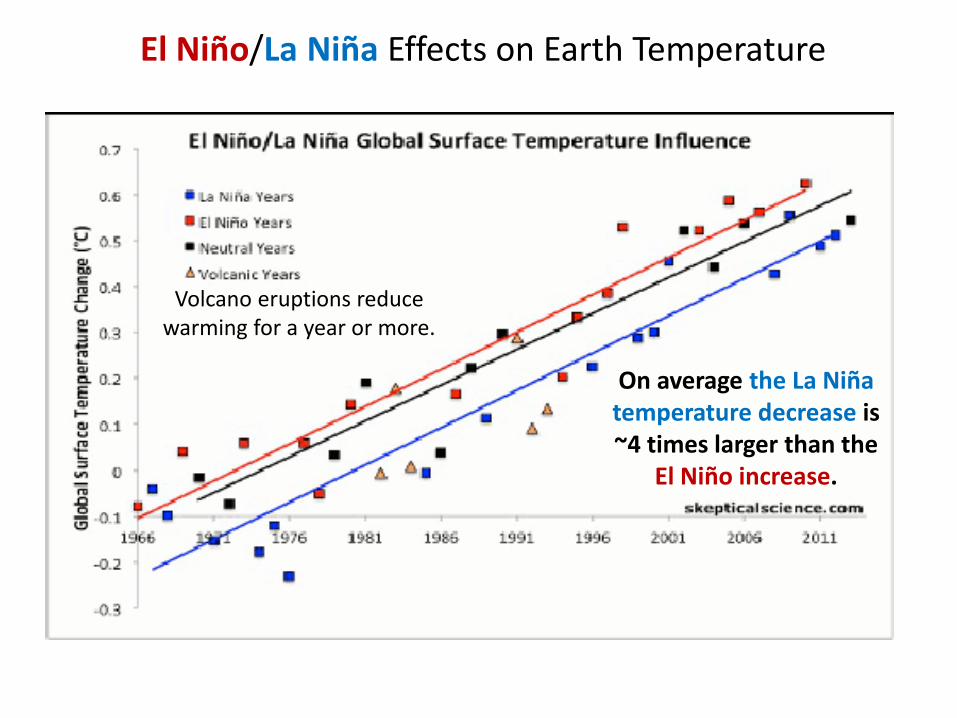
El Niño/La Niña Effects on Earth Temperature
On average the La Niña temperature decrease is ~4 times larger than the
El Niño increase.
Volcano eruptions reduce warming for a year or more.
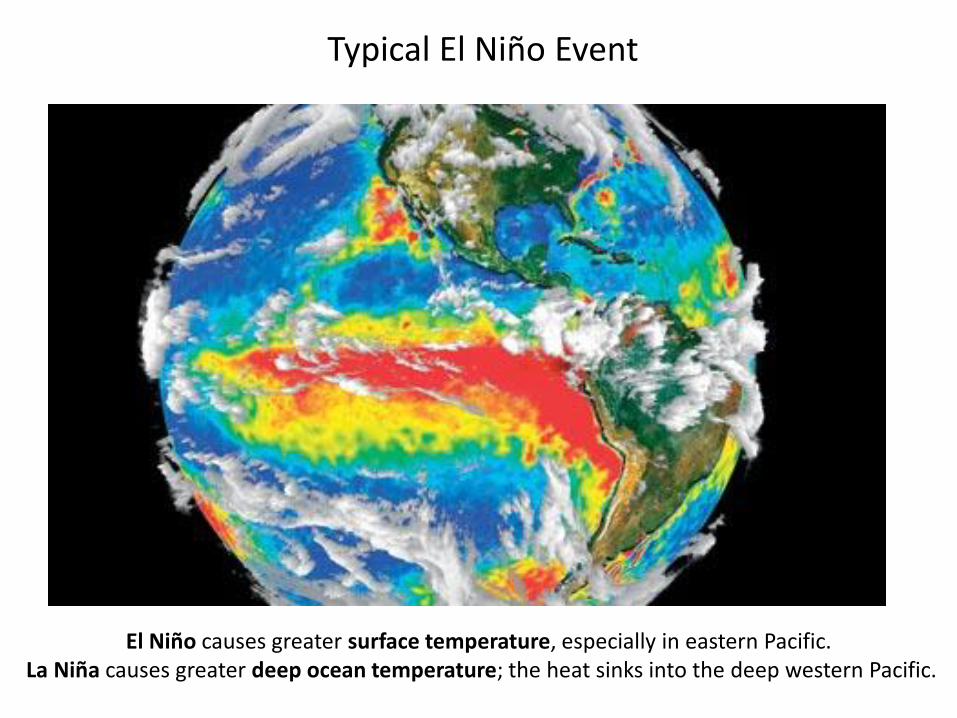
Typical El Niño Event
El Niño causes greater surface temperature, especially in eastern Pacific. La Niña causes greater deep ocean temperature; the heat sinks into the deep western Pacific.

Recent Rapid Temperature Rise!
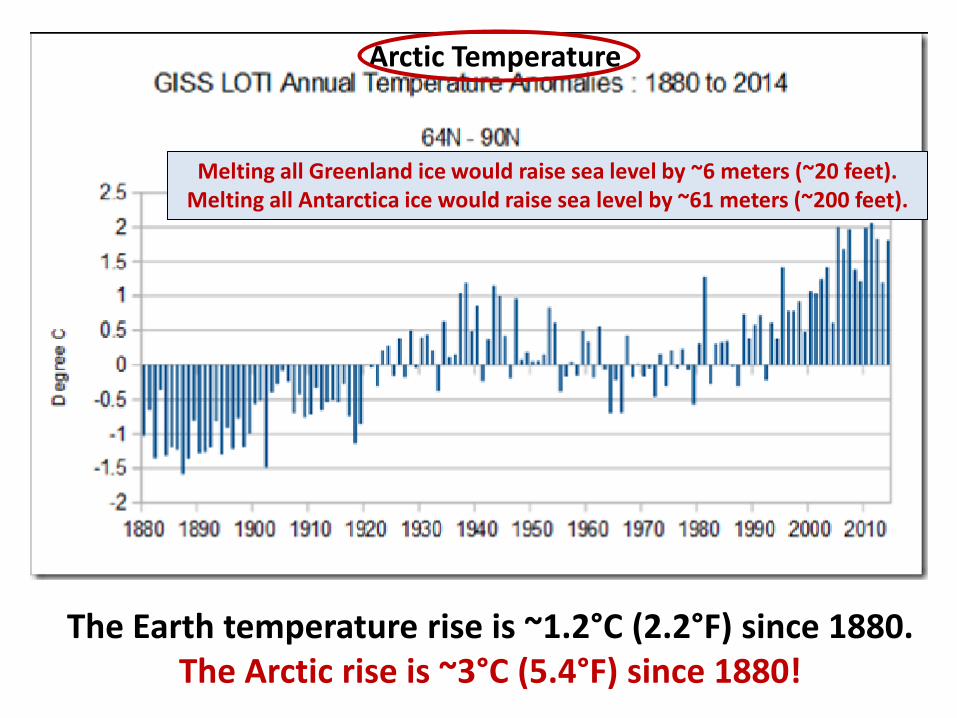
The Earth temperature rise is ~1.2°C (2.2°F) since 1880. The Arctic rise is ~3°C (5.4°F) since 1880!
Melting all Greenland ice would raise sea level by ~6 meters (~20 feet). Melting all Antarctica ice would raise sea level by ~61 meters (~200 feet).
Arctic Temperature
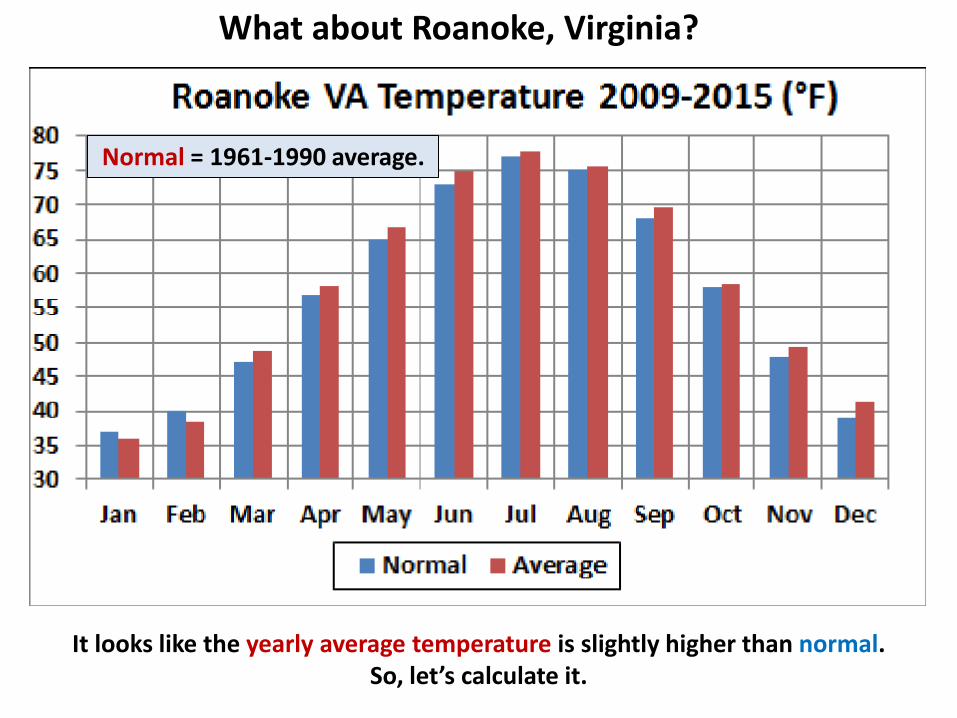
It looks like the yearly average temperature is slightly higher than normal. So, let’s calculate it.
What about Roanoke, Virginia?
Normal = 1961-1990 average.
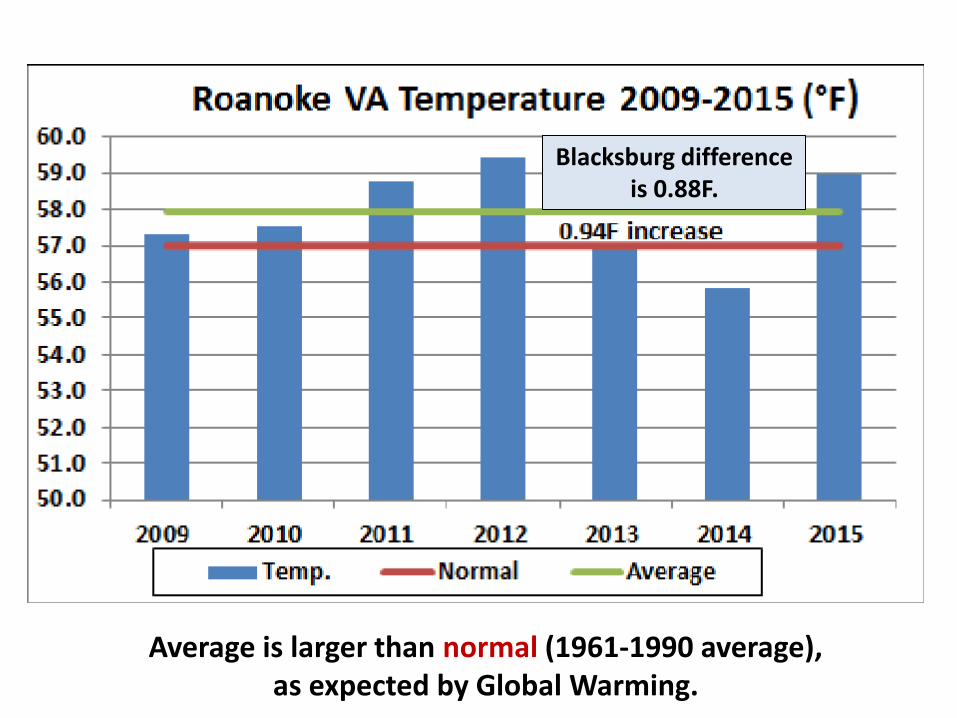
Average is larger than normal (1961-1990 average), as expected by Global Warming.
Blacksburg difference is 0.88F.
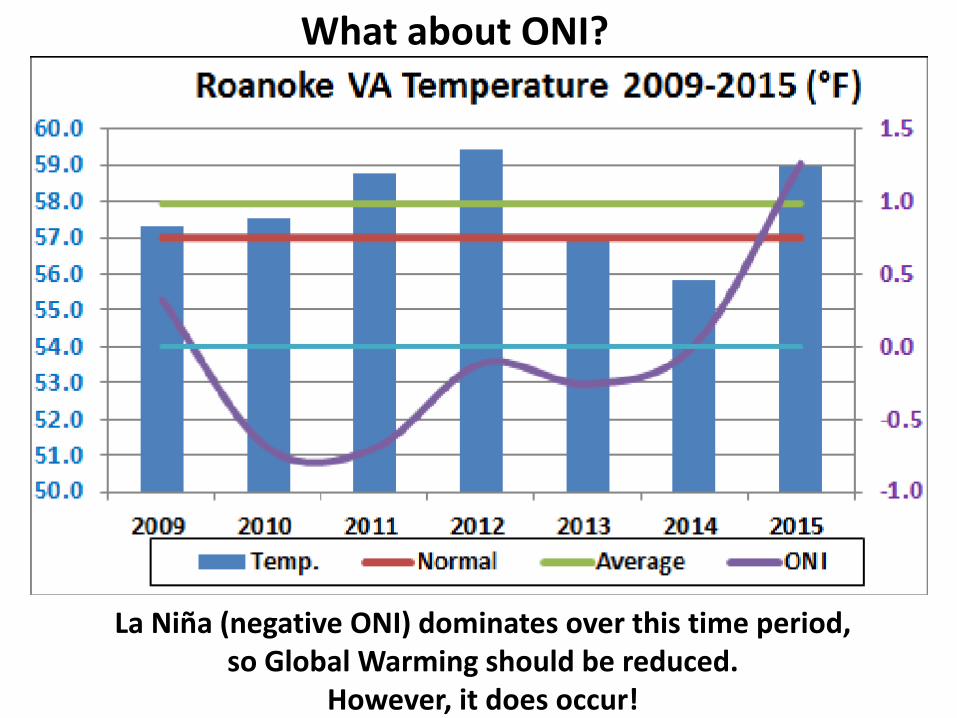
La Niña (negative ONI) dominates over this time period, so Global Warming should be reduced.
However, it does occur!
What about ONI?
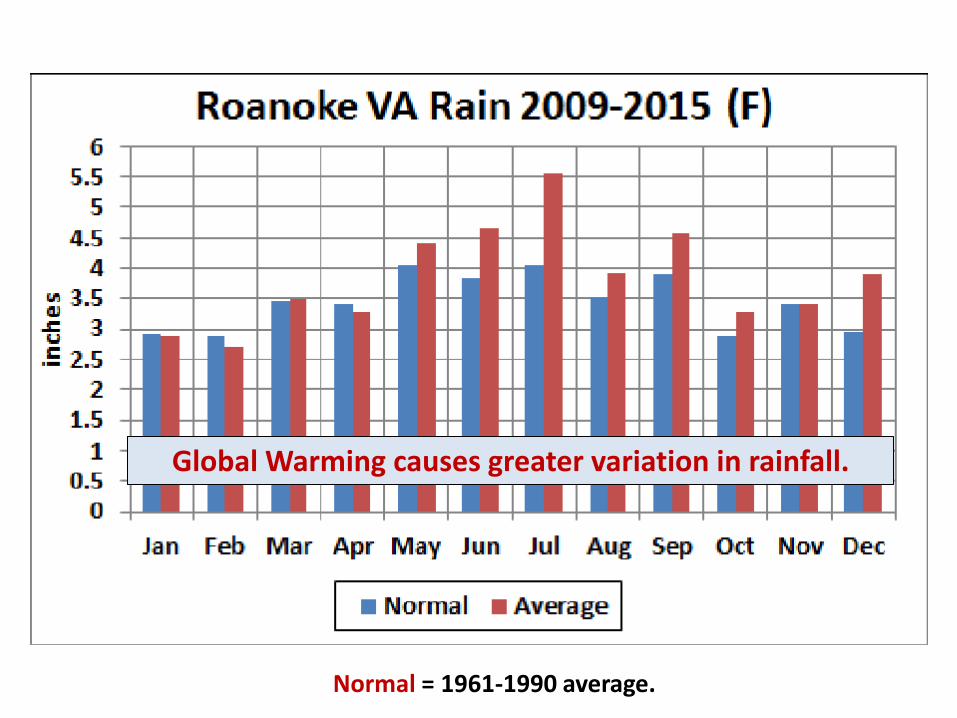
Global Warming causes greater variation in rainfall.
Normal = 1961-1990 average.
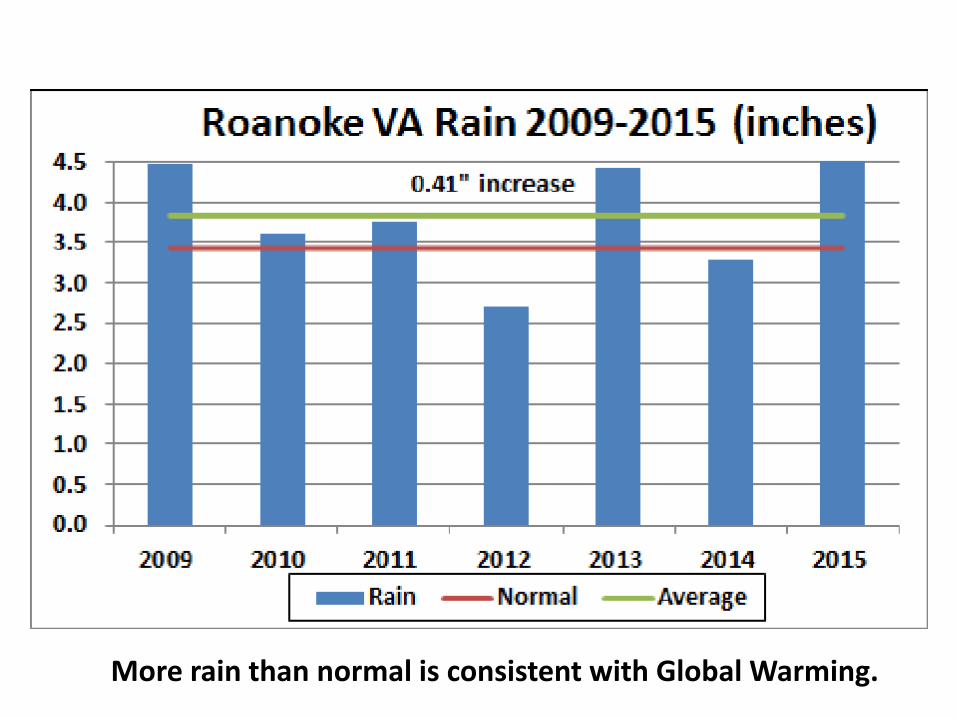
More rain than normal is consistent with Global Warming.
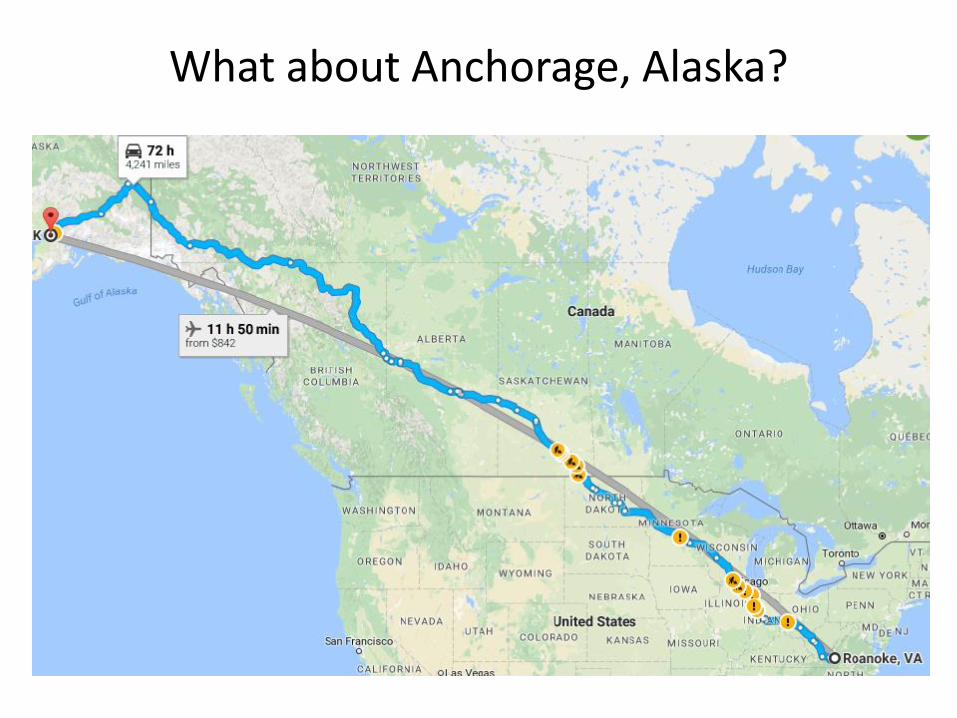
What about Anchorage, Alaska?
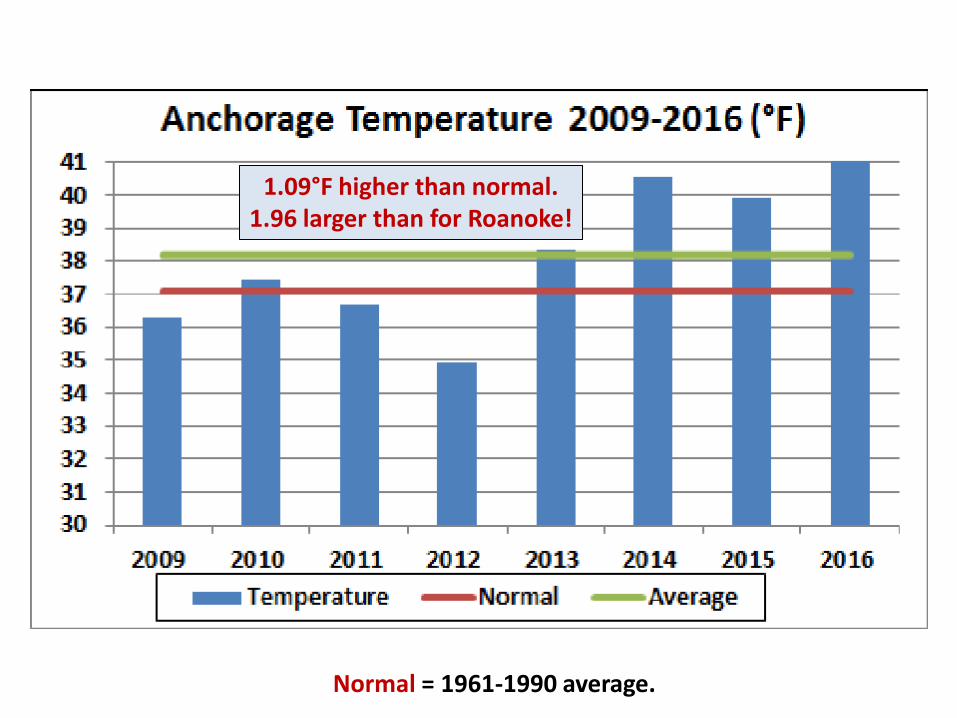
Normal = 1961-1990 average.
1.09°F higher than normal. 1.96 larger than for Roanoke!
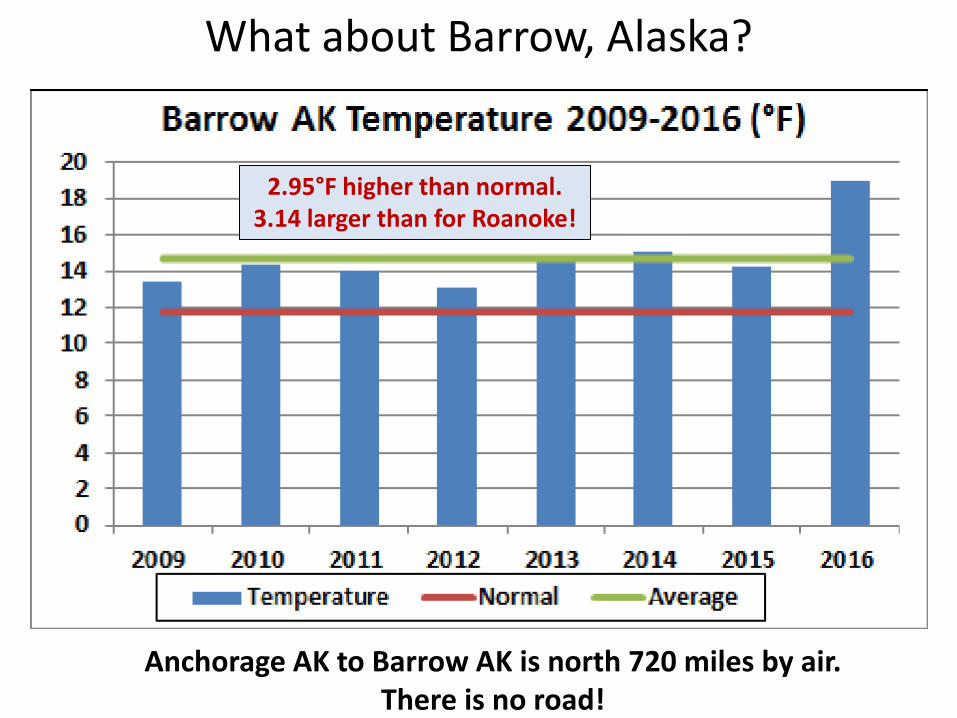
What about Barrow, Alaska?
2.95°F higher than normal. 3.14 larger than for Roanoke!
Anchorage AK to Barrow AK is north 720 miles by air. There is no road!
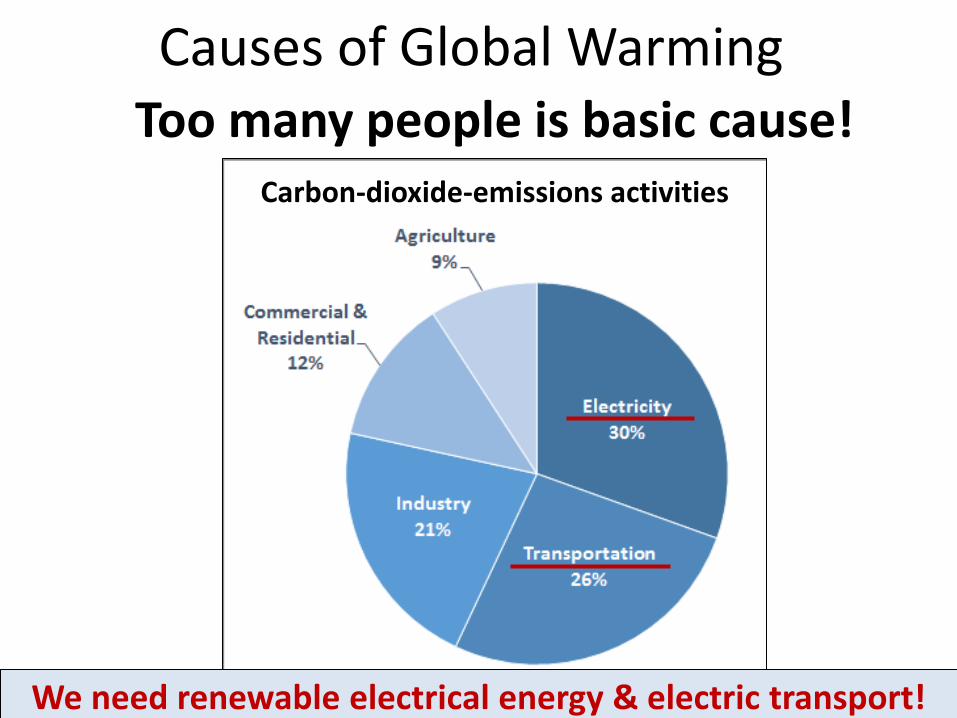
Causes of Global Warming Too many people is basic cause!
We need renewable electrical energy & electric transport!
Carbon-dioxide-emissions activities
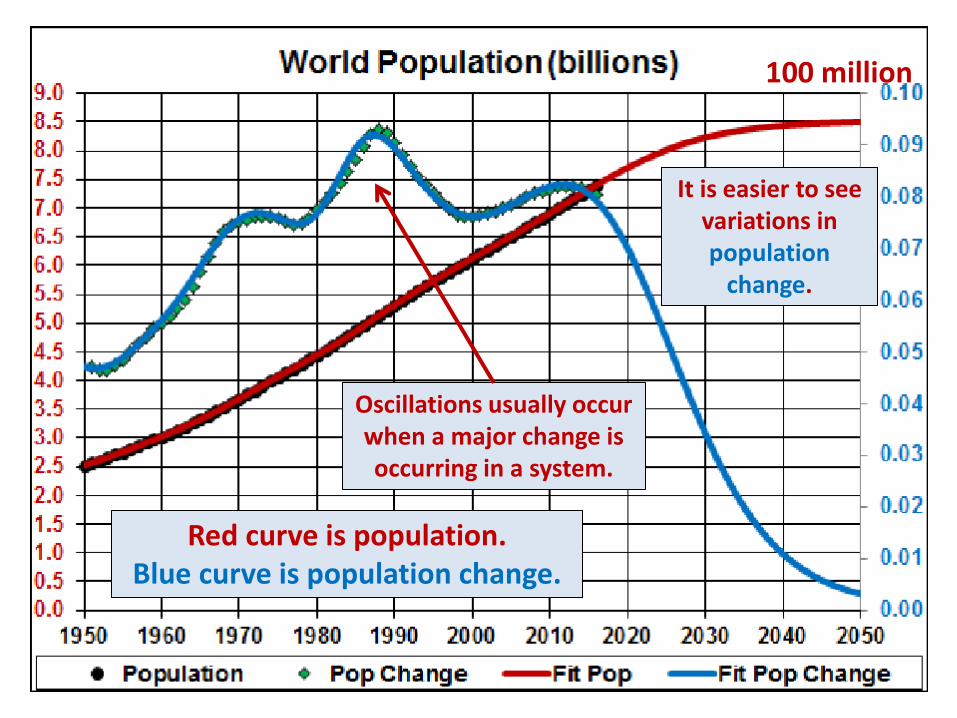
Oscillations usually occur when a major change is occurring in a system.
Red curve is population. Blue curve is population change.
It is easier to see variations in population
change.
100 million
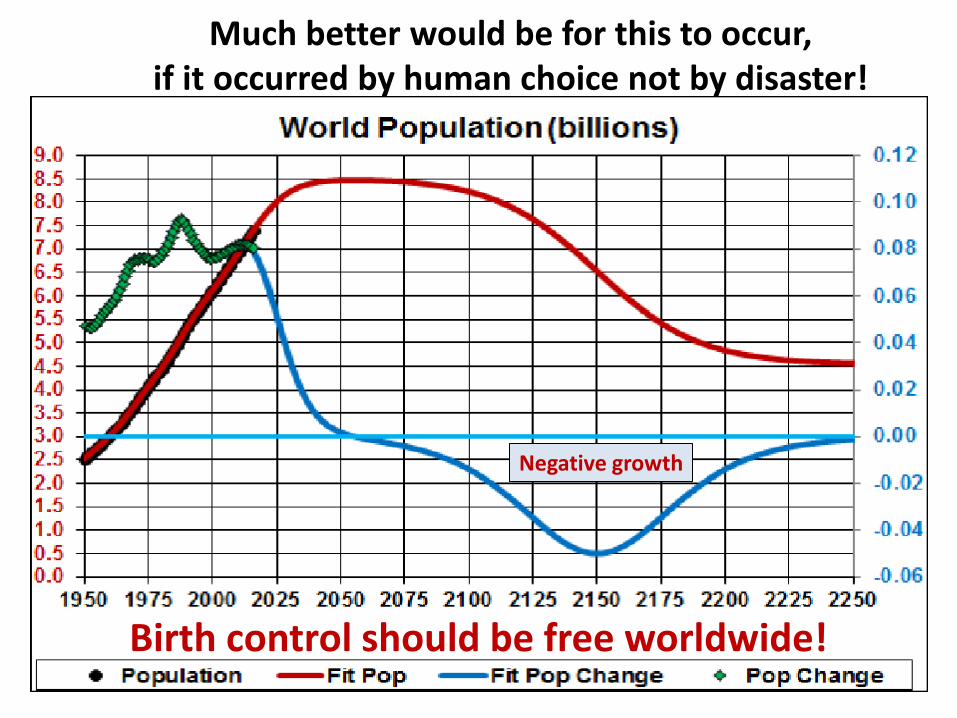
Much better would be for this to occur, if it occurred by human choice not by disaster!
Birth control should be free worldwide!
Negative growth
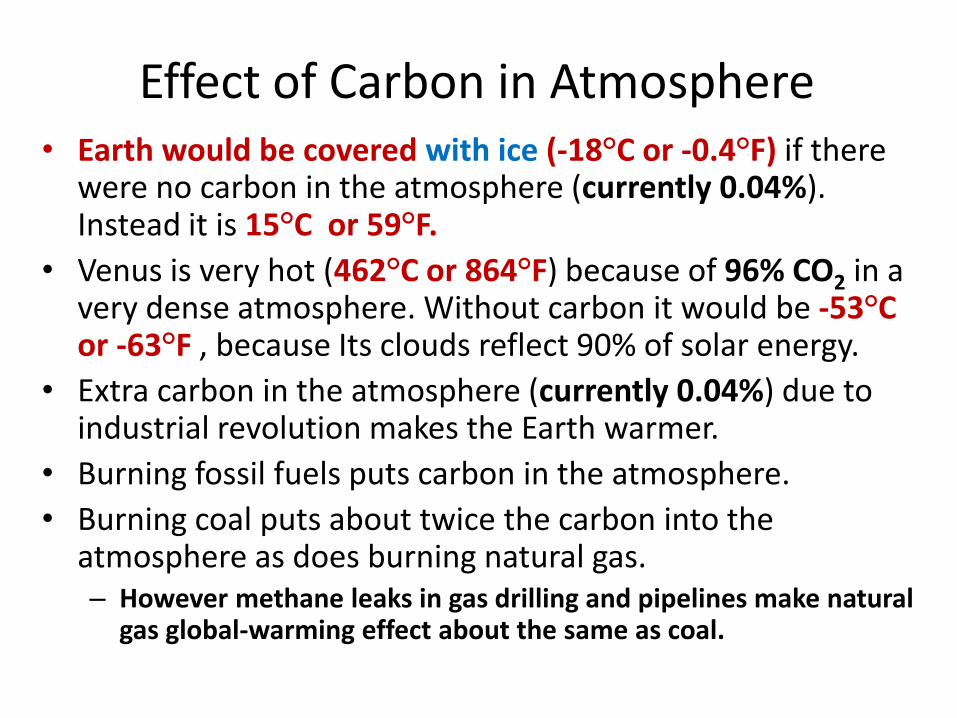
Effect of Carbon in Atmosphere • Earth would be covered with ice (-18°C or -0.4°F) if there
were no carbon in the atmosphere (currently 0.04%). Instead it is 15°C or 59°F.
• Venus is very hot (462°C or 864°F) because of 96% CO2 in a very dense atmosphere. Without carbon it would be -53°C or -63°F , because Its clouds reflect 90% of solar energy.
• Extra carbon in the atmosphere (currently 0.04%) due to industrial revolution makes the Earth warmer.
• Burning fossil fuels puts carbon in the atmosphere.
• Burning coal puts about twice the carbon into the atmosphere as does burning natural gas. – However methane leaks in gas drilling and pipelines make natural
gas global-warming effect about the same as coal.
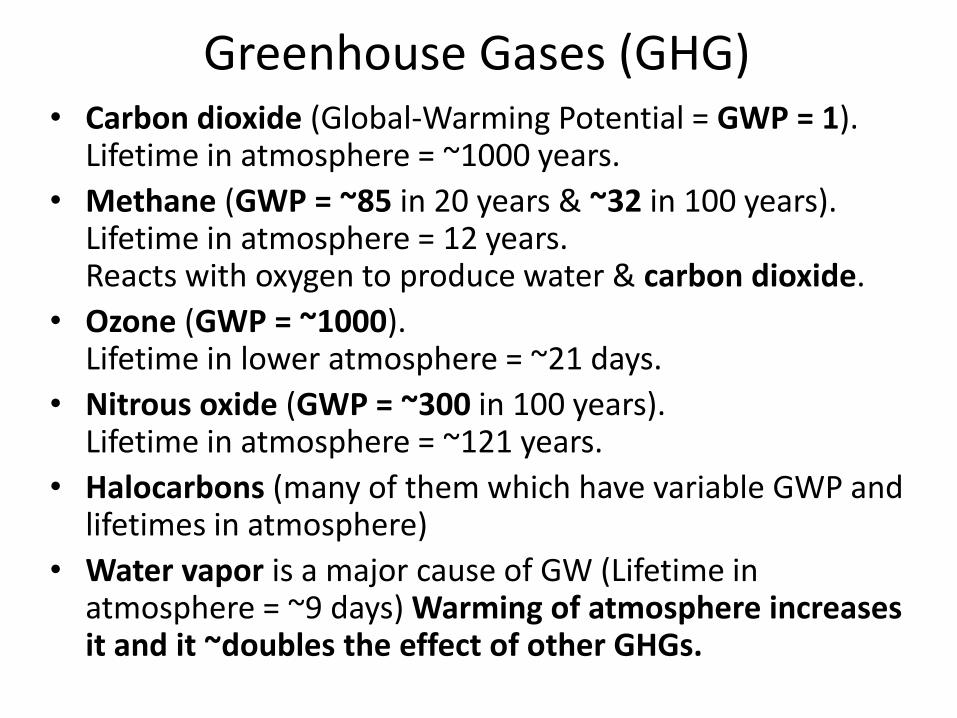
Greenhouse Gases (GHG) • Carbon dioxide (Global-Warming Potential = GWP = 1).
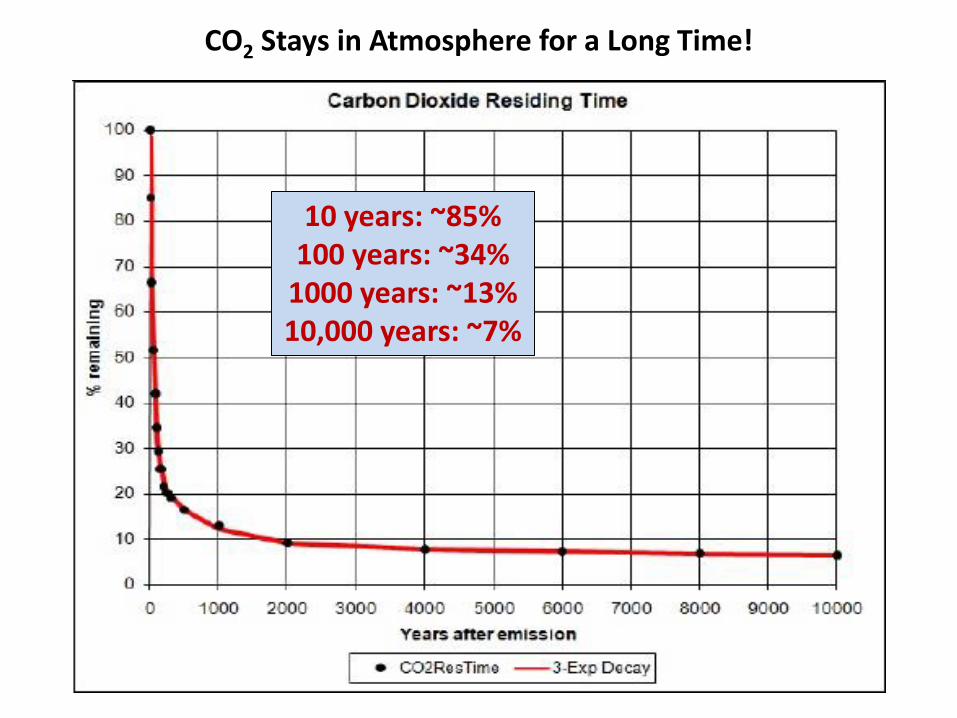
Lifetime in atmosphere = ~1000 years.
• Methane (GWP = ~85 in 20 years & ~32 in 100 years). Lifetime in atmosphere = 12 years. Reacts with oxygen to produce water & carbon dioxide.
• Ozone (GWP = ~1000). Lifetime in lower atmosphere = ~21 days.
• Nitrous oxide (GWP = ~300 in 100 years). Lifetime in atmosphere = ~121 years.
• Halocarbons (many of them which have variable GWP and lifetimes in atmosphere)
• Water vapor is a major cause of GW (Lifetime in atmosphere = ~9 days) Warming of atmosphere increases it and it ~doubles the effect of other GHGs.
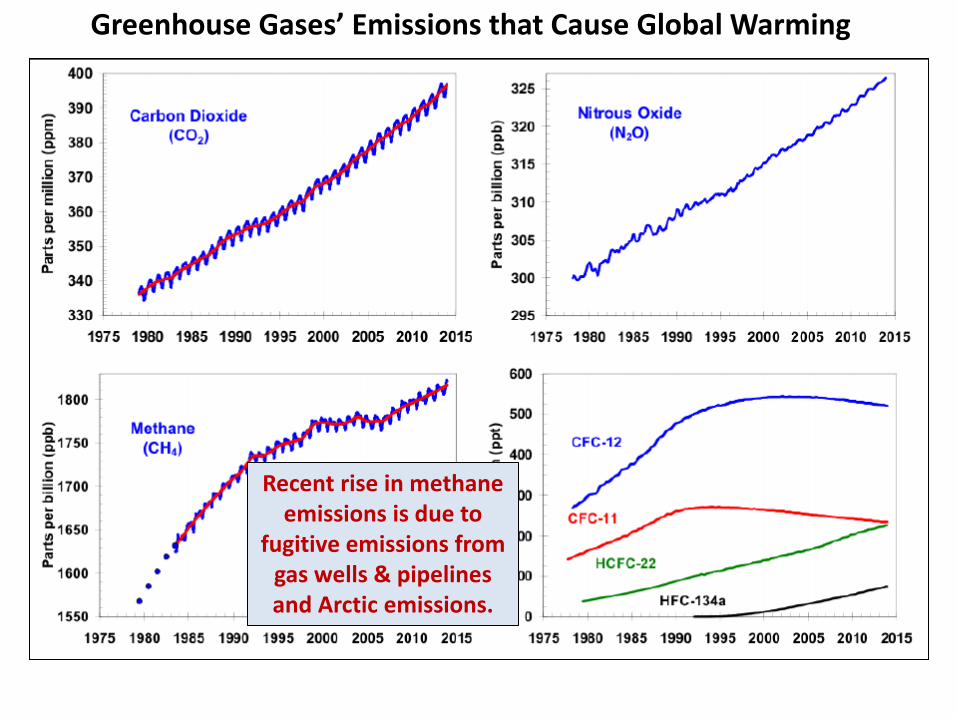
Recent rise in methane emissions is due to
fugitive emissions from gas wells & pipelines and Arctic emissions.
Greenhouse Gases’ Emissions that Cause Global Warming
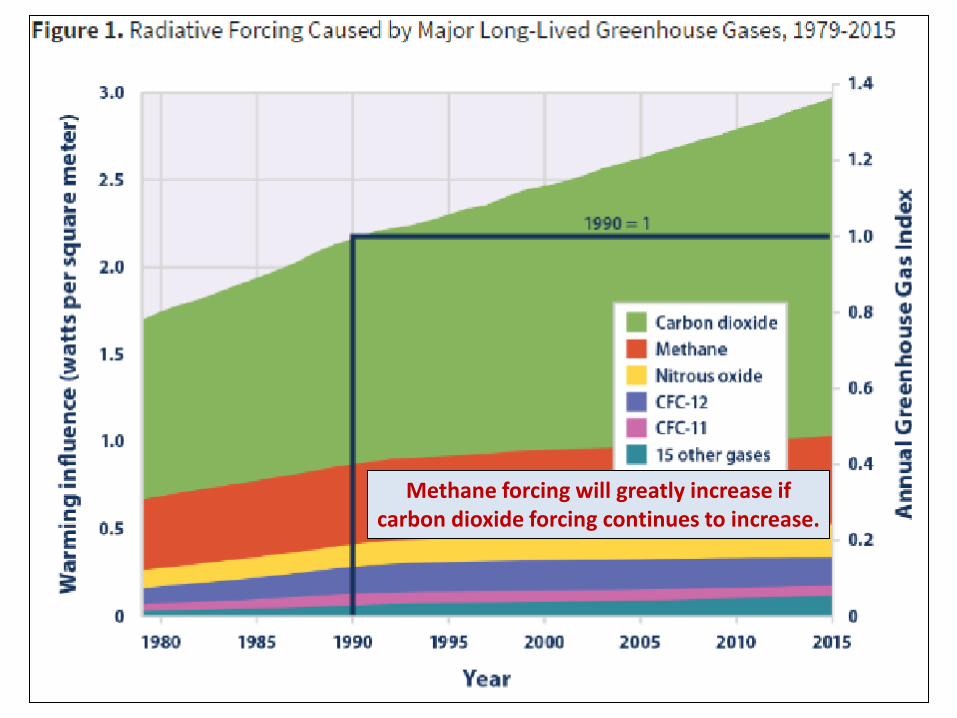
Methane forcing will greatly increase if carbon dioxide forcing continues to increase.
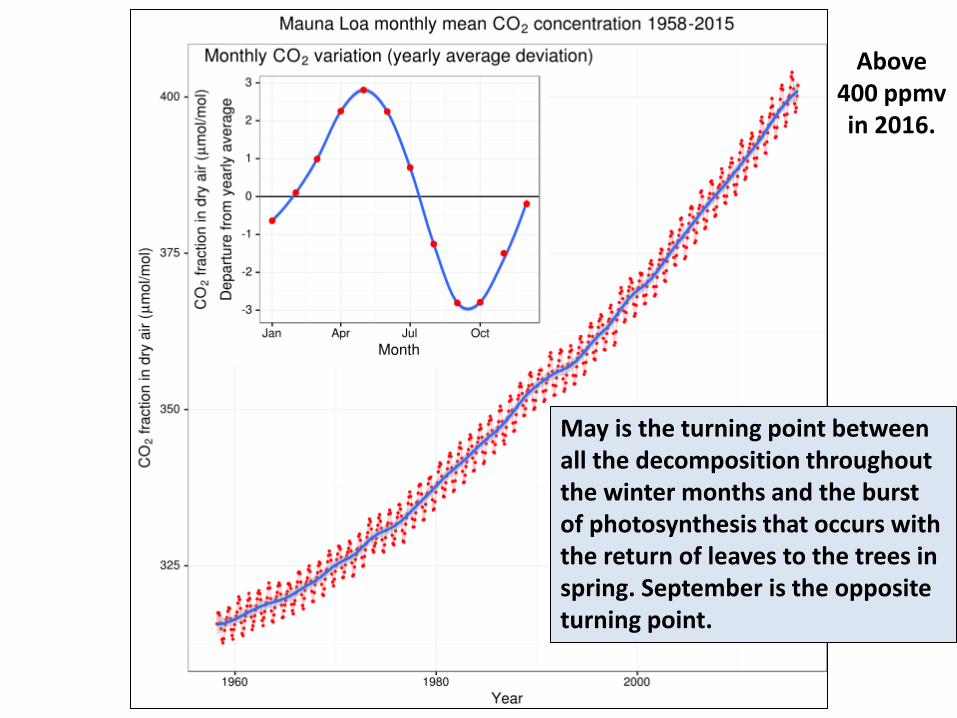
May is the turning point between all the decomposition throughout the winter months and the burst of photosynthesis that occurs with the return of leaves to the trees in spring. September is the opposite turning point.
Above 400 ppmv in 2016.
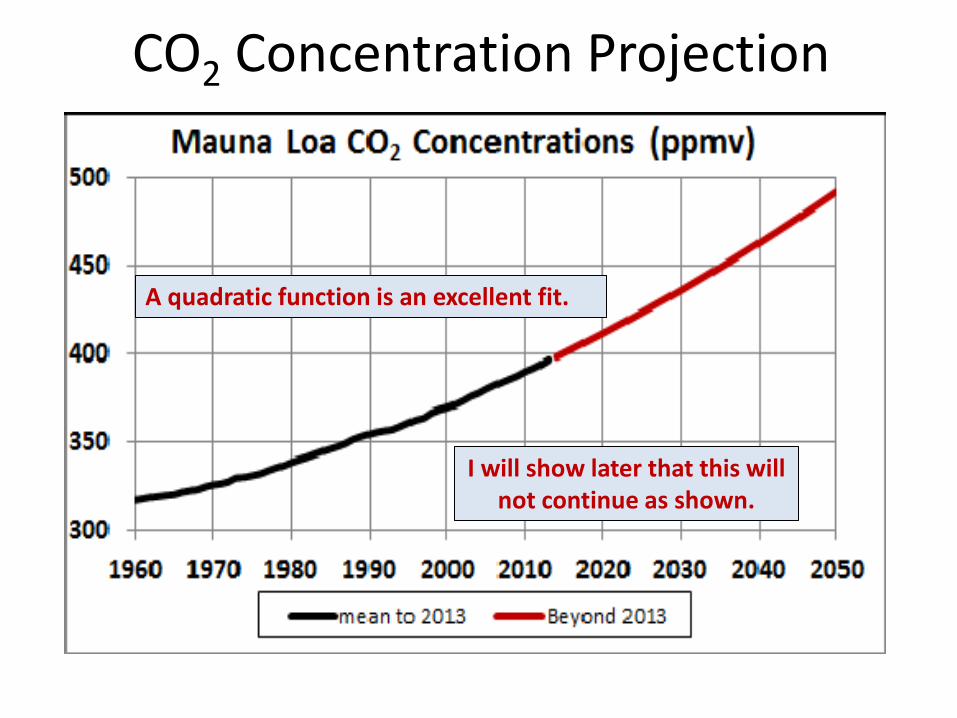
CO2 Concentration Projection
A quadratic function is an excellent fit.
I will show later that this will not continue as shown.
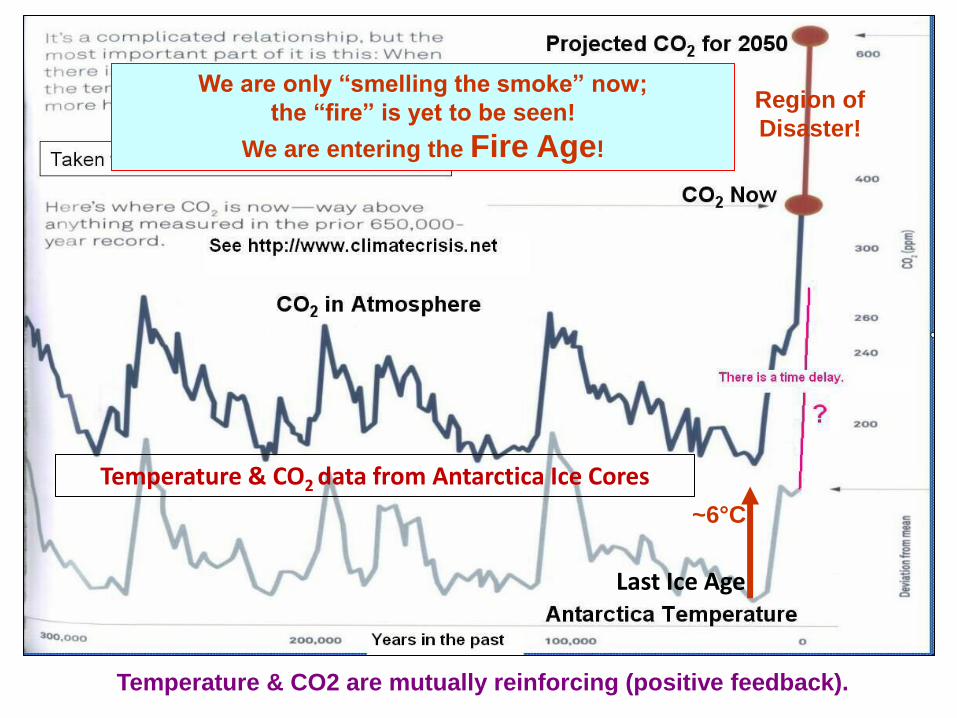
Temperature & CO2 are mutually reinforcing (positive feedback).
We are only “smelling the smoke” now;
the “fire” is yet to be seen!
We are entering the Fire Age!
~6°C
Region of
Disaster!
Temperature & CO2 data from Antarctica Ice Cores
Last Ice Age
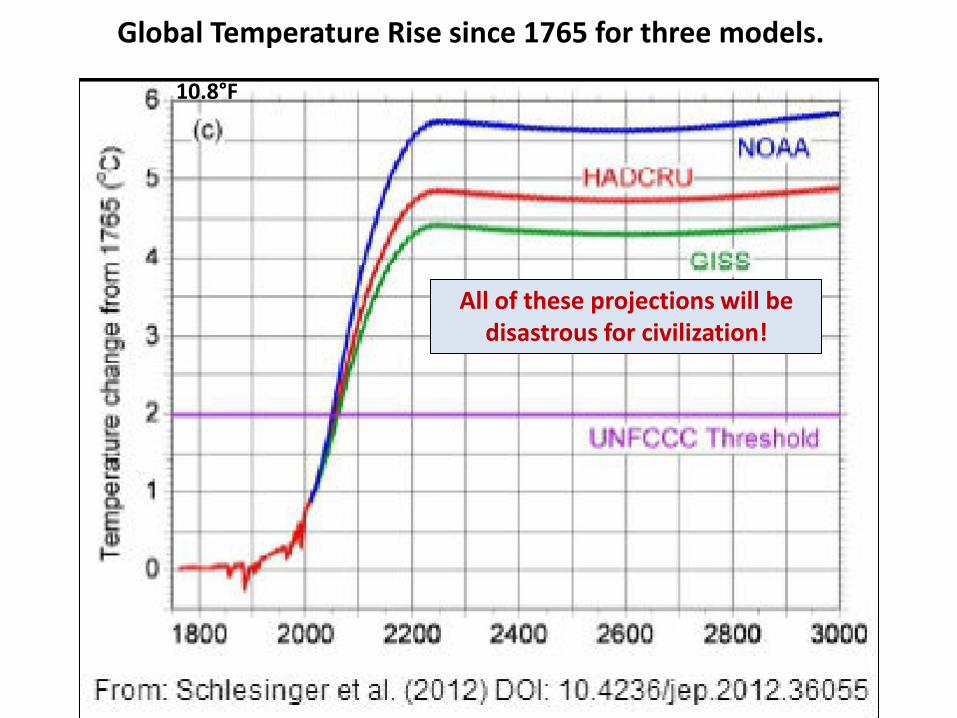
Global Temperature Rise since 1765 for three models.
All of these projections will be disastrous for civilization!
10.8°F
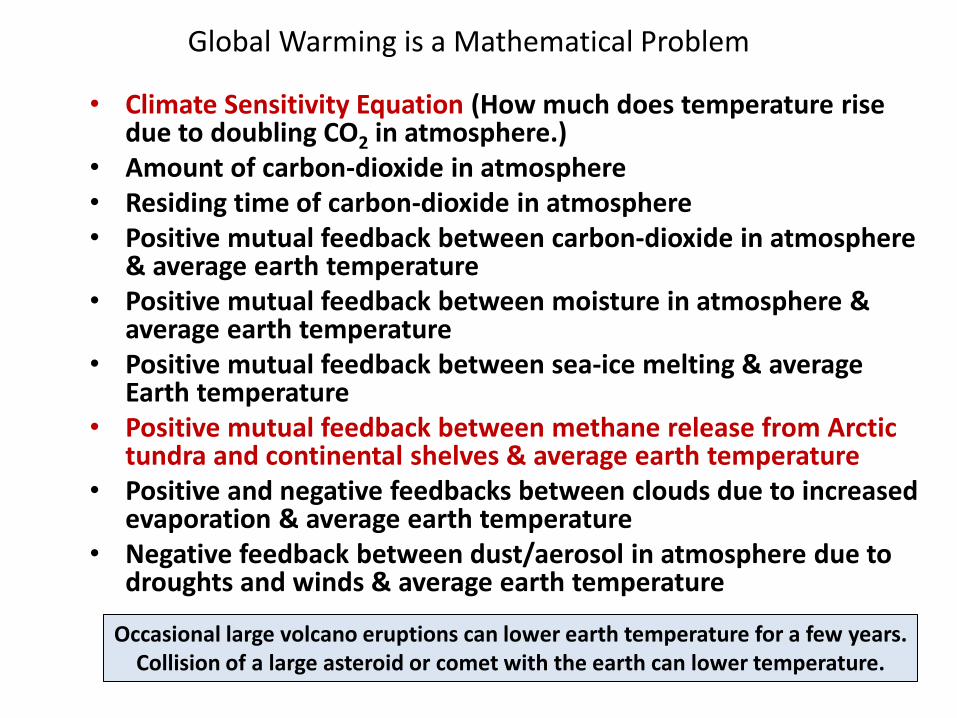
Global Warming is a Mathematical Problem
• Climate Sensitivity Equation (How much does temperature rise due to doubling CO2 in atmosphere.)
• Amount of carbon-dioxide in atmosphere • Residing time of carbon-dioxide in atmosphere • Positive mutual feedback between carbon-dioxide in atmosphere
& average earth temperature • Positive mutual feedback between moisture in atmosphere &
average earth temperature • Positive mutual feedback between sea-ice melting & average
Earth temperature • Positive mutual feedback between methane release from Arctic
tundra and continental shelves & average earth temperature • Positive and negative feedbacks between clouds due to increased
evaporation & average earth temperature • Negative feedback between dust/aerosol in atmosphere due to
droughts and winds & average earth temperature
Occasional large volcano eruptions can lower earth temperature for a few years. Collision of a large asteroid or comet with the earth can lower temperature.
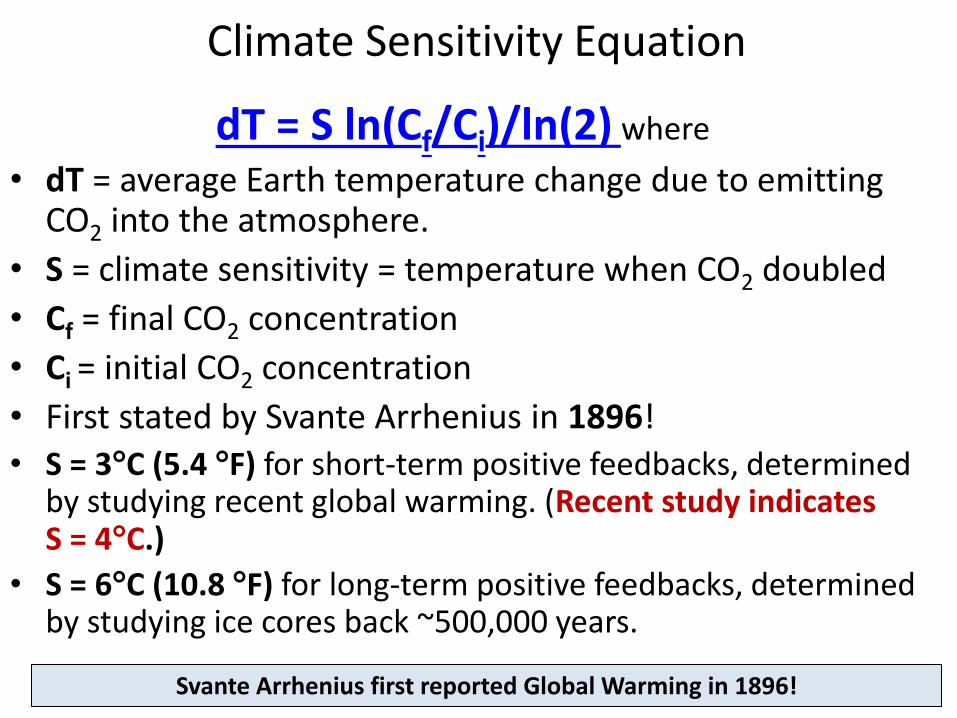
Climate Sensitivity Equation
dT = S ln(Cf/Ci)/ln(2) where
• dT = average Earth temperature change due to emitting CO2 into the atmosphere.
• S = climate sensitivity = temperature when CO2 doubled
• Cf = final CO2 concentration
• Ci = initial CO2 concentration
• First stated by Svante Arrhenius in 1896!
• S = 3C (5.4 F) for short-term positive feedbacks, determined by studying recent global warming. (Recent study indicates S = 4C.)
• S = 6C (10.8 F) for long-term positive feedbacks, determined by studying ice cores back ~500,000 years.
Svante Arrhenius first reported Global Warming in 1896!
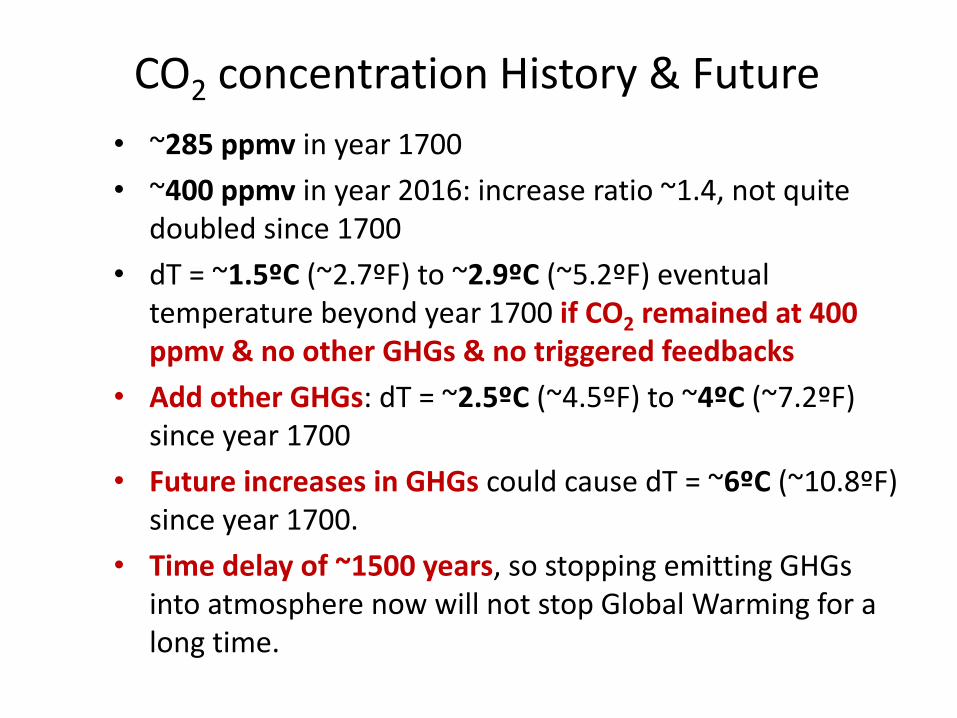
CO2 concentration History & Future
• ~285 ppmv in year 1700
• ~400 ppmv in year 2016: increase ratio ~1.4, not quite doubled since 1700
• dT = ~1.5ºC (~2.7ºF) to ~2.9ºC (~5.2ºF) eventual temperature beyond year 1700 if CO2 remained at 400 ppmv & no other GHGs & no triggered feedbacks
• Add other GHGs: dT = ~2.5ºC (~4.5ºF) to ~4ºC (~7.2ºF) since year 1700
• Future increases in GHGs could cause dT = ~6ºC (~10.8ºF) since year 1700.
• Time delay of ~1500 years, so stopping emitting GHGs into atmosphere now will not stop Global Warming for a long time.
8°C
10 years: ~85% 100 years: ~34%
1000 years: ~13% 10,000 years: ~7%
CO2 Stays in Atmosphere for a Long Time!
Changes to Global Warming (GW) besides GHGs
• Deforestation cancels the trees absorbing CO2.
• Aerosols and particulates in the atmosphere reduce GW. (Geoengineering is proposed to put aerosols into the atmosphere. They are detrimental to human health and reside only a few years in atmosphere.)
• Geoengineering proposals to reduce the sunlight striking the Earth (unintended side effects?) See Hack the Planet book.
• High temperature melting Arctic sea ice reveals dark water to absorb much more solar energy than does ice, causing increased GW.
• High temperature causes release of methane from Arctic permafrost and continental shelves (triggered feedback).
Climate Models • Atmosphere of Earth divided into a large 3-dimensional grid to a
particular height • Surface of Earth divided into a large 2-dimensional grid • Oceans of Earth divided into a large 3-dimensional grid to a
particular depth • Incoming solar energy at all wavelengths • Outgoing energy from the Earth • GHGs in atmosphere • Intake of GHGs into the oceans • Heat and mass transfer between the grid elements • Instruments, including satellites, measuring climate variables • Large supercomputers doing the climate calculations • There are several major models that give similar results. An
average of ~15 models’ predictions is used. • Copious Earth data show larger current global warming effects
than the models calculate. So, yes, the models are “wrong”, but in a bad direction!
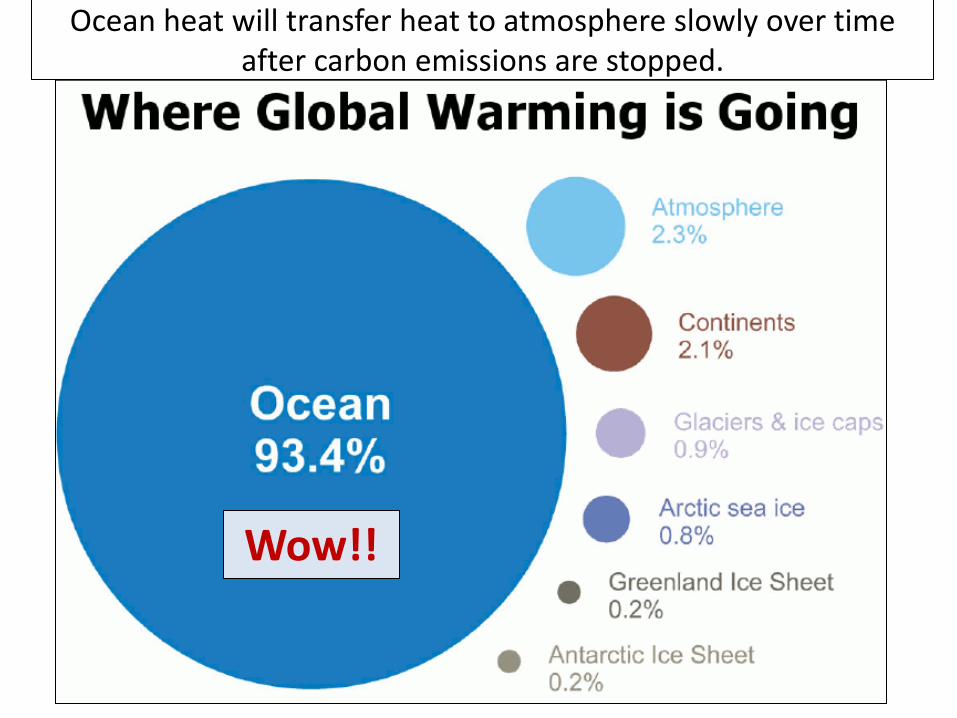
Ocean heat will transfer heat to atmosphere slowly over time after carbon emissions are stopped.
Wow!!
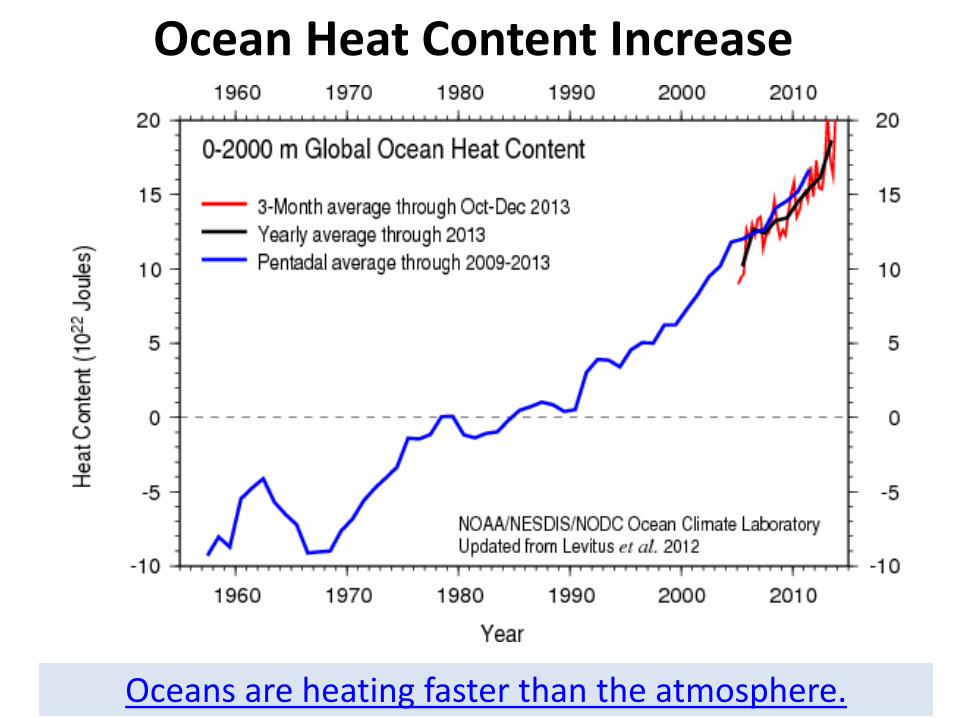
Ocean Heat Content Increase
Oceans are heating faster than the atmosphere.
Extreme Storms
• Polar vortex: fast counterclockwise winds around the Arctic
• Arctic warming more than temperate areas, such as US, reduces the temperature differential, which weakens the Polar Vortex.
• Weakened Polar Vortex causes undulations in the Jet Stream, pulling warm air from western US into Arctic and cold air from the Arctic into eastern US.
• Collision of Arctic cold air with south Pacific, south Atlantic and Gulf of Mexico warm moist air causes extreme storms with high precipitation in eastern United States, which deprives western United States of precipitation, causing extreme droughts and subsequent forest fires.
• U.S. storm damage cost was 2.5 times more for 2011-2015 compared to 1980-2010.
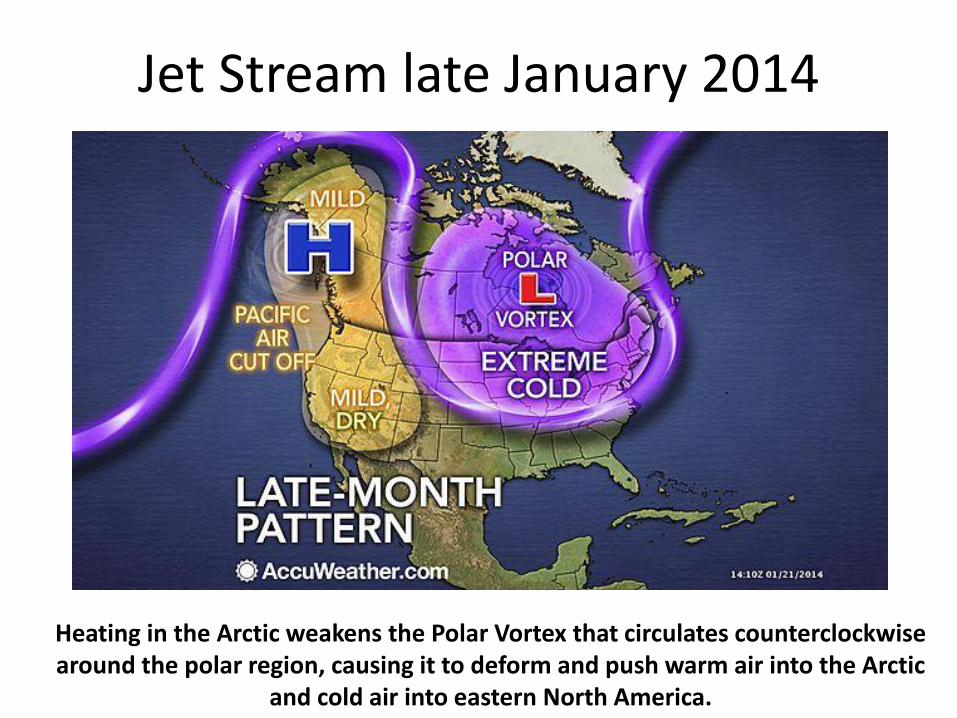
Jet Stream late January 2014
Heating in the Arctic weakens the Polar Vortex that circulates counterclockwise around the polar region, causing it to deform and push warm air into the Arctic
and cold air into eastern North America.
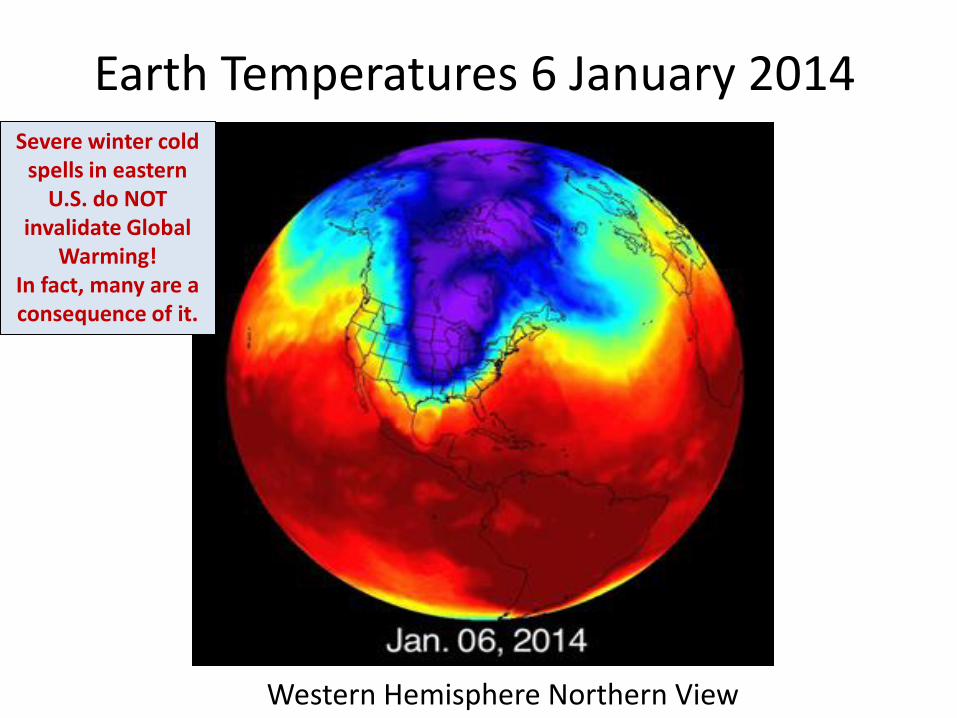
Earth Temperatures 6 January 2014
Western Hemisphere Northern View
Severe winter cold spells in eastern
U.S. do NOT invalidate Global
Warming! In fact, many are a consequence of it.
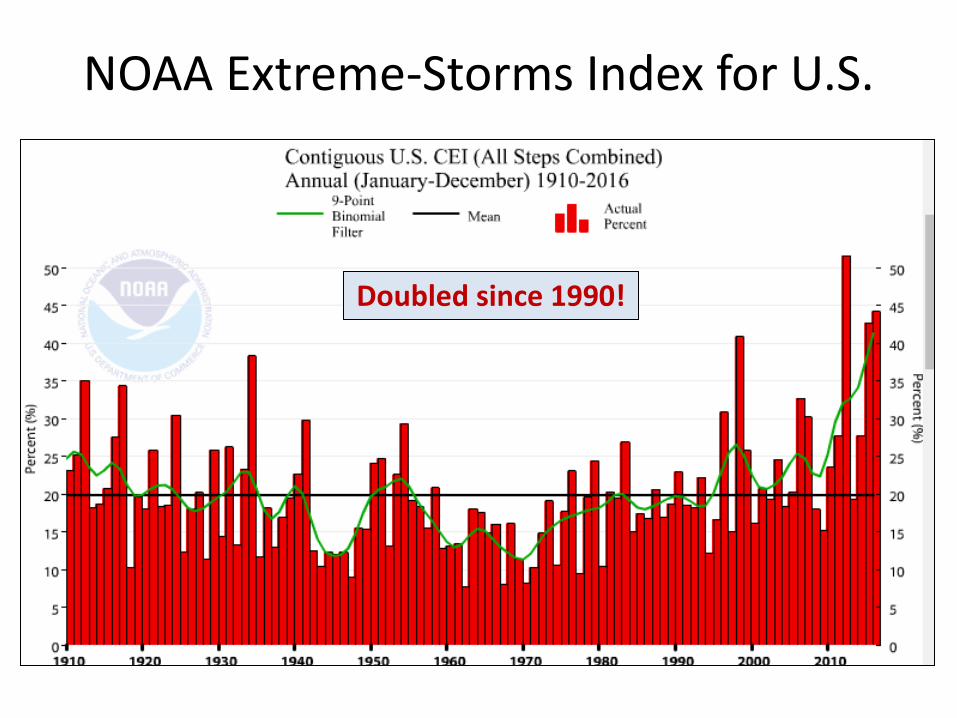
NOAA Extreme-Storms Index for U.S.
Doubled since 1990!
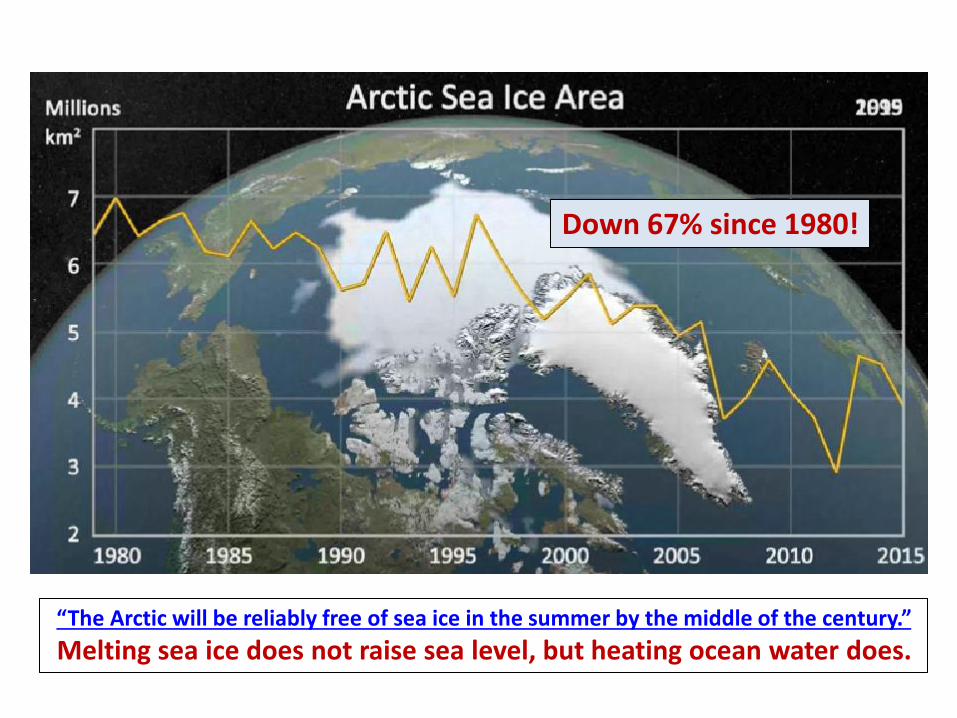
“The Arctic will be reliably free of sea ice in the summer by the middle of the century.”
Melting sea ice does not raise sea level, but heating ocean water does.
Down 67% since 1980!
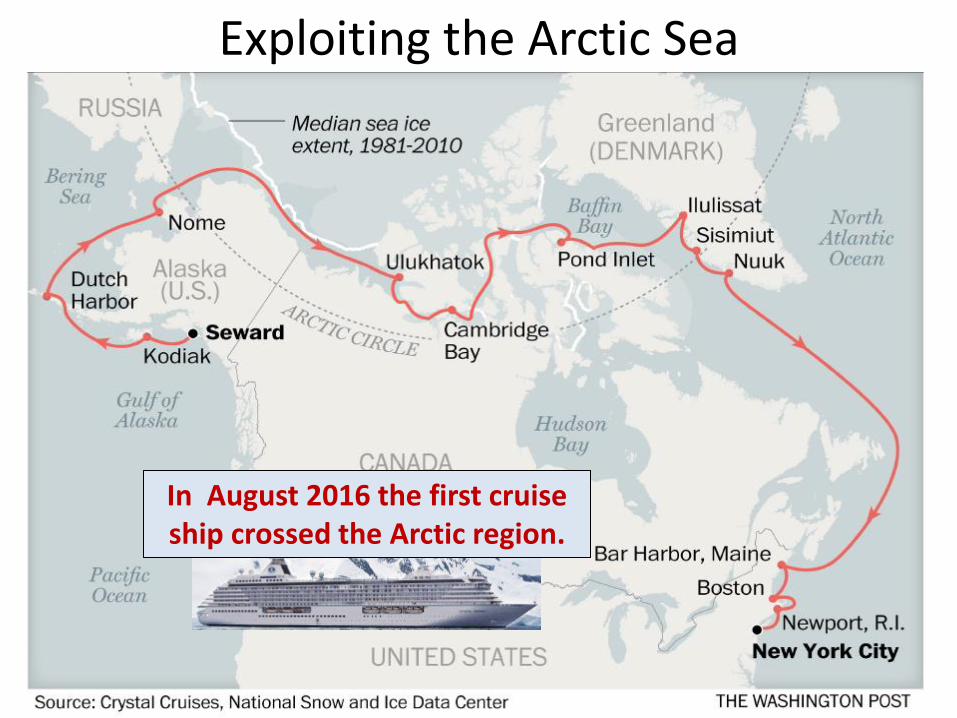
Exploiting the Arctic Sea
In August 2016 the first cruise ship crossed the Arctic region.
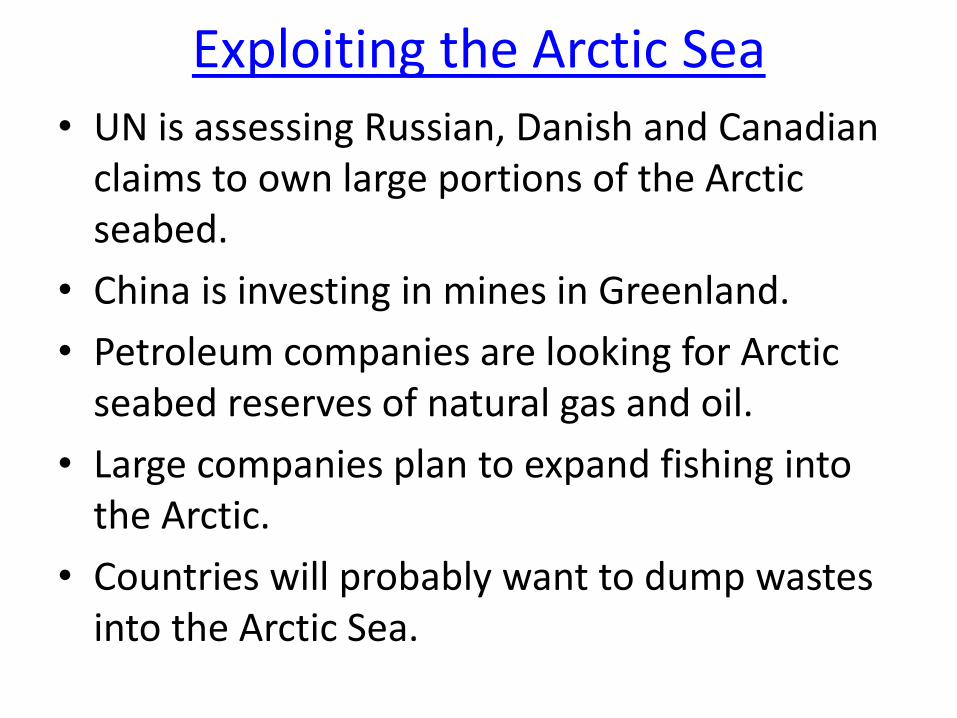
Exploiting the Arctic Sea • UN is assessing Russian, Danish and Canadian
claims to own large portions of the Arctic seabed.
• China is investing in mines in Greenland.
• Petroleum companies are looking for Arctic seabed reserves of natural gas and oil.
• Large companies plan to expand fishing into the Arctic.
• Countries will probably want to dump wastes into the Arctic Sea.
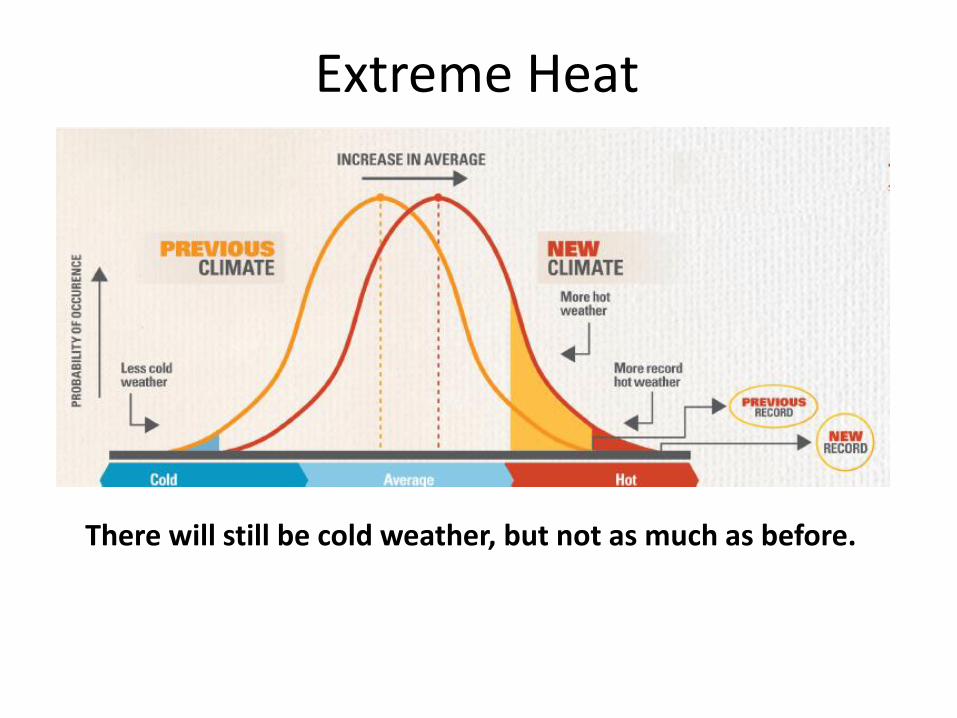
Extreme Heat
There will still be cold weather, but not as much as before.
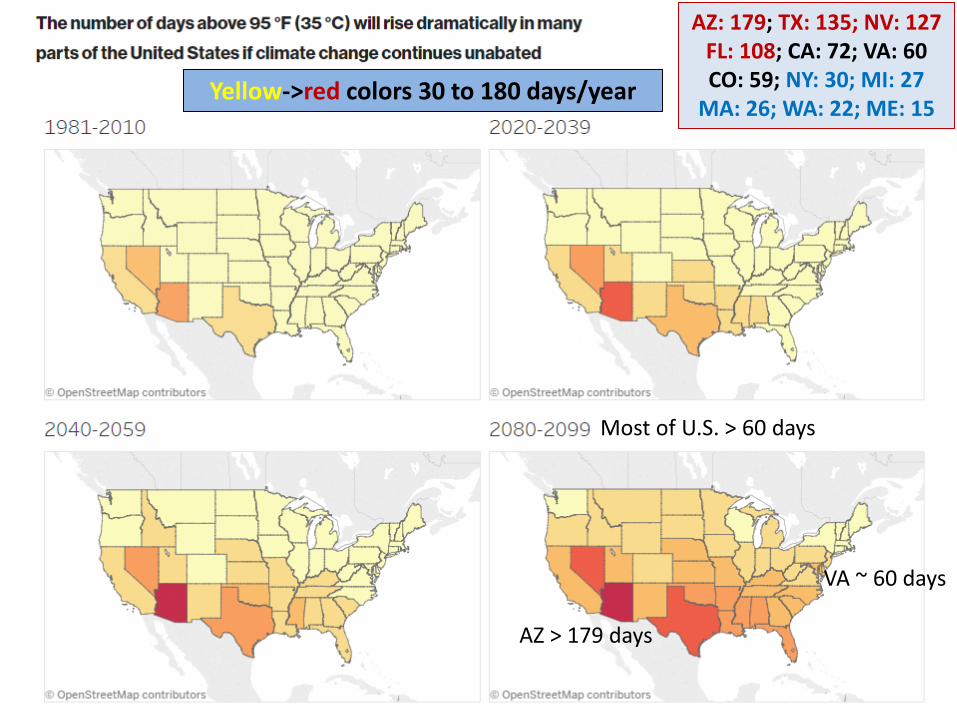
Yellow->red colors 30 to 180 days/year
Most of U.S. > 60 days
AZ > 179 days
VA ~ 60 days
AZ: 179; TX: 135; NV: 127 FL: 108; CA: 72; VA: 60 CO: 59; NY: 30; MI: 27
MA: 26; WA: 22; ME: 15
Droughts and Floods
• Higher temperatures evaporate more moisture into the atmosphere.
• Westerly winds (from the west) move the moisture from western U.S. to eastern U.S.
• The dry west gets dryer and the wet east gets wetter.
• Forest fires become more prevalent in the west because of lack of moisture.
• The rare large rains in the west cause floods because the trees and vegetation have burned to ashes.
• The increased rapid rainfall in the east causes more floods.
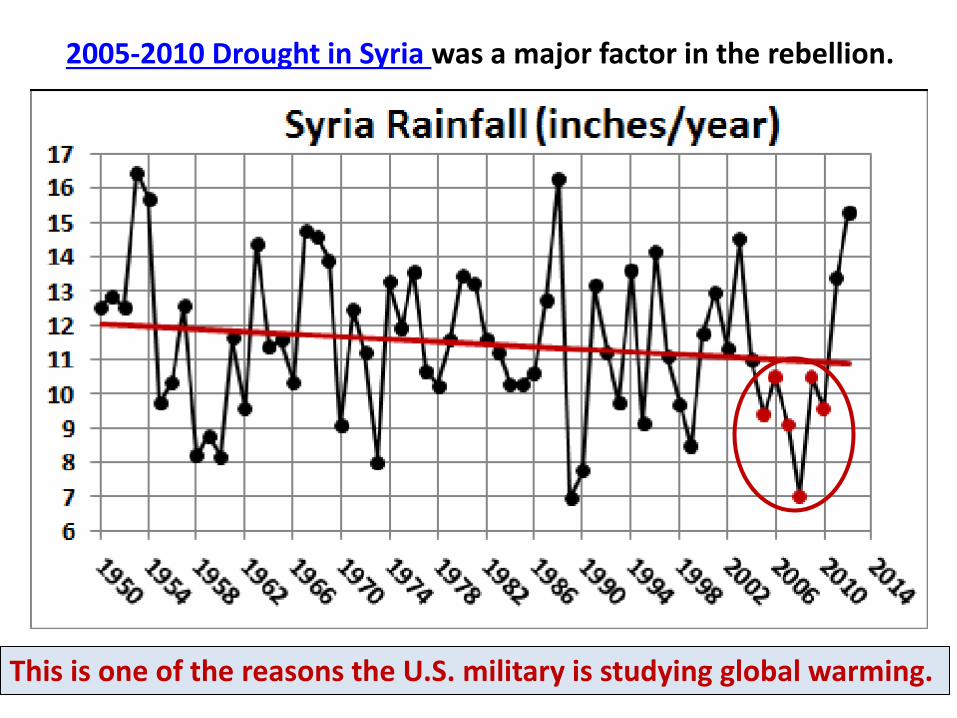
2005-2010 Drought in Syria was a major factor in the rebellion.
This is one of the reasons the U.S. military is studying global warming.
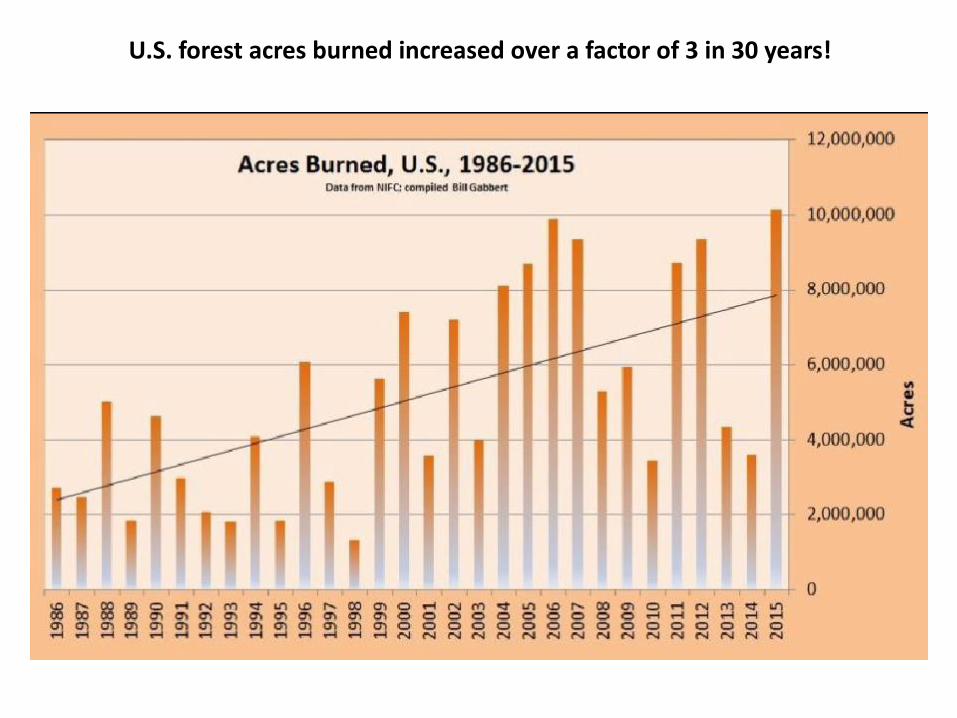
U.S. forest acres burned increased over a factor of 3 in 30 years!
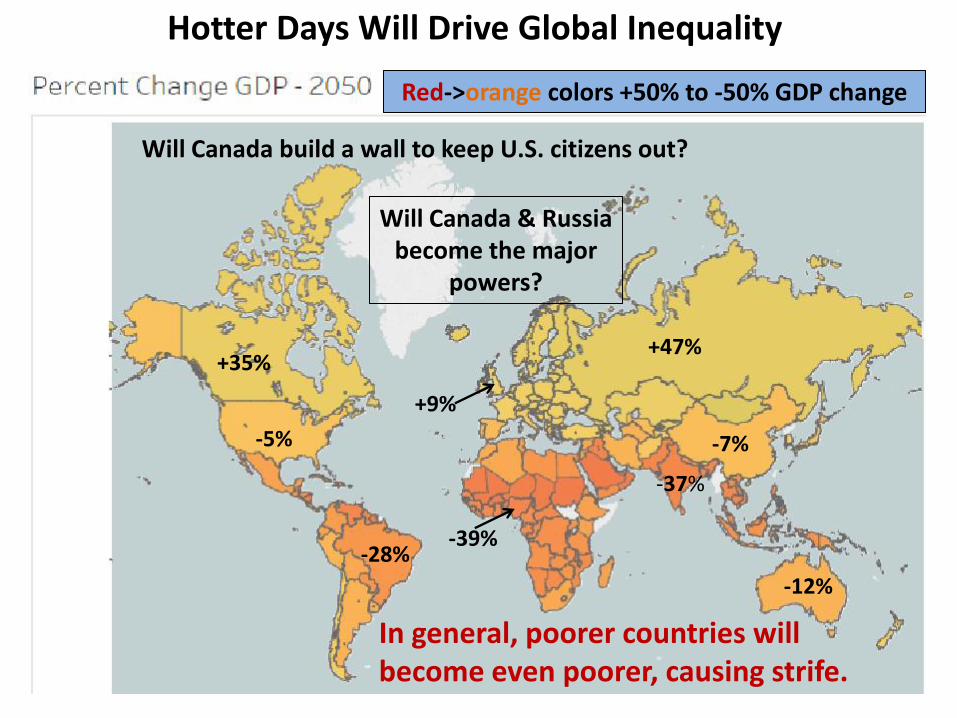
Red->orange colors +50% to -50% GDP change
-5%
+35%
-28%
+47%
-12%
-7%
-37%
+9%
-39%
Hotter Days Will Drive Global Inequality
Will Canada & Russia become the major
powers?
Will Canada build a wall to keep U.S. citizens out?
In general, poorer countries will become even poorer, causing strife.
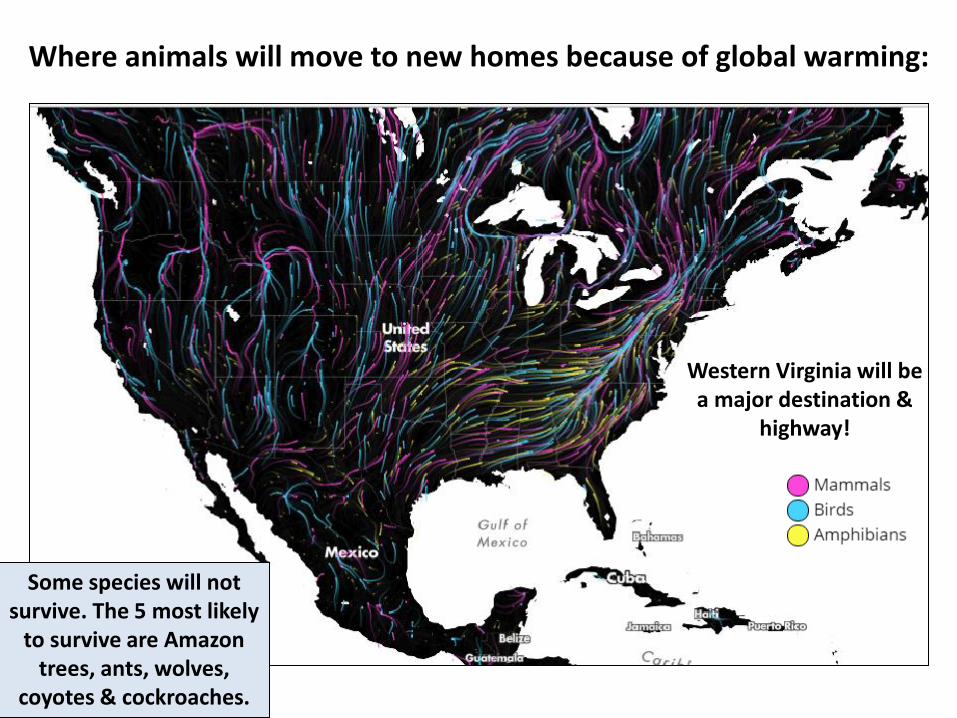
Where animals will move to new homes because of global warming:
Western Virginia will be a major destination &
highway!
Some species will not survive. The 5 most likely
to survive are Amazon trees, ants, wolves,
coyotes & cockroaches.
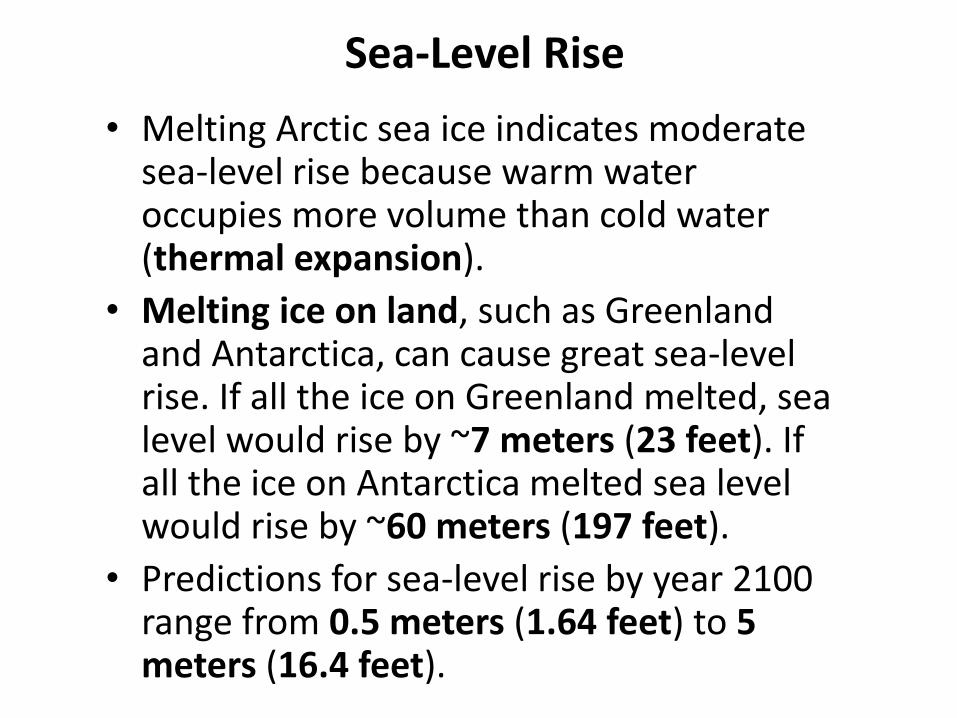
Sea-Level Rise
• Melting Arctic sea ice indicates moderate sea-level rise because warm water occupies more volume than cold water (thermal expansion).
• Melting ice on land, such as Greenland and Antarctica, can cause great sea-level rise. If all the ice on Greenland melted, sea level would rise by ~7 meters (23 feet). If all the ice on Antarctica melted sea level would rise by ~60 meters (197 feet).
• Predictions for sea-level rise by year 2100 range from 0.5 meters (1.64 feet) to 5 meters (16.4 feet).
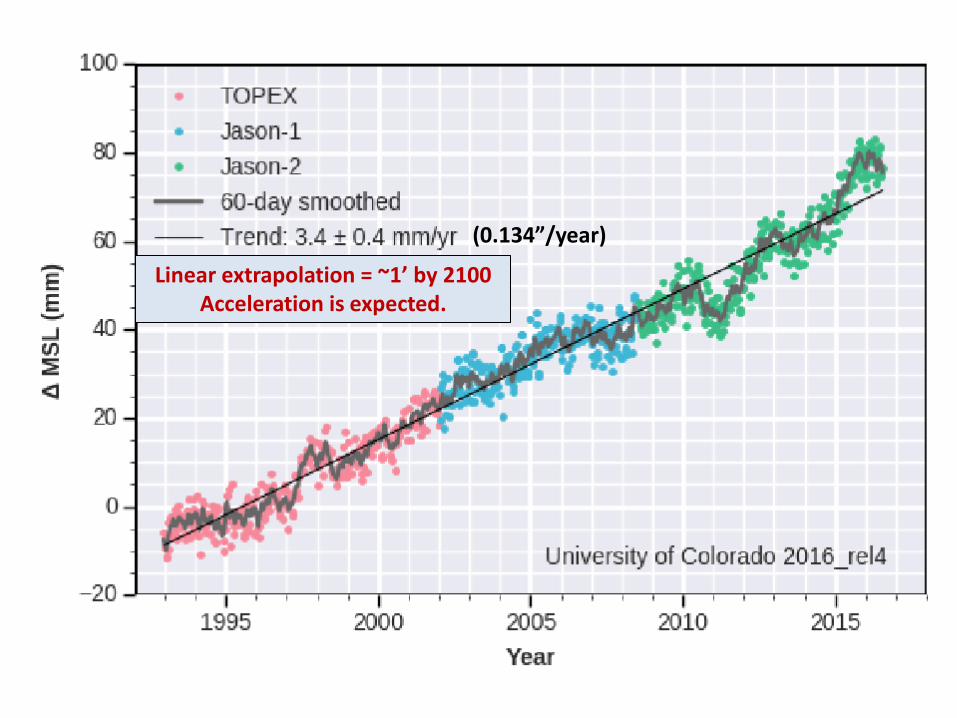
(0.134”/year)
Linear extrapolation = ~1’ by 2100 Acceleration is expected.
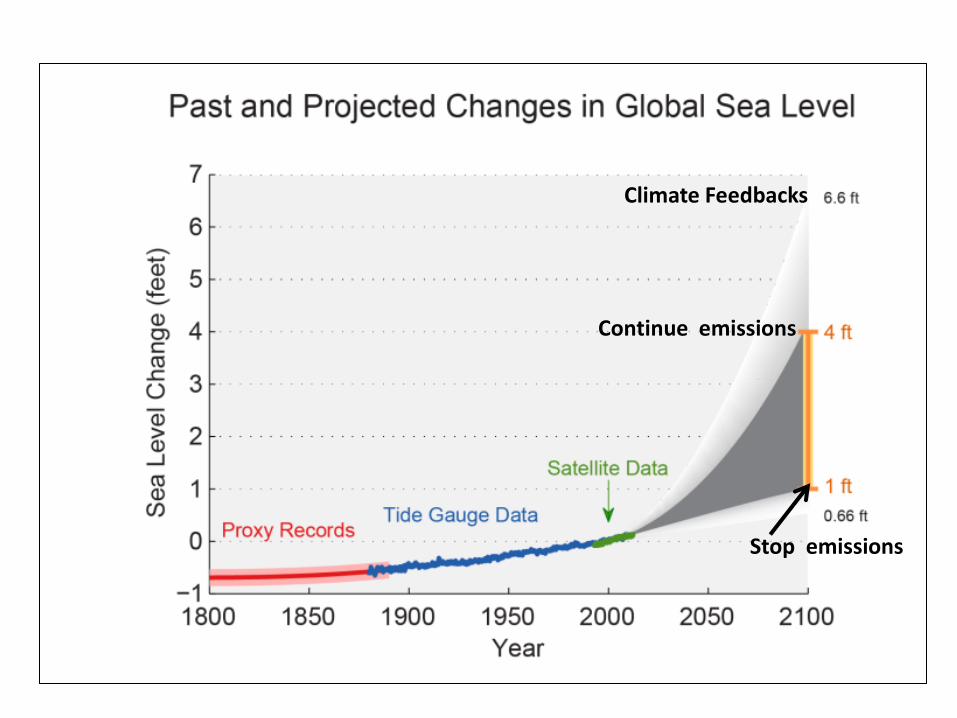
Continue emissions
Stop emissions
Climate Feedbacks
Continue emissions
Climate Feedbacks
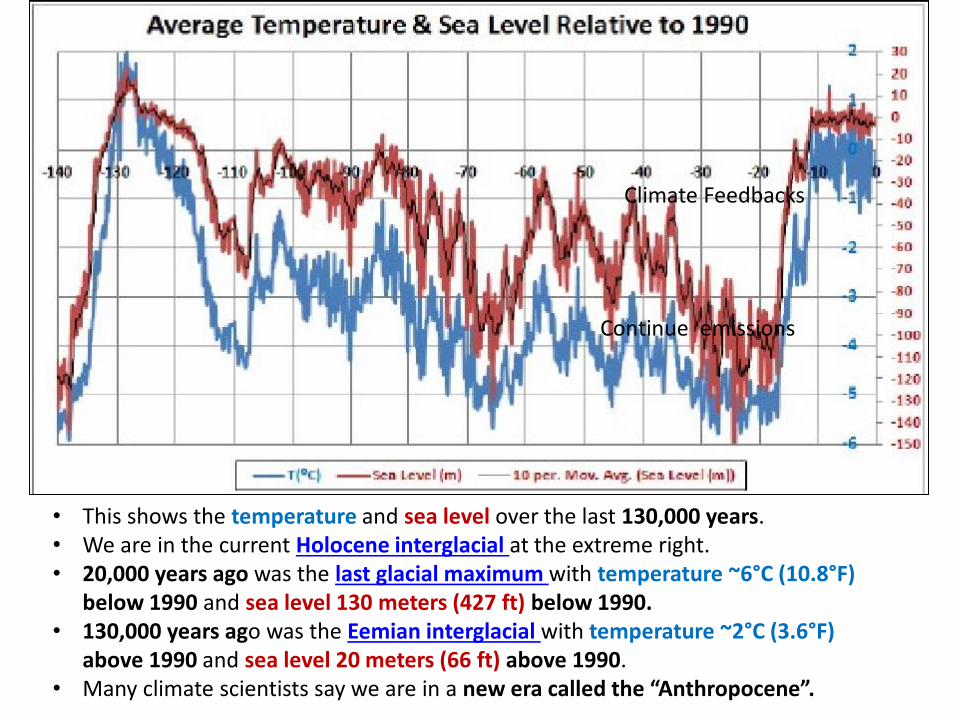
• This shows the temperature and sea level over the last 130,000 years. • We are in the current Holocene interglacial at the extreme right. • 20,000 years ago was the last glacial maximum with temperature ~6°C (10.8°F)
below 1990 and sea level 130 meters (427 ft) below 1990. • 130,000 years ago was the Eemian interglacial with temperature ~2°C (3.6°F)
above 1990 and sea level 20 meters (66 ft) above 1990. • Many climate scientists say we are in a new era called the “Anthropocene”.
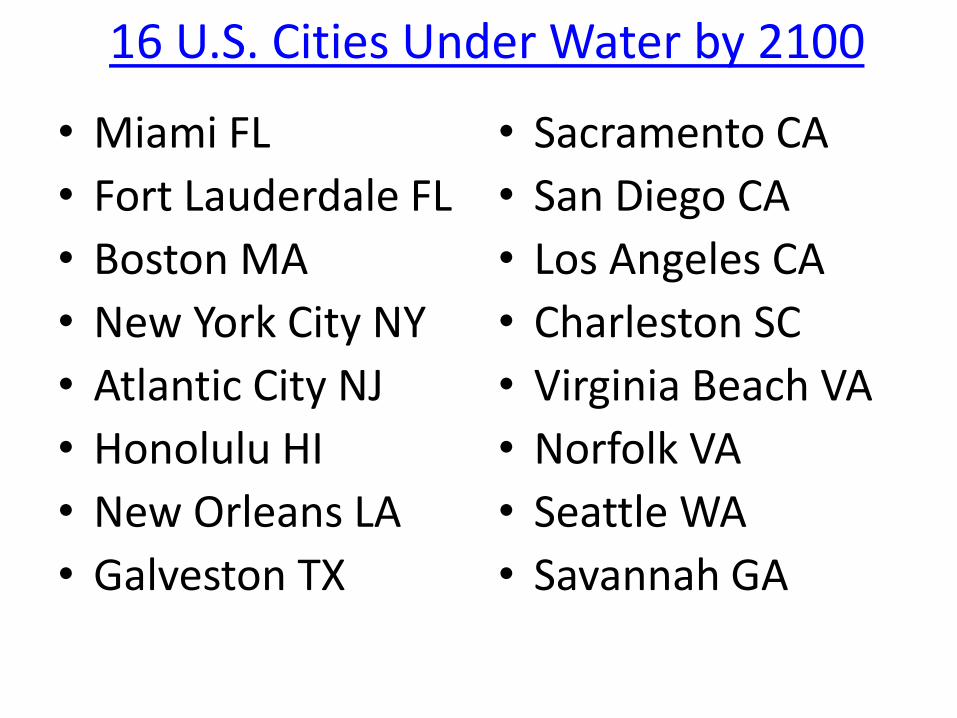
16 U.S. Cities Under Water by 2100
• Miami FL
• Fort Lauderdale FL
• Boston MA
• New York City NY
• Atlantic City NJ
• Honolulu HI
• New Orleans LA
• Galveston TX
• Sacramento CA
• San Diego CA
• Los Angeles CA
• Charleston SC
• Virginia Beach VA
• Norfolk VA
• Seattle WA
• Savannah GA
Global Warming and Insurance
• Rise in sea level will increase risk of storm surges.
• Extreme storms will have more high winds and tornados.
• Extreme storms will cause more floods.
• Insurance companies plan to increase rates to keep their profits up as disasters increase.
• Insurance companies are promoting storm-resistant buildings and clean and efficient uses of energy.
• Global warming could bankrupt the insurance industry.
Global Warming Effects on Oceans • 20%-40% of CO2 emitted into the atmosphere is
dissolved in the oceans. • This lowers the pH of the oceans making them more
acidic. ~30% decrease since Industrial Revolution began.
• CO2 in oceans prevents production of calcium carbonate to form shells for shelled sea life. Sea water must be saturated with carbonate ions for shells to form and remain intact.
• CO2 threatens the food chains in the oceans because shelled sea life occurs at many links in the chains.
• Coral bleaching destroys species that live on them. • Fish migrate toward the poles disrupting fisheries.
Triggering Rapid Climate Change
• Drastic rapid climate events have occurred in the past.
• Climatology is not yet able to predict which and when drastic rapid events will be triggered.
• Rapid melting of ice on Greenland and Antarctica can cause rapid sea-level rise.
• One possible trigger event that may be underway is rapid massive release of the powerful GHG methane in the Arctic and on the continental shelves, which greatly accelerates global warming.
Mitigating Global Warming
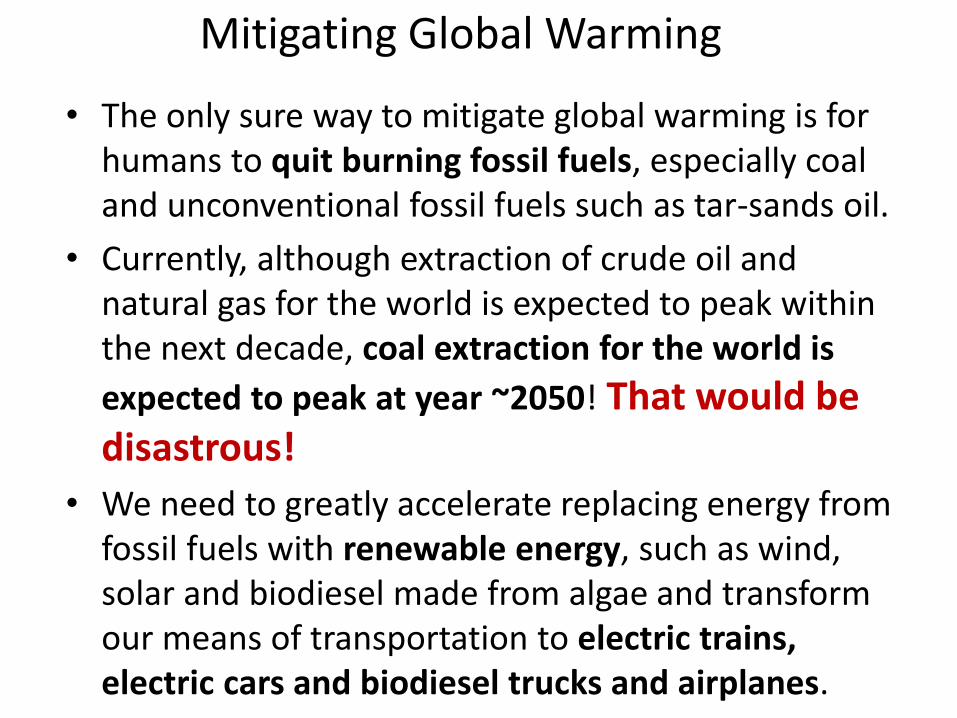
• The only sure way to mitigate global warming is for humans to quit burning fossil fuels, especially coal and unconventional fossil fuels such as tar-sands oil.
• Currently, although extraction of crude oil and natural gas for the world is expected to peak within the next decade, coal extraction for the world is
expected to peak at year ~2050! That would be disastrous!
• We need to greatly accelerate replacing energy from fossil fuels with renewable energy, such as wind, solar and biodiesel made from algae and transform our means of transportation to electric trains, electric cars and biodiesel trucks and airplanes.
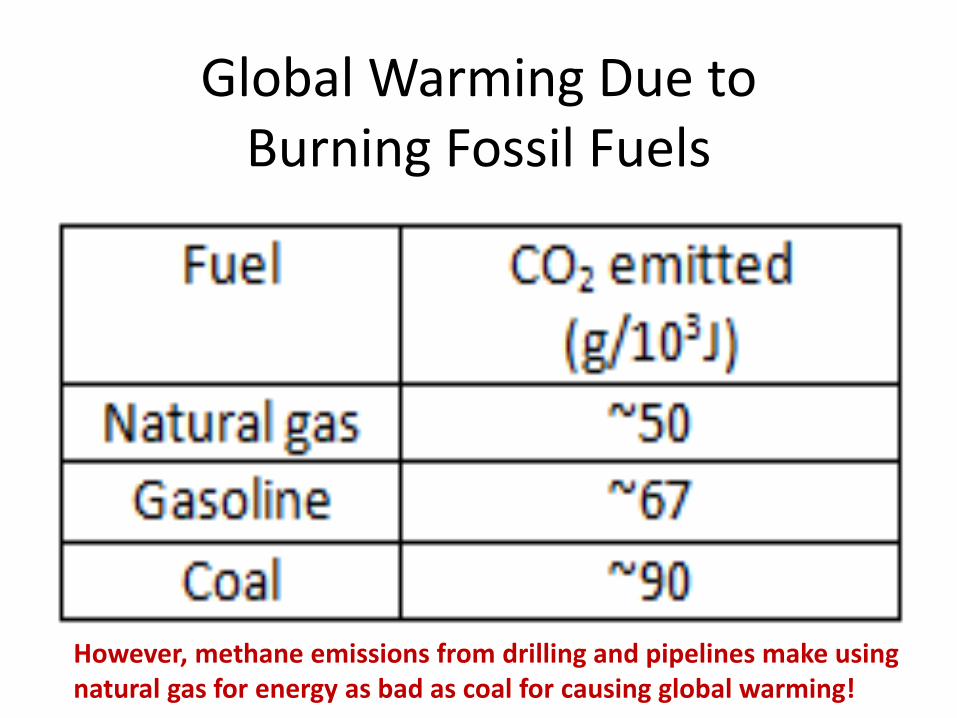
Global Warming Due to Burning Fossil Fuels
However, methane emissions from drilling and pipelines make using natural gas for energy as bad as coal for causing global warming!
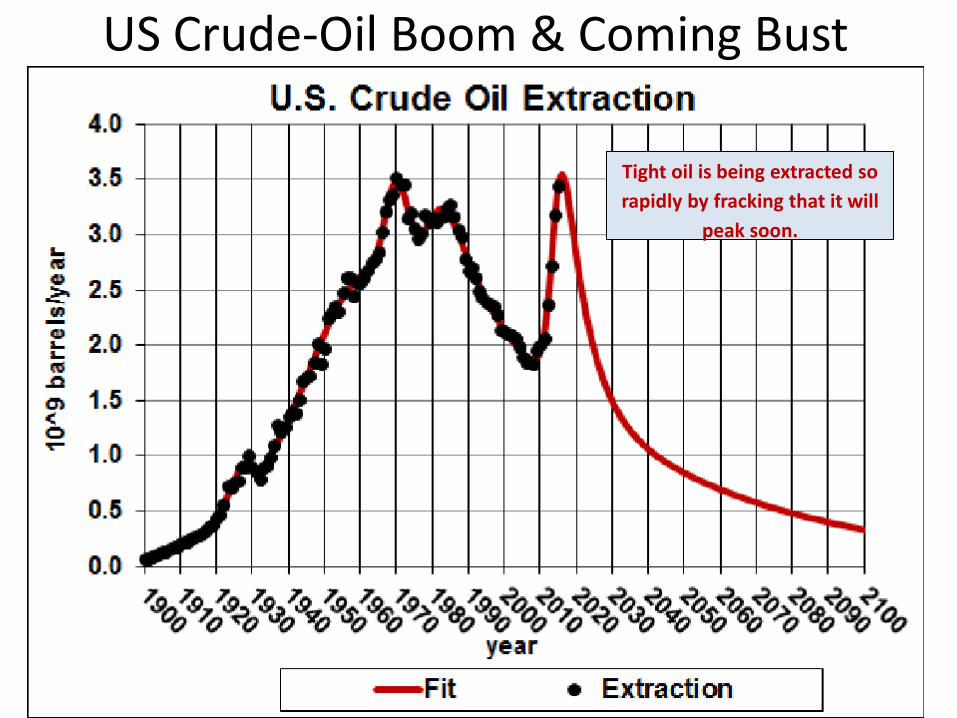
US Crude-Oil Boom & Coming Bust
Tight oil is being extracted so
rapidly by fracking that it will
peak soon.
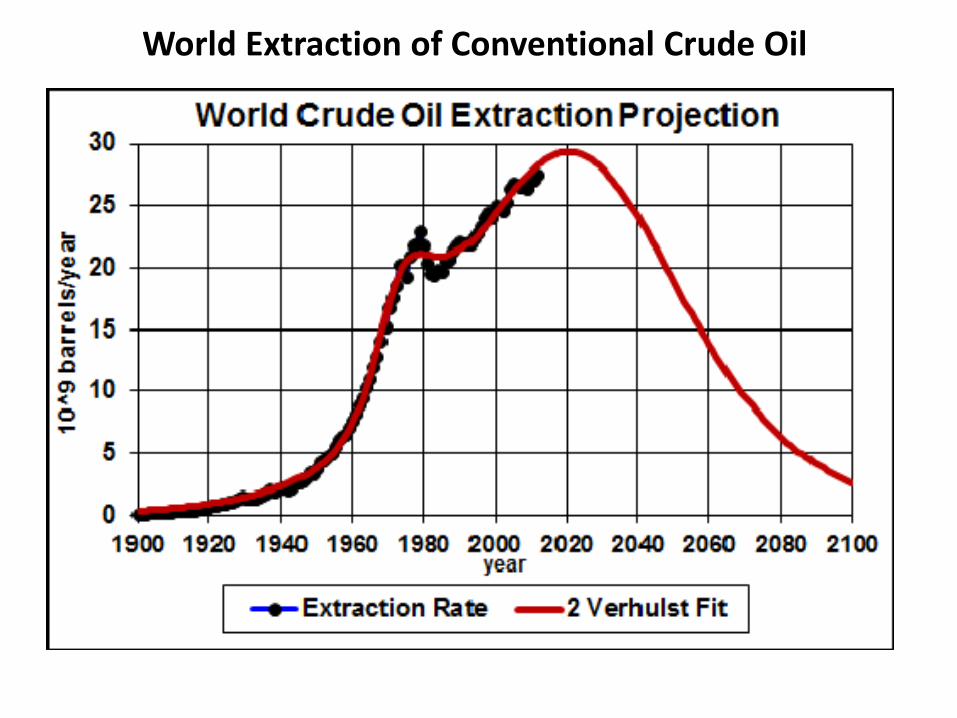
World Extraction of Conventional Crude Oil
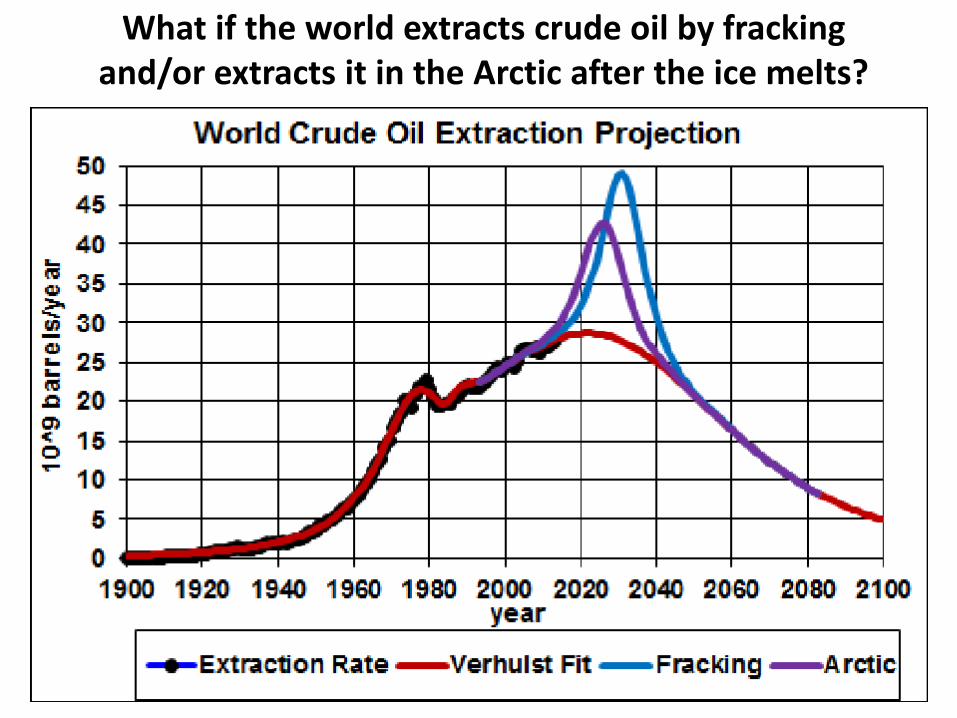
What if the world extracts crude oil by fracking and/or extracts it in the Arctic after the ice melts?
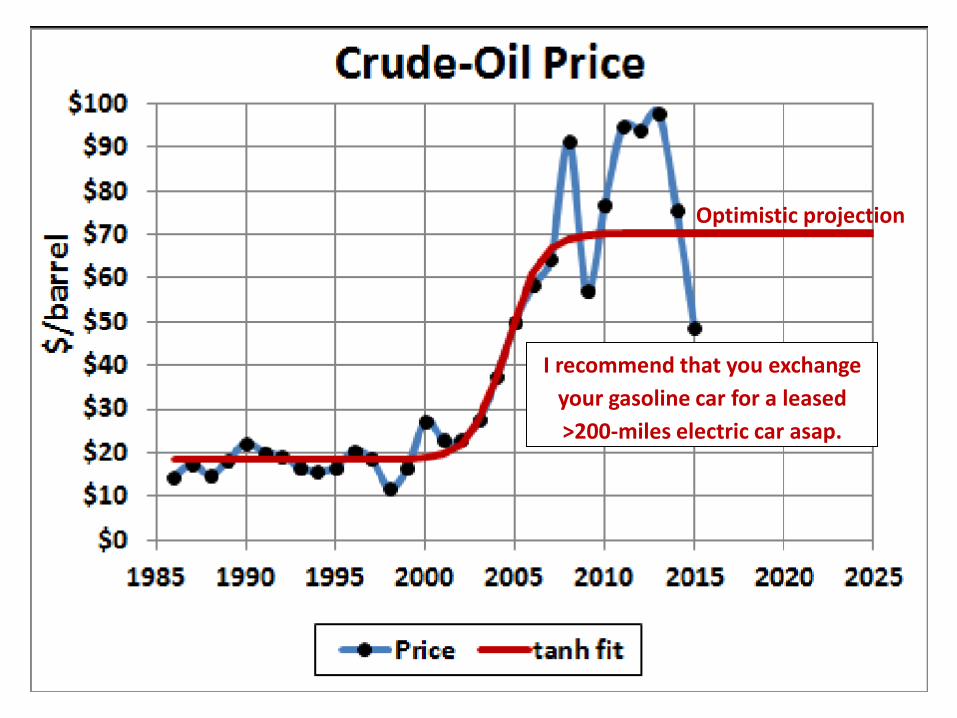
I recommend that you exchange
your gasoline car for a leased
>200-miles electric car asap.
Optimistic projection
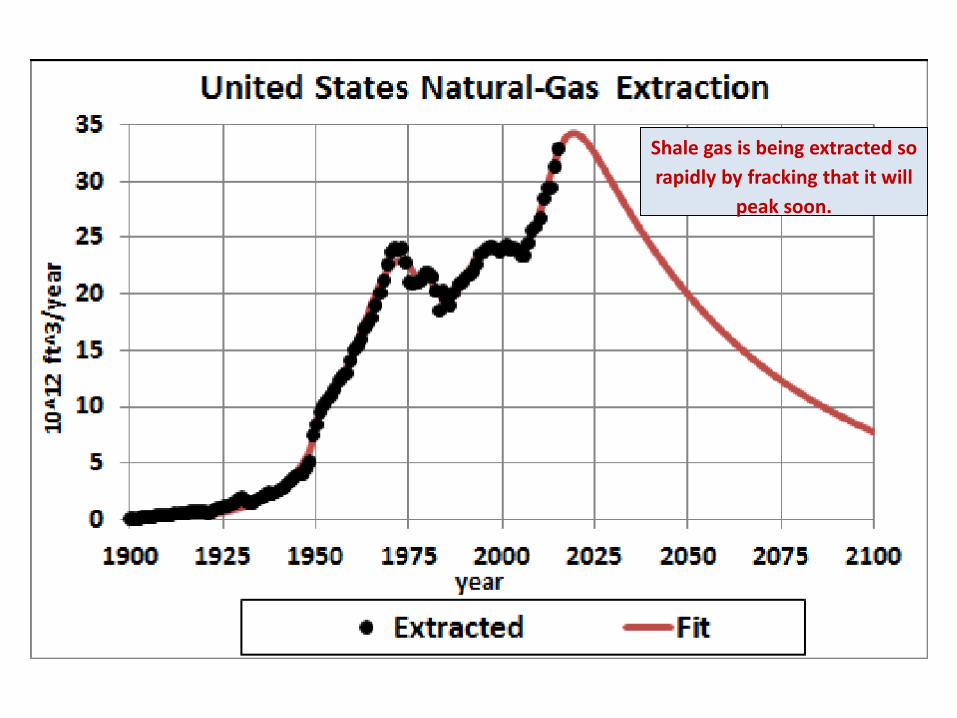
Shale gas is being extracted so
rapidly by fracking that it will
peak soon.
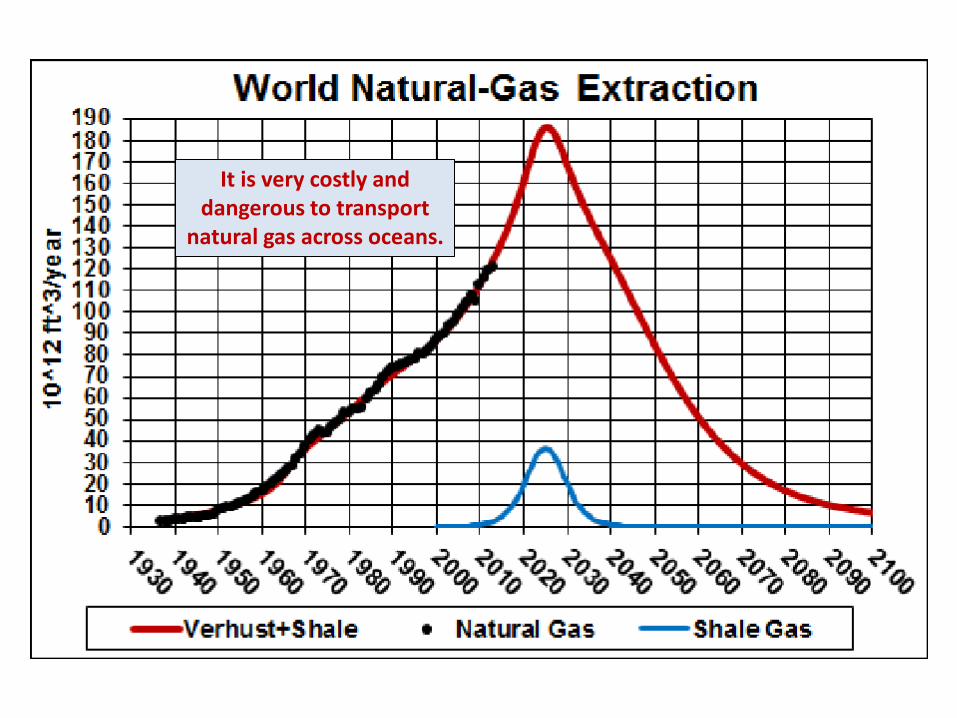
It is very costly and dangerous to transport
natural gas across oceans.
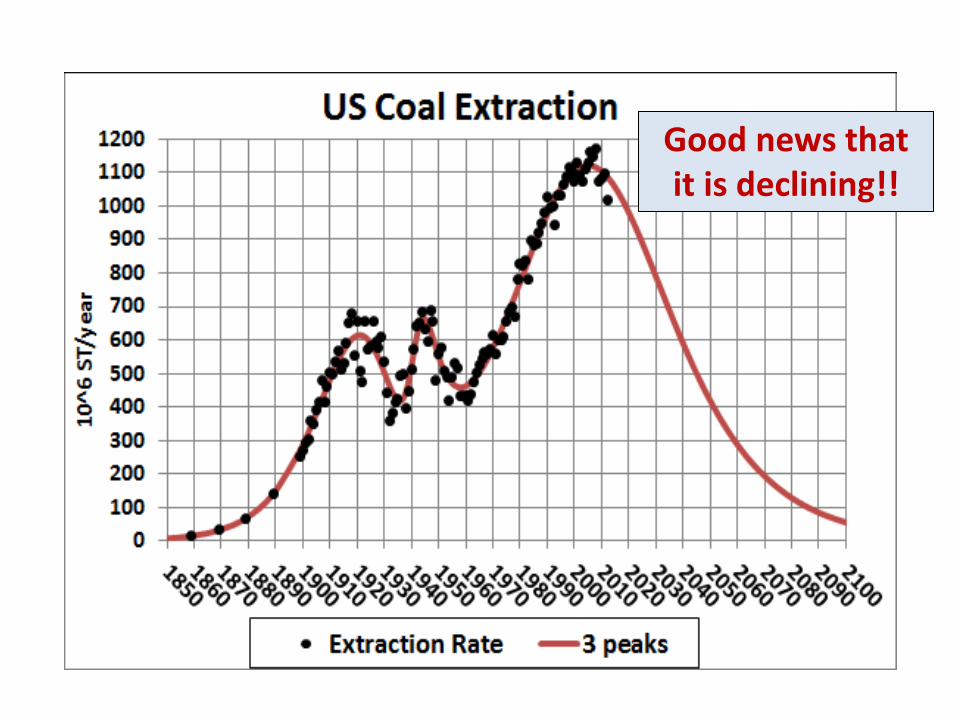
Good news that it is declining!!
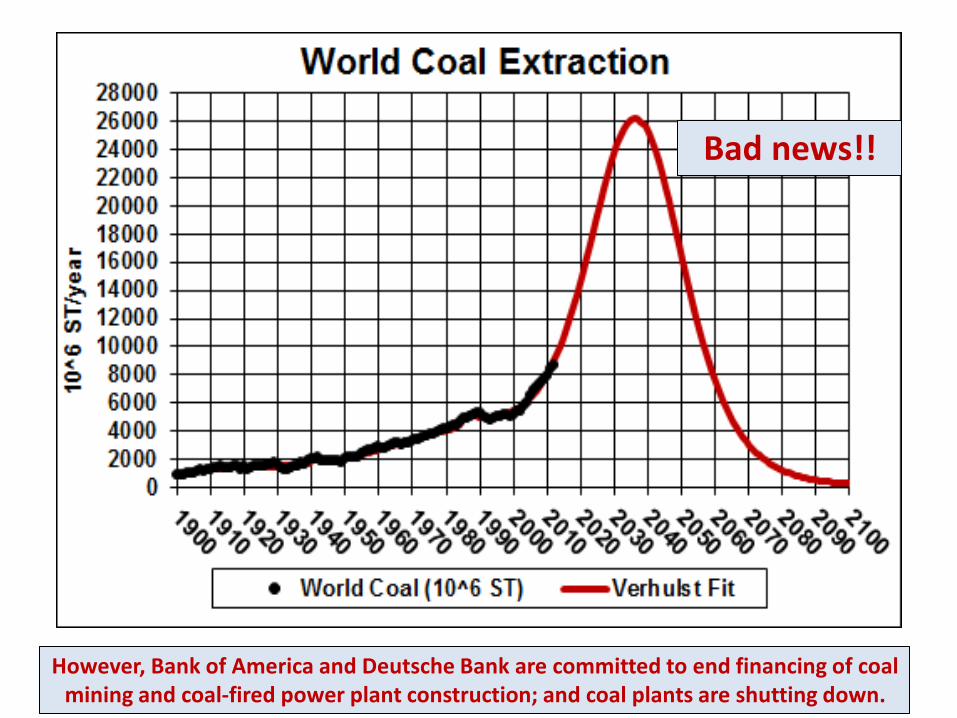
Bad news!!
However, Bank of America and Deutsche Bank are committed to end financing of coal mining and coal-fired power plant construction; and coal plants are shutting down.
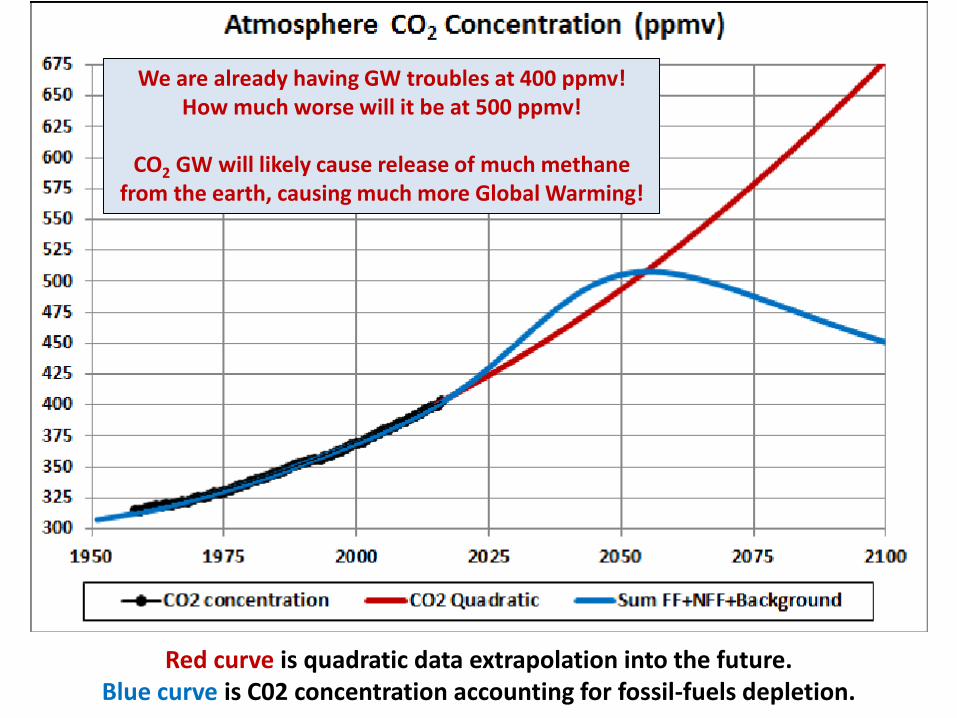
Red curve is quadratic data extrapolation into the future. Blue curve is C02 concentration accounting for fossil-fuels depletion.
We are already having GW troubles at 400 ppmv! How much worse will it be at 500 ppmv!
CO2 GW will likely cause release of much methane
from the earth, causing much more Global Warming!
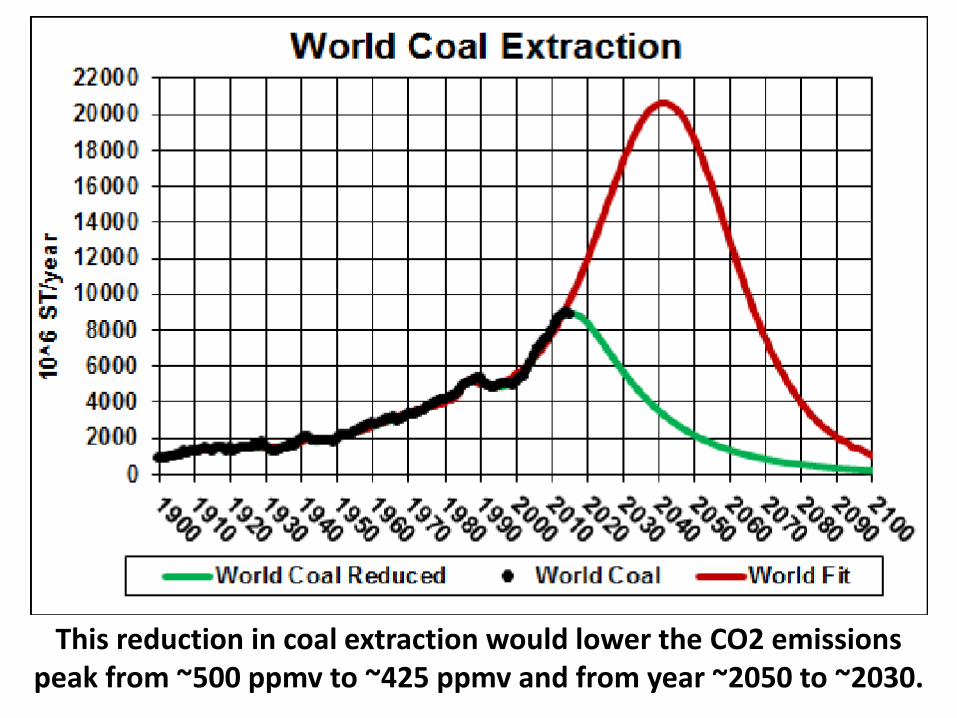
This reduction in coal extraction would lower the CO2 emissions peak from ~500 ppmv to ~425 ppmv and from year ~2050 to ~2030.
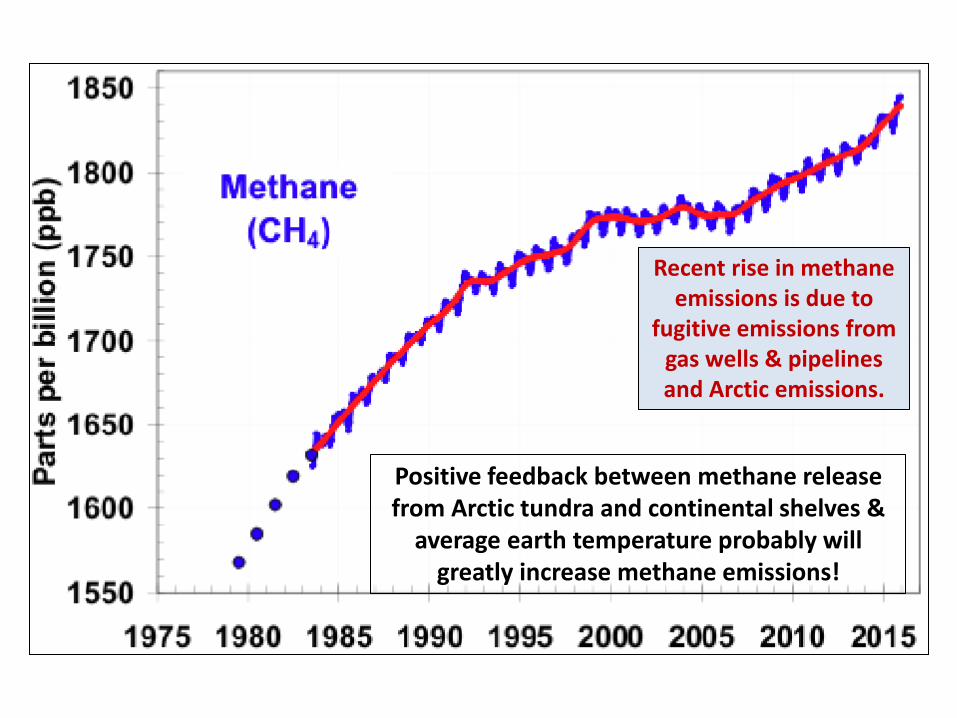
Recent rise in methane emissions is due to
fugitive emissions from gas wells & pipelines and Arctic emissions.
Positive feedback between methane release from Arctic tundra and continental shelves &
average earth temperature probably will greatly increase methane emissions!
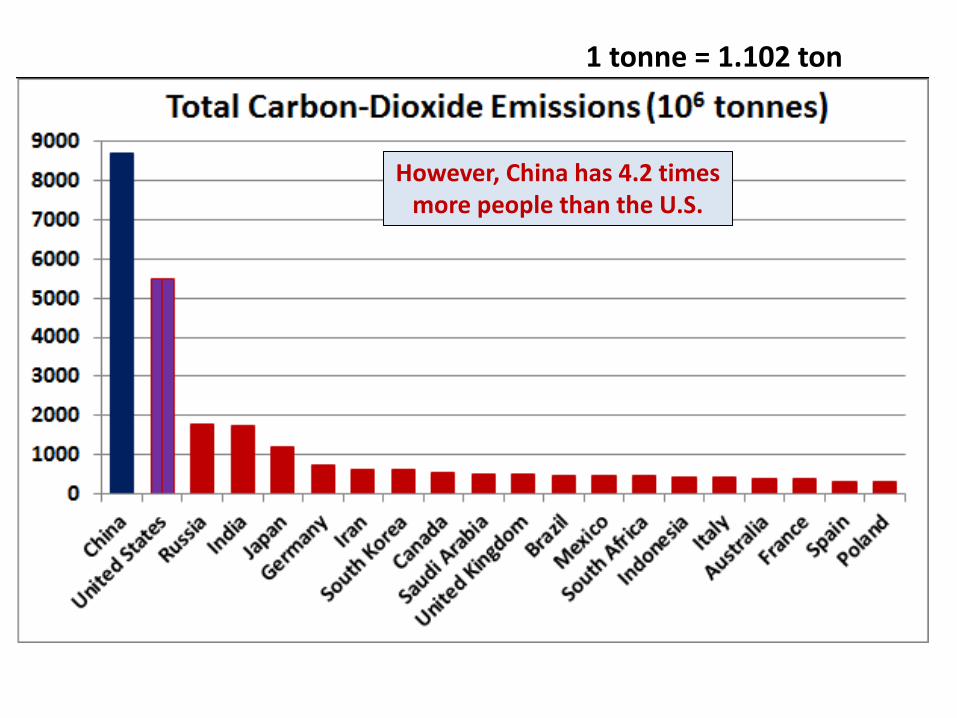
However, China has 4.2 times more people than the U.S.
1 tonne = 1.102 ton
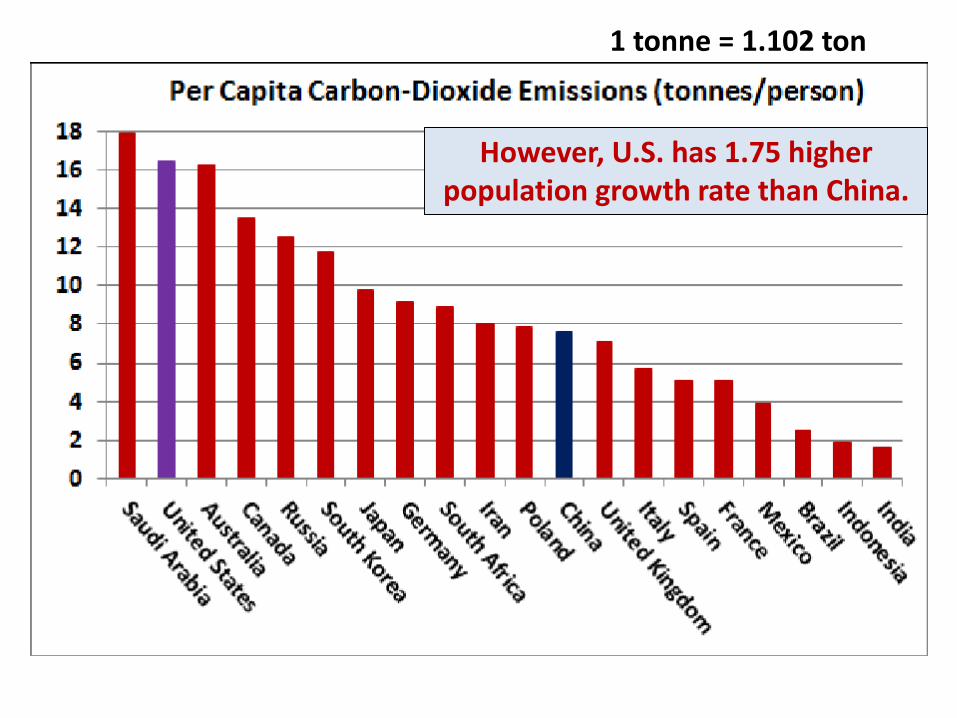
1 tonne = 1.102 ton
However, U.S. has 1.75 higher population growth rate than China.
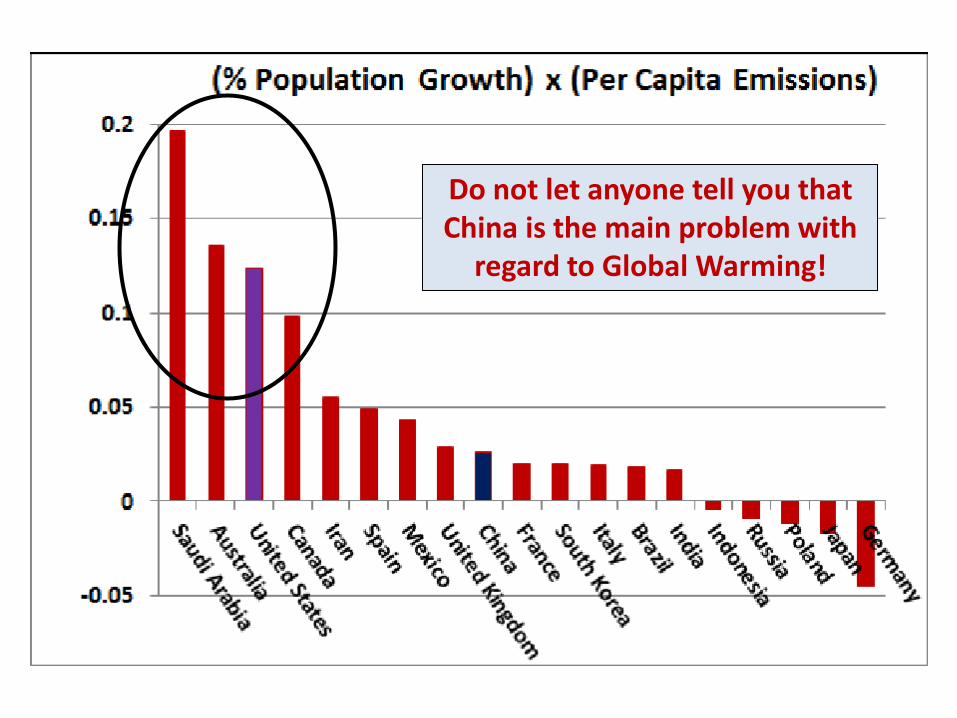
Do not let anyone tell you that China is the main problem with
regard to Global Warming!
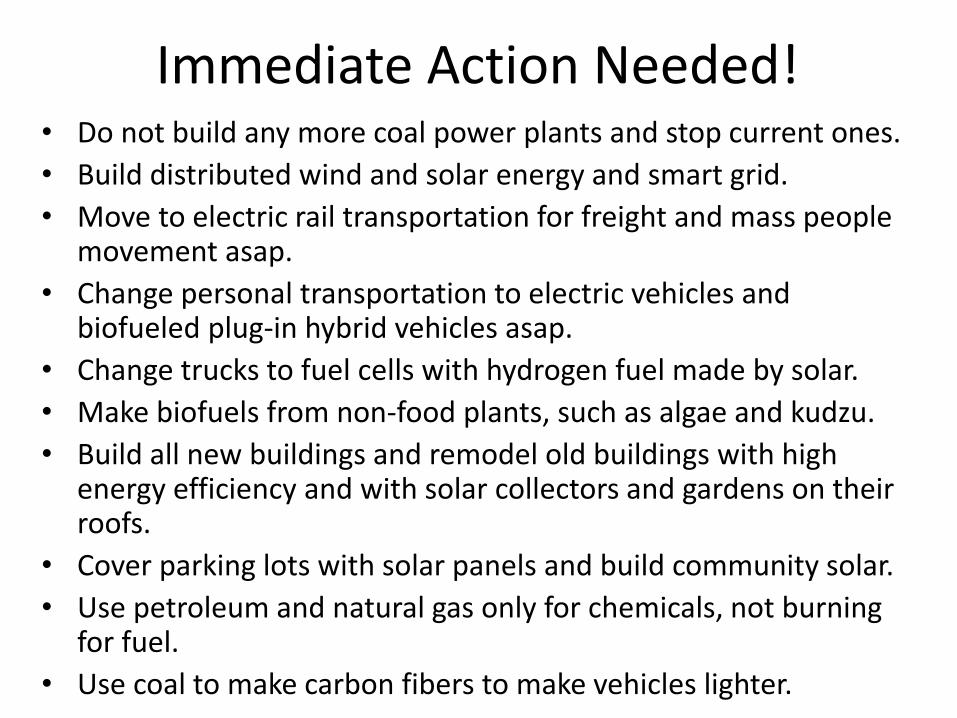
Immediate Action Needed! • Do not build any more coal power plants and stop current ones.
• Build distributed wind and solar energy and smart grid.
• Move to electric rail transportation for freight and mass people movement asap.
• Change personal transportation to electric vehicles and biofueled plug-in hybrid vehicles asap.
• Change trucks to fuel cells with hydrogen fuel made by solar.
• Make biofuels from non-food plants, such as algae and kudzu.
• Build all new buildings and remodel old buildings with high energy efficiency and with solar collectors and gardens on their roofs.
• Cover parking lots with solar panels and build community solar.
• Use petroleum and natural gas only for chemicals, not burning for fuel.
• Use coal to make carbon fibers to make vehicles lighter.
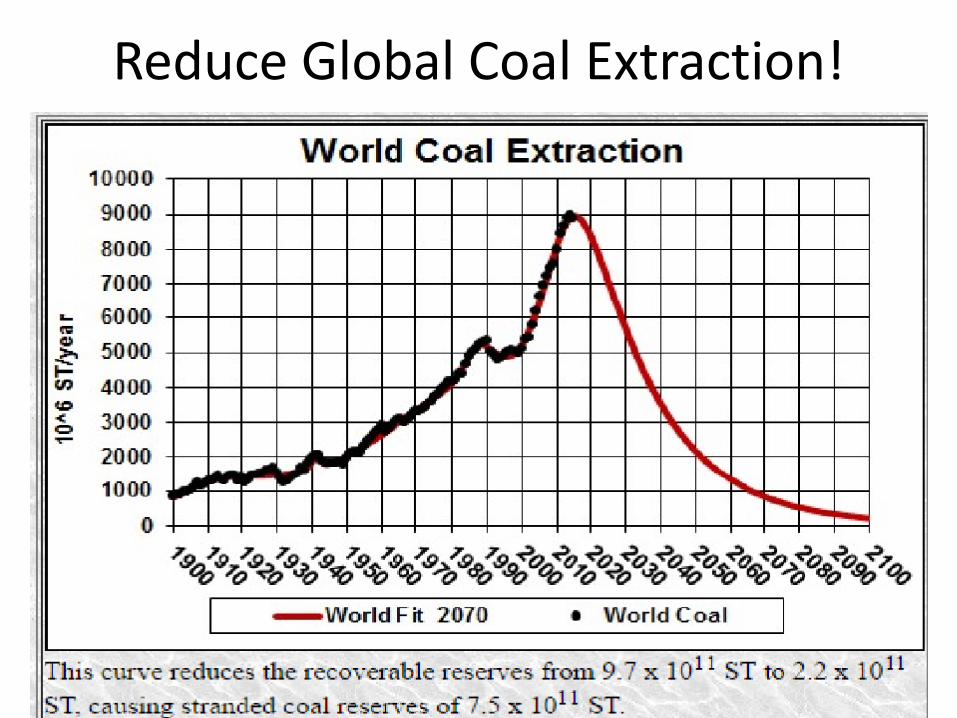
Reduce Global Coal Extraction!
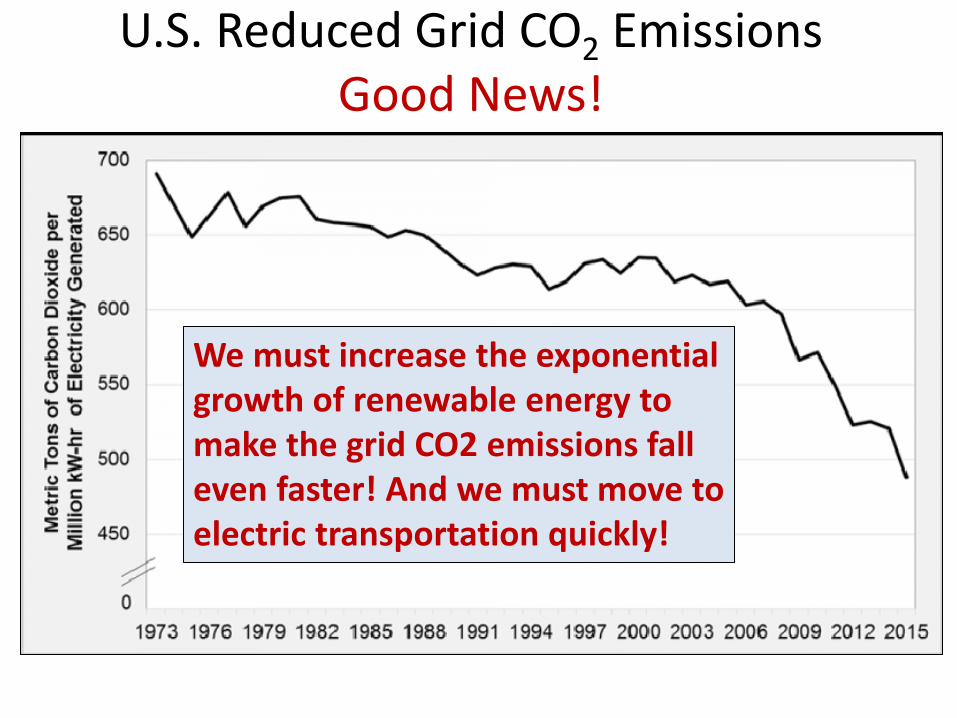
U.S. Reduced Grid CO2 Emissions Good News!
We must increase the exponential growth of renewable energy to make the grid CO2 emissions fall even faster! And we must move to electric transportation quickly!
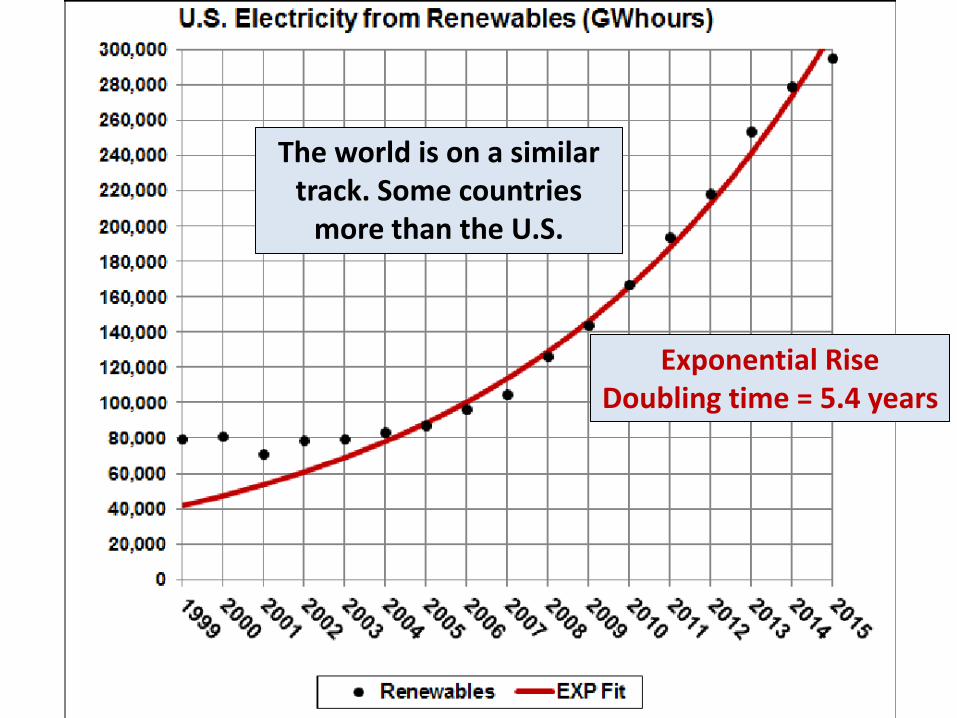
Exponential Rise
The world is on a similar track. Some countries
more than the U.S.
Exponential Rise Doubling time = 5.4 years
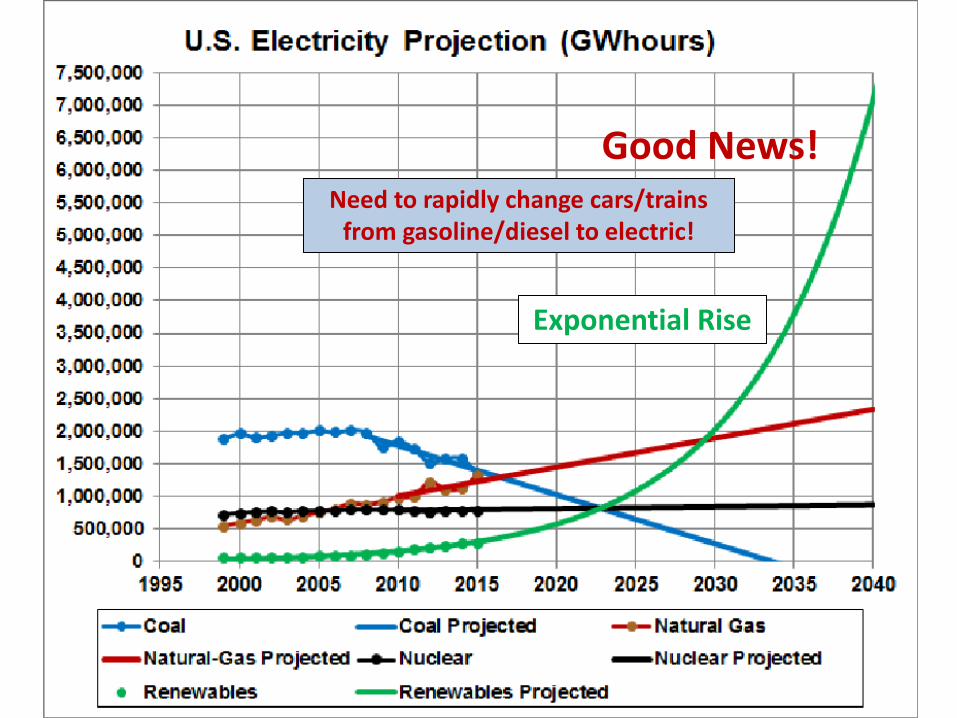
Need to rapidly change cars/trains from gasoline/diesel to electric!
Good News!
Exponential Rise
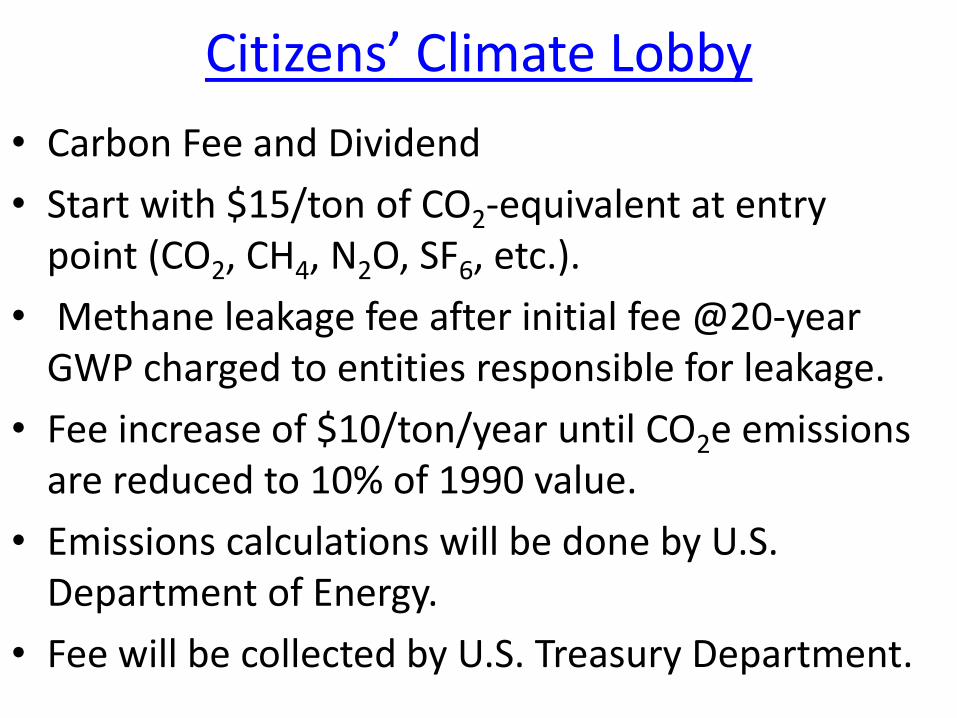
Citizens’ Climate Lobby
• Carbon Fee and Dividend
• Start with $15/ton of CO2-equivalent at entry point (CO2, CH4, N2O, SF6, etc.).
• Methane leakage fee after initial fee @20-year GWP charged to entities responsible for leakage.
• Fee increase of $10/ton/year until CO2e emissions are reduced to 10% of 1990 value.
• Emissions calculations will be done by U.S. Department of Energy.
• Fee will be collected by U.S. Treasury Department.
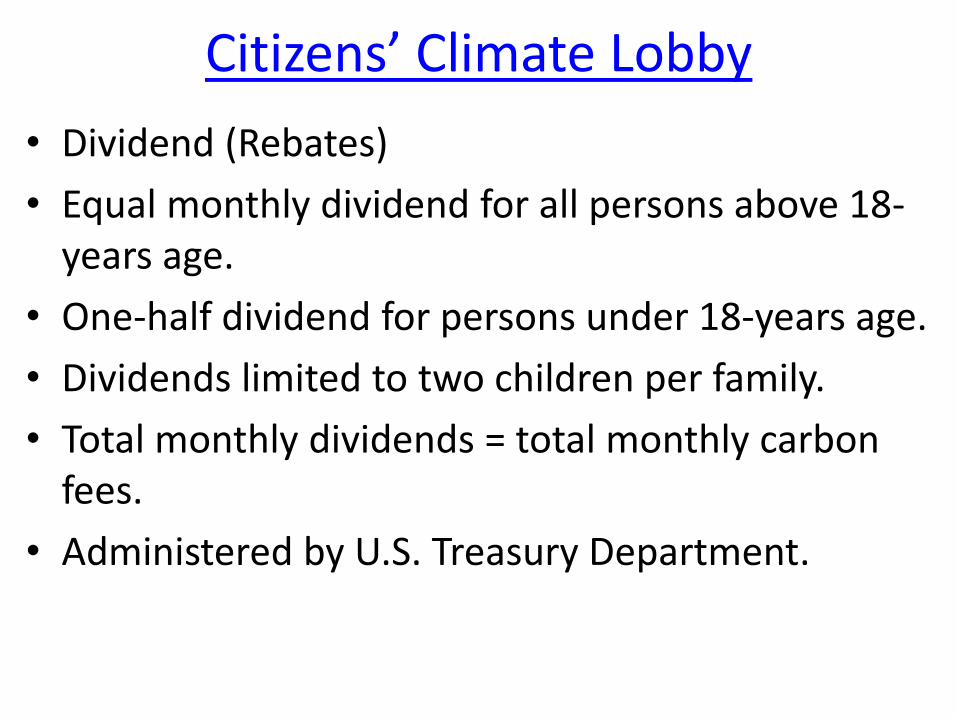
Citizens’ Climate Lobby
• Dividend (Rebates)
• Equal monthly dividend for all persons above 18-years age.
• One-half dividend for persons under 18-years age.
• Dividends limited to two children per family.
• Total monthly dividends = total monthly carbon fees.
• Administered by U.S. Treasury Department.
Citizens’ Climate Lobby
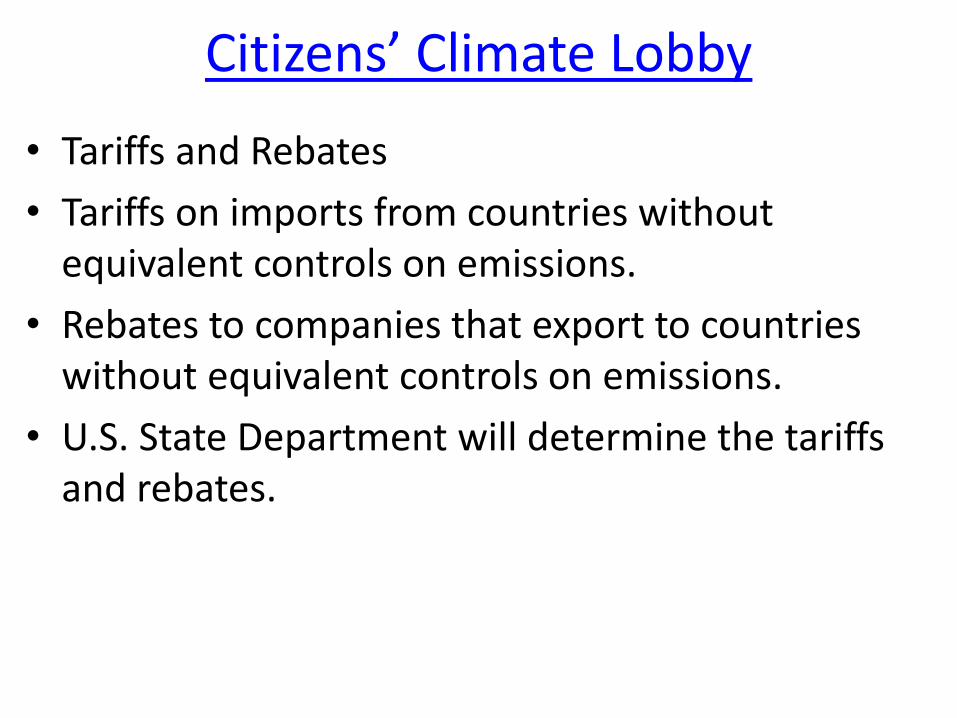
• Tariffs and Rebates
• Tariffs on imports from countries without equivalent controls on emissions.
• Rebates to companies that export to countries without equivalent controls on emissions.
• U.S. State Department will determine the tariffs and rebates.
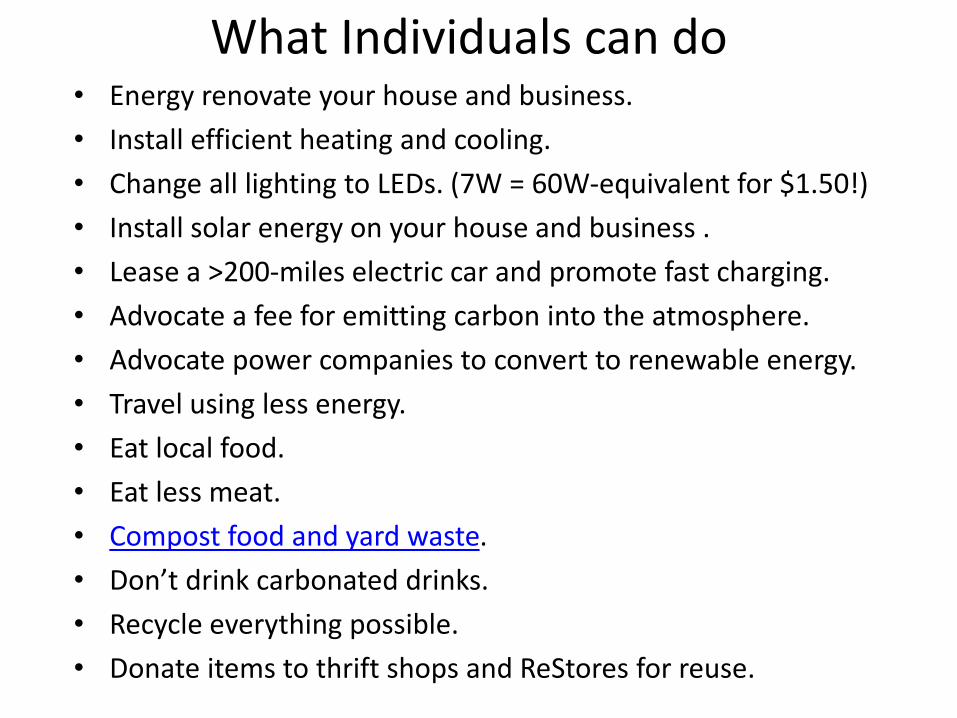
What Individuals can do • Energy renovate your house and business.
• Install efficient heating and cooling.
• Change all lighting to LEDs. (7W = 60W-equivalent for $1.50!)
• Install solar energy on your house and business .
• Lease a >200-miles electric car and promote fast charging.
• Advocate a fee for emitting carbon into the atmosphere.
• Advocate power companies to convert to renewable energy.
• Travel using less energy.
• Eat local food.
• Eat less meat.
• Compost food and yard waste.
• Don’t drink carbonated drinks.
• Recycle everything possible.
• Donate items to thrift shops and ReStores for reuse.
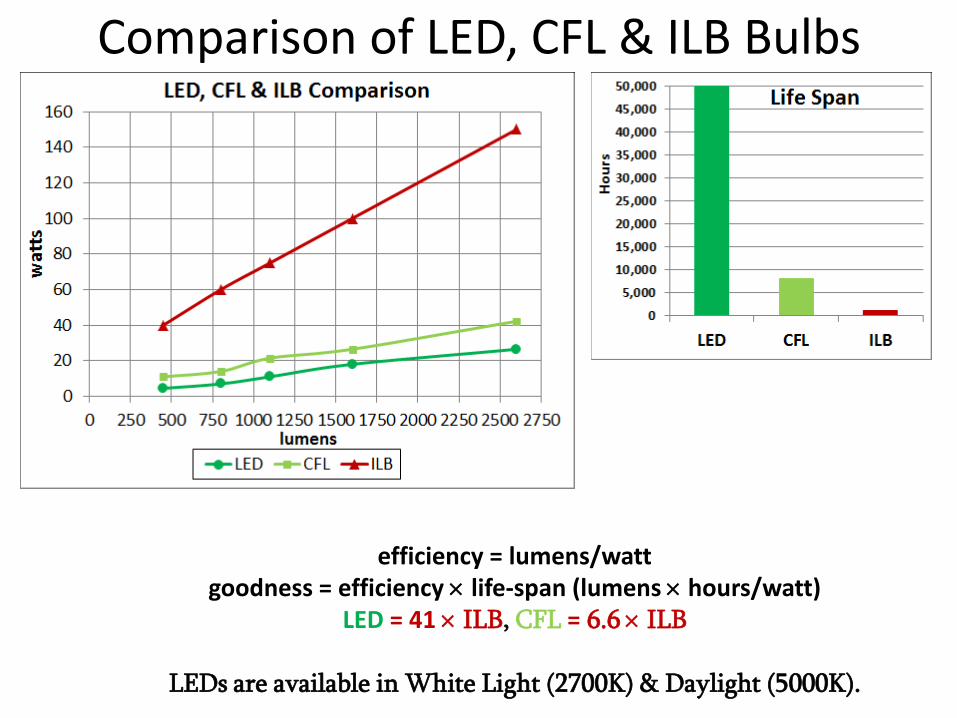
Comparison of LED, CFL & ILB Bulbs
efficiency = lumens/watt goodness = efficiency life-span (lumens hours/watt)
LED = 41 ILB, CFL = 6.6 ILB
LEDs are available in White Light (2700K) & Daylight (5000K).
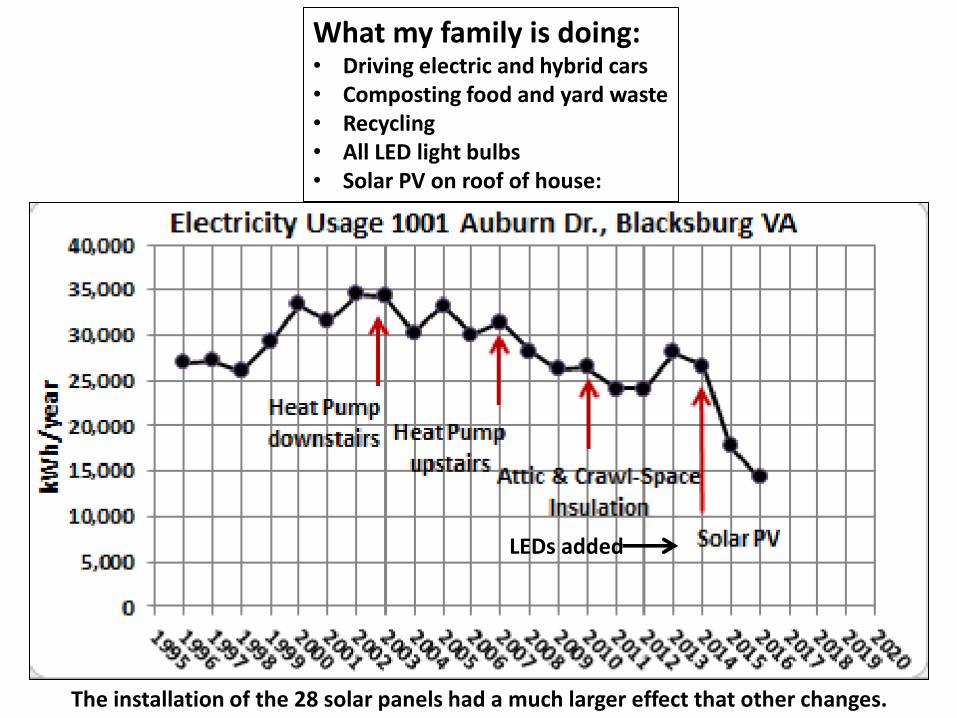
The installation of the 28 solar panels had a much larger effect that other changes.
What my family is doing: • Driving electric and hybrid cars • Composting food and yard waste • Recycling • All LED light bulbs • Solar PV on roof of house:
LEDs added
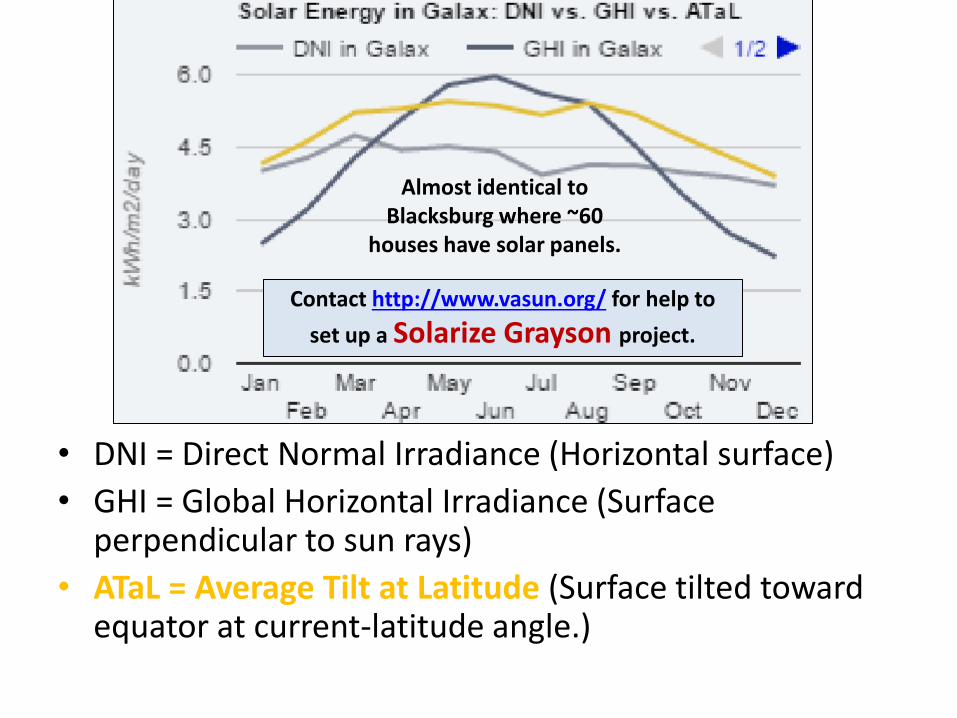
• DNI = Direct Normal Irradiance (Horizontal surface)
• GHI = Global Horizontal Irradiance (Surface perpendicular to sun rays)
• ATaL = Average Tilt at Latitude (Surface tilted toward equator at current-latitude angle.)
Contact http://www.vasun.org/ for help to
set up a Solarize Grayson project.
Almost identical to Blacksburg where ~60
houses have solar panels.
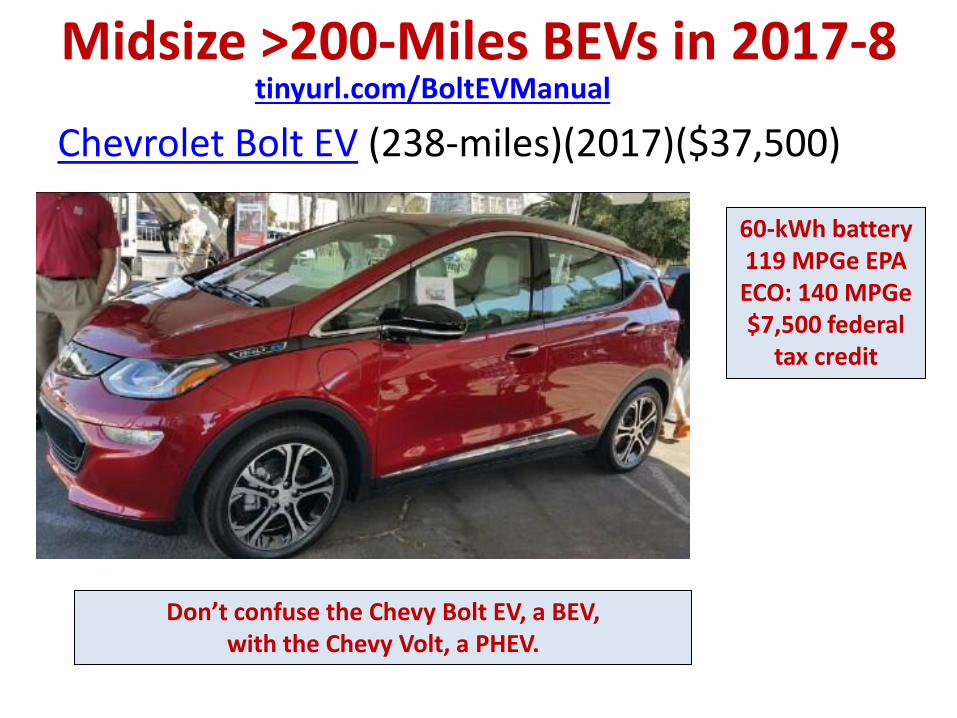
Midsize >200-Miles BEVs in 2017-8
Chevrolet Bolt EV (238-miles)(2017)($37,500)
60-kWh battery 119 MPGe EPA ECO: 140 MPGe $7,500 federal
tax credit
Don’t confuse the Chevy Bolt EV, a BEV, with the Chevy Volt, a PHEV.
tinyurl.com/BoltEVManual
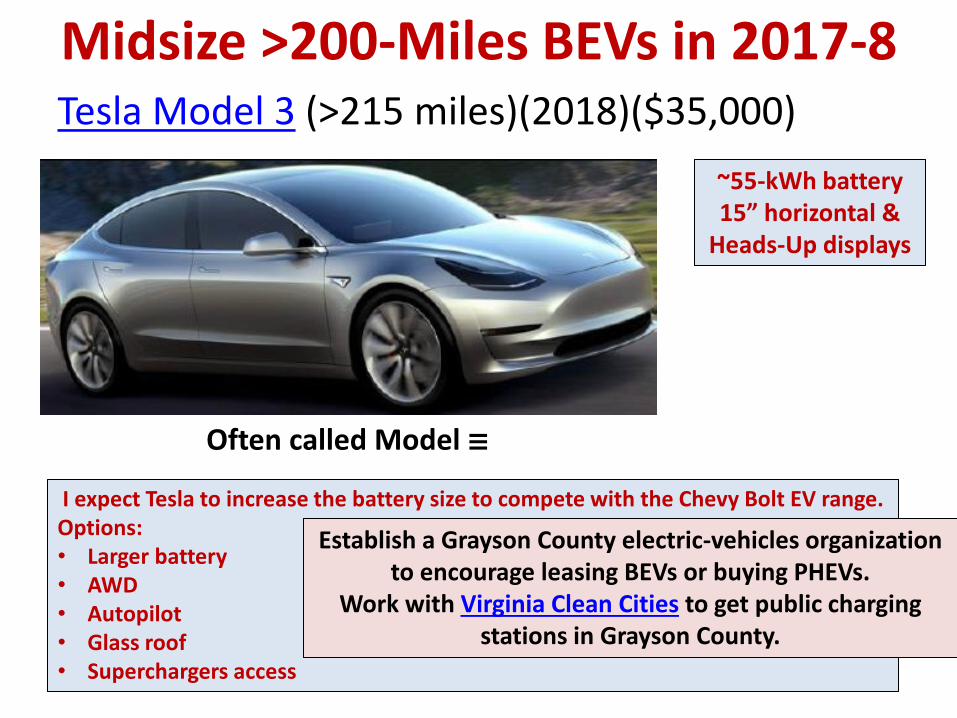
Midsize >200-Miles BEVs in 2017-8 Tesla Model 3 (>215 miles)(2018)($35,000)
~55-kWh battery 15” horizontal &
Heads-Up displays
Often called Model
I expect Tesla to increase the battery size to compete with the Chevy Bolt EV range. Options: • Larger battery • AWD • Autopilot • Glass roof • Superchargers access
Establish a Grayson County electric-vehicles organization to encourage leasing BEVs or buying PHEVs.
Work with Virginia Clean Cities to get public charging stations in Grayson County.
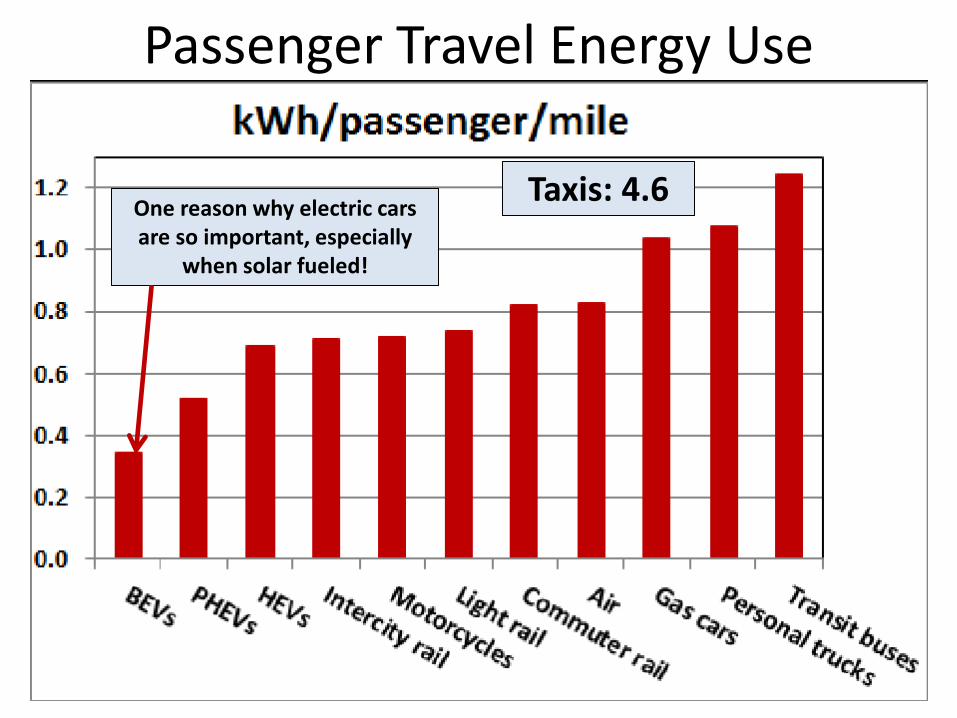
Passenger Travel Energy Use
Taxis: 4.6 One reason why electric cars are so important, especially
when solar fueled!
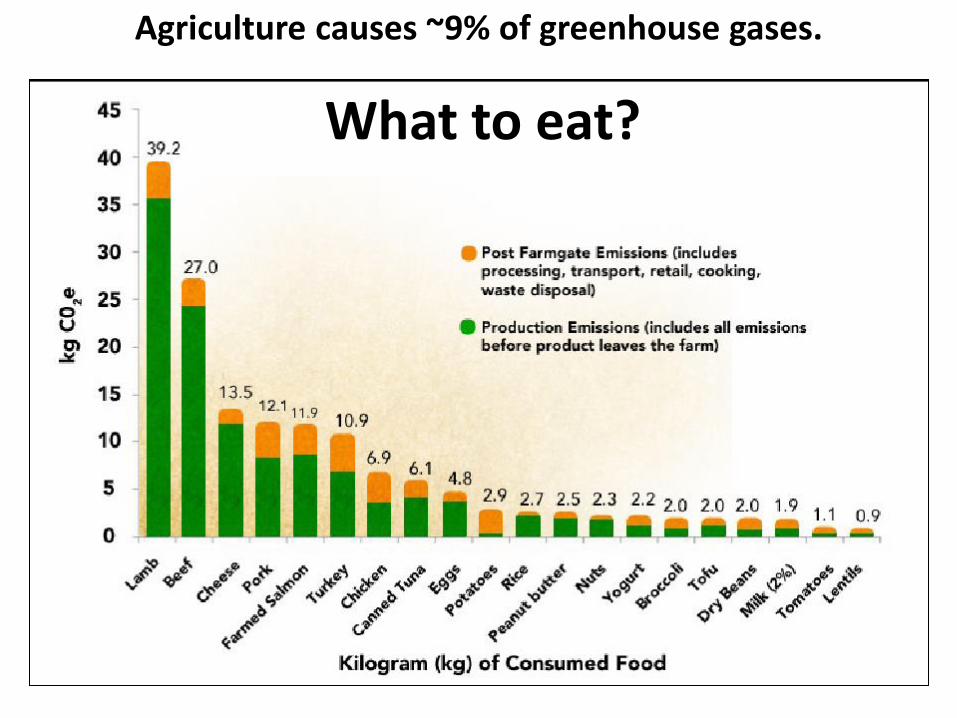
What to eat?
Agriculture causes ~9% of greenhouse gases.
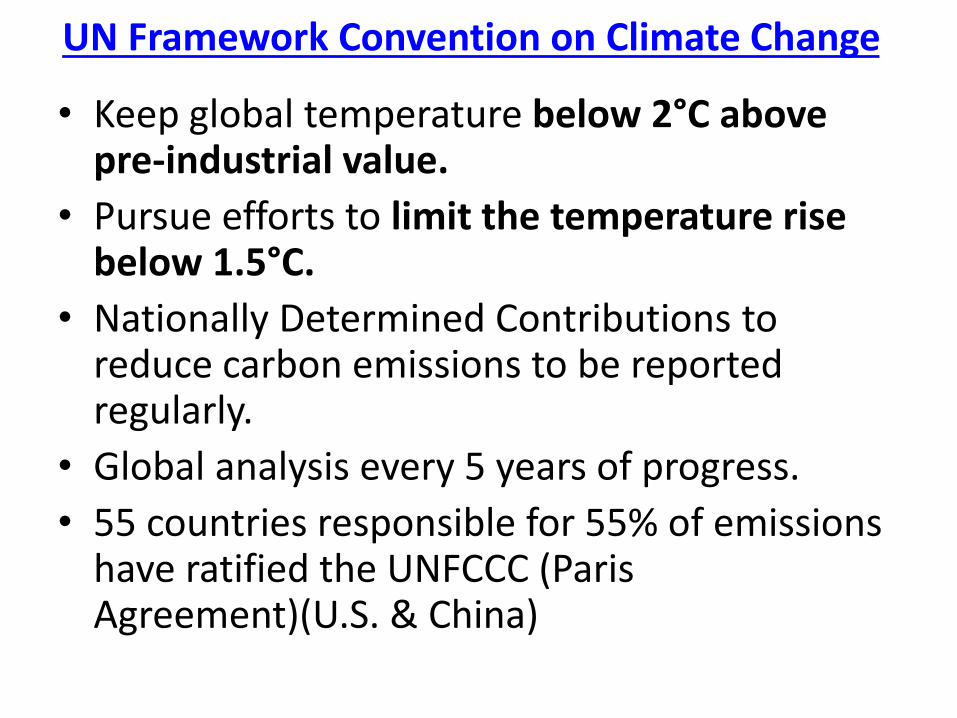
UN Framework Convention on Climate Change
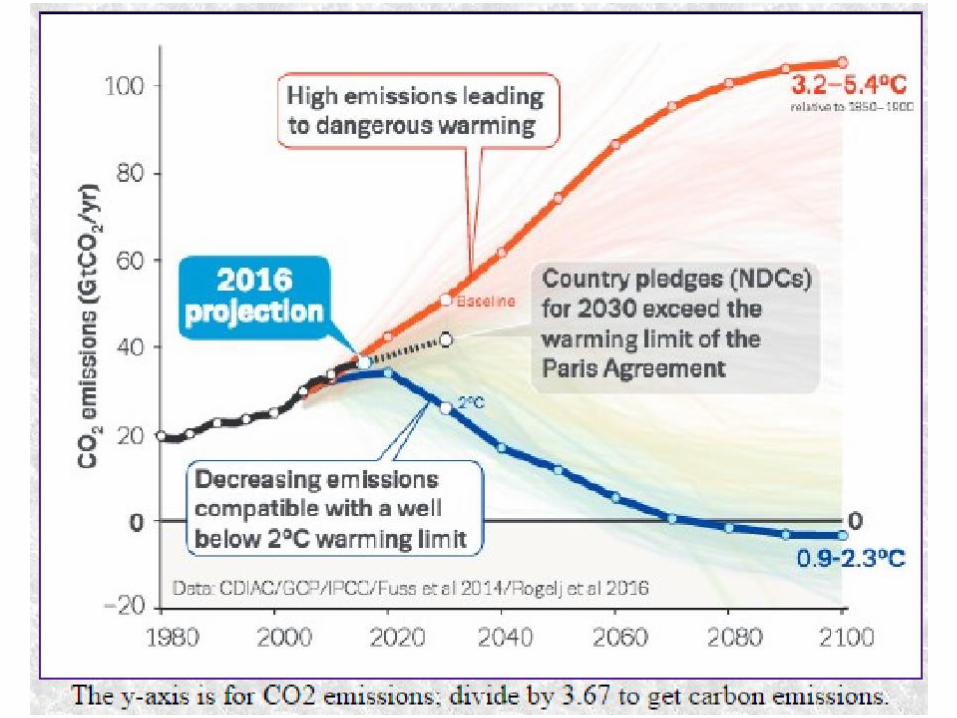
• Keep global temperature below 2°C above pre-industrial value.
• Pursue efforts to limit the temperature rise below 1.5°C.
• Nationally Determined Contributions to reduce carbon emissions to be reported regularly.
• Global analysis every 5 years of progress.
• 55 countries responsible for 55% of emissions have ratified the UNFCCC (Paris Agreement)(U.S. & China)
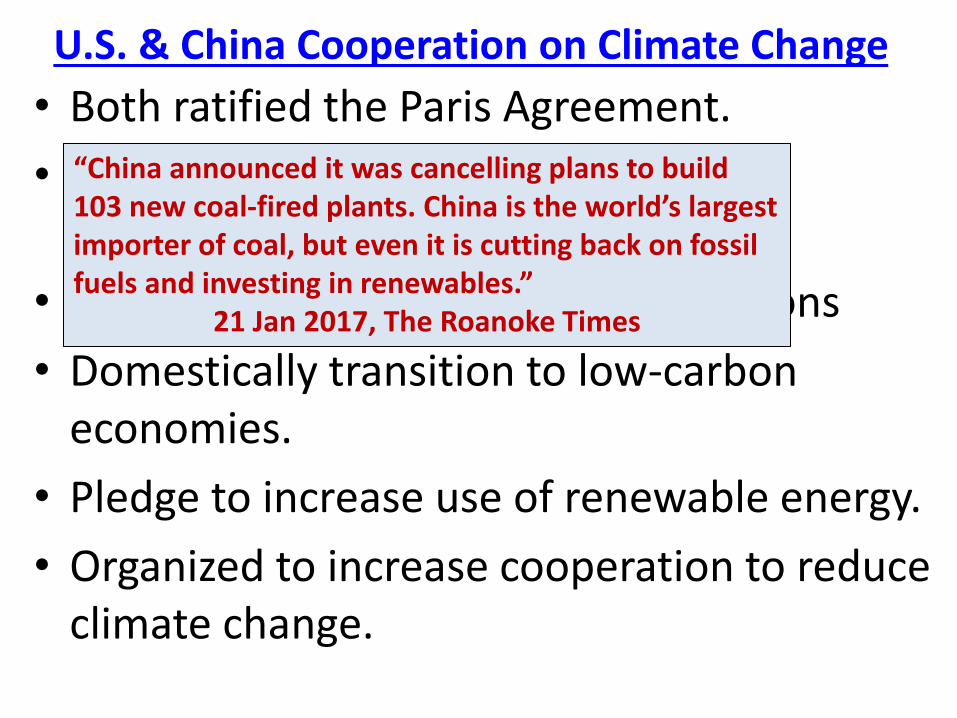
U.S. & China Cooperation on Climate Change
• Both ratified the Paris Agreement.
• Phase down consumption of hydrofluorocarbons.
• Reduce international aviation emissions
• Domestically transition to low-carbon economies.
• Pledge to increase use of renewable energy.
• Organized to increase cooperation to reduce climate change.
“China announced it was cancelling plans to build 103 new coal-fired plants. China is the world’s largest importer of coal, but even it is cutting back on fossil fuels and investing in renewables.”
21 Jan 2017, The Roanoke Times
Human-made Global Warming is challenging our Homo-sapiens-brain and society to recognize the truth of climate science, make plans to mitigate Global Warming and put the plans into action. We are having trouble doing all three.
Global Warming may be the greatest challenge that
humans have encountered in the last 10,000 years,
and its effects will extend for many centuries!
The underlying problem is too many people wanting too
many resources. Free global birth control is needed!
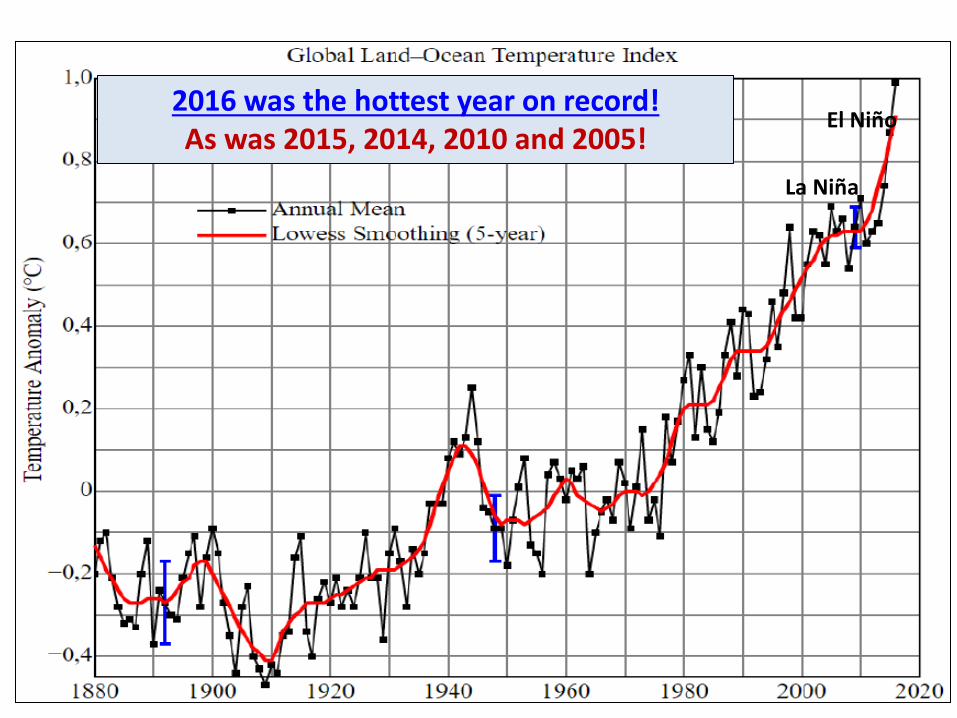
El Niño
La Niña
2016 was the hottest year on record! As was 2015, 2014, 2010 and 2005!
Far Future • Without global warming the global temperature
would be dropping the Earth into the next ~120,000-years ice age.
• After fossil fuels are gone, the temperature drop into the next major ice age will be faster than it would have been without global warming.
• If a nuclear war, say between Pakistan and India, occurs or a large asteroid collides with the Earth, a “nuclear winter” may cause global cooling for a decade or longer and may trigger the next ice age.
• Should we be storing the carbon dioxide due to burning fossil fuels to release it later to slow down the entry into the next ice age?
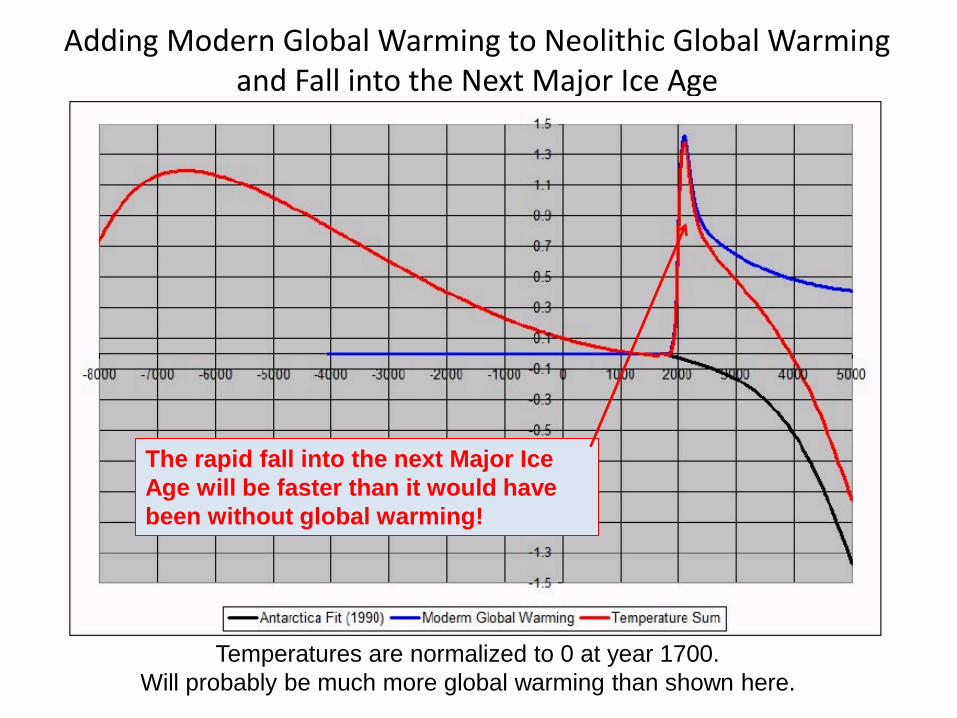
Adding Modern Global Warming to Neolithic Global Warming and Fall into the Next Major Ice Age
Temperatures are normalized to 0 at year 1700.
Will probably be much more global warming than shown here.
The rapid fall into the next Major Ice
Age will be faster than it would have
been without global warming!