Embed Size (px)
Citation preview

The Science Behind i-Ready’s Adaptive Diagnostic


3
Table of Contents Page
An Ideal Assessment .................................................................................................................... 4–7
How i-Ready Diagnostic Works ................................................................................................. 7–8
Underlying Theory ........................................................................................................................ 9
Designed for Common Core Success ..................................................................................... 9
Proven to be Valid and Reliable ............................................................................................ 10
i-Ready Accurately Predicts Proficiencies on Common Core ....................................... 11
Using Assessment Data to Meet Individual Needs .............................................................. 12
Development Led by Expert Advisors ..................................................................................... 14
Conclusion ...................................................................................................................................... 15
Appendix
Appendix I: Sample Diagnostic Items ..................................................................................... 16
Appendix II: A Deeper Dive into How Diagnostic Works .................................................... 17–19
Appendix III: Lexile®, Quantile®, and Norm Research ........................................................ 20

4
An Ideal AssessmentAdaptive assessments are not new. However, the rise of technology and the growth of computer usage in schools have made large-scale, computer-adaptive testing more feasible and increasingly common. Adaptive assessments, like i-Ready Diagnostic, leverage advanced technology to provide a deep, customized evaluation of every student and to track student growth consistently and continuously over a student’s entire K–12 career. This is especially beneficial for identifying gaps from prior years as districts transition to the Common Core. i-Ready also provides valid and reliable growth metrics across a district and school environment to optimize administrative decision making for long-term performance improvements.
Adaptive Assessments Maximize Information on Student PerformanceAdaptive assessments are frequently chosen for their high precision and efficiency, allowing educators to pinpoint student needs more accurately and in less time than with traditional fixed-form assessments. By dynamically selecting test items based on student response patterns, adaptive assessments are able to derive large amounts of information from a limited number of test items and can adapt to students with low and high ability to get a better assessment of student performance.
Many educators familiar with fixed-form assessments may have some questions about the information gained from an adaptive assessment: With a limited number of test items, how can I be sure of the skills my students have and have not mastered? How do I know that my student has mastered a skill, if he has not been tested on it? This is where i-Ready’s sophisticated adaptive logic and a bank of thousands of test items come into play—pinpointing students’ needs in reading and math down to the domain and sub-skill levels.
5
Understanding the Difference between Fixed-Form and Adaptive Assessments
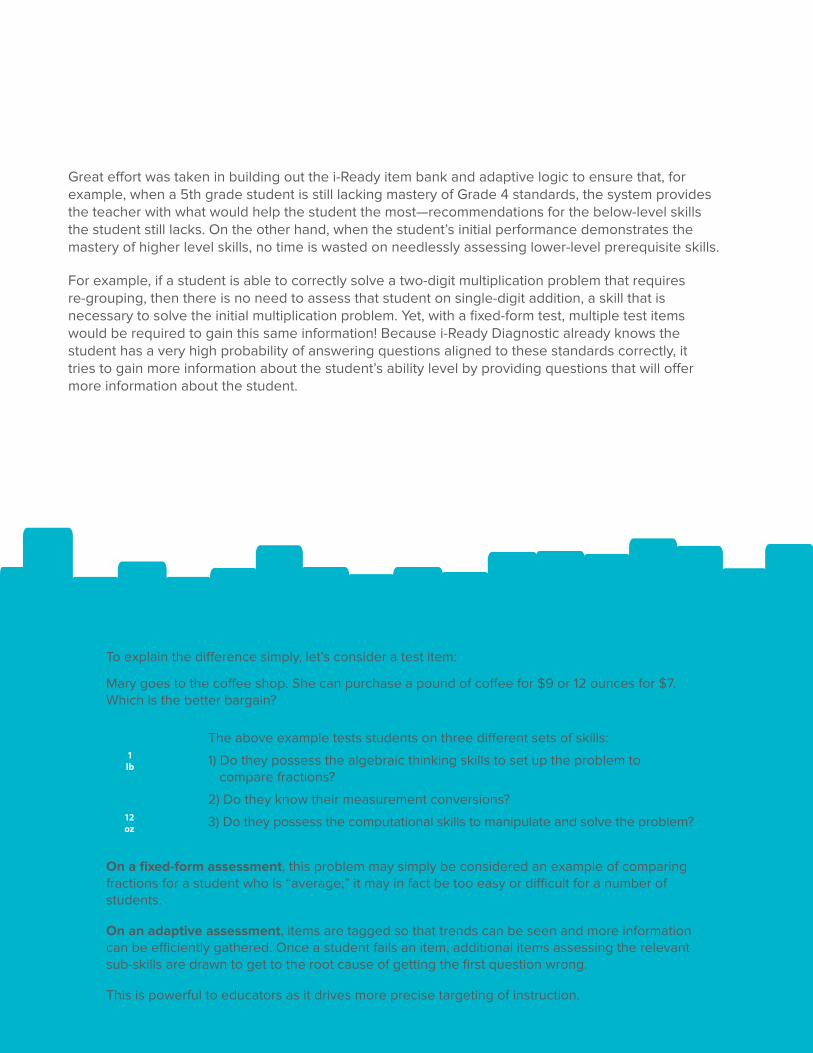
To explain the difference simply, let’s consider a test item:
Mary goes to the coffee shop. She can purchase a pound of coffee for $9 or 12 ounces for $7. Which is the better bargain?
The above example tests students on three different sets of skills:
1) Do they possess the algebraic thinking skills to set up the problem to compare fractions?
2) Do they know their measurement conversions?
3) Do they possess the computational skills to manipulate and solve the problem?
On a fixed-form assessment, this problem may simply be considered an example of comparing fractions for a student who is “average;” it may in fact be too easy or difficult for a number of students.
On an adaptive assessment, items are tagged so that trends can be seen and more information can be efficiently gathered. Once a student fails an item, additional items assessing the relevant sub-skills are drawn to get to the root cause of getting the first question wrong.
This is powerful to educators as it drives more precise targeting of instruction.
Great effort was taken in building out the i-Ready item bank and adaptive logic to ensure that, for example, when a 5th grade student is still lacking mastery of Grade 4 standards, the system provides the teacher with what would help the student the most—recommendations for the below-level skills the student still lacks. On the other hand, when the student’s initial performance demonstrates the mastery of higher level skills, no time is wasted on needlessly assessing lower-level prerequisite skills.
For example, if a student is able to correctly solve a two-digit multiplication problem that requires re-grouping, then there is no need to assess that student on single-digit addition, a skill that is necessary to solve the initial multiplication problem. Yet, with a fixed-form test, multiple test items would be required to gain this same information! Because i-Ready Diagnostic already knows the student has a very high probability of answering questions aligned to these standards correctly, it tries to gain more information about the student’s ability level by providing questions that will offer more information about the student.
1lb
12oz
$9
$7
?

6
Adaptive Assessments Promote Accurate Measurement of Growth Across a Student’s Careeri-Ready makes measuring student growth easy, because of its use of a vertical scale for scoring. Think of it like a growth chart seen at a pediatrician’s office—every child can be measured on one chart. Similarly, i-Ready uses a vertical scale to measure which skills a student has gained from one point in time to the next, on a “chart” of skills that spans kindergarten through 12th grade. Educators can thereby measure student growth on a consistent scale throughout a student’s entire career. Because i-Ready Diagnostic was built on the Common Core, this “chart” consists of Common Core skills expected of students at each grade level.
For example, consider a student who takes a fixed-form summative assessment at the end of each year in grades 3, 4, and 5. Each year he answers 60% of the items correctly on the test. Because the fixed forms for each grade are different, the percent correct does not tell the teacher how much growth the student has made. Alternatively, if this student took an i-Ready Diagnostic assessment at the end of each year, his placement may go from Level 1 the first year, to Level 3, the next year and Mid 5 the following year, measuring how much growth the student has made from year to year.
Adaptive AssessmentAssesses proficiency on both on-grade and off-grade level skills without the need for additional test items and testing time; a vertical scale provides a consistent metric for measuring student progress across multiple grade levels
• Adaptive forms, dynamic item selection
• Presents items based on ongoing calculations of student ability
• Computer-based
• Broader scope possible (multiple grade levels)
• Score presented on the spectrum of ability across grades—e.g. 750 (on an 800-point vertical scale)
• Questions within the test adjust to the student’s ability
Fixed-Form AssessmentAssesses proficiency on grade-level skills, but does not allow educators to measure student proficiency on the same scale from year to year
• Fixed forms, fixed item selection
• Presents items based on prior design
• Can be paper- or computer-based
• Narrower scope (single grade level)
• Score usually presented as percent correct—e.g. 90%
• Test has difficulty providing detailed information about very high performing or very low performing students
Key Distinctions of Fixed-Form and Adaptive Assessments

7
Adaptive Assessments Help Administrators Make Long-Term Decisions and Measure ImpactFor administrators, an adaptive assessment has proven to be the most precise measure of student growth (Growth, Precision, and CAT: An Examination of Gain Score Conditional SEM by Tony D. Thompson, Research Report, December 2008). This real-time visibility enables immediate, effective course corrections.
Administrators using i-Ready are given insight into:
• Percent of students performing below, on, and above grade level
• Percent of students on track to meet annual growth expectations
• Details by school, grade, class, and student
How i-Ready Diagnostic WorksAdaptive Structure:i-Ready Diagnostic adapts, or adjusts, until it finds exactly the level at which students need to receive instruction.
• When students answer questions correctly, i-Ready gives them more challenging questions
• When students answer questions incorrectly, i-Ready gives them less challenging questions
• This process continues. In the end, i-Ready pinpoints which skills each student has mastered and which skills need improvement
12
K
QuestionDifficulty
CorrectIncorrect
Actual Performance Level

8
How i-Ready Diagnostic Works (continued)Upon completion of the adaptive Diagnostic, multiple types of scores are reported by i-Ready to enable a well-rounded view of each student’s proficiency levels:
• Scale Scores – a common language across grades and schools. Scale scores put everything on a single continuum so that educators can compare across grade levels. They provide a metric, which indicates that a student has mastered skills up to a certain point and still needs to work on skills that come after that point
• Placement Levels – the practical day-to-day language that helps teachers determine what grade level of skills to focus on with a particular student. Placement levels indicate where students should be receiving instruction
• Norm Scores – identify how students are performing relative to their peers nationwide. Based on a nationally representative sample of students taking the i-Ready Diagnostic, they specify a student’s ranking compared to students in the same grade. For example, if a student’s percentile rank is 90%, this means the student scored better than or equal to 90% of her national peers from the same grade level
• Lexile® Measures – developed by MetaMetrics®, Lexile measures are widely used as measures of text complexity and reading ability, allowing a direct link between the level of reading materials and the student’s ability to read those materials
• Quantile® Measures – developed by MetaMetrics, the Quantile Framework for Mathematics is a unique resource for accurately estimating a student’s ability to think mathematically and matching him/her with appropriate mathematical content
Educators are also given explicit qualitative information on each student’s abilities:
• The specific skills students have mastered and those that need to be prioritized for instruction
• Standard-by-standard analysis that details student performance against Common Core standards and sub-skills
i-Ready Diagnostic: Quick Facts
Assessment Length:• Students receive 54–72 items per subject• Students typically take 30–60 minutes per subject to complete the Diagnostic. Average duration varies by
subject and grade level, with grades K–3 tending towards the shorter end of the range. Additionally, variability exists in every grade given different student performance levels.
Mathematics • Counting and Cardinality• Number & Operations in Base Ten• Number & Operations – Fractions• The Number System• Number and Quantity• Operations & Algebraic Thinking• Ratios and Proportional Relationships
Reading • Phonological Awareness• Phonics & Word Recognition• Vocabulary• Reading Comprehension: Literature• Reading Comprehension: Informational Text
Content Areas: i-Ready assesses across the following content areas, also known as domains:
• Expressions and Equations• Functions• Algebra• Measurement and Data• Statistics and Probability• Geometry

9
Underlying TheoryComputer adaptive testing and the Rasch Item Response Theory model form a strong foundation for ensuring valid inferences are reported by i-Ready Diagnostic.
In 1960, Georg Rasch developed the Rasch Item Response Theory Model. In this model, the logit value or difficulty level of the items are independent of the ability level of the student. These logit values can also be used to describe the ability level of the student. Using the Rasch Equation, it is possible to calculate the probability of success that a student of a certain ability would have with an item of a certain difficulty. In fact, if the difficulty level of the item and the ability level of the student are the same, then the student will have an even chance of answering the item correctly or incorrectly. This phenomenon is shown graphically in Appendix II using a Wright Map to show the progression of item difficulty through the grades.
i-Ready Diagnostic uses both adaptive testing and item response theory to determine the ability level of the student. From extensive field-testing of items with over 2,000,000 students, there exists a very strong and reliable foundation for determining the difficulty level of each item as well as each indicator group. An indicator group is a set of items aligned to a specific skill. From the ability level of the student and the difficulty level of these indicators, i-Ready can make probabilistic inferences about what students know and are likely able to do. Using this information, the assessment can accommodate students of far-ranging ability levels. Moreover, the results from the i-Ready Diagnostic can pinpoint students’ strengths and provide teachers with actionable information on what students should work on next.
Designed for Common Core SuccessSuccessful transition to the CCSS requires visibility into student performance on the more rigorous assessments that are to come. Using measures that are highly correlated to Common Core-based assessments is a critical step, and i-Ready offers that solution.
Common Core support embedded into the entire program
• Covers more than 90% of assessable standards in Grades K–8 as well as most standards in High School Math and Reading
• Assesses both procedural and conceptual fluency
• Presents a range of challenging informational and literary texts, including authentic texts and multimedia items
• Prepares for College and Career Readiness expectations, including the Smarter Balanced Assessment Consortium (SBAC) and Partnership for Assessment of Readiness for College and Careers (PARCC) expectations

10
Proven to be Valid and Reliable • Developed and reviewed by well-known experts in Educational Measurement, Computer Adaptive
Testing, Mathematics, English Language Arts and the Common Core
• Adheres to the Standards of Psychological and Educational Testing (AERA, 1999) and was independently audited for adherence to the Standards by researchers from the University of Massachusetts at Amherst
• Extensive stand-alone and embedded field testing with over 2 million students
• Approved by high profile review committees for New York, Ohio, Virginia, Chicago, Dallas, and many more
• Strong test metrics: Low SEMs; good item discrimination among students of different abilities
• Linked to National Measures recognized by Common Core: Lexiles measures, Quantile measures (refer to Appendix III for more details on these linking studies)
• Strongly correlated to Common Core assessments based on third-party research from the Educational Research Institute of America (ERIA)
Text complexity backed by researchDuring the development of all passages within the Diagnostic, the recommendations from the Common Core State Standards that readability be evaluated both quantitatively and qualitatively were followed. Lexile and Flesch-Kincaid (F/K) are the quantitative tools used, which provide scores based primarily on the length of syllables, words, and sentences in a text. The Lexile Range scores from MetaMetrics as well as the Flesch-Kincaid tool in Word were used to focus in on proper readability levels. In addition, using a qualitative approach, content experts reviewed all i-Ready reading passages for the qualitative measures that contribute to text complexity. All items went through extensive field testing to confirm appropriate grade placement, and passages were reviewed by subject matter experts for their appropriateness for Reader and Task complexity.

11
Predictive Critical insight to inform decisionsCorrelations are just the beginning of the story; in addition, i-Ready successfully predicted proficiency on this Common Core-based assessment for 85% of students. In other words, before the actual state assessment, i-Ready is able to identify how students are likely to perform. (Refer to the i-Ready NY Validity Study for further details).
3 4 5 76 8 3 4 5 76 80
100%
80%
60%
40%
20%
10%
ELA by Grade Math by Grade
90%
70%
50%
30%
Why it matters Because of these strong correlations, you can be confident that your students are gaining crucial exposure to the key skills and concepts that they need for success on new, more rigorous assessments.
Why it matters By uncovering specific Common Core needs early, you’ll be able to match instructional priorities to those needs—months before students have to take the state assessment in the spring.
ModerateStrong
ELA by Grade
3 4 5 76 8 3 4 5 76 8
Math by Grade
0
1
0.8
0.6
0.4
0.2
0.1
0.9
0.7
0.5
0.3Cor
rela
tions
n=6,500i-Ready
i-Ready® Accurately Predicted Individual Proficiencies on a Common Core-Based Assessment
Highly CorrelatedStrong correlations mean the right preparationIn a recent independent study conducted by the Educational Research Institute of America, i-Ready was found to have strong correlations to the 2013 NY State Assessment, one of the first truly Common Core-based summative assessments (correlations ranged from .77-.85 across grades and subjects).
i-Ready and Common Core-based state assessment correlations
% of students whose proficiency on the 2013 Common Core-based state assessments were correctly predicted by i-Ready

12Date: 1/6/2012 | Page: 1 of 9
i-ready.com © Curriculum Associates, LLC
Student Profile ReportAcademic year: Current (2011-2012) Class: Class Grade 5 Show: Test 1School: Harrington Elementary School Student: Fernandez, Tabitha
Use this report to view a student's Diagnostic performance overall and by domain and customized instructional support to help this student improve.
Overall Performance On or Above Level <1 Level Below >1 Level Below
Detail for Test 1 09/06/2013
Domain Placement
Number and Operations Level 3
Algebra and AlgebraicThinking Level 3
Measurement and Data Level 3
Geometry Level 4
Scale Score
472
457
Scale Score
Tabitha Fernandez - Mathematics - Grade 5
Test Placement Standard Error
Test 3 - 04/12/2014 Early 5
Scale ScoreLevel 5
+/- 15.5
+/- 16.1
+/- 15.4
Test 2 - 01/12/2014 Level 4
Test 1 - 09/06/2013 Level 3
Scale Score 400 425 450 475 500 525 550 575 625600 650 675 700 725 750 775 800
400 425 450 475 500 525 550 575 625600 650 675 700 725 750 775 800
Score: tbd
Score: tbd458
Placement Developmental Analysis
Overall MathPerformance Level 3
Test results indicate that Tabitha would benefit from intensive intervention focused on skills and concepts related to quantitative reasoning and representation. Instruction that connects understanding of number relationships, computation, and problem solving skills will strengthen Tabitha´s math abilities across domains. This priority places Tabitha in Instructional Grouping Profile 1.
Number andOperations Level 3 At levels 3-5 this domain addresses four operations with whole numbers with an emphasis on multiplication
and division, as well as understanding of and computation with decimals and fractions. Test results indicate that Tabitha could benefit from practice using place value to add within 1,000.
Algebra andAlgebraicThinking
Level 3At levels 3-5 this domain addresses multiplication and division concepts, including remainders, factor pairs, and multiples, as well as numeric patterns. Test results indicate that Tabitha needs to develop a deeper understanding of the relationship between multiplication and division and apply this concept to solving word problems.
Measurement andData Level 3 At levels 3-5 this domain addresses the relationship among measurement units, geometric measurement
concepts, and presenting data on line plots and line graphs. Results indicate Tabitha may benefit from review of these topics.
Geometry
459
Level 4 At levels 3-5 this domain addresses angles and perpendicular and parallel lines, classification of two-dimensional figures, line symmetry and plotting points on the coordinate plane. Results indicate Tabitha may benefit from review of these topics.
495
523
472
480
A
Developmental Analysis:Gives teachers more insight into the domain placement levels. It is used to inform instructional decisions by highlighting the most important areas of need.
What (Student) Can Do:Identifies student strengths in each domain.
Student Next Steps: Identifies the skills that should be prioritized for instruction.
Tools for Instruction: Delivers downloadable teacher- led lessons on areas identified in Next Steps.
Recommended Products:Points directly to specific lessons in print resources for targeted, data-driven instruction.
B
C
D
E
A
Using Assessment Data to Meet Individual Student NeedsThe adaptive logic enables a deep, customized evaluation of every student, tracking student growth consistently and continuously over a student’s entire K–12 career and identifying gaps from prior years and areas for further enrichment.
The Diagnostic results directly drive instantaneous reports that detail each student’s proficiency levels and areas of need, highlighting immediate next steps for instruction and enabling individualized learning programs. The reports (i.e., Student Profile Report pictured below) provide teachers with an action plan to make targeted, differentiated instruction a reality. The system also provides the tools to deliver that instruction in any style learning environment —including both online lessons and teacher-led instruction.

13
Overview Number and Operations
Algebra and Algebraic Thinking
Measurement and Data
Geometry Quantile® Performance
Student Profile ReportAcademic year: Current (2011-2012) Class: Class Grade 5 Show: Test 1School: Harrington Elementary School Student: Fernandez, Tabitha
Building Number and Operations Skills
Number and Operations in grades K-8 focuses on representing, comparing, and performing operations with numbers. As in the CCSS, this domain includes whole numbers, decimals, fractions, integers, and irrational numbers, and emphasizes both conceptual understanding and computation. In grades 3-5, students gain an understanding of fractions and decimals and develop fluency with all four operations involving whole numbers, fractions, and decimals.
What Tabitha Can DoResults indicate that Tabitha can likely do the skills shown below.
Next Steps for InstructionResults indicate that Tabitha will benefit from instruction and practice in the skills shown below.
Base TenKnow division facts through 81 ÷ 9.Add multi-digit numbers.Subtract multi-digit numbers.Multiply two-digit numbers by one-digit numbers.
FractionsIdentify fractions shown on a number line.Use models to find equivalent fractions.Write equivalent fractions, including fractions in simplest form.Express fractions with denominators of 10 or 100 as decimals.Decompose a fraction into a sum of fractions with like denominators.Add and subtract fractions with like denominators.
Test 1-09/06/2013 Placement
Number and Operations
Level 3
Scale Score
458
Scale Score 0 50 100 150 200 250 300 350 400 450 500 550 600 650 700 750 800
Recommended Print Products
Tools for Instruction
If you have this product... Use...
Ready® Common Core Grade 3
Lesson 4: Understand the Meaning of Division, p. 30Lesson 5: Understand How Multiplication and Division Are Connected, p. 36Lesson 6: Multiplication and Division Facts, p. 42Lesson 9 Use Place Value to Add and Subtract, p. 72Lesson 10: Use Place Value to Multiply Fractions, p. 84Lesson 15: Understand Fractions on a Number Line, p. 138Lesson 16: Understand Equivalent Fractions, p. 144
Tabitha Fernandez – Mathematics – Grade 5
Learn More
?
Base Ten
Know multiplication facts through 9 x 9.
Fractions
Identify fractions that name part of a whole (denominators of 2, 3, 4, 5, 6, 8, 10, 12).
Identify fractions (1/2, 1/4, 3/4) as parts of a whole using pictures.
Model three-digit numbers.
Compare and order three-digit numbers.
, p. 84
Know Division Facts
Subtract Multi-Digit Numbers
Fractions on the Number Line
Find Equivalent Fractions
B C
D
E

14
Development Led by Expert Advisors
Technical Advisory Committee Members
• Dr. Richard Brown | Founder and CEO of West Coast Analytics
– Former Associate Professor, Psychometrician Rossier School of Education of the University of Southern California
– Former Director of National Center for Research on Evaluation, Standards, and Student Testing (CRESST) at UCLA
– One of the primary psychometricians for i-Ready Diagnostic since its inception
• Dr. Anne Collins | Director of the mathematics programs at Lesley College and the Lesley School of Education, and the Achievement Center for Mathematics
– Past president of both the Association of Teachers of Mathematics in New England and the Association of Teachers of Mathematics in Massachusetts
– Served as an elected member of the Board of Directors for the National Council of Teachers of Mathematics (NCTM)
– Active member of the Association of State Supervisors of Mathematics
– Elected into the Massachusetts Mathematics Educators Hall of Fame in 2005
• Dr. James W. Cunningham | Professor Emeritus of Literacy Studies, University of North Carolina at Chapel Hill
– Known for his research on text complexity and reading comprehension. His work has been featured in many prominent publications, including the Journal of Literacy Research and Reading Research Quarterly
– Member of the IRA Reading Hall of Fame
• Dr. Roger Farr | President and Founder of the Educational Research Institute of America (ERIA)
– Over 50 years of experience in the educational field – Author of numerous publications and a former president of IRA
• Dr. Andrew Ho | Professor of Education at the Harvard Graduate School of Education
– His research critiques and clarifies educational accountability metrics, including proficiency, growth, achievement gaps, and value-added
– Member of the National Assessment Governing Board and a recipient of the Jason Millman Promising Measurement Scholar Award from the National Council on Measurement in Education
• Dr. Mark Pomplun | Executive Director of Assessment and Accountability, St. Charles, Il Community Unit School District 303
– Previously served as Principal Research Scientist at Riverside Publishing Company
• Dr. Stephen Sireci | Professor of Education Policy, Research, and Administration, and Director of the Center for Educational Assessment in the College of Education at the University of Massachusetts Amherst
– His research focuses primarily on educational test development and evaluation, particularly issues of validity, cross-lingual assessment, standard setting, and computer-based testing
– Worked with Curriculum Associates on conducting an audit of i-Ready Diagnostic’s adherence to the Standards, as well as reviewing growth models and placements

15
Expert Curriculum Advisors
• Dr. Richard Bisk | Chair and Professor of Mathematics at Worcester State University
– Advisor to the Massachusetts Department of Education in the development of the Guidelines for the Mathematical Preparation of Elementary Teachers
– Expert on Singaporean mathematics education
• Dr. David Chard | Dean of the Annette Caldwell Simmons School of Education and Human Development at Southern Methodist University
– Research review panelist at both state and national levels, including panels of the National Science Foundation and U.S. Department of Education
– Awarded more than $11 million in deferral, state, and private grants since 1993
• Dr. Cathy Seeley | Senior Fellow at the Charles A. Dana Center at the University of Texas at Austin
– Veteran mathematics educator and change facilitator with 35 years of experience at the local, state, and national levels; works on state and national policy and improvement efforts in mathematics education
– Prior president of the National Council of Teachers of Mathematics (NCTM) from 2004 through 2006, and currently an active member of the council
• Dr. Lori Helman | Associate Professor in the Department of Curriculum and Instruction at the University of Minnesota
– Many years of bilingual teaching experience at the early grades; leads new teacher induction programs – Co-Director of the Minnesota Center for Reading Research
ConclusionIn summary, i-Ready Diagnostic is a computer-delivered, adaptive assessment in Reading and Mathematics for students in Kindergarten through High School. This assessment was developed to serve several purposes:
• Accurately and efficiently assess student knowledge by adapting to each student’s ability for the content strands within each subject. Offer an accurate assessment of student knowledge, which can be monitored over a period of time to measure student growth
• Provide valid and reliable information on skills students are likely to have mastered and the recommended next steps for instruction
• Link assessment results to instructional advice and student placement decisions

16
APPENDIX ISample Diagnostic ItemsAll items within the Diagnostic were specifically built to assess students against key Common Core skill areas. Below are sample Diagnostic items from both Reading and Math, across multiple grades. Features technology-enhanced items as recommended by SBAC and PARCC.
Level 3 – Reading Comprehension
Level K – Number and Operations
Level 12 – Reading Comprehension
Reading
Mathematics
Highlight text in passage to record
right answer
Compare and contrast using
multimedia
When a transversal intersects two parallel lines, corresponding angles are congruent.
When a transversal intersects two parallel lines, alternate interior angles are congruent.
When two lines intersect at a point, adjacent angles are supple-mentary.
When two lines intersect at a point, vertical angles are congruent.
In the figure, and , why is m 2 5?nl
Level 10 – Geometry
Interactive tools such as calculator, compass, and
protractor are available to help students solve items.
17
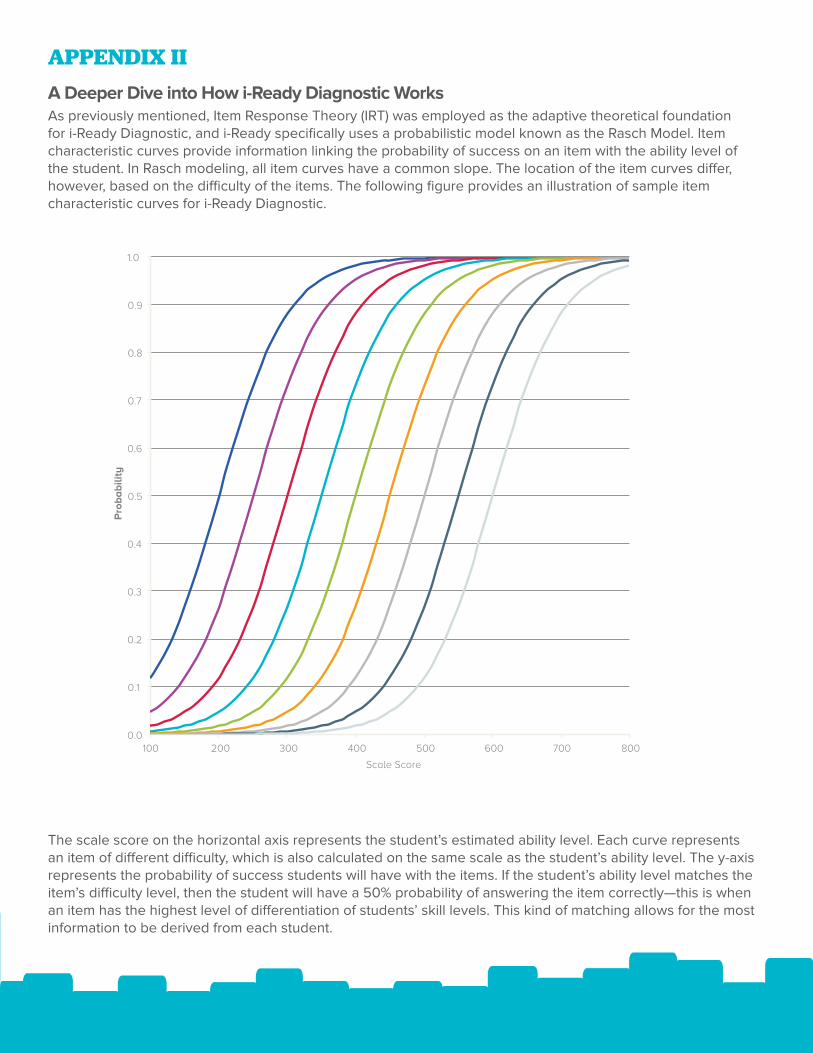
APPENDIX IIA Deeper Dive into How i-Ready Diagnostic WorksAs previously mentioned, Item Response Theory (IRT) was employed as the adaptive theoretical foundation for i-Ready Diagnostic, and i-Ready specifically uses a probabilistic model known as the Rasch Model. Item characteristic curves provide information linking the probability of success on an item with the ability level of the student. In Rasch modeling, all item curves have a common slope. The location of the item curves differ, however, based on the difficulty of the items. The following figure provides an illustration of sample item characteristic curves for i-Ready Diagnostic.
Sample ICC’s
The scale score on the horizontal axis represents the student’s estimated ability level. Each curve represents an item of different difficulty, which is also calculated on the same scale as the student’s ability level. The y-axis represents the probability of success students will have with the items. If the student’s ability level matches the item’s difficulty level, then the student will have a 50% probability of answering the item correctly—this is when an item has the highest level of differentiation of students’ skill levels. This kind of matching allows for the most information to be derived from each student.
0.0
0.1
0.2
0.3
0.4
0.5
0.6
0.7
0.8
0.9
1.0
100 200 300 400 500 600 700 800
Probability
Scale Score

18
APPENDIX II (continued)
The following item characteristic curve is for a hypothetical two-digit multiplication item that has a difficulty level of 450.
Note: If a student with an ability level of 300 were to get this item, then the student would have less than a 10% probability of answering it correctly. This would be like the student who has not mastered simple addition receiving a two-digit multiplication problem. We know the student struggles with simple addition, so we can deduce, probabilistically, that the student likely won’t be able to answer the two-digit multiplication item correctly. Therefore, giving this item to that student will not provide that much information. On the other end of the spectrum, if we give this item to a student who has an ability level of 600, that would be similar to giving a student who we know has mastered long division an item that measures whether the student can multiply. Probabilistically, we can conclude that if the student has mastered long division, the student has also very likely mastered two-digit multiplication.
Probability
Scale Score
0.0
0.1
0.2
0.3
0.4
0.5
0.6
0.7
0.8
0.9
1.0
100 200 300 400 500 600 700 800
Sample Item

19
The Diagnostic hones in on the ability level of the student, and based on the student’s scale scores, we can de-termine the probability of that student’s success with other skills. The assessment measures proficiency on i-Ready Diagnostic indicators, which are based on the Common Core State Standards. The difficulty of an indicator is determined by the items associated with it. Hence, a look at the coverage and progression of ability measured by indicators across grade levels provides a good overview of the range of ability i-Ready measures.
The information regarding the difficulty of the indicators is modeled by a tabular Wright Map, which shows the difficulty level of the skills on the vertical axis and the grades on the horizontal axis. There is overlap from grade to grade, which is to be expected, as some skills in Grade 4, such as long division, may be more difficult than some of the simpler skills in Grade 5, such as multiplying by powers of 10.
The tabular Wright Map shows i-Ready indicators for Mathematics
In summary, as evidenced by the tabular Wright Map, i-Ready Diagnostic is built on a large, solid bank of items, well-structured and defined to assess the levels of skills across K–12. The adaptive algorithm selects items dynamically based on each student’s ability level—only items providing the most information about the student are presented; below- or above-grade level items are available when the student is performing off level from his/her own grade. i-Ready provides an accurate and tailored testing experience for each student and, as a result, offers meaningful instructional information for educators. Refer to the i-Ready Technical Manual for additional information about i-Ready’s technical properties.
250
300
350
400
450
500
550
600
650
Thr
esh
old
Sco
re
Grade 1Grade 0 Grade 2 Grade 3 Grade 4 Grade 5 Grade 6 Grade 7 Grade 8 Grade 9 Grade 10 Grade 11
DomainAlgebra and Algebraic Thinking
Geometry
Measurement and Data
Number and Operations
Grade Level
IMSK-4
IN0K-14
IGEK-3
IGEK-2
IAL1-12
IN01-8
IN01-2
IAL1-4
IGE1-1
IMS2-11 IAL3-13
IMS5-5
IAL6-2IGE7-6
IGE8-3
IAL9-5
IAL9-2
IGE10-10
IGEM10-3
IGE10-3
IAL11-5IALN11-1
IAL11-21
IAL8-4
IGE8-4IAL7-2
IMS6-8
IGE5-4
IN05-9
IGE5-3
IMS4-9
IN04-9
IGE4-2IAL3-10IAL3-3
IN02-11
IGE2-3
IGE2-4
IMS4-1
IN0K-6
IMS2-9

20
APPENDIX III
Lexile® Linking StudyIn the spring of 2012, MetaMetrics and Curriculum Associates partnered to conduct a Lexile Linking Study against i-Ready Diagnostic Reading. The purpose of this study was threefold:
1. Gather evidence of external (concurrent) validity.
2. Allow reporting of Lexile scores based on given i-Ready Diagnostic Reading scores.
3. Provide administrators, teachers, and parents information on appropriate reading materials for students.
MetaMetrics constructed Lexile Linking Tests for this study. A national sample of 3,280 students at grades 1, 3, 5, and 7, from 35 schools in 27 districts across 10 states completed both the Lexile Linking Test and i-Ready Diagnostic within 0–95 days with 97% of the students completing both tests within one month. About 60% of the students took the i-Ready Reading Diagnostic first and 40% took the Lexile Linking Test first. Table 1 shows the N counts of the target sample and the final sample by grade.
Table 1. Lexile Linking Study – Assessments Administered and Final Linking Sample by Grade
1 3 5 7 Total
i-Ready Reading Diagnostic 1406 1724 1285 826 5241
Lexile Linking Test 1437 1781 1381 1038 5637
Final Linking Sample 840 1091 814 535 3280
The correlations between the i-Ready Reading Diagnostic Overall Score and Lexile Linking Text Lexile measure range from .88 to .89 across the four grades. These correlations support strong external validity with the Lexile measure. Linear linking models were created and incorporated into the i-Ready system to provide the i-Ready Reading Lexile measure along with links to appropriate reading materials given an i-Ready Reading Diagnostic score.
Quantile® Linking StudyA linking study between i-Ready Diagnostic Mathematics and the Quantile Measure was conducted in the spring of 2013 with similar purposes as the Lexile linking study referenced above:
1. Provide external validity information on i-Ready Diagnostic Mathematics.
2. Provide teachers linkage to resources from the Quantile Framework.
Detailed information about the Lexile and Quantile linking studies and validation of the linking results are available upon request.
Norm ResearchDuring the third full-year implementation of i-Ready Diagnostic, the program served over a million students across the United States. From this large pool, Curriculum Associates collected i-Ready data from a nationally representative sample of students to create i-Ready’s own National Norms. A technical report, available upon request, provides information about the development of the National Norms for grades K–8 during the spring of 2014.

21
NOTES:
For more information:
800-225-0248 www.i-Ready.com/Tour
To listen to a live webinar recording:
www.i-Ready.com/AdaptiveWebinar

22
NOTES:

23
NOTES:

9/1
4 1
0K