Embed Size (px)
Citation preview

I ....
This dissertation has beenmicrofilmed exactly as received 70-4304
ASATO, Yukio, 1934-GENETIC STUDIES ON TI-lE BLUE-GREENALGA, ANACYSTIS NIDULANS.
University of Hawaii, Ph.D., 1969Microbiology
University Microfilms, Inc., Ann Arbor, Michigan

GENETIC STUDIES ON THE BLUE-GREEN ALGA,
ANACYSTIS NIDULANS
A THESIS SUBMITTED TO THE GRADUATE DIVISION OF THE
UNIVERSITY OF HAWAII IN PARTIAL FULFILLMENT
OF THE REQUIREMENTS FOR THE DEGREE OF
DOCTOR OF PHILOSOPHY
IN MICROBIOLOGY
JUNE 1969
By
Yukio Asato
Thesis Committee
Clair E. Fo1some, ChairmanLeslie R. BergerJohn A. HuntKaare R. GundersenMorton Mandel

ACKNOWLEDGEMENTS
The support from National Aeronautics and Space
Administration in the form of a predoctoral traineeship is
gratefully acknowledged. Supplies and equipments were
obtained in part through a grant from the Life Insurance
Medical Research Foundation administered to Dr. C. E. Folsc~e.

ABSTRACT
Inactivation studies on Anacystis nidu1ans were performed
using UV irradiation and nitrosoguanidine. UV irradiation had
no effect when the treated culture was first incubated in the
light. When the UV irradiated culture was first incubated in
the dark for 9 hours, an exponential survival curve was
obtained with slope k=O.23 log 5/50 ergs·cm. The photo
reactivab1e sector was calculated to be one. A slight
shoulder in the survival curve was observed. Extrapolation
of the asymptote to the y-axis indicated a target number of
2. The response to nitrosoguanidine was found to be con
centration dependant.
Mutation experiments were conducted mainly with
nitrosoguanidine. A variety of mutant phenotypes was found
upon induction with nitrosoguanidine treatment. These were
minute colony formers (mcf), filamentous forms (snakes or
~), yellow (~) and blue (b1u) , po1ymixin B (pmb) and
kanamycin (kan) resistance. The frequencies of occurance
were: 3.7x10⁻³ (mcf), 1.0x10⁻³ (sna) , 1.8x10⁻³ (~),
2.98x10- 3 (b1u) and 4.8x10⁻⁴ (pmbr ). Auxotrophic mutants
were not recovered even after screening approximately 8.0x10⁴
surviving colonies with the replica plate method.
Cell synchrony was induced by a light-dark regimen. The
rates of macromolecular synthesis of the synchronous culture
were determined. Protein, RNA, and phospholipid fractions
increased exponentially. DNA synthesis was periodic. An

v
abrupt increase in the rate of DNA synthesis was seen at 3
hours prior to the cell division periods. The period of DNA
synthesis was 6 to 7 hours. The times of abrupt increases
in the rate of DNA synthesis were inferred to be the times
of initiation of genome at a fixed point of replication.
A genetic map was constructed by taking advantage of
cyclic DNA synthesis of synchronously dividing cells.
Sequential mutagenesis during the period of DNA synthesis
yielded unique temporal patterns for specific marker
fre~uencies. The patterns showed an initial plateau, an
abrupt increase, then, a second plateau. Slopes of the
abrupt increases were calculated. The times of the abrupt
increases were then designated as the times of the replica
tion of the cistrons and, correspondingly, the loci of the
markers in time units. The loci of six markers were presented
as the genetic map of Anacystis nidulans. These were pmbr ,
blu, ~' ~' mcf, and kanr in that temporal order.
TABLE OF CONTENTS
. . . . . . . . . .. . .
LIST OF FIGURES
. .iv
ix
x
· .· .· . . .· . .
· . . .
· . . . . . . .
• •
• • •
· .· .· . . .. .
. . .. .. .ABSTRACT • • •
LIST OF TABLES
A. DNA synthesis during the division cycle
. . . . . . . . . . . . . . .
• • • • • • • • • • G • •
· . . . . . . . . . . .
1
7
7
12
17
17
17
19
19
· . .
· . . .
· . . . .· . . . . . . .
· . . , . . . .
· . . . . . .
· . .
· . . . . .• •
• •
· . .
INTRODUCTION
CHROMOSOMAL MAPPING:THEORETICAL CONSIDERATION
Growth curve studies •
B. Mapping experiments
A. Organism and source
B.
C. Growth on agar plates
D. DNA determination
CHAPTER I.
CHAPTER II.
CHAPTER III. MATERIALS AND METHODS.
J. Cell synchrony studies • • • · · · . · · · • ·K. Macromolecular synthesis in Anacystis
nidulans . • • • . · · • • · · • • . • • • • •
L. Genetic mapping of Anacystis nidulans · • • •
E.
F.
G.
H.
I.
Sensitivity of Anacystis to variousorganic compounds • • • • • • • • •
Inactivation by nitrosoguanidine
Inactivation by uv irradiation •
Isolation of mutants induced by NTGor by uv irradiation • • •• • •
Heterologous 32p-DNA binding byAnacystis nidulans • • • • • • • • •
· . . . .· . . . .· . . . .· . . . .· . . . .
20
21
21
22
23
23
24
27

Isolation and characterization of mutants •
Inactivation of Anacystis nidulans
Interpretation, Growth studies
Growth studies
29
29
30
36
36
36
vii
• •
· .
• •
· .
· .
. . . . . .• • •
· . .
. . . . . . . .
• •• •
. . . .
. . .• •
· . . . .
· . . . . . . . . . . .• •RESULTS
RESULTS ••
B.
A.
CHAPTER IV.
CHAPTER V.
Isolation and characterization of mutants •
· . . . . . . . . . . . . . . .CHAPTER VI.
Interpretation,
Isolation of mutants induced by uvirradiation and nitrosoguanidine 46
48
50
50
· .· . . . . . .
· . . . .
• • •. . . . .RESULTS •
Cell synchrony
B.
A.
A.
62
53· . . .· . . .
Incorporation of radioactive labels byexponential phase culture • • • • • • •
Incorporation of radioactive labels bysynchronous cells • • • • • • • • •
Interpretation,
Cell synchrony and rate of macromolecularsynthesis •••••••••••••••• 64
C.
B.
. . . . . . . . . . . . . . . . . .
73
76
76
68
68
· .
· .• •
. . . . .
· . .• •. . . .. . . . . . . . . . . . . . . . .RESULTS
Auxotrophy
Mapping experiments •
Interpretation,
Genetic map of Anacystis nidulans • • • • •
CHAPTER VIII. DISCUSSION AND SPECULATION
CHAPTER VII.
A. Specific relationship of basic biochemicalreactions and the metabolites of photochemicalprocesses ••••••• ••••• • • • • 77
B. Alternate pathways . . . . . . . . . . . . . . 79

. . . . . . . . . . . . . .CHAPTER VI I I •
C. Duplication of genes •
CONCLUSIONS
. . . . . . . . . . .. .viii
7S
86
A. Inactivation and mutagenesis withnitrosoguanidine and uv irradiation . . . . . 86
B. Cell synchrony and macromolecular synethsis.. 87
. . . . . . . . .
A. DNA determination by colorimetric methods
C. Genetic mapping experiments
APPENDIX I. MISCELLANEOUS EXPERIMENTS . . . . . . . .. .
87
88
88
B. Heterologous DNA binding by Anacystisnidulans • . • • • • • • • • • • • • • . . . . 88
C. Effect of antibiotics, antimetabolites, andanalogues of amino acids and purines andpyrimidines •• • • • . • • • • • • • •• 90
. . . . . . . . . . . . . .APPENDIX II.
BIBLIOGRAPHY
STATISTICS . . . . . . . . . . . . .. . .
94
97

LIST OF TABLES
. . . . . . . . . . . . .
· . . . . .
7 Antibiotic sensitivity
8 Inhibition by base analogues
30
45
64
70
89
92
93
Page
18
· . .
· . .
· . .
· . .· . .
. . .
. .
• • •
. . . . .
. . . . . . . . . . . . . . . .Ratios of chlorophyl a: phycococyaninand carotenoid: phycocyanin •••••
Media
Effect of pH on the yellow pigment mutant •
Incorporation of labels in the dark • •
Mutation frequency of exponential phasecuIture • • • • • • • • • • • • • • • •
Determination of DNA content per cell •
3
4
5
1
2
6
TABLE
13 Regression line of minute colony formers
• •
Regression line of kanamycin resistance • •
93
94
95
95
95
96
96
96
• •
· . .· . .
· . .
· . .
· .· . .
. . . .• •
. . .Regression line of yellow mutant
Regression line of blue mutant
Inhibition by antimetabolites, amino acidand vitamin analogues • • • • • • • • • • •
Relative mutant frequencies • • • •
Regression line of "snake" mutant • • • • •
Regression line of polymixin B resistance
9
10
11
12
14
15
16
LIST OF FIGURES
FIGURE Page
· . . . .
15
15
16
31
31
3S
• •
• •
· .. . .
· . .· . .
· .· .
. . . . . .Mutation frequency patterns expected
Absorption of major pigments duringexponential phase • • • • • • • • •
1 Hypothetical model of DNA replication inrelation to synchronously dividing cells •
2 Scheme of mapping experiments
3
4
5 Cell concentration and absorption at 640 nm
6 Growth curve of Anacystis nidulans •
7 Absorption spectra of yellow pigmentmutant y3 ••• • • • • • • • • • • • • · . . . . 38
· . . . .· . . . .
8 Survival curve of Anacystis nidulanstreated with nitrosoguan1dine at pH 8.0
9 Survival curve of Anacystis nidulanstreated with nitrosoguan1dlne at pH 6.0
10
11
Ultraviolet light inactivation curve •••
Chemical characteristics of nitrosoguanidine •
· .· .
40
42
44
48
12 Induced cell synchrony of Anacystis nidulans • 52
• • • • • • • •
. . .
55
57
59
61
72
75
• •
• •
· .· .
· . . . .Incorporation of labels by synchronous culture
Rate of DNA synthesis of synchronous culture •
Incorporation of labels by exponential phase •
Rates of macromolecular synthesis byexponential phase culture • • • • •
17 Mutation frequencies of synchronous culture
18 Genetic map of Anacystisnidulans
15
16
13
14
19 Models of possible chromosome organizationof Anacystis nidulans • • • • • • • • • • • • •• 84
20 Hypothetical schema of mutagenesis • • • • • • •• 85
21 32p-m~A (E. coli) bindjng by Anacystis nidulans 91
CHAPTER I
INTRODUCTION
The Blue-green algae are highly versatile and flourish
over wide temperature ranges, in various salt concentrations,
and are able to withstand extreme desiccation. Abundant
growth of Phormidium and Lyngbya spp. is found in the Antartic
regions where temperature ranges from -60° to +15°C (Fritsch,
1912). At the other extreme, the Blue-green algae are the
predominant flora inhabiting the alkaline hot springs of
Yellow Spring National Park where the temperature reaches
75°C (Brock, 1967). The ability to withstand extreme
desiccation, even of those genospecies which do not form
spores, attests to their hardiness (Lipman, 1941; Levitt,
1951). Although only 20 per cent of all Blue-green algae
inhabit marine water, several genera can tolerate and actually
grow in brine and salt marshes (see Fritsch, 1945). The
manner in which cellular processes are ablu to function in
these extreme environmental conditions is a fascinating area
of study. Whether the ability to withstand these extreme
physical environments is attributable to a small set of
common characteristics is of great interest.
The Blue-green algae's role in the geochemical cycling
of elements is immense. In the evolutionary history of the
earth, Blue-green algae or their ancestors were an important
factor in changing the reducing atmosphere to oxidizing

2
(Cloud, 1965; Gafron, 1966). At present, the nitrogen
fixing Blue-green algae play an important role in establish
ing a flora in areas not generally considered fit for life.
In India, filamentous nitrogen fixing Blue-green algae play
an important role in reclaiming the alkaline "usar". soils of
Uttar Predesh province (Singh, 1961). In receding glaciers
of the Antartic, evidences of abundant Blue-green algae growth
have been found (Holm-Hansen, 1963). It is a well documented
fact that the Blue-green algae were one of the first organisms
to re-establish the flora after the destructive and steriliz
ing eruption of Karakatoa in 1883 (see Singh, 1961).
The Blue-green algae are vital microorganism in economics
and agriculture. The establishment of the flora in previously
inhospitable and unproductive land was mentioned earlier. In
Japan and India, the Blue-green algae were experimentally
planted in the rice fields to increase the productivity of
rice (Singh, 1961). The tonnage of rice was found to increase
several fold (Watanabe, 1956). On the other hand, Blue-green
algae can be of a nuisance and in certain instances destructive
to animal life (see Holm-Hansen, 1968). In the drinking water
reservoir, they may impart a bad taste to the water. Several
Blue-green algae are known which produce a highly potent toxin.
A great number of domestic and wild animal life are lost due
to toxic Blue-green algae in the drinking water.
The use of Blue-green algae in life support systems for
space exploration is a possibility. The utility of Blue-green

3
algae in space platforms or moon bases as biological agents
in recycling of C02 and 02 is highly probable.
Aside from economic, physiologic, and geochemical
aspects, the Blue-green algae may provide key answers to the
evolutionary pattern of cell systems. The Blue-green algae
and bacteria belong to a distinct group, the procaryotes,
which is mutually exclusive from other more complex micro
organisms, the eucaryotes (Stanier and van Niel, 1941; 1963;
also see reviews by Murray, 1962; Echlin and Morris, 1965).
The major distinctions are the absence in the procaryotes of
true chromosomes, nuclear membranes, physiological function
ing organeJles and a mitotic apparatus. In this respect,
the evolutionary relationship between the procaryotes and the
eucaryotes present an immensely difficult problem. Stanier
(1964) pointed out that the transition from procaryotes to
eucaryotes must have been made since the two major classes
of organism share enough common features which warrants a
single evolutionary path.
An alternative thesis on the origin of eucaryotes has
been formalized (Sagan, 1965), based on the assumption that
the probable origin of the organelles in the primitive,
potential eucaryotic cell is attributable to the endosymbiosis
of protoplastids. The protoplastid forms of Blue-green algae
and bacteria were subsequently differentiated to form the
chloroplast and mitochondria respectively. The endosymbiosis
of Blue-green algae in apochlcrotic green algae has been

4
recognized long ago by Pascher (1914). An endosymbiotic
Aphanothece-like Blue-green alga has been demonstrated
through ultrastructure sections to be a substitute in the
apochlorotic green algae, Glaucocystis nostochinearum (Hall
and Claus, 1967). Furthermore, an intensive study has shown
that base ratios of Blue-green algae are very similar to
those of chloroplasts of green algae (Eldelman et aI, 1967).
It is widely known that Blue-green algal photosynthesis in
volves two pigments with liberation of molecular oxygen,
which is similar to eucaryotes and distinct from other
photosynthetic procaryotes.
Genetic studies of Blue-green algae and other higher
bacteria may offer another approach to these evolutionary
studies. One could comparatively chart the gross functional
and organizational structure of bacterial chromosomes and
their evolutionary development. For example, it is not
surprising to envision the accumulation of replicons as one
form of chromosome development (Jacob, Brenner and Cuzin,
1963; Folsome, personal communication). The episome such as
the F-factor of E. coli can exist as-an independent replicon
which contains different sets of information (Jacob and
Wollman, 1961; Cuzin and Jacob, 1967). Although not con
firmed, Altenbern (1967) reported that Staphylococcus aureus
possesses two major replicons. In the light of these
consideration, genetic study of Blue-green algae may reveal
a higher level of genomic organization since the Blue-green

5
algae are complex prr,=aryotes.
At present, the genetics of Blue-green algae are
practically non-existent. Attempts to show parasexual
recombination between antibiotic mutants were inconclusive.
The apparent recombinants described by Kumar (1963) were
disputed by Pikalek (1967) since the apparent antibiotic
resistant recombinants may have been surviving stationary
phase cells in penicillin media, which decreases in activity
over the span of seven days. However, a recent report by
Bazin (1968) again argued in favor of parasexual recombination.
A recombination frequency of 4.95-49lxlO- 9 was obtained when
a previously mixed antibiotic mutants were plated on agar.
The activity of the antibiotics in the agar plates was care
fully monitored during the entire length of the experiments.
Genetic recombination for filamentous Blue-green alga,
Cylindrospermum~. (R.N. Singh and Sinha, 1965) and for
Anabaena doliolum (H.S. Singh, 1967) was reported. These
works on parasexual recombination are promising and should
be further established.
The lack of suitable mutants has seriously hindered
genetic studies. Chemical induction of mutants of
Blue-green alga, Anacystis nidulans, has been reported
(van Baalen, 1965; Kumar, 1968). Using nitrosoguanidine,
a variety of morphological, pigment, streptomycin, and uv
resistant mutants has been isolated. On the other hand, uv
irradiation yielded an apparent nutritional mutant and

6
pigment deficient mutants of Anabaena ~. (Singh and Singh,
1964 a,b).
The purpose of this work is to establish a mapping
system for the Blue-green algae. In specific terms, the
objectives were to (1) perform a study of mutagenesis
(2) isolate mutants and (3) develop a procedure for mapping
the mutants isolated. These studies will form a basis for
future experiments in probing the genomic organization of
the Blue-green algae.

CHAPTER II
CHROMOSOMAL MAPPING: THEORETICAL CONSIDERATION
A. DNA synthesis during the division cycle
The DNA synthesis cycles of E. coli and B. subtilis
have been extensively characterized. DNA replicates in a
semi-conservative (Meselson and Stahl, 1958) and sequential
manner (Yoshikawa and Sueoka, 1963; Nagata, 1963). For a
particular strain of E. coli, DNA replication is initiated
at a fixed point (Lark, Repko, and Hoffman, 1957; Clark and
Maal~e, 1967; Abe and Tomizawa, 1968; and Wolf, Newman and
Glaser, 1968) and proceeds via a single growth point (Cairns,
1961; Yoshikawa and Sueoka, 1963; Bonhoeffer and Gierer,
1963) until the entire genome is replicated (Meselson and
Stahl, 1958). The rate of DNA synthesis is assumed to be
constant (Cairns, 1961). Premature initiation of new growth
points normally does not occur except under certain conditions:
(1) when thymine requiring mutants are first subjected to
thymine starvation, followed by addition of thymine (Maal~e
and Hanawalt, 1960; and Lark and Pritchard, 1964), (2) at
rapid growth rates (Cooper and Helmstetter, 1968).
The relationship of DNA synthesis periods to cellular
division cycles of bacteria is beginning to be resolved. The
contradictory results were mainly due to the methods utilized.
Chemically or physically induced cell synchrony may cause an
abnormal pattern of macromolecular synthesis due to an

8
imbalance of growth conditions (Barner and Cohen, 1956;
Campbell, 1957). Results obtained from induced cell synchrony
must be judged carefully and cannot be used to determine the
normal synthetic pattern of macromolecules (Maal~e, 1960;
Maal~e and Kjeldgaard, 1966). It thus becomes understandable
that earlier investigations suggested periodic DNA synthesis.
For example, periodic DNA synthesis was reported from induced
synchronized cells of Alcaligenes faecalis by temperature
(Lark and Maal~e, 1956), of E. coli l5T- by thymine starva
tion (Barner and Cohen, 1956), and of E. coli by selection
of homogeneous cell population via filtration through filter
paper pile (Maruyama and Yanagita, 1956b).
DNA synthesis in exponential phase culture of E. coli
and Salmonella typhimurim was shown to be continuous through
about 80% of the division cycle (Schaecter, et aI, 1958),
since about 99% of all cells pulse labeled with 3H-thymidine
demonstrated grain clusters. In close agreement, McFall and
Stent (1959) found about 70% of cells inactivated due to 32p
decay of exponential cells labeled for only 11% of the
generation cycle. These experiments indicate that in extant
cultures almost all of the cells are replicating DNA with a
relatively short gap period between termination and
initiation of a new cycle of DNA synthesis.
DNA synthesis was shown to be continuous (Abbo and
Pardee, 1960) in synchronous cell growth obtained by the
filter paper pile filtration method of Maruyama and Yanagita
9
(1956a). Using the same method, Nagata (1963) confirmed the
continuous pattern of DNA synthesis. The discrepancy between
the previous report of periodic DNA synthesis by Maruyama and
Yanagita (1956b) was attributed to the shorter filtration time
and the maintenance of constant temperature in the preparation
of the cells. Other methods of obtaining cell synchrony, such
as the use of lag phase cultures (Cutler and Evans, 1966),
also showed continuous DNA synthesis. In addition, Young and
Fitz-James (1960) were able to demonstrate continuous DNA
synthesis of germinating spores of Bacillus cereus.
The conclusion from the above discussion is that during
balanced growth, DNA synthesis is continuous and exponential;
the replication of the DNA required almost the entire division
cycle. This mode of DNA synthesis applies to cells grown in
glucose-supplemented minimal broth or in nutrient broth. A
somewhat different pattern is indicated for cultures with
decreased growth rates, i.e., when glucose is replaced by
other carbon sources such as acetate, glycerol or even
proline (Lark, 1966; Helmstetter, 1967; Helmstetter and
Cooper, 1968).
The time of initiation of new rounds of replication and
the mode of the partitioning of the genome within the division
cycle was intensely studied for E. coli at various growth
rates. Several lines of evidence strongly suggest that DNA
synthesis starts in the middle of the division cycle for
E. coli grown in glucose minimal medium. Forro and- -

10
Wertheimer (1960) followed the distribution of grain clusters
produced by the incorporation of 3H-thymidine of cells. Their
autoradiographic analyses showed that the initiation of DNA
synthesis occurred prior to cell division, probably in the
middle of the division cycle. Recently, Clark and Maal~e
(1967) demonstrated abrupt DNA synthesis in the middle of the
division cycle of E. coli Blr with a generation time of 45
minutes in glucose minimal media. The cells were synchronized
by the membrane filter adsorption-elution technique of
Helmstetter and Cummings (1963) and the DNA synthesis pattern
was measured by pulse-labeling with 3H-thymidine. The abrupt
increase was taken to mean that growth points doubled or
initiation of a new round of replication had commenced. The
authors interpreted the results to mean that cells at division
possess 2 genomes both of which are half replicated. Genome
replication is completed after the cells are physically
separated. Additional support to the mid-cycle initiation
of DNA replication pattern of ~. coli Blr was given by
Helmstetter (1967) and Helmstetter and Cooper (1968). In
this experiment the author pulse-labeled exponential cultures
prior to adsorption on the membrane filter. The membrane
filter was inverted and conditioned media was flowed through
at a constant rate: older cells eluted first, followed by
younger daughter cells. From the analysis of the
3H-thymidine incorporation, an abrupt increase of DNA
synthesis was detected at middle of the division cycle.
11
Based on experiments by Helmstetter and Cooper (1968),
a model system of DNA replication cycles of E. coli Blr
was presented (Cooper and Helmstetter, 1968). Several
conclusions were made. (1) The time of genome replication
was constant (40 minutes) for cells with growth rates of 20
to 60 minutes. The concept of constant rate of genome repli
cation was previously stated by Maal~e and Kjeldgaard (1966).
(2) The time of initiation of DNA replication varied in a
specific relationship to the growth rates. For example,(a)
with a 60 minute doubling time, DNA replication starts at
the time of cell division, and is completed in 40 minutes,
thus there is a 20 minute period devoid of DNA synthesis,
(b) for a 40 minute doubling time, DNA synthesis starts 20
minutes prior to the time of cell division and continues for
20 more minutes and is completed at the middle of the follow
ing division cycle, (c) for a 20 minute doubling time, DNA
synthesis occurs at the onset of cell division and is completed
2 generations later. For this particular replication pattern
to exist 2 genomes per cell must be present.
A different mode of genome replication within the cell
division cycle of E. coli l5T- was summarized by Lark in his
review (1966). Lark has concluded that: (1) replication of
DNA starts at the time of cell division, (2) the rate of DNA
synthesis increases as the growth rate decreases, (3) genome
number per cell increases from one to four with respect to
growth rate increases, and (4) in succinate-minimal media,

12
2 genomes are alternately replicated within the doubling time
of 70 minutes. The contradictions of replication patterns
clearly points out that further experiments are necessary to
establish firmly the differences of ~eplication patterns
between E. coli strains B/r and l5T-.
For the purpose of the present research, the important
criteria are the time of the DNA synthesis and whether the
initiation of DNA synthesis occurs at a fixed point.
B. Mapping Experiments (Theory)
The mapping method is based on the following premises:
(1) DNA synthesis is initiated at a specified time within the
division cycle of a synchronized cell population, (2) DNA
replication is initiated at a fixed point, (3) the rate of DNA
synthesis is constant, (4) when more than one DNA molecule is
present the replication of all occurs simultaneously, (5) the
frequency of mutants is proportional to the number of cistrons
present per cell (Altenbern, 1966; Folsome, personal communi
cation) or alternatively, to the number of replication forks
(Cerdo-Olmedo, Hanawalt and Guerola, 1968). (This last point
will be discussed in more detail in Chapter VII.) (6) There
is no selection for or agains~ mutants during the segregation
period ..
Assume a hypothetical synchronized population as shown
in figure 2. Aliquots of samples are taken during the period
of DNA synthesis.
Now assume 3 loci on the genome as depicted in figure 3,
13
and perform the mapping experiment as described in the method
and material section, Chapter III.
The relative mutant frequency will show an abrupt
increase corresponding to: (1) the number of cistrons
replicated and those being replicated, or (2) the number of
cistrons being replicated (at the growth points). If the
relative mutation frequencies are proportional to the number
of specific cistrons replicated or being replicated, one
would observe an initial plateau of mutant frequencies, an
abrupt increase corresponding to the replication of the
specific marker, a second plateau and finally a decrease
corresponding to the time of physical separation of the
genome. The map time of marker loci is designated as that
time of the abrupt rise in mutant frequencies. On the other
hand, if the relative mutation frequencies are directly
correlated to cistron replication only at the growth points,
one would observe an abrupt increase of mutation frequencies
from a very low level, a peak, followed by a steep descending
slope corresponding to the passage of the replication forks.
The time of marker loci could then be taken at the peak of
the mutation frequencies (see figure 4).
The basic experimental rationale is related to the
marker frequency transfer experiments of Yoshikawa and
Sueoka (1963). The genetic map of Staphylococcus (Stonehil1
and Hutchison, 1966), Streptococcus (A1tenbern, 1966), E.
coli (Cerda-Olmedo Hanawalt, and Guero1a, 1968) and Mycoplasma

(Fo1some unpublished) have already been derived in this
manner.
14

15
Experimentsdone at thistime period
l/&ll No .~/ ~._---1------ c::
£
,..---~--,~"
~'
~"__ J
DNA
oz
o 5 10 15Time, hours
Figure 1. Hypothetical model of DNA replicationin relation to synchronously dividing cells
I
6terminus
Genetic map in time units corresponding tothe period of DNA replication
Markpr I Mark~r II Mark,r III...... I.........lL I l I I
1 2 3 4 5Map units, hours
Figure 2. Scheme of mapping experiments
A.
oorigin
•B. Mutagenesis of synchronous culture1. initiation of DNA synthesis
period of mutagenesis
2. one fourth of the DNA molecule synthesized
-- period of mutagenesis_._------------~-------_..--------',
3. one half of the DNA molecule synthesized
__•• a ••••••••••• ••• .:; period of mutagenesis---~._--------------------#
4. three fourths of the DNA molecule synthesizedperiod of mutagenesis ------------- ----------------_._------~--------------------- ---- ----- ----~

16
A. Mutation frequencies proportional to number ofcistrons present
Marker IIIII
Marker IIII
tI
Marker III
•IJIII
.+)2::l::e:Q)
>'.-4+oJ
~lQ) ..... +- .... -1
~
o 1 2 3 4
time (hrs)
5 6
B. Mutation frequencies correspond directly to thetime when the cistrons are replicated
65
I 'Marker II 'Marker III
2
•e::tQ)4...~.+oJ::l::e:Q)
.~ 2+oJC'CS
f""4Q)~
0 1 3 4time (hrs)
Figure 3. Mutation frequency patterns expected by theoryif A) mutation frequencies proportional to number ofcistrons present (Altenbern, 1966), if, B) mutationfrequencies correspond directly to the time when thecistrons are being replicated (Cerda-Olmedo, et aI,1968) -- --

CHAPTER III
MATERIALS AND METHODS
A. Organism and source
Anacystis nidulans No. 625 was obtained from the culture
collection of algae at Indiana University. The cells are
elongate and the average cell size is about 1.5 microns in
diameter and 5 microns in length. Cell size varies accord
ing to the growth conditions. The cells divide across the
long axis which leads to the formation of two daughter cells
equal in size.
B. Growth curve studies
Media used are given on table 1. A bank of 2 daylight
and 2 cool white fluorescent bulbs (40 watts, Sylvania
and/or Westinghouse) with an intensity of 200-250 ft.-candles
(at the surface of the medium) served as a source of light.
Flasks (v/v ratio of 1:10) were incubated at 32°C in a
reciprocally shaking water bath (Eberbach, Ann Arbor,
Michigan) with strokes of about 148 cycles per minute. A
3.4% CO 2 /air mixture was bubbled at a flow rate of about
40 c.c. per minute. Alternatively, the cells were grown
without C02-air mixture.
Growth was estimated by total cell count using a
Petroff-Hausser bacterial counter. Optical density measure
ments were taken at 640 nanometers on the Beckman DK 2
spectrophotometer.

18
Table 1. Media
I. Modified Detmer M medium
Solution AS.
H3B03MnClZ·4HZOZnClZCUS04· SHZO3(NH4)Z·7Mo03·HZO
Component C
gram/liter Component B. Gram/liter
Z.9 KN03 1.01.81 KZ P04 1.00.08 NaCl 0.10.08 EDTA , O.OS0.018
Agar 15.0
CaClZMgS04· 7HZOFeS04· 7HZO
II. Dm Agar
HS Solution
Co(N03)2·6HZOMnClZ·4HZOZnS04· HzOCUS04· SHZO
Component C.
0.01O.ZSO.OZ
0.491.448.8Z1.51
pH 8
Component A
KZHP04NaN03NH4ClEDTA
Gram/liter
1.01.00.10.05
Ca(N03)Z·4HZOMgS04· 7HZOFeS04· 7HZO
O.OZSO.ZS pH 7.S0.005
Solution AS and HS are filter sterilized separately andadded as 1 ml and 0.6 ml per liter respectively. Calcium,Magnesium and Ferrous salts are autoclaved and addedindividually to avoid massive precipitation.
Antibiotics polymixin B (CALBIOCHEM) and kanamycin sulfate(Bristol Laboratories, Syracuse, N.Y.) are dissolved indistilled water and filter sterilized. These antibioticsare added to the minimal salt solution, mixed, and poured into the flask containing agar (2x). The final concentrationsof polymixin B and kanamycin sulfate are 106 units and 100microgram (780 mcg/mg) per liter respectively.

19
C. Growth on agar plates
Minimal agar was made as described on table 1
(van Baalen, 1965). The inoculated plates were inverted and
incubated at room temperature under fluorescent light. To
avoid excessive desiccation of the agar, the temperature of
shelf (where the plates lie)was maintained at about 30-32°C.
Fluorescent bulbs installed under the shelf were adequate.
D. DNA determination
1. Indole method (Keck, 1956; Sueoka et aI, 1967)
A drop of formaldehyde (37%) was added per 10 ml of
culture. Cell counts were made with a Petroff-Hausser
counter with an average of 5 readings, each reading with
cells ranging about 250-800. Doubles (cells showing
recognizable cross septa) were counted as two, triples as 3
and so on. Usually 15-20 per cent are doubles and 1 per cent
are triples or quadruples. About 80 ml of cells were
centrifuged. To the pellet, 5 ml of acetone were added and
mixed. The suspension was centrifuged and the resulting
pellet was trea~ed again only if extractable chlorophyl was
detected by eye. At 0° C, 0.5 ml of D.3 N perchloric acid
was added and the precipitate was resuspended. With
occasional gentle stirring, the mixture was held in the ice
bath for 30 minutes. After this period, the cells was
centrifuged and 0.7 ml of 0.5 N perchloric acid (peA) was
added to the pellet. The cell suspension was mixed and the
tubes were put in a 70° C bath for 25 minutes a minimum of

20
shaking. Cells we~e centrifuged and the supernatant
collected. Hot PCA extraction was repeated twice and the
extracts were combined. To 1.4 ml of PCA extracted DNA,
0.7 ml of 6 N HCl and 0.7 ml of 0.06% indole were added. The
mixture was hydrolized in a 100 0 C bath for 10 minutes and
cooled immediately. Pink pigment which forms during boiling
was extracted 3-4 times with amyl acetate. The absorbance
spectrum was obtained with a Beckman DK 2. The absorbancy
values for DNA determination were taken by the difference of
A550 from A490. Fish roe DNA (CALBIOCHEM) was employed as a
standard.
2. Burton's diphenylamine method (Burton, 1956)
The cells were prepared as described above. Two ml of
cold 0.5 N PCA was added to the pellet of the acetone treated
cells. The suspension was immediately centrifuged; the
pellet was washed with 0.2 N PCA. The preparation was
centrifuged and pellet resuspended with the addition of 1 ml
of 0.5 N PCA. Two ml of diphenylamine reagent was added to
the 1 ml sample and the color was allowed to develop at 100 0
C for 10 minutes. The optical density measurements were made
at 595 and 650 nanometers. The final adjusted reading is the
difference of absorption between A595 and A650.
E. Sensitivity of Anacystis to various organic compounds
Growth inhibition by antimetabolites, analogues of amino
acids, vitamins, pyrimidines and purines and antibiotics was
tested in minimal broth and agar. Qualitative assays on

21
plates for the antimetabolites and analogues were done by
auxanographic methods (Beijerinck, 1889). Quantitative
assays for antibiotics were done by adding specified amounts
of antibiotics in 20 ml of agar or in 5 ml of minimal broth.
The cells were then inoculated and incubated in the usual
manner.
F. Inactivation by Nitrosoguanidine (NTG)
Nitrosoguanidine (Aldrich Co.) was added to final
concentrations of 100, 50, and 25 micrograms per ml to
7.5xl0 7 per ml exponential phase cells. Samples were taken
at 3-10 minutes intervals. Dilutions were made and 0.01 ml
spotted on the plates. Survivors were counted after 4 days.
The pH of the inactivation media was usually 8.0, although
other experiments were performed at pH 6.0.
Nitrosoguanidine was prepared in Dist. H20 and filter
sterilized prior to use. For inactivation experiments done
at pH 6.0, nitrosoguanidine was prepared in a 0.2 M NaH2P04
buffer adjusted to pH 6.0. The culture was centrifuged
washed and resuspended in phosphate buffer pH 6.0.
G. Inactivation by uv irradiation
Exponential phase cultures were exposed to uv
irradiation (2S73 angstrom) with a 15 watt germicidal lamp
(GIST8, General Electric) at a distance of 40 em. for
various time intervals. The irradiation was done in the
dark. Samples were taken and kept in the dark for about
8-9 hours. After this period of dark incubation, the

22
samples were diluted and 0.01 ml spotted in duplicate on
minimal agar. A control consisted of uv irradiated cells
which were immediately plated and incubated in the light.
H. Isolation of Mutants induced by NTG or by uv irradiation
Cells from the stock culture were streaked on Om
minimal agar supplemented with 0.1% nutrient broth and
0.5% glucose. A large single colony was picked and used
for these experiments. The general procedure was to treat
the cells with SO micrograms NTG per mI. At about 0.1% to
1.0% survival, the cells were diluted 1:100 in minimal broth
supplemented with about 0.1% nutrient broth and 0.5% glucose.
The flask was returned to the shaker-incubator and the cells
were allowed to segregate for 6-8 generations. Approximately
200 cells were plated on enriched minimal agar. After 2-4
days colonies were replica plated on minimal agar.
Alternatively, the penicillin selection method was used.
One to ten units of penicillin (final concentration) were
added to NTG treated cells in minimal broth. After 8 hours,
the cell were centrifuged, washed and resuspended in nutrient
enriched minimal agar with 200 cells per plate. Replica
plates were made when pinpoint colonies appeared.
The isolation procedure of mutants with uv irradiation
was performed similarly. Exponential phase cultures were
exposed to uv irradiation for 80 seconds (ca 0.1% survivors).
Five ml sample was kept in the dark for about 8 hours. The
cells were then inoculated in nutrient enriched minimal

23
broth for 6-8 generations. Approximately 200 cells were
plated on nutrient enriched minimal agar. After 4-5 days,
replica plates were made to minimal agar.
I. Heterologous 32p- DNA binding by Anacystis nidulans
A highly radioactive, 32p labeled E. coli DNA was
filtered through 0.65 microns (pore diameter) Millipore
filter and precipitated in 95% ETOH. The activity of labeled
DNA was 7.9xl06 cpm per mI. The A260/A 280 was found to be
1.9 and the concentration determined to be 162.5 micrograms
per mI.
This 32p labeled DNA was added to: (1) exponential,
(2) late exponential, (3) late lag phase, and (4) dark
incubated cultures. Final DNA concentration was about
1.68 micrograms per ml and the total activity was about
5xl04 cpm per mI. At specified time intervals, 0.1 ml
aliquots of cell-DNA mixtures were added to (1) 0.9 ml
uv buffer (Tris 5g., NaCl 5g., Na acetate 5g., MgS04·7H20
10- 3 M, 1 liter Dist. H20, pH 8.0) and (2) 0.8 ml uv buffer
plus 0.1 ml 500 microgram per ml Bovine pancreatic DNAase.
Both preparations were incubated at 37 0 C for 20 minutes,
then filtered through 0.65 microns (pore diameter) Millipore
filter and washed with chilled uv buffer. The 25 mm filtered
preparations were fitted on planchets, air dried and
counted on a Tracer-lab scaler.
J. Cell synchrony studies
Exponential cells were kept in the dark at 32 0 C in a

24
shaking water bath. A light tight condition was obtained by,
covering the flasks with two sheets of aluminum foil. A
cellophane sheet was placed over this to prevent electrolysis
of the aluminum foil. After 12 to 13 hours in the dark, the
cells were exposed to the light. Samples were periodically
assayed for total cell number, viable cells, percent doubles
and optical density. The absorption measurements were done
on,a Klett-Summerson colorimeter with a No. 54 filter
(wavelength range 620-680 nm).
K. Macromolecular synthesis in Anacystis nidulans
An exponential phase culture was grown in Om minimal
broth in which the phosphate was decreased to 0.1 gram per
liter. The effective working titer of the culture was
within the range of l-8xl0 7 cells per mI. The 32p
orthophosphate (ICN, Burbank, California) was added to give
a final concentration of approximately 20 microcuries per
mI. Aliquots of 0.1 to 0.5 ml of cells were diluted 1:10
in Dist. H20. The samples were treated according to the
specific fraction of macromolecules being assayed (see
below). The treated samples were then filtered through
Millipore filters and fastened to planchets with rubber
cement. The preparations were heat or air dried and counted
in a Baird Atomic Scaler.
A more effective medium for the labeling experiments
was to employ 27 mM final concentration HEPES
(N-2-Hydroxyethylpiperazine-N-2-ethanesulfonic acid

25
(CALBIOCHEM) buffer in place of the phosphate buffer. The
amount of K2HP04 could be decreased 500 fold with no adverse
effects on cell growth. Accordingly, the input 32p label
was decreased 10 fold.
P~otein synthesis was follow~d by the uptake of l4C_
valine (sp. act. 15.8 mC/mM, l-valine-1-14C, CALBIOCHEM).
The final concentration of the label used was approximately
1 microcuries per mI.
1. Kinetics of macromolecular synthesis in exponential
phase cells
Immediately after addition of radioactive label, a 0.5
ml aliquot was removed and placed in a nalgene centrifuge
tube (IS ml capacity) containing 4.5 ml of chilled diluent
and a drop of formalin. Additional aliquots were removed at
30 to 60 minute time intervals thereafter for 2 generations.
In the beginning it was found necessary to centrifuge and
decant the excess label in the super~atant to avoid a high
level of nonspecific binding of 32p on the filter. The
centrifugation was done with the addition of 108 carrier
cells which were previously formalin killed and chilled.
With the use of HEPES buffer, the centrifugation step was
found to be unnecessary.
The samples were treated by the method of Roodyn and
Mandel (1960) as follows:
(i). Total DNA, RNA and phospholipid in cold TCA residue
One ml of cold of 10% TCA was added to 1 ml of diluted

26
cells. After standing for 15 minutes in ice bath, the
samples were filtered through 0.45 micron Millipore filter
and washed with 5 volumes of 1% TCA.
(ii). DNA and RNA fractions in 95% ethyl alcohol residue
Two ml of 95% ethyl alcohol were added to 1 ml of
diluted cells. The preparations were then incubated at 70° C
in a water bath for 30 minutes then chilled in ice bath for
fifteen minutes. The samples were then filtered through
Millipore filter and washed with 5% TCA followed with 1% TCA.
(iii). DNA fraction in NaOH residue
One tenth ml of 5.5 M NaOH was added to 1 ml of diluted
cells. Samples were incubated at 37° C for 2 hours. A 0.1
ml of 6 N HCl was added while cooling in ice bath followed
by addition of 1.5 ml of 10% cold TCA. After standing in
ice bath for an additional 15 minutes, the samples were
filtered and washed with 5 volumes of 1% TCA.
(iv). Protein fraction in hot TCA residue
One ml of 10% TCA was added to 1 ml of diluted cells.
The samples were boiled for 30 minutes. After chilling in
ice bath for 15 minutes, the samples were filtered and
washed.
All filters were fastened to aluminum planchets and
heat or air dried. Radioactivity measurements were made
using the Baird Atomic Scaler.
The data on DNA and protein synthesis were obtained
directly, while RNA synthesis data were taken as the
27
difference between the activities of alcohol residue (RNA,
DNA) and that of the NaOH residue (DNA). The values of
phosopholipid were taken as the difference between the
activities of cold TCA fraction (RNA, DNA, phospholipid) and
that of the alcohol residue (RNA, DNA). In this and all
subsequent experiments, total cell count and viable cell
counts were made. Samples were also plated on nutrient
agar to detect contaminants.
2. Kinetics of macromolecular synthesis of synchronous
cultures
Synchronous cell cultures were obtained as described
previously. The cells, however, were prelabeled approximately
6-8 hours in the light before continuing incubation in the
dark. The samples were collected and treated as mentioned
above.
3. Kinetics of macromolecular synthesis in the dark
Exponential cells were grown and prelabeled for about
6-8 hours in light, then the flask was covered with aluminum
foil. Samples were taken with sterile 6 inch 19 gauge
needle through a side port stoppered with a serum cap and
were immediately placed in a prechilled centrifuge tube
containing one drop of formalin. The cells were then
centrifuged and prepared for assay as above.
L. Genetic mapping of Anacystis nidulans
Cultures wer~ incubated in the dark for 12-13 hours to
induce synchronous growth, then exposed to light. Samples

28
were removed at specified time intervals correlated to the
time of initiation of DNA synthesis and treated with a
standard dose (10 minutes, 100 micrograms per ml) of the
mutagen, nitrosoguanidine. Mutagen was then removed either
by centrifugation (or by filtration through a Millipore
filter). The cells were harvested in 25 mm by ISO mm test
tubes, washed once and reinoculated in a screw cap SO ml
flask. The samples were incubated in the usual manner for
about 2-3 days (ca 6-9 generations). After the end of the
segregation period, the cells were counted and plated on
Om minimal agar. About 30 spots could easily be accommodated
on a single plate. Each spot contained 200-500 colonies.
Ten spots were counted to assay the number of total colony
forming units. About 60-70 spots containing 12,000 to
30,000 colonies for each time interval, were scanned for
morphological and pigment mutants. Selective antibiotic
media when utilized were plated in duplicate in such a
manner that about 150-300 mutants would appear on each plate.
CHAPTER IV
RESULTS
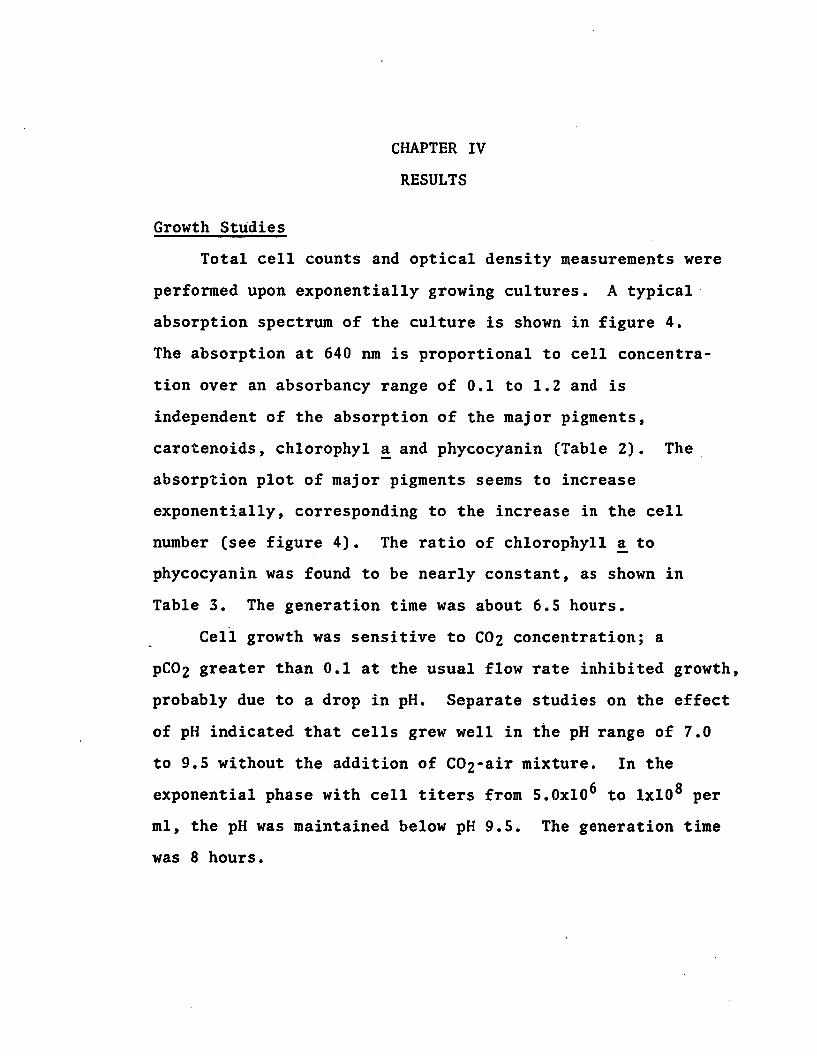
Growth Studies
Total cell counts and optical density measurements were
performed upon exponentially growing cultures. A typical
absorption spectrum of the culture is shown in figure 4.
The absorption at 640 nm is proportional to cell concentra
tion over an absorbancy range of 0.1 to 1.2 and is
independent of the absorption of the major pigments,
carotenoids, chlorophyl ! and phycocyanin (Table 2). The
absorption plot of major pigments seems to increase
exponentially, corresponding to the increase in the cell
number (see figure 4). The ratio of chlorophyll! to
phycocyanin was found to be nearly constant, as shown in
Table 3. The generation time was about 6.5 hours.
Cell growth was sensitive to C02 concentration; a
pC02 greater than 0.1 at the usual flow rate inhibited growth,
probably due to a drop in pH. Separate studies on the effect
of pH indicated that cells grew well in the pH range of 7.0
to 9.5 without the addition of C02-air mixture. In the
exponential phase with cell titers from 5.0xl06 to lxl08 per
ml, the pH was maintained below pH 9.5. The generation time
was 8 hours.

30
Table 2. Ratios of Ch1orophy1 a:phycocyanin (A6901A660) and Carotenoid:phycocyanin (A660/A530)
No.
12345678
Cells per m1(107)
1.52.53.65.29.9
10.012.714.9
0.9350.9000.9150.9100.8950.8990.8990.885
0.5900.5900.5960.6080.6200.630not done" "
INTERPRETATION OF RESULTS
Cell growth
The optimum growth response to a specified flow rate of
C02 was not clearly definable. Cultures grown in 2.5-5.0
percent C02 in air at about 40 cc per minute showed a genera
tion time of 6.5 hours. The cells were relatively small
rods with dimensions of 2.5 microns in length and 1.0 microns
in width. Cultures grown without the flow of C02-air were
significantly larger, with dimensions of 4.0 microns in
length and 1.5 microns in width. The generation time was
correspondingly longer at about 8.0-8.5 hours. A relationship
between extensive variables (pC02' light intensity) and
intensive variables (cell size, generation times) appeared to
be too complicated and not relevant to this work for further
studies at this time. In general, larger cells show longer
generation time (see figure 4). On several occasions, the

31
120 14010080604020
/"fig. 4 D~(),...,.
() ,,"0~4)'
~a:.,,,,"'" E
/~B ,,"
2 ~~A Carotenoids, 530 nm,.... B Phycocyanin, 660 run~ C C Chlorophyl a, 690 nm
• fJ~' and growtJi, 640 run/, L/ D Phycocyanin, 660 run~~ E Chlorophyl a, 690 nm~~ and growtJi, 640 run
0.8
0.6
Number of cells per ml (xlO- 6)
Figure 4. Absorption of major pigments during exponentialphase. ,For curves A,B,C, C02-air mixture was not supplied
1,40/
Fig. 5~1,2 rO1.0
.8 o 00
,.6
\4
l2O'Cb
ocP'140o 20 40 60 80 100 1~0
Number of cells per ml (xlO- )
Figure 5. Cell concentration and absorption at 640 nm
32
length of the cells was as long as 10-12 microns. This huge
variation in cell size should be considered as an important
factor in classification of Blue-green algae.
The ability to grow cells on agar plates with high
plating efficiency makes possible such experiments as replica
plating and inactivation studies. The technique suggested
by van Baalen (1965 a) of employing closed environment growth
chambers is cumbersome and not practical for large scale
genetic studies. Cells can simply be plated on Dm agar,
inverted and incubated under fluorescent light with about
100% plating efficiency. Several other Blue-green algae,
Synechococcus cedrorum, Anabaena variablilis, Phormidium sp.,
were also easily cultivatable in this fashion. Bazin (1968)
was able to grow Anacystis nidulans under fluorescent light.
It is difficult to explain the poor growth reported by van
Baalen (1965) of Blue-green algae on Dm agar under
fluorescent light.
The strict autotrophic nature of Blue-green algae in
general (Allen, 1953) and Anacystis nidulans, i~ particular
(Kratz and Myers, 1954), is well documented. In fact some
Blue-green algae are inhibited by organic acids (Allen, 1953).
The need to isolate possible heterotrophic strains warranted
a renewed effort. However, all attempts made in this study
were found to be unsuccessful. Growth on (1 gm/IOO ml)
nutrient broth-supplemented Dm minimal agar did show that"
only a fraction of the cells in a population are inhibited

(small colonial. growth) while others grow normally. The
latter colonies, when streaked on NB-Dm agar, do not grow
heterotrophically in the dark.
33
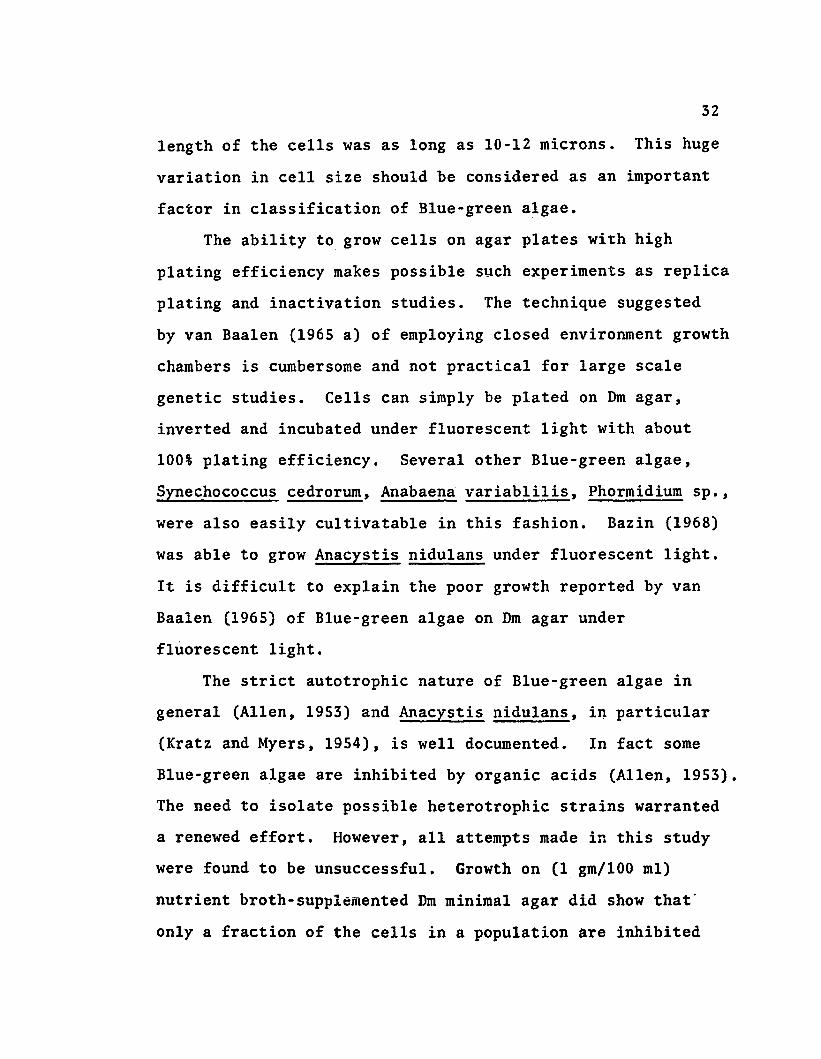
34
Figure 6. Growth curve of Anacystis nidulans
The culture was grown in Detmer's modified medium at 32° Cin shaking water bath. A mixture of 3.5% CO2-air wasbubbled at a flow rate of 40 c.c. per minute. Illuminationwas described in methods section. Cell counts were obtainedwith a Petroff-Hausser counting chamber.

302515 20TIME, hours
105o
GROWTH CURVE
9080
70
60
50
40
30
.0-b 20:B-E..
CI>0-
~w ...,.:E::>Z 10....I
9....IWu 8
7
6
5
4

CHAPTER V
RESULTS
A. Inactivation of Anacystis nidulans
Anacystis was extremely sensitive to nitrosoguanidine;
loss of colony forming units (cfu) is concentration dependent.
Survival curves at both pH 8.0 and 6.0 are shown in figures
7 and 8. The curve at pH 6.0 shows a steeper slope. The rate
of induction of minute mutants reaches a maximum at about 0.1%
survival. Dark incubation after NTG treatment did not seem to
influence either survival frequencies or mutation frequencies.
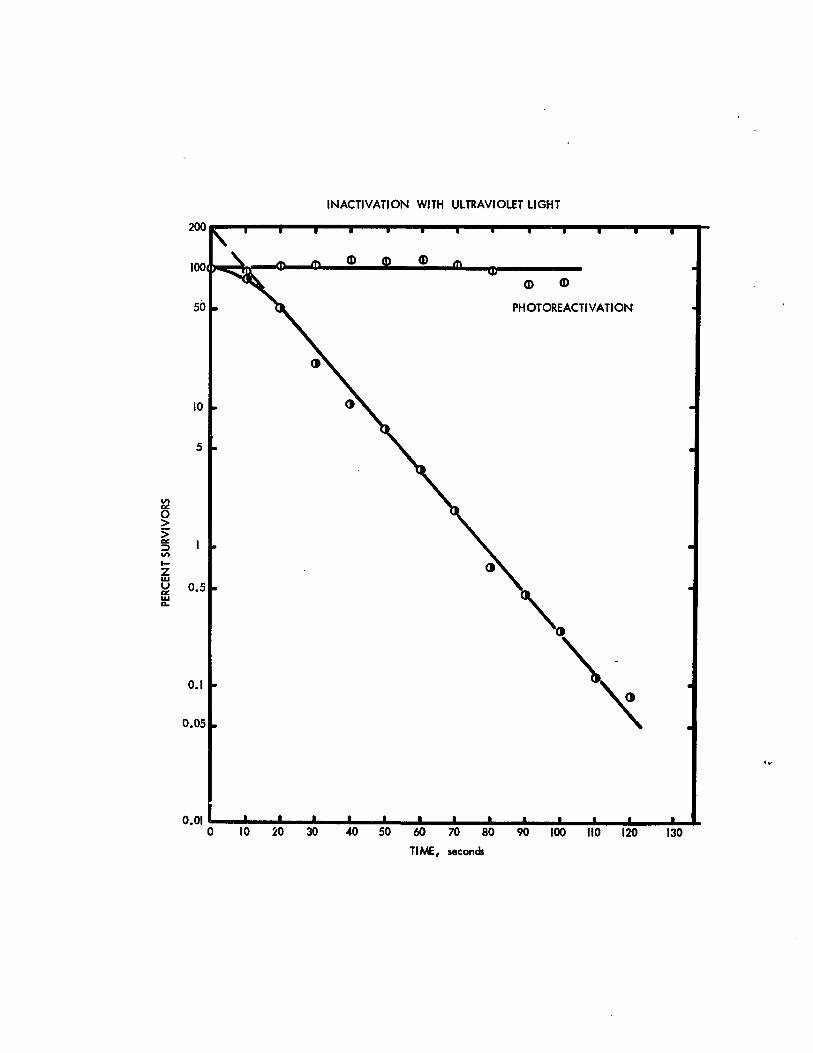
UV irradiation had little effect if the treated cells
are immediately exposed to light. When the cells were
incubated in the dark for about 8-9 hours immediately after
uv treatment an exponential survival curve was obtained with
a slope k=0.23 log 8/80 erg·cm. The high level of survivors
found when irradiated cultures were immediately incubated in
the light suggested that the cells possessed an efficient
photoreactivation mechanism. Indeed, the photoactivable
sector (Dulbecco, 1950) was calculated to be one which means
that all uv lesions are reparable. A slight shoulder in the
uv inactivation curve is seen. Extrapolation of the asymptote
to the y-axis indicates a target number of 2.
B. Isolation and characterization of mutants
Both uv irradiation and NTG exposure induced pigment,
minute and filamentous mutants in relatively high frequencies.

37
Figure 7. Survival curve of Anacystis nidulans treated with
nitrosoguanidine at pH 8.0.

NITROSOGUANIDINE INACTIVATION, pH 8.0
6050403020IQo
0.05
0.1
0.01
50.0
100.0
10.0
5.0
VI~
0>:>~
;:)VI
t- 1.0Z 25 micrograms per mlwU~WQ.
0.5
TIME, minutes

39
Figure 8. Survival curve of Anacystis nidulanstreated with nitrosoguanidine at pH 6.0
The upper control curve indicates that the slightly acidphosphate buffer had little effect on the viability of thecells. The maximum frequencies of mcf were obtained at0.2\ survivor level.

NITROSOGU ANIDINE INACTIVATION I pH 6.0
CONTROL
MINUTE COLONY FORMING MUTANTS
50 micrograms per ml
5
CD
50
10
0.01
O.ool~_ .....~~..........~_....._~_...._~_....._~_...._-,!-_"",,,,,,J 10 20 30 40
0.005
VI~
0>5= 0.5~:;)VI
....ZwU~WA.
0.1
0.05
TIME, minutes

41
Figure 9. Ultraviolet light inactivation curve
A IS watt germicidal lamp (GISTS, G.E.), irradiated mainlyat 2537 angstroms was used at a distance of 40 cm. Irradiation was done at 25°C in the dark with dim reflected light.The exponential phase culture was grown and irradiated inDetmer's minimal medium which absorbs at 2537 angstroms wit~
A = 0.37. Fifteen ml of culture at a concentration of 2xlifcells per ml was added ~o a glass petri plate. The liquidlayer was 4 mm thick. Aliquots of 0.25 ml were taken leavinga final volume of about 10 mI. The cell suspension wasgently swirled by hand upon irradiation. Two samples pertime interval were taken. One set was kept in the dark fornine hours while the other was diluted, plated and incubatedin the light. A survival curve with a slope k = 0.23 log5/50 erg·cm was generated for the dark incubated samples.The set of samples which were immediately exposed to fluorescent light showed a photoreactivable sector of one.
INACTIVATION WITH ULTRAVIOLET LIGHT
(I) (I)
PHOTOREACTIVATION
(I)
5
10
II)0::o>:>0::=>II)
I-ZwU0::wQ.
<••
0.01~~~~~~_~~~_~_~~~~~~~~~~~~~ ...o 10 ~o 30 70 80 90 100 110 120 130
TIME, seconds

43
Figure 10. Absorption spectra of yellow pigment mutant y3.The absorption spectra was obtained with Beckman DK 2spectrophotometer.

ABSORPTION SPECTRUM OF YELLOW MUTANT (Y-3)
o25 450 475 500 550 600 700
WAVELENGTH (nanometers)

45
Two classes of pigment mutants could be distinguished. Yellow
mutants began growth on the plate .as. slightly greenish but
before the attainment of maximum size turned yellow and there
after grew very slowly. These cells were not dead, since
upon restreaking a similar pattern of growth occurred.
Absorption spectra at the yellow stage showed very low levels
of chlorophyl ~ and phycocyanin as seen in figure 10.
Revertants occurred at a frequency of about 10-7 • The
reversing of the mutant character indicated that this
particular phenotype is directly related to a genetic defect.
Various organic substances and conditions were employed
to test the mutant for phenotypic repair. Addition of N03-,
NH4Cl, succinate pyruvate, acetate, glucose, nutrient broth,
yeast extracts and casein hydrolysates individually seemed to
have no effect. Raising the pH was found to promote a
definite phenotypic character as shown in Table 3.
Table 3. Effect of pH on the Yellow pigment mutant
pH Wild Type control yellow mutant blue mutantGrowth Color Growth Color Growth Color
6.06.57.0 2+ green 2+ green 2+ blue7.S 4+ " 4+ green 4+ "8.0 4+ " 4+ yellow 4+ "8.S 4+ " 4+ " 4+ "9.0 4+ " 4+ " 4+ "9.S 4+ " 4+ " 4+ "
-,2+, 4+, stands for none, fair, and good growth respectively

46
Large scale attempts to isolate auxotrophic mutants
were not successful. Approximately 8.0xl04 colonies from 5
experiments were screened by the replica plate method. Many
hundreds of suspected colonies were isolated and tested.
Both uv irradiation and nitrosoguanidine treatments at pH
6.0 and 8.0 and the penicillin selection methods were used.
The isolation of auxotroph~ from obligate photoautotrophs
appears to be a major and separate problem. However, the
other mutants, morphological, pigment, antibiotic resistance,
are sufficient for this work.
Interpretation of Results
A. Isolation of mutants induced by uv irradiation and
nitrosoguanidine
1. Efficacy of mutagen used
The induction of mutations by uv irradiation has long
been a standard method in genetics. Its efficacy of inducing
mutations in the Blue-green algae Anabaena cycadeae Reinke
(Singh and Singh, 1964 a,b; Singh, H.N. 1967) was reported.
In this report studies of uv irradiated cells of Anacystis
nidulans are presented: uv irradiation induced minute and
filamentous mutants. Perhaps other classes of mutants
probably could be isolated if further studies were conducted.
The chemical mutagen, nitrosoguanidine, is a relatively
new and potent mutagen (Mandell and Greenberg, 1960). It is
rapidly being recognized as a highly efficient mutagen
(Eisenstark et aI, 1965; Adelberg, =!!l, 1965): in some

47
cases as many as 42% of the survivors are auxotrophic mutants.
The mode of action is not clearly understood. N~erosoguanidine
decomposes to nitrous acid in acid pH (Mandell and Greenberg,
1960) and to diazomethane in alkaline pH (McKay, 1948).
Nitrosoguanidine significantly alters guanine moiety (Singer
and Fraenkel-Conrat, 1967). An alkylation product of
guanidine has been identified as 7-methylguanine due to
nitrosoguanidine treatment (Magee and Farber, 1962; Craddock,
1968). The mutagens, nitrosoguanidine and diethyl sulfate, an
alkylating agent, have similar mutagenic property (Eisenstark,
!1 aI, 1965). Nitrosoguanidine is most effective when the
nucleic acid polymers are in a certain conformational state
(Singer and Fraenkel-Conrat, 1967). Transforming factor of
B. subtilis is inhibited by about 40% when treated with NTG
in vitro while 50% inhibition was recorded from extracted DNA
in which the cells were first treated with NTG. Recently, it
was suggested that nitrosoguanidine acts most specifically at
the replication forks of E. coli (Cerda-Olmedo et aI, 1968).
The present experiments indicate that replicated portion of
the DNA molecule are equally as mutagenic as the replicating
forks (see the discussion in mapping).
Both NTG induced transitions GC to AT to GC were found
with S. trphimurium (Eisenstark ~ aI, 1965) and S13 phage
(Baker and Tessman, 1968) while the one way transition, GC
to AT, predominates in T4 phage.
It is interesting to note that nitrosoguanidine also

o HII IN N-HI II
CH3-N-C-N-N02 + KOH
48
N-methyl-N'-Nitro-N-Nitrosoguanidine Diazomethane
Generation of diazomethane from NTG (McKay, 1968)
guanidine 7-methyl guanidine
Site of action of diazomethane (Magee and Farber,1962)
Figure 11. Chemical characteristics of nitrosoguanidine
affects ribosomal RNA and proteins (Cerda-Olmedo and Hanawalt,
1967). Messenger and transfer RNA could very well be affected.
The degree to which these factors affect mutagenicity or the
cell survival is not known. The fact remains, however, that
nitrosoguanidine is a powerful and bona fide mutagen.
B. Isolation and characterization of mutants
Minute mutants occurred at frequencies of 3.74xlO-3
(NTG) and S.8xlO- 2 (UV) at about 0.1%-1.0% survivor levels.
The morphology of these mutant cells was normal which indicated
that the minute colony phenotype can be ascribed to slow growth.
These mutants resemble the respiratory mutants of Saccharomyces

49
(Nordstrom, 1967).
Nitrosoguanidine-induced filamentous mutants occurred
at a frequency of 2.lxlO- 3 with O.l-l.Ot survivors. These
mutants were easily distinguishable in their rhizoid
appearance.
The pigment mutants appeared to be an interesting class
of mutants. It is not known whether the imparied cistrons
were directly related to photosynthetic apparatus. On the
other hand, it is not likely that the yellow mutants represent
a general class of pH sensitive mutants. This is evidenced
by the fact that the yellow pigment mutants presumably map at
specific locus (see mapping discussion).
The present studies and others (van Baalen, 1965; Kumar,
1968) with nitrosoguanidine on Blue-green algae indicated
that mutants can be isolated in relatively high frequencies.
UV irradiation is another useful mutagen if care is taken to
prevent photoreactivation (Singh and Singh, 1964a,b; Singh,
1964). The isolation of auxotrophs, on the other hand, was
unsuccessful with this standard method. An explanation for
the lack of auxotrophs and alternate suggestion for their
isolation will be discussed in Chapter VIII.

CHAPTER VI·
RESULTS
A. Cell synchrony
Cell synchrony, as determined by total cell counts,
viable cell counts and per cent doubles, was highly reprodu
cible. The per cent doubles value was an independent
indication of synchrony and included the values of triplets
and quadruplets which are scored as one and two respectively.
Larger chain structures were present in very low frequencies
and were usually scored by counting the number of cells in
the chains and dividing by two. The time interval from the
formation of cross walls to the separation of individual
daughter cells has not been determined. The slightly positive
skew in the % doubles as shown in figure 12 indicated a longer
time was required for completion of cell separation than forma
tion of cross walls. This is also evidenced by the fact that
the viable count lags behind the total cell count. The per
cent doubles is a more sensitive index of cell synchrony.
However, all subsequent discussion on cell synchrony will be
in terms of cell doublings.
The pattern of abrupt cell increases in synchronous
culture differed slightly with respect to the media used. In
Detmer medium the increases were usually at the 4th, and 14th
hours after exposure to light (see figure 12). The 3rd
division cycle was not studied. Synchronized cultures in

51
Figure 12. Induced cell synchrony of Anacystis nidu1ans
Exponential phase culture in Detmer's medium were kept inthe dark for 12 hours. Upon exposing to light, total cellcount, viable cell count, and per cent doubles were obtained.The cell number increase was initiated at 4 and 14 hoursafter exposing to light. The maximum peaks of per centdoubles correspond to the mid-point of the cell divisioncycle. This pattern of synchronous was repeatable.

DARK INDUCED CELL SYNCHRON Y
15
VIW-'<0::::>oo
'0 ....Zw
~WQ.
2218 2014 1612108642
LIGHTINCUBATION
'2o
DARKINCUBATION
o5
3
-'-'wU
10
E.. 25CDQ.
'"W<0::E::::>Z
TIME, hours

53
HEPES buffered Dm medium showed abrupt cell increases at 4th,
13th and 21st hours. The explanation for these differences
in the pattern of abrupt increases will become apparent in
the discussion section.
B. Incorporation of radioactive labels by exponential phase
culture
The rates of macromolecular synthesis for exponential
phase cultures and dark phase cultures must be established
before any data on synchronous cultures can be interpreted.
The rates of incorporation of 32p orthophosphate in DNA,
RNA, and phospholipid fraction and of l4C-valine in protein
fractions were determined for exponential phase cultures.
Labels were rapidly incorporated in all fractions from the
time of addition of labels to approximately 4-5 hours.
Thereafter, incorporation continued at exponential growth
rates. In the initial studies large amounts of 32p were
retained on the Millipore filters, which were linearly pro
portional to the amount of label being filtered. Generally,
the threshold level of non-specific binding is about 0.001
microcuries which was found to be independent of the cells
added. It was, therefore, found necessary to filter the
label through Millipore filter before use. Added precautions
such as centrifugation of the samples to remove excess label
in the supernatant greatly improved the results. Use of HEPES
buffer in later experiments greatly improved the efficiency
of 32p uptake. The amount of label used could be decreased

54
Figure 13. Incorporation of labels by exponential phaseculture
The culture was grown in Detmer's minimal medium withphosphat~2level decreased 10-fold. The final concentration of P was 20 microcuries per mI. The samples werecentrifuged as described in methods section to removeexcess labels. The final concentration of l4C-valinefor protein determination was 0.2 microcuries per mI.The chemical determination of DNA was done with theindole method.

RATES OF MAC.ROMOLECULAR SYNTHESIS
__---r-_-"T"'"-.,...-r--...,~~-_r-'"T""-_r_-r_-r_..,10
31
)('
9...Y
5~,...Zc~
""m
'""tlClI...
-e
50
100
500
10Rb-!S. 5 e CELL NUMBERE o COLD TCA RESIDUE,32p- • ETOH RESIDUE, 32p0.. t> NAOH RESIDUE, 32p
GICD HOT TCA RESIDUE, 14C-VALINEQ.
:= Q DNA, CHEMICAL DETERMINATIONS"-u 100
0.5 50 ~n'"0G)
'"~~
0.1 10
O ...._&-......I-:-.....~--II-.--II.-.....I.-~_~_~_......~......._~_~_-!o 2 3 4 5 6 7 8 9 10 11 12 13 14
TIME, hours

56
Figure 14. Rates of macromolecular synthesis byexponential phase culture
The DNA andfigure 13.obtained bysection.
protein fraction are the same as that ofThe RNA and phospholipid values weredifferences as described in the method

o
...-....-----...-...~----...--...----.... ...,.
0
~ii:
V)::;
w Oz:I:.... :1:_
ZD.w
> «0 ....V) ZZ:l:~0::
e O::OD.D.
< OQee-'::::>uw '"-' ...0
j
:E0
.c
0 ..0::
V)
UW
~:Ej::::
u.0V)
uj::::wZ~
"'_~ ~_~""' ~_.....lL- ..Jogoo 0III 0 III

58
Figure 15. Incorporation of labels by synchronous culture
The culture was grown in HEPES buffered Dm minimal medium.Cell synchrony was induced by the light-dark regimen. Thefinal concentration of 32p and l4C-valine was 0.5 and 0.2microcuries per ml respectively. This figure shows datafrom three separate experiments, A,B,C.

-1:5..Gla.
:E~
u
40
20
10
8
6
4
o.
0.4
0.2
INCORPORATION OF RADIOACTIVE LABELS
c
(J)~(J).(J) (J)
fl)~ 0 COLD TCA RESIDUE, 3~p
~• ETOH RESIDUE, 32pCD PROTEIN FRACTION, 14C-VALINE
(D
(I)'I
0.1o 2 4 6 8 10 12 14 16 18 20 22 24
TIME, hours26 28

60
Figure 16. Rate of DNA synthesis of synchronous culture
The cells were grown in HEPES buffered Dm minimal mediumin which the potassium dibasic phosphate was decreased to2 mg per liter. Curve A: incorporation of 32p in DNAfraction from the average of triplicate samples. Curve C:exponential phase cUlture, dgubling time of 7.5 hours,maximum cell titer of 1.4xlO cells per mI. Curve D:synchronous cell growth. The interdivision times arerounded to the nearest half hour. The final concentrationof 32p was 0.5 microcuries per mI. Triplicate samples(0.1 ml each) were taken for DNA measurements. Curve B:DNA determinations using the indole method; ten ml aliquotswere sampled in duplicate. Dm minimal medium was used forthe experiment.
RATES OF DNA SYNTHESIS OF SYNCHRONIZED CELL GROWTH
2420 ~210 1286
......~--- 9.5 hrs--~......!--- 8.0 hn - ..........
42
oo
20
Mb::B-E
0 10 10..IIQ.
~8 8
A.U n
m
6 r-6 r-
ZC~
""m
'"4 4 ~
~
a'j(-9...)l
2 2
TIME, houn
62
about 50-100 fold. Centrifugation was found to optional
since only a low level (90-200 cpm) retention resulted. The
low level counts were less than 10% of total counts at the
time when exponential rates of incorporation are maintained.
These counts on the filters were either ignored or sub
tracted from all subsequent samples. Figure 13 shows typical
kinetics of 32p incorporation in various fractions.
Theoretically calculated rates of label incorporation into
DNA, according to Roberts et al (1963, showed an identical
curve to that of the observed. Differences between ETOH
residues minus NaOH residues, and cold TCA minus ETOH residues
generated respectively RNA and phospholipid values. The
observed amounts of RNA, DNA and phospholipid are not
significantly different from those found for E. coli (see
Roberts et aI, 1963). For Anacystis the values found were
62% RNA, 20\ DNA and 18% phospholipid.
C. Incorporation of radioactive labels by synchronous cells
Cultures were exposed to label for 6-8 hours prior to
the dark incubation. The procedure was similar to that
mentioned in the previous section.
1. Protein synthesis
The rate of protein synthesis is noticeably accelerated
up to the 5th hour in the post-dark period. This increase
corresponds fairly well with upsurge of RNA synthesis.
Thereafter, the specific rate of protein synthesis is
constant and maintains an exponential course.

63
2. RNA synthesis
Since RNA synthesis is a calculated value, it could not
be clearly followed in synchronous cultures. The DNA fraction
makes up about 20% of the total macromolecular fractions
analyzable by the method. Thus the DNA synthesis at specific
time intervals does influence the overall curve of RNA
synthesis. Nonetheless, the rate of RNA synthesis increases
greatly in the first 3 hours of post-dark period and con
tinues a constant exponential rate thereafter.
3. Phospholipid synthesis
The rate of phospholipid synthesis is accelerated in the
first 3 hours of the post-dark period. The synthesis
attained an exponential rate after this period of rapid
synthesis.
4. DNA synthesis
Several experiments were made which consistently
indicated that surges of DNA synthesis occurred at specific
times after dark incubation, each surge occuring prior to
cell divisions. Since DNA synthesis is noticeable at these
times only, the rate of DNA synthesis is assumed to corres
pond to the rate of replication of the genome(s). Extra
chromosomal DNA synthesis cannot be resolved by the present
method. The first increase (see figure 16) comes at about
2-3 hours after dark incubation and 1-2 hours before cell
division. The duration of DNA synthesis is 7 hours. Cell
division takes place at the 4th hour, that is, three hours

64
before initiation of DNA synthesis. The second increase
occured at 10th hour post-dark. The duration of DNA synthesis
is 6 hours and final amount is about double at the plateau
regions. This pattern of DNA synthesis within the first and
second division cycle has been repeatedly detected by
chemical methods.
DNA synchrony is consistently obtained along with the
synchrony of cell division. Those few experiments which did
not show cell synchrony also fa.iled to show DNA synchrony.
Table 4. Incorporation of labels in the dark
Time Cell No. NaOH Cold TCA ETOH Hot TCA(in hrs) residue fraction residue residua
(cpm)a (cpm)b (cpm)C (cpm)
0 1.85xlO7 600 1080 1075 3200
12 2.00xl07 620 1120 1090 400
aDNA 32p
bDNA , RNA, phospholipid -- __ 32p
cDNA, RNA ------------------ 32p
dprotein ------------------- (14C-valine)
Interpretation of Results
Cell synchrony and rate of macromolecular synthesis
Synchronous cell division can be demonstrated after
incubation of exponential cells in the dark for 12 hours.

65
the minimum period of dark incubation necessary to induce
cell synchrony has not been determined. The times of abrupt
increase of cell number in Om or modified Detmer's media
occurred at the 4th and l~th hour post-dark period. However,
when HEPES buffer was substituted for phosphate buffer the
increases were observed at 4th, 13th and 21st hours. The
discrepencies of the second increase are explicable since
the cell sizes were slightly smaller (approximately 3.5
microns in length) in HEPES buffered Om broth.
Correspondingly, the generation time is about 7.5-8.0 hours •.-
The interdivision time of 9.5 hours observed between
the 1st and 2nd division cycle could be attributed to the
slow rate of recovery to exponential rate of macromolecular
synthesis. Perhaps, structures such as ribosomes and
photosynthetic lamellae in optimum amounts are made only after
the first division period. The 3rd division period has not
been fully characterized while beyond this no effort was made
in discerning the pattern of cell division. It is possible
that the 7.5-8.0 hours interdivision times will be maintained
in subsequent division cycles and that natural division times
are an integral factor of circadian rhythms.
Balanced physiological growth was found to accompany
synchronously dividing cells. The high initial rates of
protein, RNA, and phospholipid synthesis suggested that in
the dark period, substantial physiological activities are
taking place. At the outset, major residual cellular

66
activities in the dark period were thought to be the
completion of DNA synthesis and subsequent cell divisions.
However, significant increases in RNA, phospholipids and DNA
fractions could not be detected in the dark period (see Table
4). The protein fraction, on the other hand, increased about
6% while cell number about 5%. Residual protein synthesis
was seen within the first 5 hours.
The periodicity of the DNA synthesis cycle has thus been
demonstrated for Anacystis nidulans. The initiation of DNA
replication occurred approximately 2-3 hours before the
initiation of cell division. This pattern was repeatable and
was independent of the generation times. The length of the
gap of DNA synthetic periods varied from experiment to
experiment.
Quantitative DNA estimation data suggested similar
periodic patterns of DNA synthesis in synchronous cultures.
The DNA content at the time when no DNA synthesis occurs is
about 7.35xl0 9 daltons per cell as compared to l.06xlOlO
daltons of exponentially grown heterogeneously replicating
cell population. This lower value reflects the minimum
number of genomes per cell. The genome of Anacystis nidulans
could either consist of 2 units about the size of E. coli
genome (mw of ca 2.5xl09 daltons) or one large unit of molecular
weight ca 7.35xlOlO daltons.
From these data it is difficult to explain the manner in
which newly synthesized genomes are equipartitioned. Two

67
alternative models can be considered. The first is the
partitioning of 2 equal genomes which are replicating just
prior but through the cell division period. This model rules
out the one large genome concept of Anacystis. The second
model states that two or more genomes are replicated and
subsequently equipartitioned to two daughter cells. It is
not clear whether the septum forms between two replicating
genomes or between four replicated genomes. The former is
suggested by the data. The latter model, however, cannot be
ruled out.

CHAPTER VII
RESULTS
Mapping experiments
Sequential mutagenic treatments of synchronized cultures
were timed to coincide with the period of DNA synthesis. The
initiation of DNA synthesis was previously found to occur at
the 10th hour in a synchronized culture. In figure 17, the
sequential mutation frequencies of minute colony formers
(mcf), "snakes" (sna), yellow (yel) and blue .(blu) pigment,
Polymixin B (pmbr ) and Kanamycin (kanr ) resistant mutants
are shown. The data (except for pmbr and kanr mutants)
represent sum of the results of 2 independent experiments in
each of which mcf, sna, yel, and blu were followed. The
marker specific temporal order of the mutation frequency
slopes served as an internal control.
Constant mutation frequencies throughout exponential
growth were observed over a period of 4 hours. The standard
deviations of mutant frequencies were relatively large. This
limited the precision of the mapping experiments. One of the
reasons for the large standard deviation was the formation of
chains (4 to 6 cells) which occurred randomly in about one
fourth of the flasks. The reasons for chain formation were
not clearly definable, although it is possible that chain
formation was caused by the release of proteins, polypeptides,
amino acids in excessive amounts by dead cells. In previous

69
experiments, growth of cultures in minimal broth supplemented
by 1% nutrient broth induced chain structures. Unfortunately,
the effect of chain formation on mutation frequencies was
not carefully studied. From one set of experiments mutation
frequencies were found to be lower than average.
The limited choice of mutant phenotypes seriously
hampered extensive mapping experiments. Antibiotic resistant
phenotypes are potentially the best characters to work with,
however, they are somewhat difficult to handle because cells
were resistant only over a narrow range of concentrations.
The morphological and pigment mutant phenotypes, therefore,
had to be relied upon. Since these mutant phenotypes cannot
be selected, and since the frequency of occurrences were
relatively low, statistically adequate numbers of mutants
cannot be assayed. The number of "snake," for example,
occurred in frequencies of I.OxlO- 3• Of 30,000 colonies
scanned per time interval only about 90 mutants were found.
The relatively low occurrences of assayable mutants severely
limited the precision of the experiments.

70
Table S. Mutation frequency of exponential phase culture
Mutant average frequency(xlO-3)
standard deviation(xlO- 3)
Blues 2.98 :tl.19..~
Yellows 1.81 :to.64
Minutes 3.74 :tl.13
Snakes 1.01 :to.3l
Polymixin B (r) 0.48 :to.lOS
Kanamycin (r) not done not done

71
Figure 17. Mutation frequencies of synchronous culture
The cells were grown in Dm medium. The open circlesrepresent mutation frequencies of a synchronous culture.The relative mutation frequencies are plotted. The timescale of the ordinate is in minutes. The origin coincides to the time when the second cycle of DNA synthesisis initiated at the 10th ho~r of synchronous growth. Thecurves shown are a composite of two independent experiments(except for pmbr and kanr ). For each set of experiments,4-6 markers were analyzed. The ascending slopes weredetermined regression lines (see Appendix II). Standarderror of estimate (2Sy •x) were also determined for each ofthe slopes. The temporal ordeT between experiments werein close agreement. This temporal order is 60 min.(pmbr ), 70 min. (blu), 73 min. (yel), 83 min. (sna), 110min. (mcf) and 140 min. (kanr ). The dark circles representthe relative mutation frequencies of two exponential phasecontrol cultures.

- o
oo
o
o0---0-0-
D. sna1.5
1.0
0.5
• 1.5
• • •~ • • • 1.0
•• • • • • ~... •C> • ...VI
C>
5 0.5 -'
Z 1.5oc(
0 B. blu E.lIICf 0 i=... Z:t:
w
U ;00 0 zz 0> 0 0 0 D.
VI ~...oo~
0 1.0 000/
...0
VI 0W
VI
Uw
Z '", u
wZ
::>w
" 00 1.5 8w 0.5... w... ....... • • ...Z • • • ....~ • • ~~ _4!t •• 1.0 iw • •> • • • w
S, • ~
w 1.5S... 0.5 ~
0
. 1.00
\ F. uor0 0 0
0.5O·
1.5
0
•• •• 0
• • 0...... 1.0
• 0
• •0.5
0 3 .. 0 2TIME, houn

INTERPRETATION
Genetic map of Anacystis nidulans
The mapping experiments are valid if all constraints
(see theory) are satisfied. The time of DNA synthesis
within a division cycle has been demonstrated. It is not
proven that this DNA synthesis is initiated at a fixed point
on the chromosome. This factor is critical since synchronous
DNA synthesis does not mean that the cistrons are replicated
synchronously. The fact that marker frequencies occur in a
repeatable order and approximately at the same time, implies
that the DNA of Anacystis nidulans does indeed replicate at
one fixed point.
Only one abrupt increase was detected for each of markers
mapped. If two identical genomes per cell replicated alter
nately, two corresponding abrupt increases should have been
detected. Previously, a one large genome concept had been
ruled out as demonstrated by the DNA synthesis-cell division
cycle since DNA synthesis continues throughout the cell
division cycle. The mapping data, therefore, indicated that
the genome of Anacysti~ nidulans consists of 2 or more
identical genomes which replicate simultaneously. However,
other models of genome organizations (refer to Chap. VIII)
are not ruled out.
At the outset, frequencies of mutants were expected to
be proportional to the number of cistrons or alternatively

74
to the number of growth points present per cell. The present
experimental data showed an initial plateau, an increase of
mutant frequencies, a second plateau and then a drop (although
not always) corresponding to the partitioning of the genome.
The plateau regions suggested that the replicated portion is
equally mutable as the replication points.
A direct contradiction to this notion has been reported
recently by Cerda-Olmedo, et al (1968) when E.coli was
mapped in a similar manner. The authors contended that the
frequency of mutation was directly related to the number of
replicating figures present at a specific time interval.
This inference was based upon their observation that the
frequency of occurrences of mutants increased and decreased
without attaining a plateau for any length of time. A sharp
peaking, however, was not obtained. This was attributed to
the lack of perfect DNA synchrony derivable by their amino
acid starvation method. However, the relatively high
frequency of mutants when the majority of cell was not
replicating DNA cannot be simply attributed to the lack of
perfect DNA synchrony.
Despite these limitations, mutation frequencies of
synchronous cultures demonstrate discernable increases for
each of the markers followed. The slopes of the increases
were plotted by calculating regression lines (see appendix
II). The extrapolate to the suggested initial plateau
was taken as the location of the markers. The time in

75
hours of occurrences of the markers are as follows: pmbr ,
11:00, blu, 11:10, yel, 11:13, sna, 11:23, mdf, 11:50 and
kanr , 12:20. These time units could then be converted to a
genetic map in corrected time units. The initiation of DNA
synthesis occuring at 10th hour will be designated as the
origin of the map. The corrected times were 60, 70, 73, 83,
110 and 140 minutes for pmbr , b1u, ye1, sna, mcf, and kanr
pmbr
b1u --kanr
ye1--- mcfsna-
terminus...-- - --foolfoo4!--...........--t~--+ - - - -I- - - - + - - - ---t
180 240 ~OO 360o '60
//.origin
pmbr b'lu yel sna mcf kanr
Figure 18. Genetic man of Anacystis nidu1ans
The bars represent standard errors of estimates (2Sy'X),The loci for the markers were determined by regression lines.
respectively (figure 18). The entire map will consist of
360 minutes corresponding to the 'length of time of the DNA
synthesis.

CHAPTER VI I I
DISCUSSION AND SPECULATION
Auxotrophy
The inability to isolate auxotrophs in the present study
is a major problem which is either technical or intrinsic and
resul t of ge:letic structuring. A clearly defined auxotroph
of Blue-green algae is yet to be isolated. However, Singh
and Singh (1964a) did isolate an apparent glucose auxotroph
only after a second dose of uv irradiation of a previously
irradiated isolate.
The apparent absence of auxotrophs of Anacystis nidulans
is paralleled by the low incidence of auxotrophs in other
photosynthetic eucaryotes and higher plants. Li et al (1967)
made a comparative survey from the literature of several
procaryotes, eucaryotes and higher plants which encompassed
representatives of different phylogenetic levels. For
example, while thiamine mutants are commonly isolated from
heterotrophs and photosynthetic groups, other nutritional
mutants of photoautotrophs are found in either very low
frequencies or none at all. The authors have concluded that
these differences are significant and could not be due to
differences in variability fro: laboratories, or to the
specific methods utilized.
Several reasons were given to account for these
discrepencies in the mutation frequency of nutritional mutants:

77
(1) extensive duplication of genes (2) coexistence of alternate
pathways in photoautotrophs (3) coupling of basic biochemical
reactions to photosynthesis or other photochemical processes
and (4) differences leading to differential mutant survival.
These factors will be discussed in an effort to gain an
insight in the isolation of auxotrophs of Blue-green algae.
A. Specific relationship of basic biochemical reactions and
the metabolites of photochemical processes
Is the physiology and the "mechanics" of obligate
photoautotrophy so unique that a barrier of some kind pre
cludes the possibilities in the formation of auxotrophs?
The "permeability barrier" (Kratz and Myers, 1954; Umbreit,
1962) could no longer be used as a major explanation since
radioactive labeled organic acids and amino acids (Allison
et aI, 1954; Hoare, 1964; Smith ~ aI, 1967; Pearce and Carr,
1967) were shown to be taken up in relatively large amounts.
Qualitatively, this study demonstrated that a variety of
simple and complex substances can permeate Anacystis nidulans
as judged by the inhibition studies. Quantitatively, the
extent of labeling of all organic compounds derived from
l4C-acetate was about 10% (Smith ~ aI, 1967) to 18% (Pearce
and Carr, 1967) for Anacystis nidulans. The manner in which
the metabolites of the Calvin cycle influenced the labeling
pattern was difficult to elucidate. The obligate photoauto
trophs did npt incorporate organic substrate in the dark.
(Allison !! aI, 1954; Smith et aI, 1967) •.

78
The incorporation of carbon compounds such as
l4C-acetate was confined significantly to the lipid fraction,
glutamate, and certain carboxylic acids (Allison, et aI, 1954).
Other experiments (Hoare, 1965; Smith et aI, 1967) demonstrated
that proline, arginine and leucine were detectably labeled.
It is not clear why other compounds are not labeled in a
detectable quantity. For example, aspartic acids could be
transaminated from oxaloacetic acid derived through the
glyoxalic acid cycle (Pearce and Carr, 1967). On the other
hand, arginine synthesis was affected by a feedback regulation
(Hoare and Hoare, 1966). Correspondingly, arginine was
labeled in detectable quantity. It is difficult to conclude
that the labeling pattern found was solely due to regulation
or non-regulation.
It is difficult to explain how the complex network of
metabolic systems affect auxotrophy. Auxotrophy requires an
inactivation of a single cistron. A specific amino acid
requirement, for example glutamic acid, when added
exogenously should sustain the growth of the potential
glutamic acid auxotroph. The defect of a single cistron
should have no affect on the general metabolism of the cell.
The possibility exists in that the rate of exogenously
supplied nutrient is severely low enough to cause such an
imbalance which eventually becomes lethal. Mutant survival
in this manner is not likely to be an important factor in
this hypothetical case since glutamic acid is highly

79
permeable.
Perhaps only those obligate photoautrophs of Blue-green
algae which could yield auxotrophs are those that could be
grown heterotrophically in the dark. Future experiments
would then have to be designed so that mutagenesis is carried
out in the dark and rely solely on heterotrophic growth.
B. Alternate pathways
The assumption of a unity of biochemistry of cell systems
has been so predominant that novel or alternate biochemical
paths have not been looked for or ignored (Cohen, 1963).
Indeed, Vogel (1963, 1965) showed that there exist two
alternate pathways in the biosynthesis of lysine by organisms
representative of phylogenetically distinct groups. The
amino adipic acid (AAA) pathway was found to predominate in
fungi and protozoa while the diamino pimelic acid (DAP)
pathway was found in bacteria, including Blue-green algae,
green algae and higher plants. Aside from the evolutionary
implication, the data imply that an organism has either AAA
or DAP path, but not both. Although this lysine system
represents a single case, other biosynthetic pathways will
presumably show the same pattern. This being the case, the
alternate pathway notion cannot explain the problem of lack
of auxotrophy in Anacystis nidulans and other obligate
photoautotrophs.
C. Duplication of genes
Duplication of genes can be obtained in several ways.

80
One of these is the duplication of the entire set as in
polyploidy. Chlamydomonas eugametos is apparently a
naturally occuring polyploid since the chromosome number is
twice that of C. reinhardi (Schaecter and DeLamater, 1955).
The target number produced by x-ray irradiation indicated
twice the number as (haploid) C. reinhardi (Whetera11 and
Krauss, 1954).
The duplicated chromosomes of C. eugametos has been
proposed to be responsible for the survival of subnormal
colony forming (minute) mutants (Wethera11 and Krauss, 1954).
The inference made was that inactivation of a vital gene is
compensated by the occurrence of the duplicate genes. As a
result, a slower growth rate is responsible for the subnormal
colony size.
In bacteria, a tandem duplication of genes and
subsequent differentiation of the genes are thought to be the
manner in which operons are formed (Horowitz, 1966). This
notion of gene evolution was proposed earlier by Lewis (1951).
However, no explicit evidence of duplicate genes performing
the identical function has been demonstrated in the
procaryotes. Obviously, copied genes exist in the bacterial
cell, but they are on separate rep1icons. These rep1icons
are nonrandom1y segregated as shown by autoradiographic
studies (Forro and Wertheimer, 1960; Forro, 1965; van
Tubergen and Set1ow, 1961; Lark and Bird, 1965). Inactivation
of a cistron after a period of segregation will eventually

81
result in auxotrophy.
Similar types of experiments on Blue-green algae can be
performed to explore the genomic organization as it relates
to auxotrophy. Possible experimen~s will be discussed below.
Physiological factors will contribute vitally to the
problem of auxotrophy. The genetic explanation for lack of
auxotrophs due to duplicated genes within a replicon or
segregating unit seems logical and promising. The eventual
answer for this fundamental problem of auxotrophy, however,
could be due to both genetic and physiological reasons.
Since the solution or elucidation of the problem of auxotrophy
are at present vague and obscure, it was felt justified to
consider genetic models (see figure 18) which may lead to
the understanding of this problem.
The model IV (Folsome, personal communication) consists
of two partially identical circular replicons joined together
as a common unit by a non-DNA material. This, in the
terminology of Jacob, Brenner, Cuzin (1963) is the replicator.
The majority of cistrons are now in duplicate but not in a
linear or tandem fashion. It is important to note that not
all cistrons occur in duplicate. The cistrons coding for
amino acids, for example, are thought to be duplicated. The
pa=tially duplicated replicon model is schematically depicted
in figure 18 and the segregation pattern of the genome is
shown in 19.
Experiments could be designed, according to the model,

82
to isolate auxatrophs. The obvious experiment is to search
for partial mutants (one of the duplicate cistrons being
inactivated). These partial mutants are assumed to be among
the sumbnormal or minute colonies which are obtained in
high frequencies by nitrosoguanidine treatment. On preliminary
screening, the partial mutant must be stimulated to wild type
growth by a specific nutrient. Upon additional treatment
with mutagen, a complete auxotroph is expected and one which
require the same nutrient formally required by the partial
mutant. To further check the validity of this result,
mutation frequencies could be compared. Frequencies leading
from WT to partial and partial mutant to complete auxotroph
should be equal. The frequencies leading directly from WT to
complete auxotroph or the reverse mutation should be much
lower since the frequencies will be the product two mutational
events.
Another possible genetic experiment is to study the
formation of sectored colonies. Witkin (1953) had demonstrated
that when E. coli B/r is plated on EMB agar immediately after
uv irradiation an increased ratio of sectored colonies over
intact, nonsectored colonies occurred. Since the ratios were
strongly related to the number of nucloids per cell, it led
to the conclusion that sectored colonies are due to genome
segregation. Similar type of experiments could be carried
out but with two modifications: (1) E. coli cultures are
grown synchronously, (2) chemical mutagen is added at the

83
time when lactose operon is replicating. The cells are washed
free of the mutagen and immediately plated on EMB agar. It
is expected that quarter sectored and half sectored colonies
will be obtained in higher frequencies than other types of
sectored colonies. Poisson distribution of sectored colonies
could be used to evaluate the mode of genome segregation. Now
consider a similar experiment with Anacystis niduJ.ans.
Pigment phenotypes could be used for the purpose of these
experiments. Comparison of the types and distribution of
the sectored colonies could give added information on the
genomic organization.
A variation of this experiment is the 32p-suicide (Stent
and Fuerst, 1955) of pulse-labeled synchronous culture. The
cultures after given the pUlse are quickly frozen with liquid
nitrogen. Daily samples are then plated to assay the surviv
ing fraction. In a cell with 2 or more independent genomes,
one would expect characteristic slope patterns dependant upon
the mode of replication and segregation of the structure.
Experiments described above and others may reveal
fundamental differences of genomic organization of "simple"
procaryotes, "complexH procaryotes, and simple eucaryotes.

84
Models of possible chromosome organization of Anacystisnidulans
Model I. one la!ge replicon Model II. two identicalreplicons; cistrons arenot d'l.:pl icated
Model IV. fused partiallyduplicated replicons;certain cistrons areduplicated
~~~~==-replicato~
Model III. two independentreplicons, cistrons aretandemly duplicated
Figure 19. Models of possible chromosome organization ofAnacystis nidulans:
Model I.
Model II.
Model III.
Model IV.
The DNA synthetic and cell division patternrule out this modelThis model is identical to the E. coli model.Model II suggests that absence or rarity ofauxotrophs is solely a physiological problem.The tandem duplication of cistrons modelcould account for the lack of auxotrophs.This model explains the lack of auxotrophsequally well as model III. The distinctionbetween model III and IV may be difficultto demonstrate.

85
replication ofgenome
I.'
both arepartialmutants
non-randomsegregationof genomes
wildt~ k2 0ia~u::~~rOPhiC
comPlete? ~auxotrophic
mutants
Figure 20. Hypothetical schema of mutagenesis according tothe partially duplicated replicon model. The frequencieskl, k2, k3, k4 are equal. However, the one-step forward orbackward mutation frequencies are the product of the halfstep mutation frequencies.

CHAPTER VIII
CONCLUSIONS
This study demonstrates the potential utility of
Anacystisnidulans for genetic studies and permits the
conclusions listed below:
A. Inactivation and mutagertesis with nitrosoguanidine
and uv irradiation
(1) The inactivation rate of Anacystis with NTG was
concentration dependent. Nitrosoguanidine-induced blue (blu)
and yellow (~) pigment, filamentous (~), minute colony
formers (mcf) , polymixin B (pmbr ) and kanamycin (kanr )
resistant mutants occurred at frequencies of 2.98xlO- 3 (blu),
1.8xlO- 3 (~), 1.OxlO- 3 (sna), 3.7xlO- 3 (mcf) and 4.8xlO- 4
(pmbr ).
(2) UV irradiation inactivated Anacystis if the
irradiated culture was incubated in the for nine hours
before exposing to light. Although frequency data were
not recorded, both sna and mcf mutants were induced. If the
uv irradiated cultures were exposed to light immediately after
treatment, there was complete photorecovery.
(3) Attempts to isolate auxotrophic mutants failed.
Approximately 8.0xl04 mutagen treated surviving colonies
were screened with replica plate method. The lack of
auxotrophs was thought to be significant, therefore, genetic
models were constructed in an attempt to explain the inability
87
to isolate auxotrophs.
B. Cell synchrony and macromolecular synthesis
(1) Light-dark regimen induced synchronous growth of
Anacystis.
(2) RNA, protein and phospholipid synthesis occurred
with continuous and exponential rates.
(3) DNA synthesis was periodic and was initiated 3 hours
prior to cell division. The duration of DNA synthesis was
6-7 hours with a cell doubling time of 8.0 hours.
C. Genetic mapping experiments
(1) Mutagenesis performed with nitrosoguanidine during
the period of DNA synthesis showed a doubling of mutation
frequencies for the six markers followed. It was concluded
that the nitrosoguanidine-induced mutations were proportional
to the number of replicated cistron~ and cistrons being
replicated.
(2) The observed increases in the mutation frequencies
of 6 markers occurred in a specific temporal order. Increases
of marker frequencies were analyzed by plotting regression
lines. The initial increase in marker frequencies as
designated as the time of specific cistron replication.
A genetic map of Anacystis nidulans was constructed relative
the temporal order of specific marker increase. The loci
of six markers were pmbr , blu, ~, ~, mcf and kanr in
that temporal order.

APPENDIX I
MISCELLANEOUS EXPERIMENTS
A. DNA determination by colorimetric methods
Chemical methods of DNA determination is given on
Table 6. The diphenylamine method gave higher values than
the indole method. This is not due to the pigment, phycocyanin,
which absorbs at 620 nm, since the color of phycocyanin was
destroyed by making the PCA treated pellet slightly alkaline
with NaC03.
In the indole method, DNA at times was difficult to
extract with hot PCA. On several occasions, DNA determina
tions included that material obtained from the pellet. Since
DNA values obtained in this manner were neither significantly
lower nor higher than those obtained in the usual manner, the
values from the pellet were always included when found.
B. Heterologous DNA binding by Anacystis nidulans
A genetic recombination method is needed in order to do
other meaningful genetic studies. Recent reports on sexual
or parasexual genetic transfer remain to be fully established.
A strong possibility of genetic transfer is transduction,
since virulent phycoviruses have been found (Safferman and
Morris, 1963). It is believed that lysogenic Blue-green
algae exist. The induction of temperate phycovirus from
"lysogenic" Blue-green algae may be a fruitful area of future
studies.

Table 6.
Number ofexperiments
89
Determination of DNA content per cell
DNA content per cell in daltonsindole method diphenylamine method
(xlO lO) (xlO lO )
123456789
10
0.80.861.221.151.051.170.820.891.521.15
1.252.55
average DNAcontent per cell: 1.06xlOlO
standard deviation: to.2lxlO lO
1.5xlOlO
to.SxlO lO
Another means of genetic exchange is transformation.
The present study of binding 32P-labeled ~. coli DNA is
promising. Binding results are given in figure 21 for
(1) exponential phase, (2) late exponential, (3) late lag
phase, and (4) dark incubated cell. The data indicate that
there was no DNA'ase resistant DNA binding for all growth
phases tested up to 2-3 hours. On the other hand, there seems
to be an instantaneous DNA'ase sensitive binding of 32p-DNA •
There is a good possibility that DNA'ase sensitive binding
exhibited may lead to DNA'ase resistant binding. Extensive
studies on the proper conditions for this to occur were not

90
pursued. One possibility, which was then overlooked, is the
time factor. It was observed that transformation was found
in Hydrogenomonas only after a prolonged incubation period
of DNA-cell complex (Ziobro and DeCicco, 1966). Future
experiments should take the time factor into account.
Furthermore, now that the cells can be synchronized, DNA
uptake studies may be done with respect to different
physiological states of the culture.
C. Effect of antibiotics, antimetabolit~s, and analogues
of amino acids and purines and pyrimidines
These experiments were done to survey the range and
types of substances which inhibit the growth of Anacystis.
With this knowledge, various types of resistant mutants could
be isolated. As shown in Table 6, Anacystis was found to be
highly sensitive to several antibiotics. Lack of response to
base analogues and antimetabolites cannot be attributed to
either insensitivity or impermeability.

91
4020o
500
100
•••••
I
B. LATE EXPONENTIALPHASI~
o 000o 00 0
o
o 0
A. EXPONENTIAL PHASE
o 0oo o o
••••••••o . 50 100 o 50 100
TIME, minutes TIME, minutes
12•
93o200100
•O....t-__--4....--_t--I--..-.....J~-.l...C......L.....~-....J
o
LAG.
C. LATE PHASE D. DARK INCUBATION
20 0 500
0 0 015 OQ 0 0
00 0 0
TIME, minutes TIME, hours
Figure 21. 32p-DNA (E. coli) Binding by ~lcystis nidu1ans

Table 7. Antiobiotic Sensitivity
92
Antibiotic microgram/ml minimal broth minimal plate
1 GPolymixin B 5 NG
(CALBIOCHEM, 10 NGCalif. ) 20 NG G
50 NG NG
0.8 G GChloramphenicol 0.9 G G
(Parke, Davis 1.0 GCo., Sidney, 1.6 NG
Australia) 2.0 WG NG4.0 G
0.08 G GStreptomycin 0.1 G
(Glaxo-Allensbury 0.2 WGPty, Ltd. 0.4 NG NGMelbourne,Aust.) 0.8 NG
Kanamycin 0.1 G(Bristol lab. 0.5 NGSyracuse, N.Y.) 1.0 NG
units/ml
Penicillin 0.006 G G(Sigma Chemical 0.02 WG GCo., St. Louis, 0.08 NG NGMo. ) 0.16 NG NG
0.4 NG
G-growth; WG-weak growth; NG-no growth

93
Table 8. Inhibition by base analogues
diameter of inhibition
6-azaguanine8-azaguanine2-aminopurine6-methyl aminopurineS-aminouracilS-bromodeoxyuridinoS-carboxyuracilS-nitrouracilS-methyl cytosinethiouracil
I.Scm
3cm
2SCJb (grew after 2 days)
Table 9. Inhibition by antimetabolites,amino acid and vitamin analogues
diameter of inhibition
antimetabolitesDL-methionine sulfoxidebeta-2-thienylalanine
amino acid analoguesalpha-methyl-DL-methionineDL-ethioninebeta-mercapto-DL-valine3-amillotyrosineS-methy-DL-tryptophan
vitamin analoguesaminopterindesthiobiotinoxythiaminepantoyl taurine
lcm
20cmlcm2.Scm

APPENDIX II. STATISTICS
Table 10. Relative mutant frequencies
94
No.Time(hrs)
Relative Mutant frequenciespmbr kanr ye1 b1u mcf sna
1 0.00 0.6 0.71 0.45 0.68 0.2572 0.25 0.5 0.88 0.55 n.535 0.6353 0.50 0.66 0.41 0.62 0.60 0.57 0.5354 0.75 0.80 0.53 0.67 0.60 0.612 0.695 1.25 0.69 0.715 0.68 0.68 0.97 0.686 1.50 1.05 0.55 0.54 0.62 0.76 0.677 1. 75 0.94 0.214 1.09 1.01 0.745 0.698 2.00 1.15 0.426 1.35 1.23 0.982 1.289 2.25 1.05 0.54 1.45 1.04 1.09 1.12
10 2.50 1.30 1.98 1.34 1.06 0.86 1.1911 2.75 1.09 1.52 1.40 1.23 1.14 1.7612 3.00 1.09 1.28 1.23 0.985 1.38 1.2513 3.25 1.21 1.24 1.57 1.04 1.34 1.4714 3.50 1.24 1.54 1.37 1.03 1.4 1.3315 3.75 1.15 1.46 1.15 0.90 1.05 1.2416 4.00 1.10 1.24 0.82 0.825 1.28 1.6617 4.25 1.10 0.86 0.815 1.42 1.3618 4.75 1.52 0.5 0.70 0.795 1.57 1.2319 5.00 0.84 1.12 0.8020 5.25 1.18 0.74 1.4721 5.50 1.19

Table 11. Regression line of Yellow mutant
95
Case time (hrs) X Y y2 XY calculated Y
1 1.5 6 0.54 0.29' 3.24 0.692 1. 75 7 1.09 1.08 7.63 0.9533 2.0 8 1.35 1.82 10.80 1.2144 2.25 9 1.45 2.10 13.05 1.475
Sum 5 30 4.43 5.29 34.72 2Sy •X= ±0.25
Table 12. Regression line of blue mutant
Case time (hrs) X Y y2 XY calculated Y
1 1. 25 5 0.68 0.46 3.4 0.422 1.50 6 0.62 0.38 3.70 0.693 1.75 7 1.01 1.02 7.07 0.9584 2.0 8 1.35 1.81 10.80 1.23
Sum 5 26 3.66 3.67 24.99 2Sy •X• 0.29
Table 13. Regression line of mcf
Case time (hrs) X Y y2 XY calculated Y
1 2.25 9 1.09 1.19 9.81 0.8132 2.5 10 0.86 0.74 8.60 0.9883 2.75 11 1.14 1.30 12.54 1.1624 3.0 12 1.38 1.90 16.56 1.3675 3.25 13 1.34 1.80 17.42 1.51
Sum 5 55 5.81 6.93 64.93 2Sy.X= ±0.24

96
Table 14. Regression line of sna
Case time (hrs) X Y y2 Xy calculated Y
1 1.5 6 0.67 0.45 4.02 0.4252 1.75 7 0.69 0.48 4.83 0.773 2.0 8 1.28 1.64 10.24 1.124 2.25 9 1.12 1.25 10.08 1.45
Sum 4 30 3.76 3.82 29.24 2Sy •X= :1:0.42
Table 15. Regression line of pmbr
Case time (hrs) X Y y2 Xy calculated Y
1 1. 25 5 0.69 0.476 3.45 0.6472 1. 50 6 1.06 1.10 6.30 0.843 1.75 7 0.94 0.88 6.58 1.004 2.0 8 1.15 1.32 9.20 1.18
Sum 4 26 3.83 3.78 25.53 2Sy.X= :1:0.22
Table 16. Regression line of kanr
Case time (hrs) X Y y2 Xy calculated Y
1 2.25 9 0.54 0.29 4.86 0.2552 2.50 10 1.98 3.80 19.80 0.813 2.75 11 1.52 2.30 16.72 1.804 3.00 12 1.29 1.66 15.48 2.83
Sum 4 42 5.33 8.05 56.86 2Sy.X=. :1:0.48
BIBLIOGRAPHY
Abbo, F.E. and Pardee, A.B. (1960). Biochim. Biophys. Acta.39, 478.
Abe, M. and Tomizawa, J. (1968). Proc. Nat1. Acad. Sci.,Wash. 58, 1911-1918.
Ade1berg, E.A., Mandel, M. and Chen, G.C.C. (1965). Biochem.Biophys. Res. Comm. 18, 788Q
Allen, M.B. (1952). Arch. Mikrobio1. 17; 34-53.
Allison, R.K., Skipper, H.E., Reid, M.R., Short, W.A. andHogan, G.L. (1953). J. BioI. Chem. 204; 197-205.
A1tenbern, R.A. (1966) • Biochem. Biophys. Res. Comm. 25,346-354.
A1tenbern, R.A. (1967). Biochem. Biophys. Res. Comm. 29,799-807.
Baker, R. and Tessman, I. (1968) • J. Mol. BioI. 35, 439.- -Bazin, M.J. (1968). Nature, 218, 282-287.
Beijerinck, N.W. (1889) • Arch. Neer1and. Sci. Ex. Nature.23, 367-372.
Bonhoeffer, F. and Gierer, A. (1963). J. Mol. BioI. 7, 534540.
Brock, T.D. (i~u7). Science, 158, 1012-1019.
Burton, K. (1956). Biochem. J. 62, 315-323.
Butler, R.G. and Umbreit, W.W. (1966). J. Bacterio1. 91,661-666.
Cairns, J. (1961). J. Mol. BioI. 3, 756-761.
Cerda-Olmedo, E., Hanawalt, P.C. and Guero1a, N., (1968).J. Mol. BioI. 33, 705-719.
Cloud, D.E. Jr. (1965). Science, 148, 27.
Cohen, S.S. and Barner, H.D. (1954). Proc. Nat1. Acad. Sci.,Wash. 40, 885.
Cooper, A. and Helmstetter, C.E. (1968).519-540.
J.' Mol. BioI. 31,
Cutler, R.G. and Evans, J.E. (1966). J. Bacterio1. 91, 469-476.

Proc. Natl.
98
Cuzin, F. and Jacob, F. (1967). Ann. Inst. Pasteur. 112,529-545.
Dulbecco, R. (1950). J. B'acteriol. 59, 329
Echlin, P. and Morris, I. (1965). BioI. Rev. 40, 147-187.
Edelman, M., Swinton, D., Schiff, J.A., Epstein, H.I. andZeldin, B. (1967). Bacteriol. ~. 31, 315-331.
Eisenstark, A., Eisenstark, R. and Van Sickle, R. (1965)Mut. Res. 2, 1-10.
Gafron, H. (1960). The Origins of Prebiological Systemsand of their MoIeCular MatrICes (S. Fox, ed.)New YOrk: Academic Press.
Good, N.E., Wingst, G.D., Winter, W., Connolly, T.W.,Izawa, S. and Singh, R.M.M. (1966) Biochem. 5, 467-477.
Hall, W.T. and Claus, G. (1967). J. Phycol. 3, 37-51.
Helmstetter, C.E. (1967). J. Mol. BioI. 24,417-427.
Helmstetter, C.E. and Cooper, S. (1968). J. Mol. BioI.31, 507-518.
Helmstetter, C.E. and Cummings, D.J. (1963).Acad. Sci., Wash. SO, 767, 774.
Hoare, D.S. and Hoare, S.L. (1966). J. Bacterio1. 92,375-379.
Hoare, D.S. and Moore, R.B. (1965). Biochim. Biophys. Acta.109, 622-625.
Holm-Hansen, O. (1963). Science, 139, 1059-1060.
Holm-Hansen, O. (1968). Ann. Rev. Microbiol. 22,47-70.
Jacob, J., Brenner, S. an~ Cuzin, F. (1963). Cold SpringHarb. ~. Quant. B1ol. 28, 329-348.
Jacob~ F. and Wollman, E.L. (1964). Sexuality and Geneticsof Bacteria. New York: Academic Press. ---
Keck, K. (1956). Arch. Biochem.' Biophys. 63, 446.
Kratz, W. A. and Myers, J. (1955). 'Ann. 'Jour.B'ot. 42,282-287. - ---

99
Kratz, W.A., and Myers, J. (1955). Plant Physio1. 30,275-280.
Kumar, H.D. (1968). Arch. fur Mikrobio1. 63, 95
Lark, K.G. (1966 ). Bacterial. Rev. 30, 3-32.
Lark, K.G., Repko. T. and Hoffman, E.J. (1963). Biochim.Biophys. Acta. 76, 9-24.
Levitt, J. (1951). Ann. Rev. Plant. Physio1. 2, 245-268.
Li, S.L., Redei, G.P., and Gowans, C.S. (1967). Malec.Gen. Genetics 100, 77-83.
Lipman, C.B. (1941). ~. Torrey Bot. Club. 6a, 664-666.
Maa1~e, o. and Hanawalt, P.C. (1961). J. Mol. BioI.3, 144-155. -
Maa1~e, o. and Kje1dgaard, N.O. (1966). In Control ofMacromolecular Synthesis. New York:-W.A. BenJWM1n, Inc.
Magee, P.N. and Farber, E. (1962) • Biochem. J., 83, 114-124.
Maruyama, Y. and Yanagita, T. (1956a). J. Bacterial.71, 542-546.
Maruyama, Y. and Yanagita, T. (1956b). J. Bacterial. 72, 821.
McFall, E. and Stent, G.S. (1959) • Biochim, Biophys. Acta.34, 580-582.
McKay, A.F. (1948). J. Ame~. Chem. Soc. 70, 1974-1975.
Mese1sen, M. and Stahl. F.W. (1958). Proc. Nat1. Acad. Sci.,Wash. 44, 671-682.
Murray, R.G.E. (1962). ~. Soc. Gen. Microbial. Cambridge.
Nagata, T. (1963). Proc. Nat1. Acad. Sci., Wash. 49, 551-559.
Nordstrom, K. (1967). J. Gen. Microbial. 48,277-281.
Pascher, G. (1914). Ber. Deut·sch. Hot. Ges. 32, 339-351.
Pearce, J. and Carr, N.G. (1966).· J.Gen. Microbial. 45
Pearce, J. and Carr, N.G. (1967). J. Gen. Microbial. 49, 301
Pika1ek, P. (1967). Nature, 215, 666-667.

Proc. Nat1.
100
Pringsheim, E.G. (1949). Bacterio1. Rev. 13, 47-98.
Pritchard, R.H. and Lark, K.G. (1964). J. Mol. BioI. 9,288-307. --- -----
Roberts, R.B., Cowie, D.B. Abelson, P.H. Bolton, E.T. andBritten, R.T. (1955). Studies of Biosynthesis inEscherichia coli. In Carnegie Tnst. wash. PUb1:-607
Roodyn, D.B. and Mandel, H.G. (1960). Biochim. Biophys.Acta. 41, 80-88.
Safferman, R.S. and Morris, M.E. (1963) •. Science 140, 679680.
Sagan, L. (1967). J. Theoret. BioI. 14, 225-274.
Schaector, M. and DeLamater, E.D. (1955). Amer. J. Bot.42, 417-422. ----- -
Singer, B. and Fraenke1-Conrat, H. (1967).Acad. Sci., Wash. 58, 234-239.
Singh, R.N. (1961). Role of Blue-green Algae in NitrogenEconomy of Indian-xgriCulture. New Delhi:-Ind.Counc. Agricul. Res.
Singh, R.N., and Singh, H.N. (1964a). Arch. Microbio1.48, 109-117.
(1964b). Arch. Microbio1. 48, 118-121
Singh, R.N. and Sinha, R. (1965). Nature 207, 782
Smith, A.J., London, J. and Stanier, R.Y. (1967). J.Bacterio1. 94, 972-983
Stanier, R.Y. (1964). The Bacteria vol. V. Academic Press,Inc., New York
Stanier, R.Y. and van Nie1, C.B. (1962). Arch Mikrobio1.42, 17-35.
Stanier, R.Y. and van Nie1, C.B. (1941). J. Bacterio1. 42,437-466.
Starr, R.C. (1965). Amer. J.Bot. 5, 1013-1044.
Stent, G.S. and Fuerst, C.R. (1955). J. Gen. Physio1., 38,441-458.

101
Stonehi11, E.H. and Hutchison, D.J. (1966). J. Bacterial.92, 136
Sueoka, N., Chiang, K.S., and Kates, J.R. (1967). J. MolBioI. 25, 47-66 - ---
Terawaki, A. and Greenberg, J. (1965). Biochim. Biophys.Acta. 95, 173-176
Umbreit, W.W. (1962). Bacterial. Rev. 26, 145-150
van Baa1en, C. (1965b). Science 149, 70
van Baa1en, C. (1965a). J. Phyco1. 1, 19-22
Vogel, H.J. (1962) Genetics, 47, 992
Watanabe, A. (1960). J. Gen. Applied Microbial. 6, 283-292
_________• (1956). Bot. Mag., Tokyo, 69, 530.
Wetherell, D.F. and Krauss, R.W. (1957). Am. J. Bot. 44,609-619
Witkin, E. (1953). Cold Spr. Har. Svmn. Quant. BioI. 22,357-372. ---- --- ~ - ---
Walk, B., Newman, A. and Glaser, D.A. (1968). J. Mol. BioI.32, 611-629. - --- ----
Yoshikawa, H. and Sueoka, N. (1963). Proc. Nat1. Acad. Sci.Wash. 49, 559-566. --- ---
Young, E.l. and Eitz-Jam~s, P.C. (1959). Nature, 183, 372373
Ziobro, M. and DeCicco, B.T. (1966). Bacterial. Proc. 66, 30


![i UniversityMicrofilms, Inc., AnnArbor, Michigan · 2014-06-13 · S1SfttiTICS, FOOD AND FtJlI:TIONAL!!)RPBDIDGI OF!HE F!!DDG APPA!ATUS OF SOD DOl[[]) NtJJ)J]llWI33 A mBSIS S1JEIIIftII)](https://img.pdfslide.net/doc/110x75/5e8b2ddc195ac34bff0a5f1f/i-universitymicrofilms-inc-annarbor-michigan-2014-06-13-s1sfttitics-food.jpg)