Embed Size (px)
Citation preview
i2iTracks
Population Health Analytics (iPHA)
Custom Reports & Dashboards
377 Riverside Drive, Suite 300 Franklin, TN 37064
707-575-7100 www.i2ipophealth.com
Table of Contents
Creating iPHA Custom Reports Overview ....................................................................................... 4
Report Design Tips .......................................................................................................................... 4
Helpful hints when creating your first reports ........................................................................... 5
Develop a Custom Report Template ........................................................................................... 6
How to access iPHA Custom Reports .............................................................................................. 7
How to Create and Design a Report ............................................................................................... 9
General Tab ............................................................................................................................... 10
Defined Fields Tab ..................................................................................................................... 11
Audit Fields Tab ......................................................................................................................... 22
Report Design Tab ..................................................................................................................... 25
Report Structure ................................................................................................................... 25
Report Name ............................................................................................................................. 25
Report Sections ......................................................................................................................... 25
Report Areas ............................................................................................................................. 26
Report Items ............................................................................................................................. 27
Report Sub-Items ...................................................................................................................... 28
Design: Report Sections ....................................................................................................... 31
Design: Report Areas............................................................................................................ 32
Design: Report Items ............................................................................................................ 33
Count Items ....................................................................................................................... 34
Value Items ....................................................................................................................... 35
Multi Items ........................................................................................................................ 36
Text Items.......................................................................................................................... 37
Running & Printing a Custom Report ............................................................................................ 38
Enabling a Custom Report ............................................................................................................ 42
Exporting Reports ......................................................................................................................... 43
Importing Reports ......................................................................................................................... 44
Mapping Imported Reports .......................................................................................................... 48
Creating iPHA Custom Graphs Overview ...................................................................................... 53
Creating iPHA Custom Graphs ...................................................................................................... 53
Displaying and Printing a Graph ................................................................................................... 60
....................................................................................................................................................... 62
Enabling a Custom Graph ......................................................................................................... 63
Dashboard on i2iTracks Today Screen ...................................................................................... 64
i2iTracks Population Health Analytics: Custom Reports & Dashboards
3 iPHA Custom Reports & Dashboards Revision Date 11/8/2017 All rights reserved. No part of this document shall be reproduced, stored in a retrieval system, or transmitted by any means, electronic, mechanical, photocopying, recording, or otherwise, without written permission from i2i Systems, Inc.
Exporting and Importing Graphs................................................................................................... 66
Glossary of Terms ......................................................................................................................... 68
i2iTracks Population Health Analytics: Custom Reports & Dashboards
4 iPHA Custom Reports & Dashboards Revision Date 11/8/2017 All rights reserved. No part of this document shall be reproduced, stored in a retrieval system, or transmitted by any means, electronic, mechanical, photocopying, recording, or otherwise, without written permission from i2i Systems, Inc.
Creating iPHA Custom Reports Overview
Creating an iPHA Custom Report is a multi-step process that involves the report definition and a report design. The following is a brief overview of the steps you will take to create a new custom report. Each step is explained in detail in the sections that follow:
1. Understand how a report is structured and develop a custom report template. This will help you
create and define the requirements for the report and design the layout.
2. Select the data elements (fields and filters) you want to use in the report from the Data Element
Manager.
3. Design your Report.
a. Assign your report a title.
b. Select the data elements from the library and define their parameters.
c. Identify the main Patient Population and any Sub-Populations you want to use in your
report.
d. Select the audit fields (data/details) that you would like to display for each patient when
printing an audit list.
e. Create the design/layout of the report – add sections, areas, and items.
4. Review and audit your printed report for accuracy.
5. Enable the report for use by other users so they will see the report in their Select a Report menu
when running reports.
Report Design Tips
Before you begin to create a custom report, you should have a good understanding of the report you want to create. Take some time to think about:
• How do you want to title your report?
• Define each of your report denominators. What group (or groups) of patients do you want to
include in your report? Be specific. For example:
Active patients in the diabetes tracking type who have had at least one visit in the past year
Female patients between the ages of 18-64
All active patients
o The percentages in the report are calculated using these groups as the denominator.
• Define all of your numerators. What statistics do you want to include on your report? For
example:
How many patients received diabetes education, a flu shot, an HbA1c test, a foot check, etc.
How many women received a mammogram, a pap, etc.
i2iTracks Population Health Analytics: Custom Reports & Dashboards
5 iPHA Custom Reports & Dashboards Revision Date 11/8/2017 All rights reserved. No part of this document shall be reproduced, stored in a retrieval system, or transmitted by any means, electronic, mechanical, photocopying, recording, or otherwise, without written permission from i2i Systems, Inc.
o How do you want the statistic to be broken down? (by age or age ranges, gender, race,
by value ranges, etc.)
o What audit data do you want to include? (patient’s age, LDL value, smoking status value,
received date, etc.)
o The percentages in the report are calculated using these items as the numerators.
• What are the data elements you will need to use when creating your denominators,
numerators, and audits? For example:
Diabetes Tracking Type; HbA1c value; had at least 1 visit; Smoking Status; Had a pap; Had a Mammogram
• What filters will you need to use to narrow down your line items? For example:
Active AND Have Diabetes Tracking Type AND have 1 visit in last 1 year
Female AND Age between 18-64
Helpful hints when creating your first reports
When creating your first few reports, start with an easy report – for one population. You may want to start with a report that you have already created, perhaps a section of a health registry report. (Make sure it is a health registry report that you thoroughly understand how it is configured.)
As you begin, it is wise to save and run the report often to make sure the report is coming out the way you want to see the data. For example, after creating your first section, save the report and run it – you’ll see how the report is taking shape each time it is run. Then add an area, save the report and run it again. Each time verify the data looks the way you expect it to look. Now add an item and repeat the print. Add a sub-item and repeat the print again. Repeat this process until you feel really comfortable with how your report looks and the data is coming out the way you expect. You may want to create a Patient Search in i2iTracks to verify the data from the search matches the data on your iPHA report.
On your second report, it is a good idea to save and run the report repeatedly, but not as often. Make it a rule of thumb to save and run it after finishing each section.
i2iTracks Population Health Analytics: Custom Reports & Dashboards
6 iPHA Custom Reports & Dashboards Revision Date 11/8/2017 All rights reserved. No part of this document shall be reproduced, stored in a retrieval system, or transmitted by any means, electronic, mechanical, photocopying, recording, or otherwise, without written permission from i2i Systems, Inc.
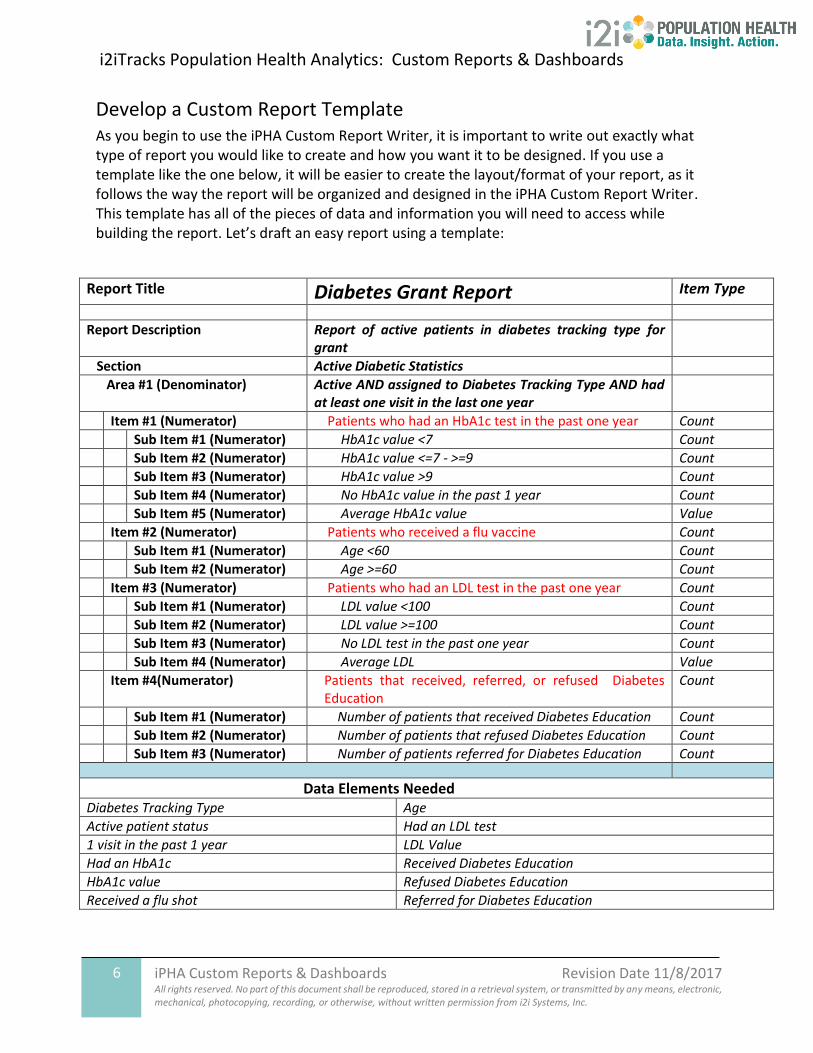
Develop a Custom Report Template As you begin to use the iPHA Custom Report Writer, it is important to write out exactly what type of report you would like to create and how you want it to be designed. If you use a template like the one below, it will be easier to create the layout/format of your report, as it follows the way the report will be organized and designed in the iPHA Custom Report Writer. This template has all of the pieces of data and information you will need to access while building the report. Let’s draft an easy report using a template:
Report Title Diabetes Grant Report Item Type
Report Description Report of active patients in diabetes tracking type for grant
Section Active Diabetic Statistics
Area #1 (Denominator) Active AND assigned to Diabetes Tracking Type AND had at least one visit in the last one year
Item #1 (Numerator) Patients who had an HbA1c test in the past one year Count
Sub Item #1 (Numerator) HbA1c value <7 Count
Sub Item #2 (Numerator) HbA1c value <=7 - >=9 Count
Sub Item #3 (Numerator) HbA1c value >9 Count
Sub Item #4 (Numerator) No HbA1c value in the past 1 year Count
Sub Item #5 (Numerator) Average HbA1c value Value
Item #2 (Numerator) Patients who received a flu vaccine Count
Sub Item #1 (Numerator) Age <60 Count
Sub Item #2 (Numerator) Age >=60 Count
Item #3 (Numerator) Patients who had an LDL test in the past one year Count
Sub Item #1 (Numerator) LDL value <100 Count
Sub Item #2 (Numerator) LDL value >=100 Count
Sub Item #3 (Numerator) No LDL test in the past one year Count
Sub Item #4 (Numerator) Average LDL Value
Item #4(Numerator) Patients that received, referred, or refused Diabetes Education
Count
Sub Item #1 (Numerator) Number of patients that received Diabetes Education Count
Sub Item #2 (Numerator) Number of patients that refused Diabetes Education Count
Sub Item #3 (Numerator) Number of patients referred for Diabetes Education Count
Data Elements Needed Diabetes Tracking Type Age
Active patient status Had an LDL test
1 visit in the past 1 year LDL Value
Had an HbA1c Received Diabetes Education
HbA1c value Refused Diabetes Education
Received a flu shot Referred for Diabetes Education
i2iTracks Population Health Analytics: Custom Reports & Dashboards
7 iPHA Custom Reports & Dashboards Revision Date 11/8/2017 All rights reserved. No part of this document shall be reproduced, stored in a retrieval system, or transmitted by any means, electronic, mechanical, photocopying, recording, or otherwise, without written permission from i2i Systems, Inc.
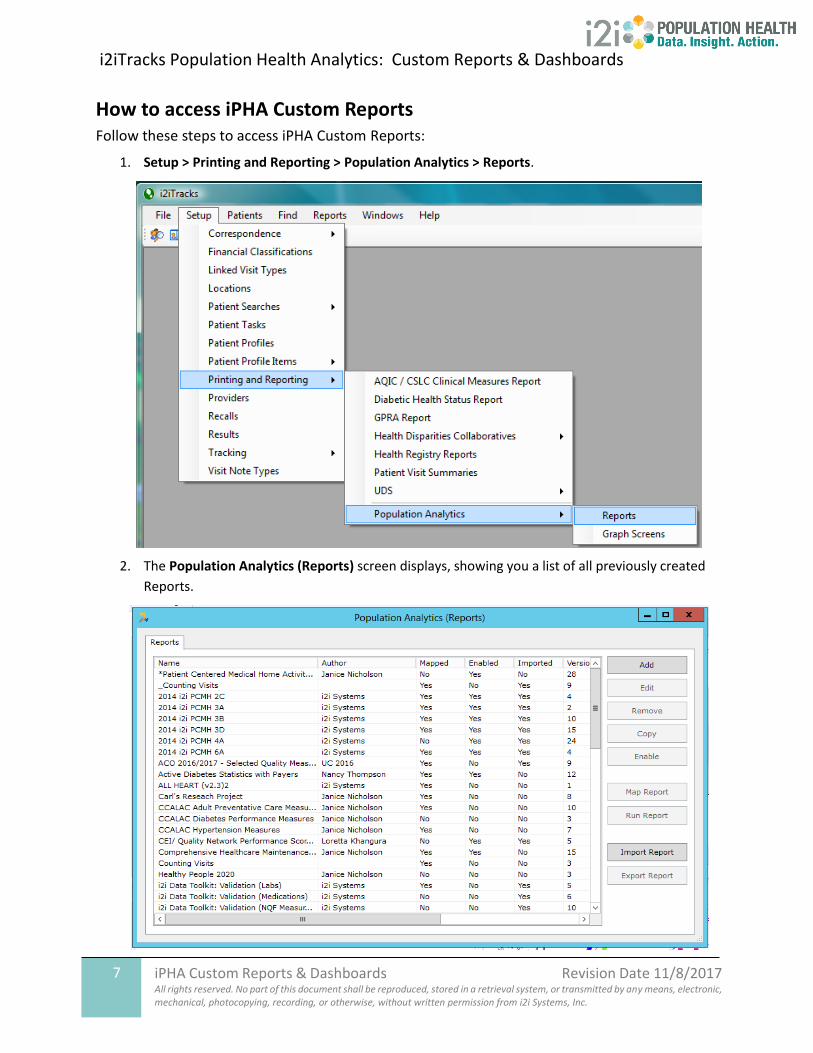
How to access iPHA Custom Reports Follow these steps to access iPHA Custom Reports:
1. Setup > Printing and Reporting > Population Analytics > Reports.
2. The Population Analytics (Reports) screen displays, showing you a list of all previously created
Reports.
i2iTracks Population Health Analytics: Custom Reports & Dashboards
8 iPHA Custom Reports & Dashboards Revision Date 11/8/2017 All rights reserved. No part of this document shall be reproduced, stored in a retrieval system, or transmitted by any means, electronic, mechanical, photocopying, recording, or otherwise, without written permission from i2i Systems, Inc.
3. There is a tab at the top of the screen: Reports
• Reports: (The default tab) This option shows you the list of the various reports
that have already been created. This is where you will create, edit, delete, and
copy reports. You can also enable the report for use and import and export
report files.
i2iTracks Population Health Analytics: Custom Reports & Dashboards
9 iPHA Custom Reports & Dashboards Revision Date 11/8/2017 All rights reserved. No part of this document shall be reproduced, stored in a retrieval system, or transmitted by any means, electronic, mechanical, photocopying, recording, or otherwise, without written permission from i2i Systems, Inc.
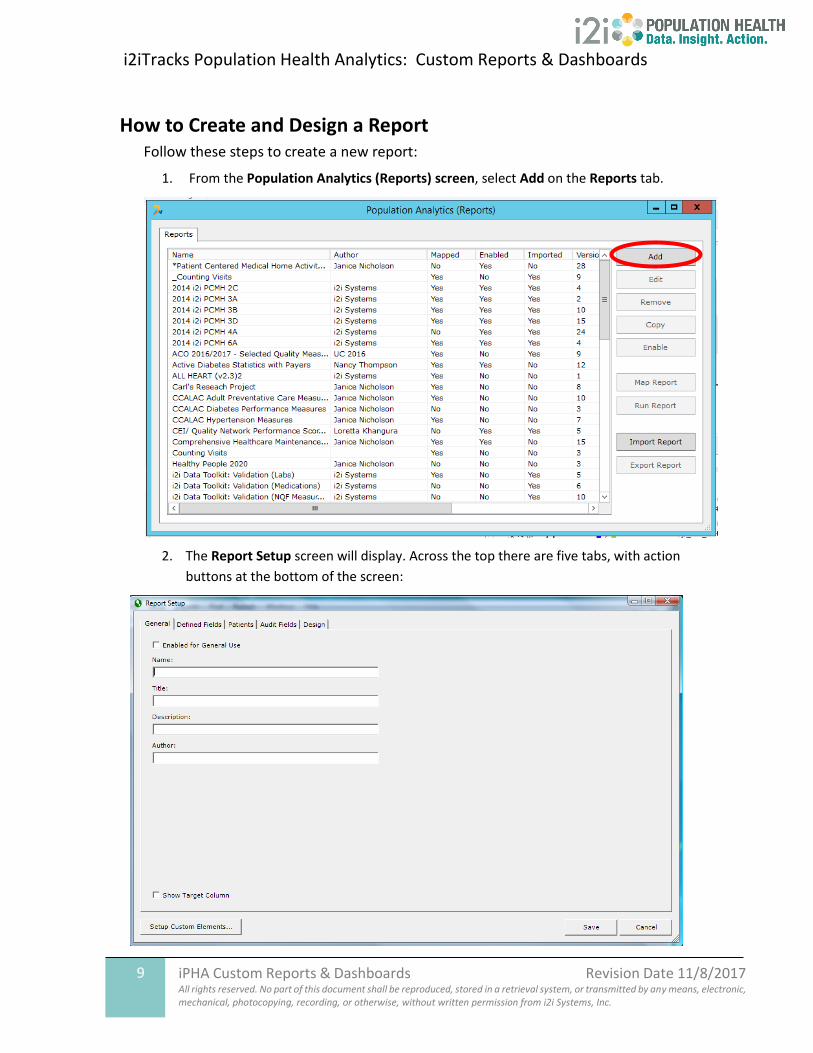
How to Create and Design a Report Follow these steps to create a new report:
1. From the Population Analytics (Reports) screen, select Add on the Reports tab.
2. The Report Setup screen will display. Across the top there are five tabs, with action
buttons at the bottom of the screen:
i2iTracks Population Health Analytics: Custom Reports & Dashboards
10 iPHA Custom Reports & Dashboards Revision Date 11/8/2017 All rights reserved. No part of this document shall be reproduced, stored in a retrieval system, or transmitted by any means, electronic, mechanical, photocopying, recording, or otherwise, without written permission from i2i Systems, Inc.
• General Tab: The name and general information about the report.
• Defined Fields Tab: This tab is used to identify each data element that you
want to include in the report and to assign the parameters of how the data
element will be used in the report (the ‘rules’ for when you count a patient
– For example, patients that had 2 visits in 2 years).
• Patients Tab: The Patients tab is used to define the global denominator for
the entire report. For example, you may want your report to include only
Active Patients, or only Active Patients assigned to Diabetes Tracking, etc.
• Audit Fields Tab: This tab is used to choose the data fields you want to
print when you do an audit report of a line item.
• Design Tab: In the Design tab, you will format the layout of the report –
define the data and statistics you want to see in your report and how you
want the printed report to look.
• Setup Custom Elements Action Button: Click this button if you find that
you need to add a new Custom Data Element to the library.
Each of the tabs is described in detail in the sections below.
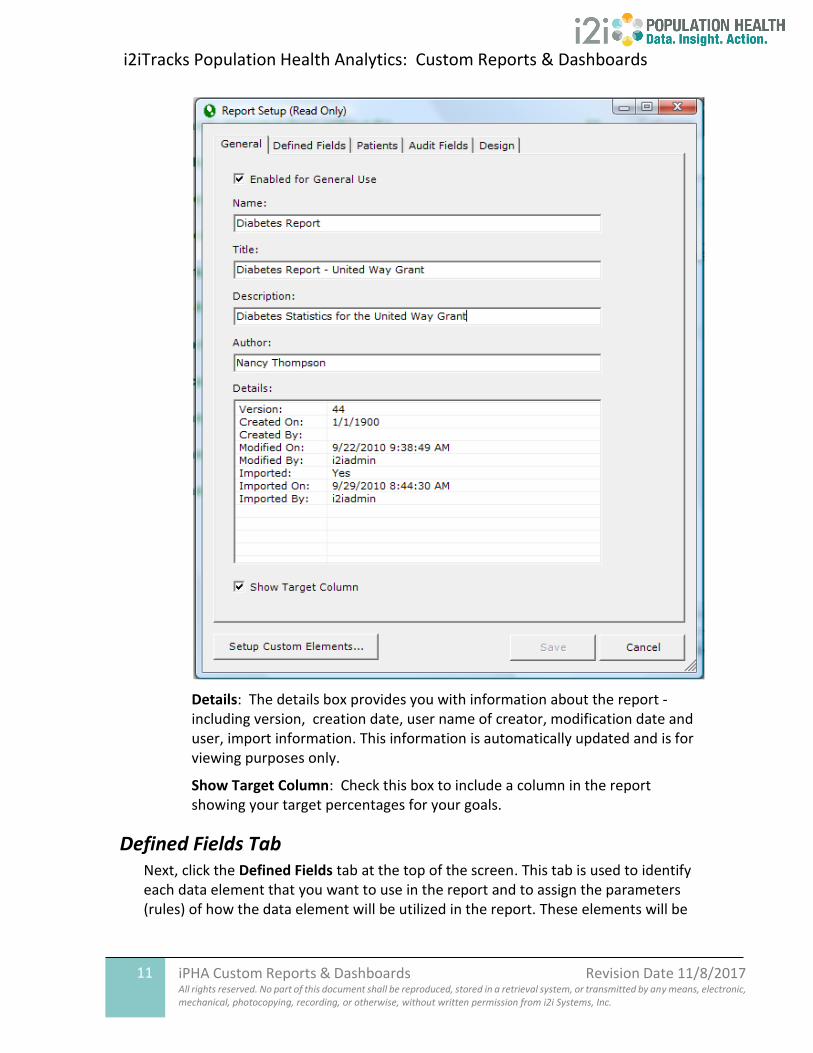
General Tab On the General tab, complete the following fields:
Enabled for General Use: Check this box AFTER you are completely finished designing the report and you have validated the report is accurate. When this box is checked, other users will see the report in their Select a Report menu when printing reports.
Name: Enter a name for your new custom report for the reports menu. Remember to be specific.
Title: Enter a title for your report. This title will appear on the printed report.
Description: Enter a description for your new custom report. Be descriptive – the more you document about your report, the less time you will have to review the setup when you need to print it, update it, or even export the report.
Author: Enter your name in this field.
i2iTracks Population Health Analytics: Custom Reports & Dashboards
11 iPHA Custom Reports & Dashboards Revision Date 11/8/2017 All rights reserved. No part of this document shall be reproduced, stored in a retrieval system, or transmitted by any means, electronic, mechanical, photocopying, recording, or otherwise, without written permission from i2i Systems, Inc.
Details: The details box provides you with information about the report -including version, creation date, user name of creator, modification date and user, import information. This information is automatically updated and is for viewing purposes only.
Show Target Column: Check this box to include a column in the report showing your target percentages for your goals.
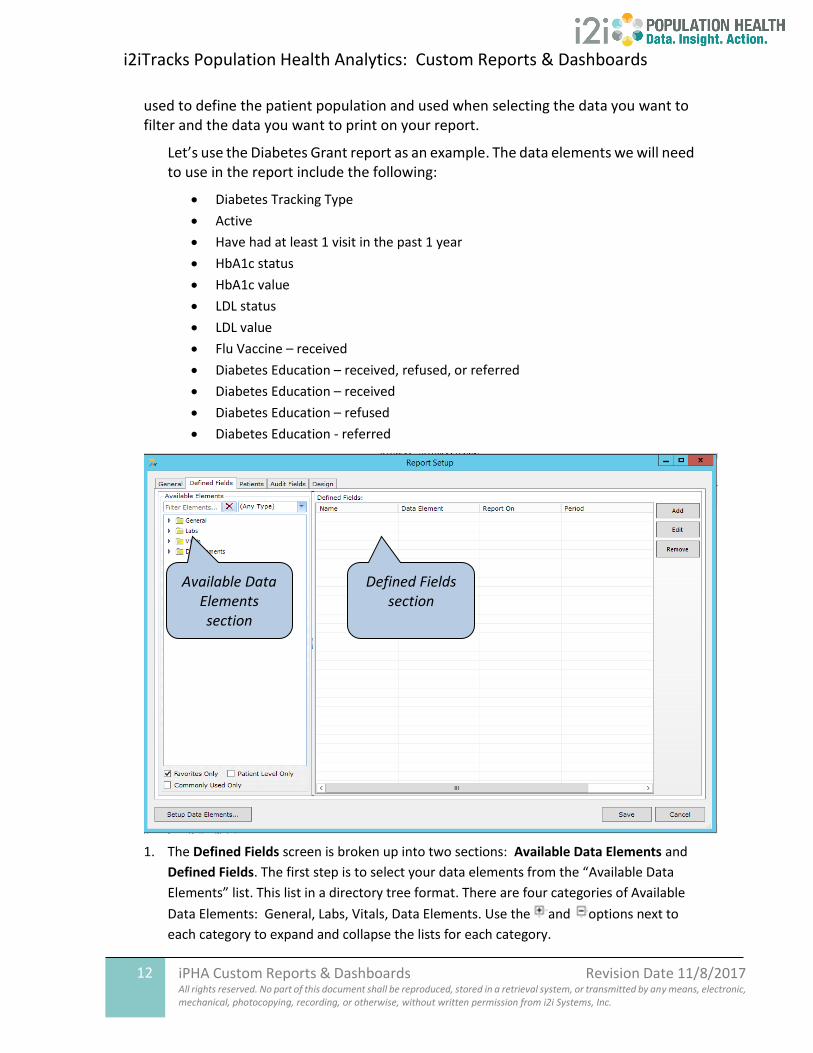
Defined Fields Tab Next, click the Defined Fields tab at the top of the screen. This tab is used to identify each data element that you want to use in the report and to assign the parameters (rules) of how the data element will be utilized in the report. These elements will be
i2iTracks Population Health Analytics: Custom Reports & Dashboards
12 iPHA Custom Reports & Dashboards Revision Date 11/8/2017 All rights reserved. No part of this document shall be reproduced, stored in a retrieval system, or transmitted by any means, electronic, mechanical, photocopying, recording, or otherwise, without written permission from i2i Systems, Inc.
used to define the patient population and used when selecting the data you want to filter and the data you want to print on your report.
Let’s use the Diabetes Grant report as an example. The data elements we will need to use in the report include the following:
• Diabetes Tracking Type
• Active
• Have had at least 1 visit in the past 1 year
• HbA1c status
• HbA1c value
• LDL status
• LDL value
• Flu Vaccine – received
• Diabetes Education – received, refused, or referred
• Diabetes Education – received
• Diabetes Education – refused
• Diabetes Education - referred
1. The Defined Fields screen is broken up into two sections: Available Data Elements and
Defined Fields. The first step is to select your data elements from the “Available Data
Elements” list. This list in a directory tree format. There are four categories of Available
Data Elements: General, Labs, Vitals, Data Elements. Use the and options next to
each category to expand and collapse the lists for each category.
Available Data Elements section
Defined Fields section
i2iTracks Population Health Analytics: Custom Reports & Dashboards
13 iPHA Custom Reports & Dashboards Revision Date 11/8/2017 All rights reserved. No part of this document shall be reproduced, stored in a retrieval system, or transmitted by any means, electronic, mechanical, photocopying, recording, or otherwise, without written permission from i2i Systems, Inc.
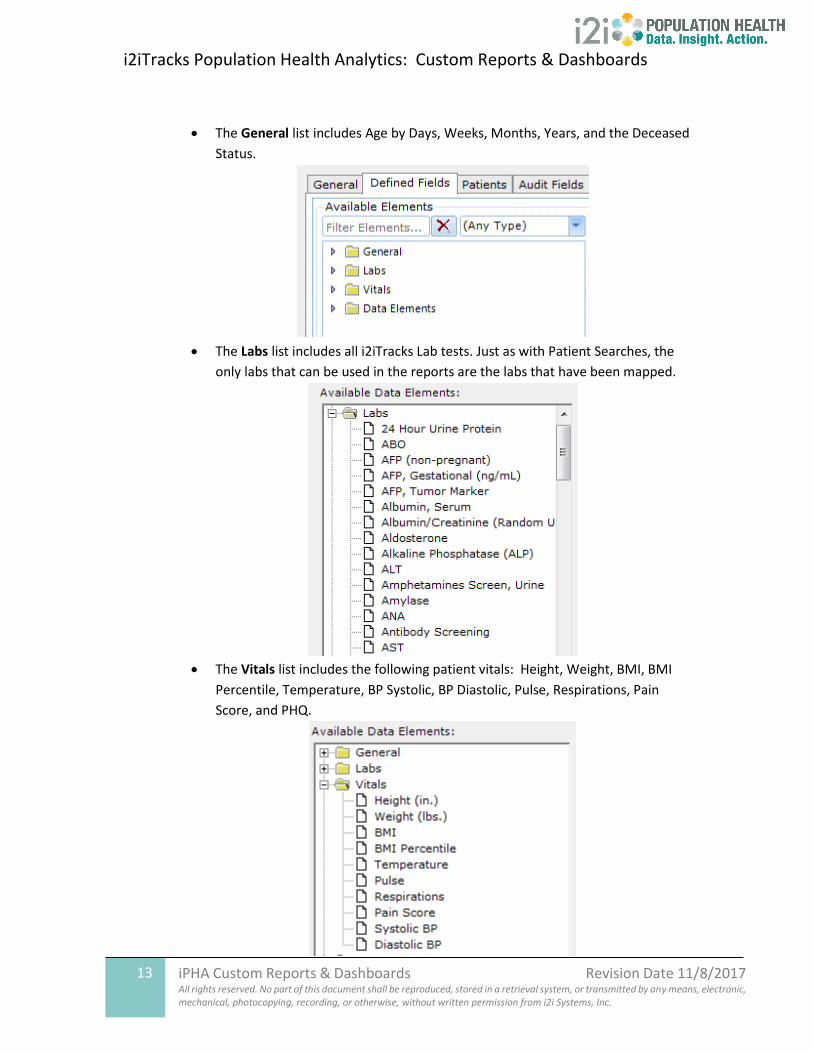
• The General list includes Age by Days, Weeks, Months, Years, and the Deceased
Status.
• The Labs list includes all i2iTracks Lab tests. Just as with Patient Searches, the
only labs that can be used in the reports are the labs that have been mapped.
• The Vitals list includes the following patient vitals: Height, Weight, BMI, BMI
Percentile, Temperature, BP Systolic, BP Diastolic, Pulse, Respirations, Pain
Score, and PHQ.
i2iTracks Population Health Analytics: Custom Reports & Dashboards
14 iPHA Custom Reports & Dashboards Revision Date 11/8/2017 All rights reserved. No part of this document shall be reproduced, stored in a retrieval system, or transmitted by any means, electronic, mechanical, photocopying, recording, or otherwise, without written permission from i2i Systems, Inc.
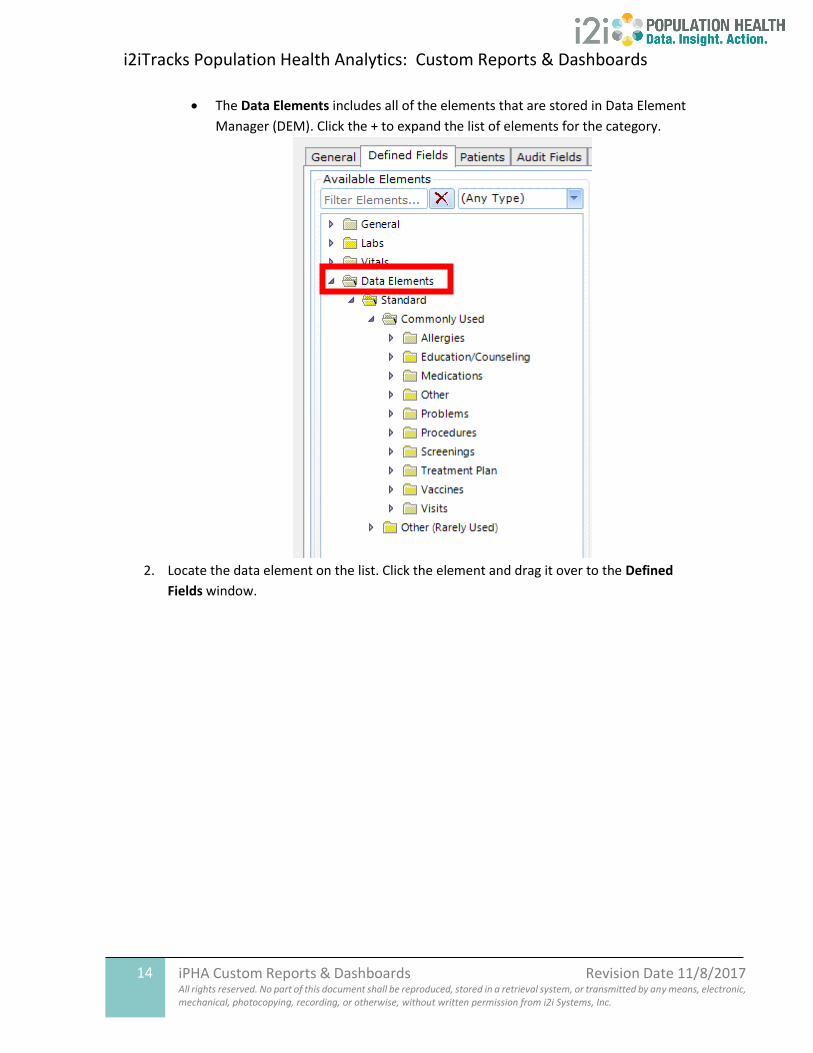
• The Data Elements includes all of the elements that are stored in Data Element
Manager (DEM). Click the + to expand the list of elements for the category.
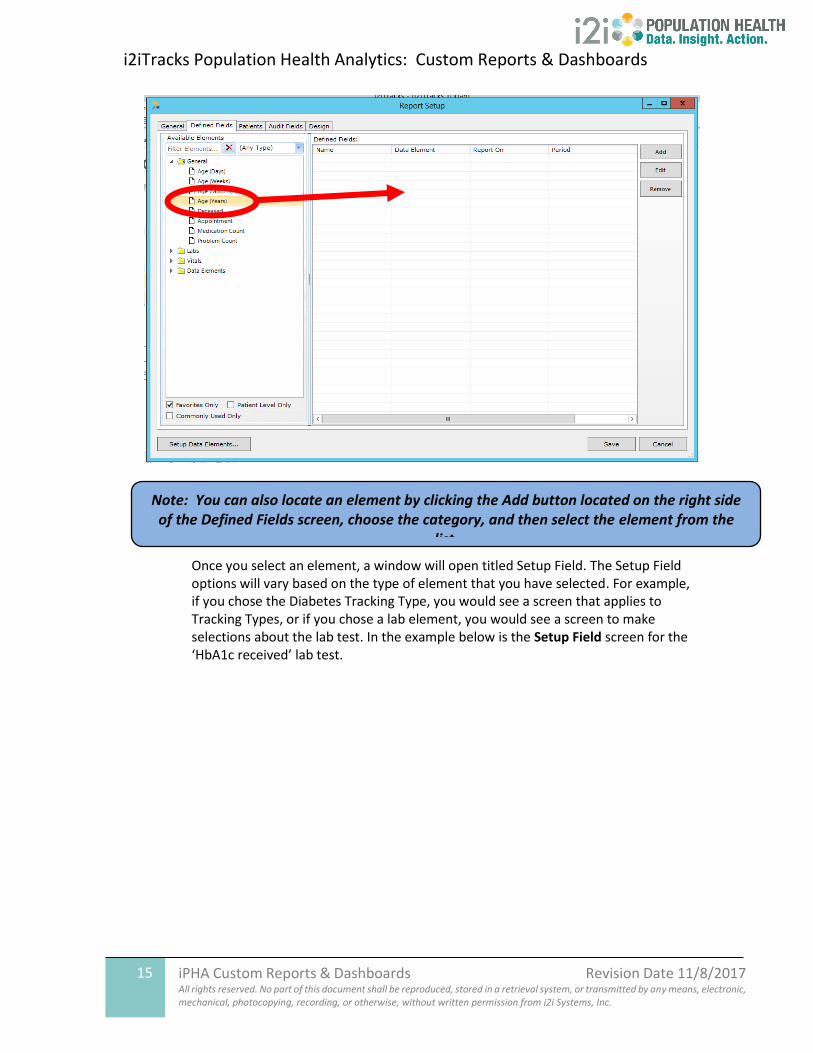
2. Locate the data element on the list. Click the element and drag it over to the Defined
Fields window.
i2iTracks Population Health Analytics: Custom Reports & Dashboards
15 iPHA Custom Reports & Dashboards Revision Date 11/8/2017 All rights reserved. No part of this document shall be reproduced, stored in a retrieval system, or transmitted by any means, electronic, mechanical, photocopying, recording, or otherwise, without written permission from i2i Systems, Inc.
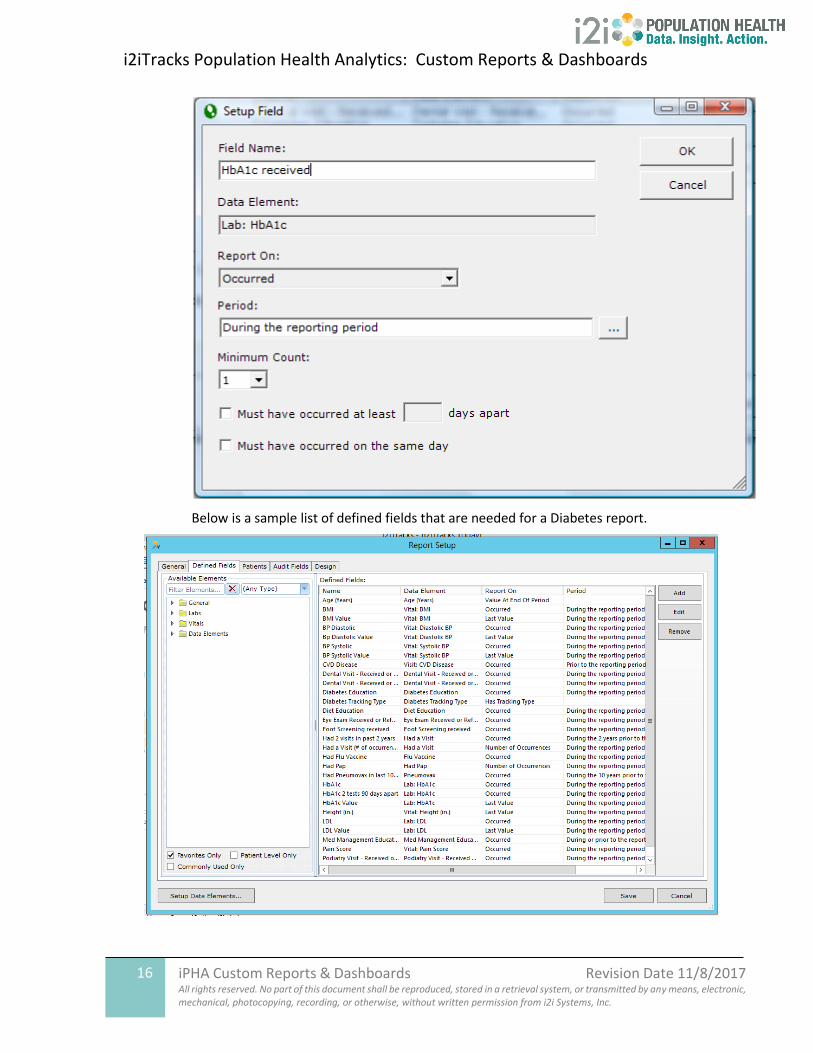
Once you select an element, a window will open titled Setup Field. The Setup Field options will vary based on the type of element that you have selected. For example, if you chose the Diabetes Tracking Type, you would see a screen that applies to Tracking Types, or if you chose a lab element, you would see a screen to make selections about the lab test. In the example below is the Setup Field screen for the ‘HbA1c received’ lab test.
Note: You can also locate an element by clicking the Add button located on the right side of the Defined Fields screen, choose the category, and then select the element from the
list.
i2iTracks Population Health Analytics: Custom Reports & Dashboards
16 iPHA Custom Reports & Dashboards Revision Date 11/8/2017 All rights reserved. No part of this document shall be reproduced, stored in a retrieval system, or transmitted by any means, electronic, mechanical, photocopying, recording, or otherwise, without written permission from i2i Systems, Inc.
Below is a sample list of defined fields that are needed for a Diabetes report.
i2iTracks Population Health Analytics: Custom Reports & Dashboards
17 iPHA Custom Reports & Dashboards Revision Date 11/8/2017 All rights reserved. No part of this document shall be reproduced, stored in a retrieval system, or transmitted by any means, electronic, mechanical, photocopying, recording, or otherwise, without written permission from i2i Systems, Inc.
3. Continue adding your data elements until you have them all in the Defined Fields
window. You can return to this screen at any time to make more data elements
available in your report. To check that you have created all the elements you need, you
can click on the Defined Fields headings to sort the items.
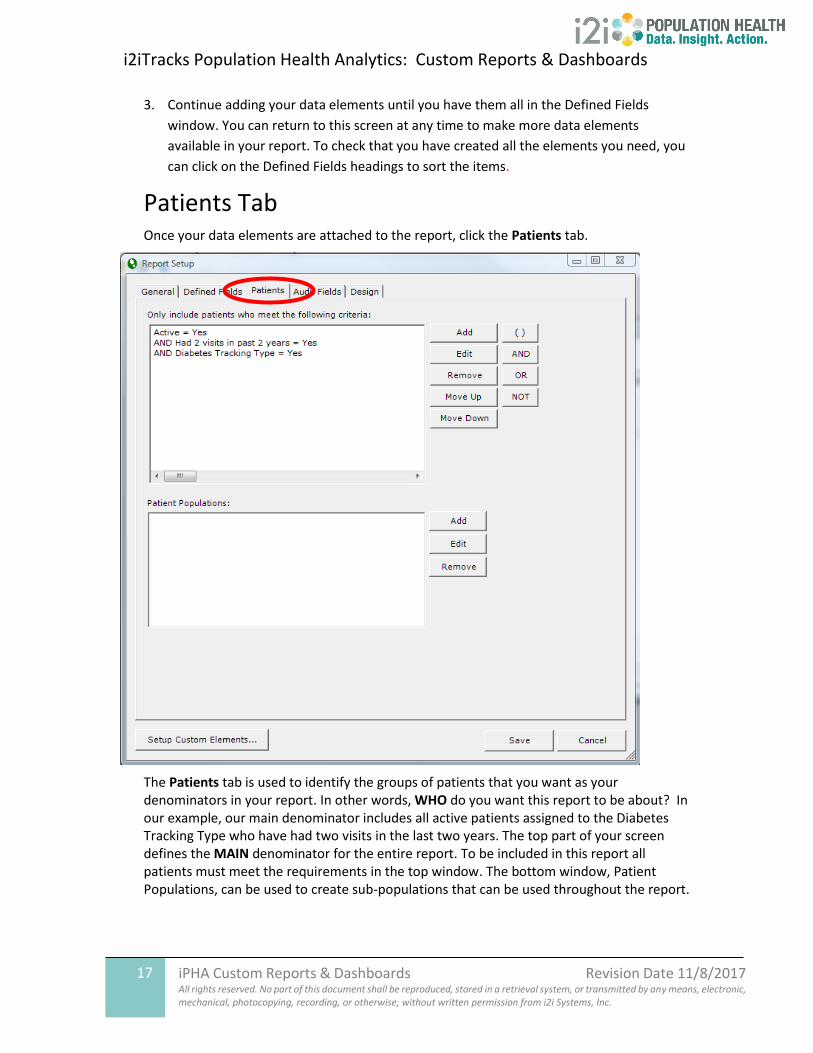
Patients Tab Once your data elements are attached to the report, click the Patients tab.
The Patients tab is used to identify the groups of patients that you want as your denominators in your report. In other words, WHO do you want this report to be about? In our example, our main denominator includes all active patients assigned to the Diabetes Tracking Type who have had two visits in the last two years. The top part of your screen defines the MAIN denominator for the entire report. To be included in this report all patients must meet the requirements in the top window. The bottom window, Patient Populations, can be used to create sub-populations that can be used throughout the report.
i2iTracks Population Health Analytics: Custom Reports & Dashboards
18 iPHA Custom Reports & Dashboards Revision Date 11/8/2017 All rights reserved. No part of this document shall be reproduced, stored in a retrieval system, or transmitted by any means, electronic, mechanical, photocopying, recording, or otherwise, without written permission from i2i Systems, Inc.
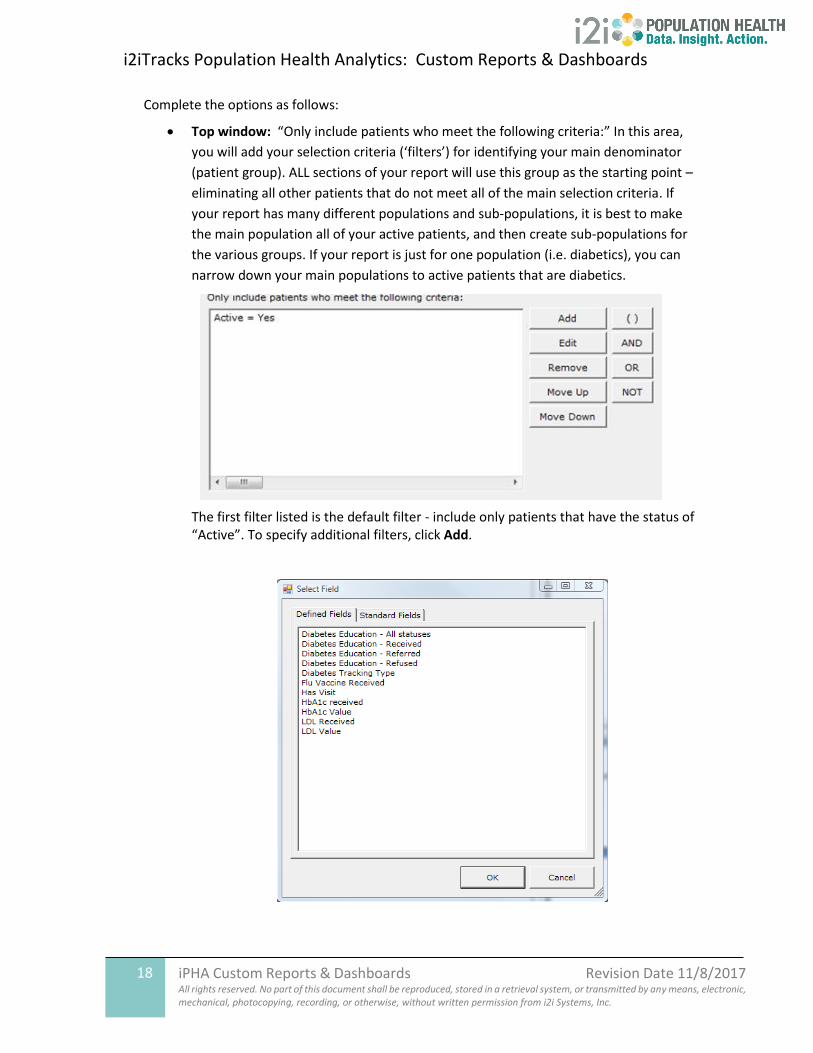
Complete the options as follows:
• Top window: “Only include patients who meet the following criteria:” In this area,
you will add your selection criteria (‘filters’) for identifying your main denominator
(patient group). ALL sections of your report will use this group as the starting point –
eliminating all other patients that do not meet all of the main selection criteria. If
your report has many different populations and sub-populations, it is best to make
the main population all of your active patients, and then create sub-populations for
the various groups. If your report is just for one population (i.e. diabetics), you can
narrow down your main populations to active patients that are diabetics.
The first filter listed is the default filter - include only patients that have the status of “Active”. To specify additional filters, click Add.
i2iTracks Population Health Analytics: Custom Reports & Dashboards
19 iPHA Custom Reports & Dashboards Revision Date 11/8/2017 All rights reserved. No part of this document shall be reproduced, stored in a retrieval system, or transmitted by any means, electronic, mechanical, photocopying, recording, or otherwise, without written permission from i2i Systems, Inc.
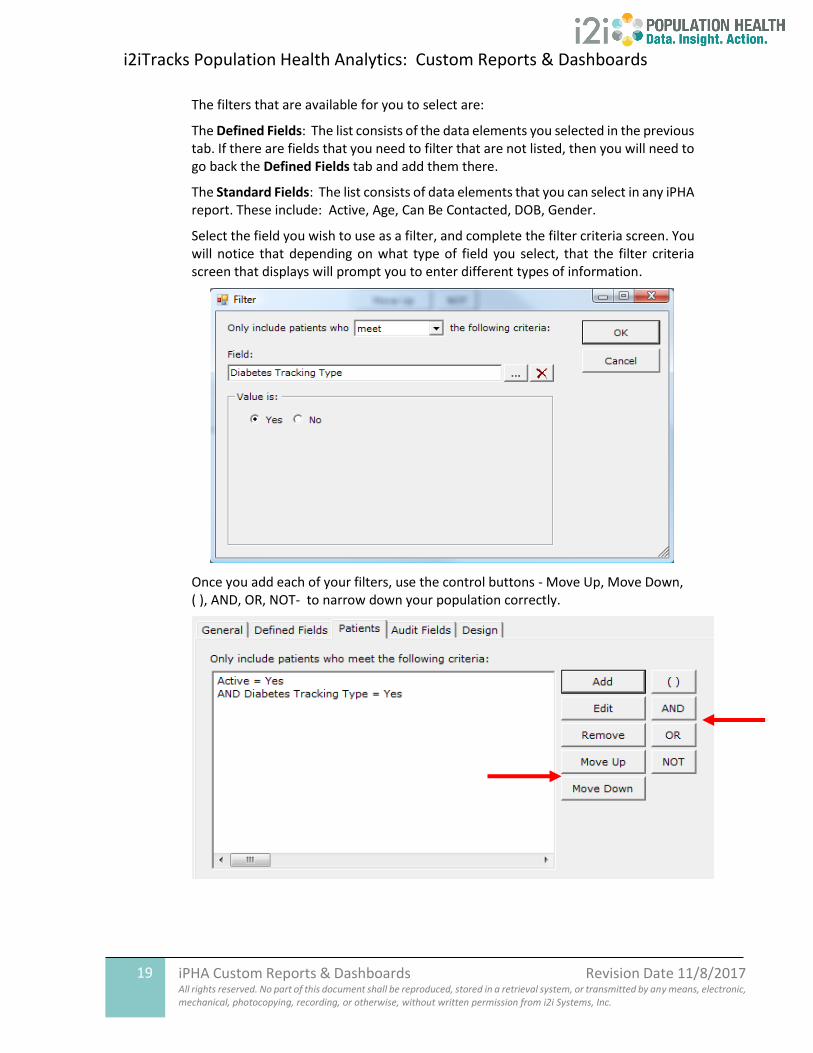
The filters that are available for you to select are:
The Defined Fields: The list consists of the data elements you selected in the previous tab. If there are fields that you need to filter that are not listed, then you will need to go back the Defined Fields tab and add them there.
The Standard Fields: The list consists of data elements that you can select in any iPHA report. These include: Active, Age, Can Be Contacted, DOB, Gender.
Select the field you wish to use as a filter, and complete the filter criteria screen. You will notice that depending on what type of field you select, that the filter criteria screen that displays will prompt you to enter different types of information.
Once you add each of your filters, use the control buttons - Move Up, Move Down, ( ), AND, OR, NOT- to narrow down your population correctly.
i2iTracks Population Health Analytics: Custom Reports & Dashboards
20 iPHA Custom Reports & Dashboards Revision Date 11/8/2017 All rights reserved. No part of this document shall be reproduced, stored in a retrieval system, or transmitted by any means, electronic, mechanical, photocopying, recording, or otherwise, without written permission from i2i Systems, Inc.
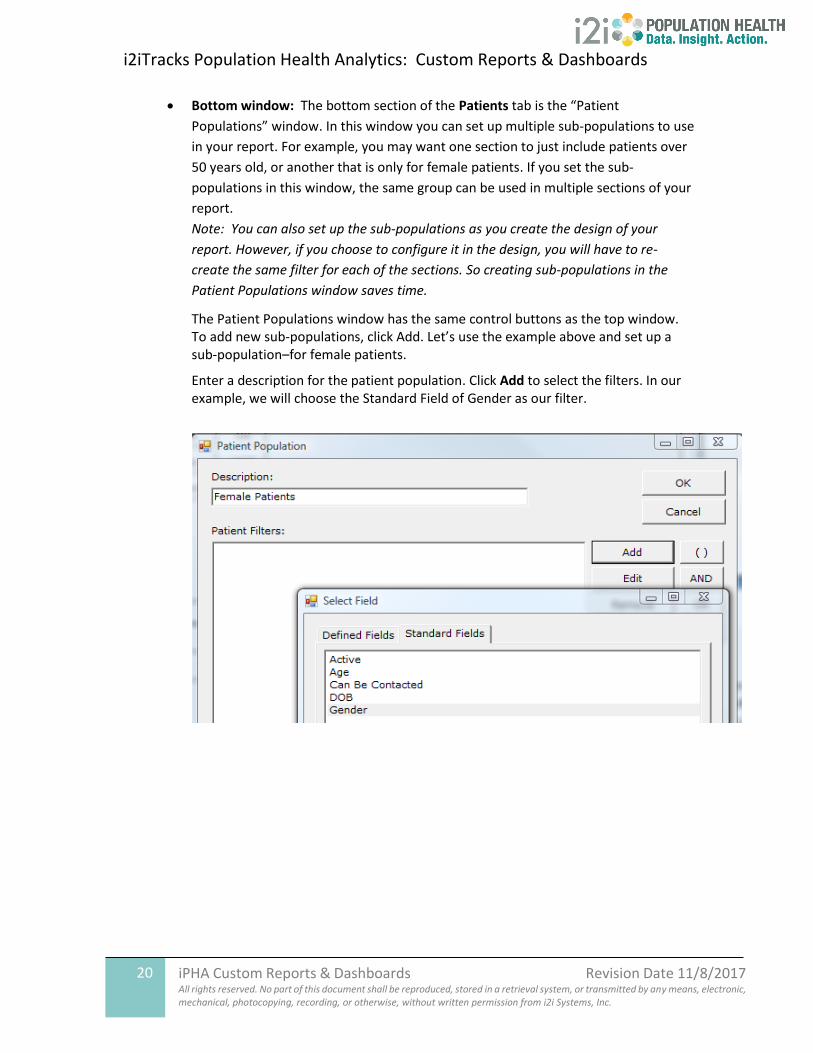
• Bottom window: The bottom section of the Patients tab is the “Patient
Populations” window. In this window you can set up multiple sub-populations to use
in your report. For example, you may want one section to just include patients over
50 years old, or another that is only for female patients. If you set the sub-
populations in this window, the same group can be used in multiple sections of your
report.
Note: You can also set up the sub-populations as you create the design of your
report. However, if you choose to configure it in the design, you will have to re-
create the same filter for each of the sections. So creating sub-populations in the
Patient Populations window saves time.
The Patient Populations window has the same control buttons as the top window. To add new sub-populations, click Add. Let’s use the example above and set up a sub-population–for female patients.
Enter a description for the patient population. Click Add to select the filters. In our example, we will choose the Standard Field of Gender as our filter.
i2iTracks Population Health Analytics: Custom Reports & Dashboards
21 iPHA Custom Reports & Dashboards Revision Date 11/8/2017 All rights reserved. No part of this document shall be reproduced, stored in a retrieval system, or transmitted by any means, electronic, mechanical, photocopying, recording, or otherwise, without written permission from i2i Systems, Inc.
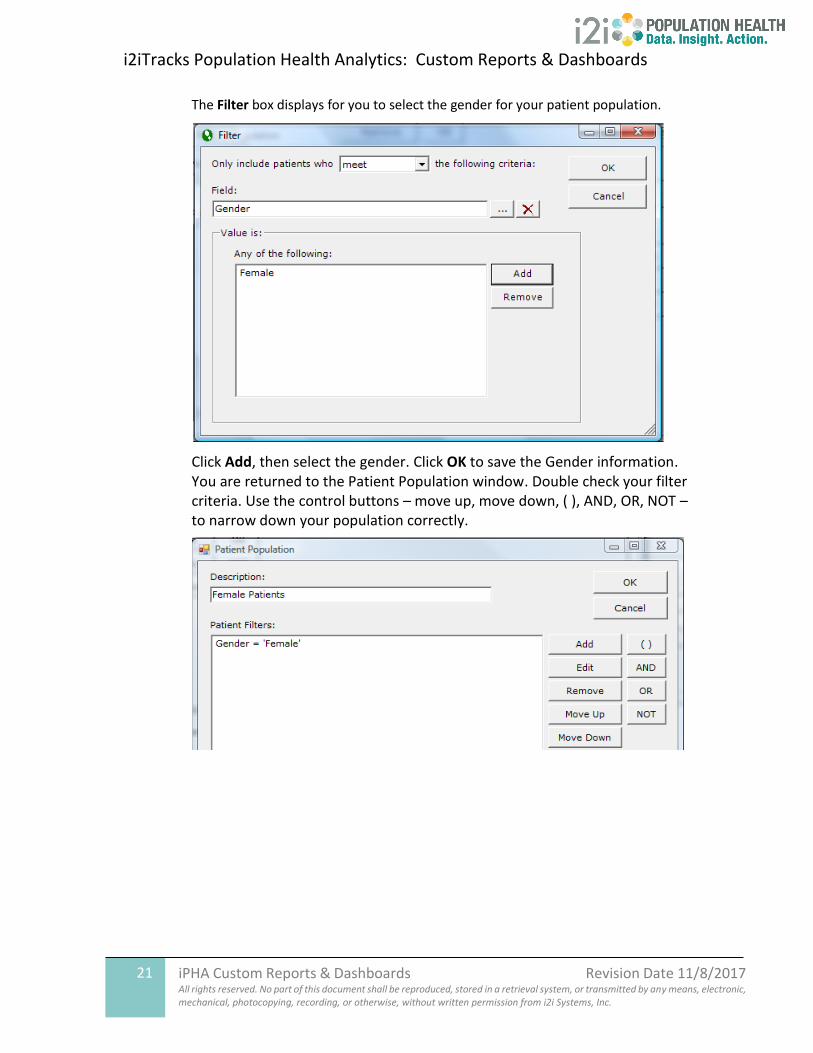
The Filter box displays for you to select the gender for your patient population.
Click Add, then select the gender. Click OK to save the Gender information. You are returned to the Patient Population window. Double check your filter criteria. Use the control buttons – move up, move down, ( ), AND, OR, NOT – to narrow down your population correctly.
i2iTracks Population Health Analytics: Custom Reports & Dashboards
22 iPHA Custom Reports & Dashboards Revision Date 11/8/2017 All rights reserved. No part of this document shall be reproduced, stored in a retrieval system, or transmitted by any means, electronic, mechanical, photocopying, recording, or otherwise, without written permission from i2i Systems, Inc.
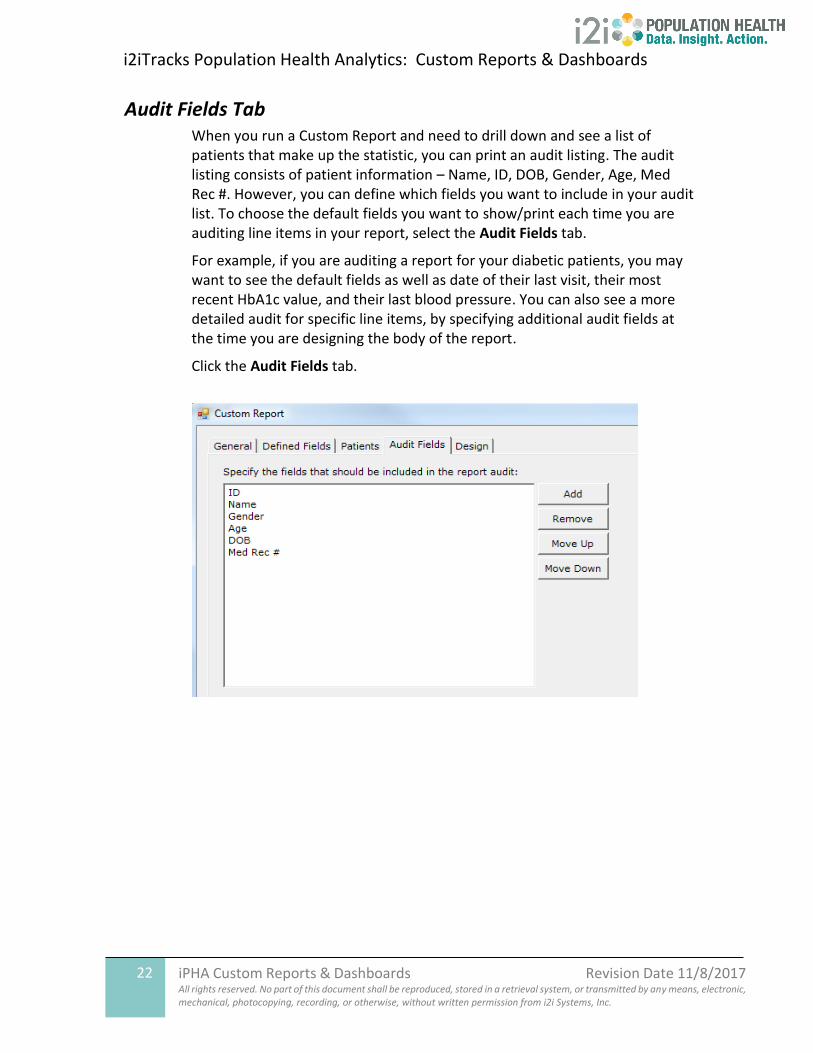
Audit Fields Tab When you run a Custom Report and need to drill down and see a list of patients that make up the statistic, you can print an audit listing. The audit listing consists of patient information – Name, ID, DOB, Gender, Age, Med Rec #. However, you can define which fields you want to include in your audit list. To choose the default fields you want to show/print each time you are auditing line items in your report, select the Audit Fields tab.
For example, if you are auditing a report for your diabetic patients, you may want to see the default fields as well as date of their last visit, their most recent HbA1c value, and their last blood pressure. You can also see a more detailed audit for specific line items, by specifying additional audit fields at the time you are designing the body of the report.
Click the Audit Fields tab.
i2iTracks Population Health Analytics: Custom Reports & Dashboards
23 iPHA Custom Reports & Dashboards Revision Date 11/8/2017 All rights reserved. No part of this document shall be reproduced, stored in a retrieval system, or transmitted by any means, electronic, mechanical, photocopying, recording, or otherwise, without written permission from i2i Systems, Inc.
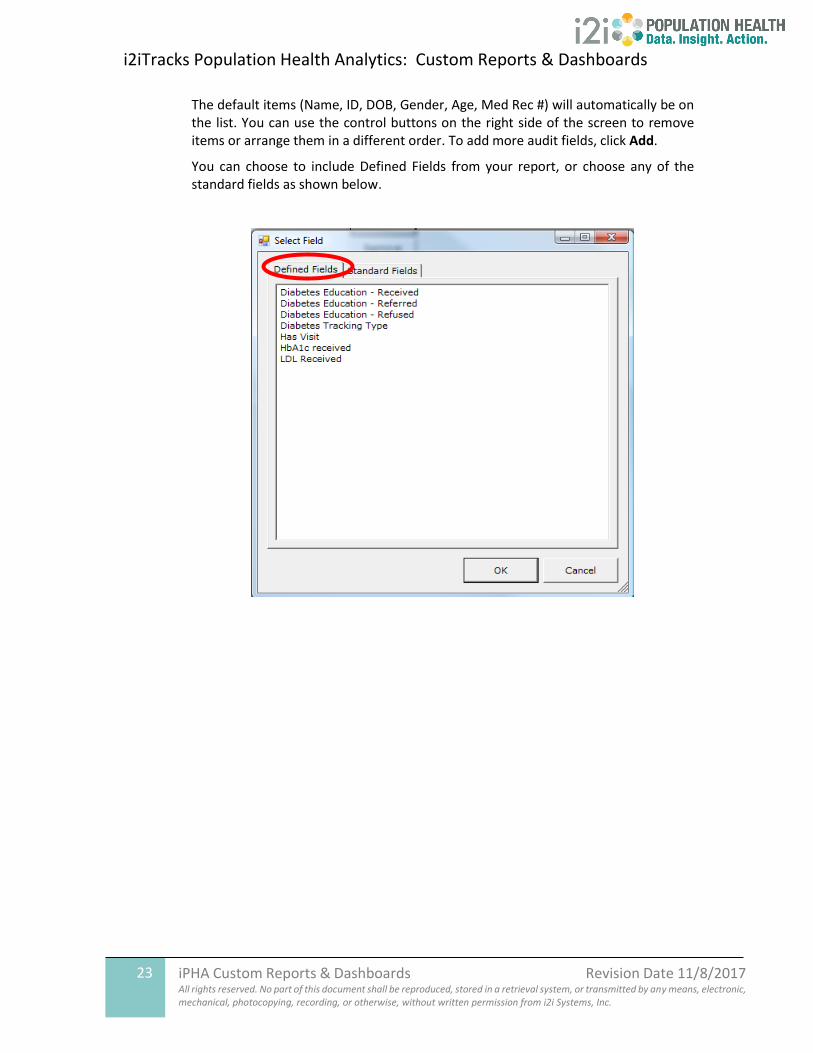
The default items (Name, ID, DOB, Gender, Age, Med Rec #) will automatically be on the list. You can use the control buttons on the right side of the screen to remove items or arrange them in a different order. To add more audit fields, click Add.
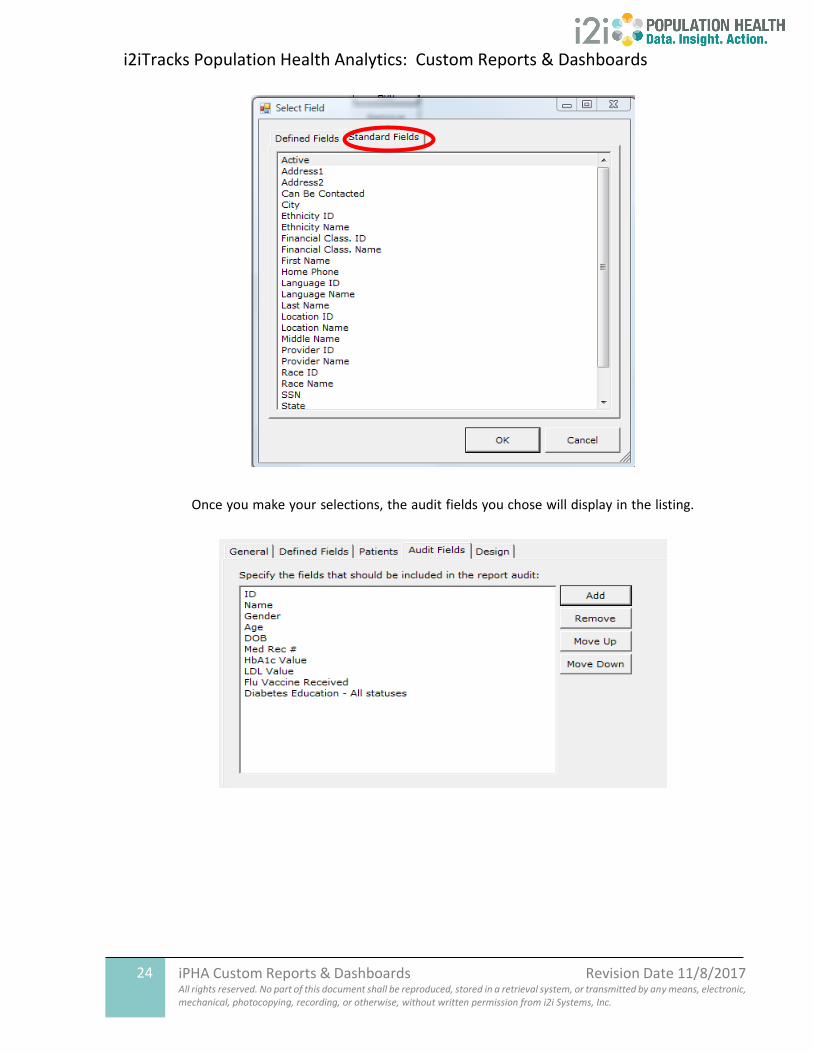
You can choose to include Defined Fields from your report, or choose any of the standard fields as shown below.
i2iTracks Population Health Analytics: Custom Reports & Dashboards
24 iPHA Custom Reports & Dashboards Revision Date 11/8/2017 All rights reserved. No part of this document shall be reproduced, stored in a retrieval system, or transmitted by any means, electronic, mechanical, photocopying, recording, or otherwise, without written permission from i2i Systems, Inc.
Once you make your selections, the audit fields you chose will display in the listing.
i2iTracks Population Health Analytics: Custom Reports & Dashboards
25 iPHA Custom Reports & Dashboards Revision Date 11/8/2017 All rights reserved. No part of this document shall be reproduced, stored in a retrieval system, or transmitted by any means, electronic, mechanical, photocopying, recording, or otherwise, without written permission from i2i Systems, Inc.
Report Design Tab Now that you have completed the setup of the first four tabs, you are ready to create the design of your report. Review the following “Report Structure” overview prior to beginning the design portion of the report.
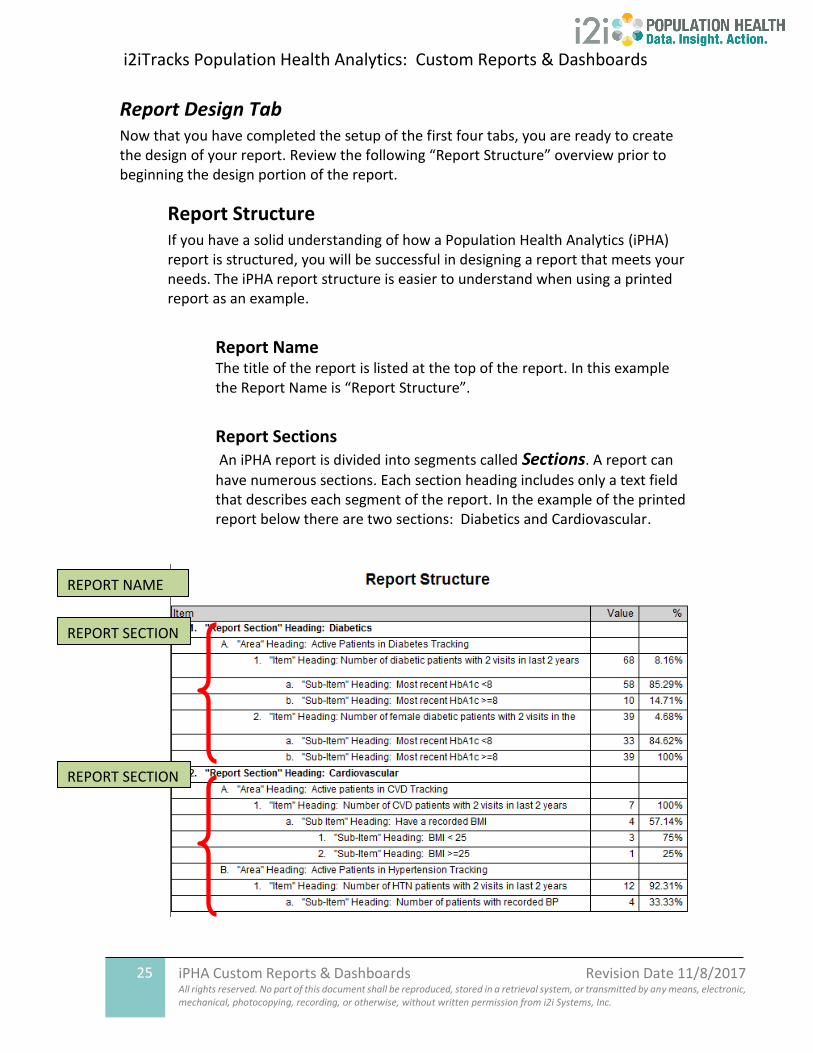
Report Structure If you have a solid understanding of how a Population Health Analytics (iPHA) report is structured, you will be successful in designing a report that meets your needs. The iPHA report structure is easier to understand when using a printed report as an example.
Report Name The title of the report is listed at the top of the report. In this example the Report Name is “Report Structure”.
Report Sections An iPHA report is divided into segments called Sections. A report can
have numerous sections. Each section heading includes only a text field that describes each segment of the report. In the example of the printed report below there are two sections: Diabetics and Cardiovascular.
REPORT NAME
REPORT SECTION
REPORT SECTION
i2iTracks Population Health Analytics: Custom Reports & Dashboards
26 iPHA Custom Reports & Dashboards Revision Date 11/8/2017 All rights reserved. No part of this document shall be reproduced, stored in a retrieval system, or transmitted by any means, electronic, mechanical, photocopying, recording, or otherwise, without written permission from i2i Systems, Inc.
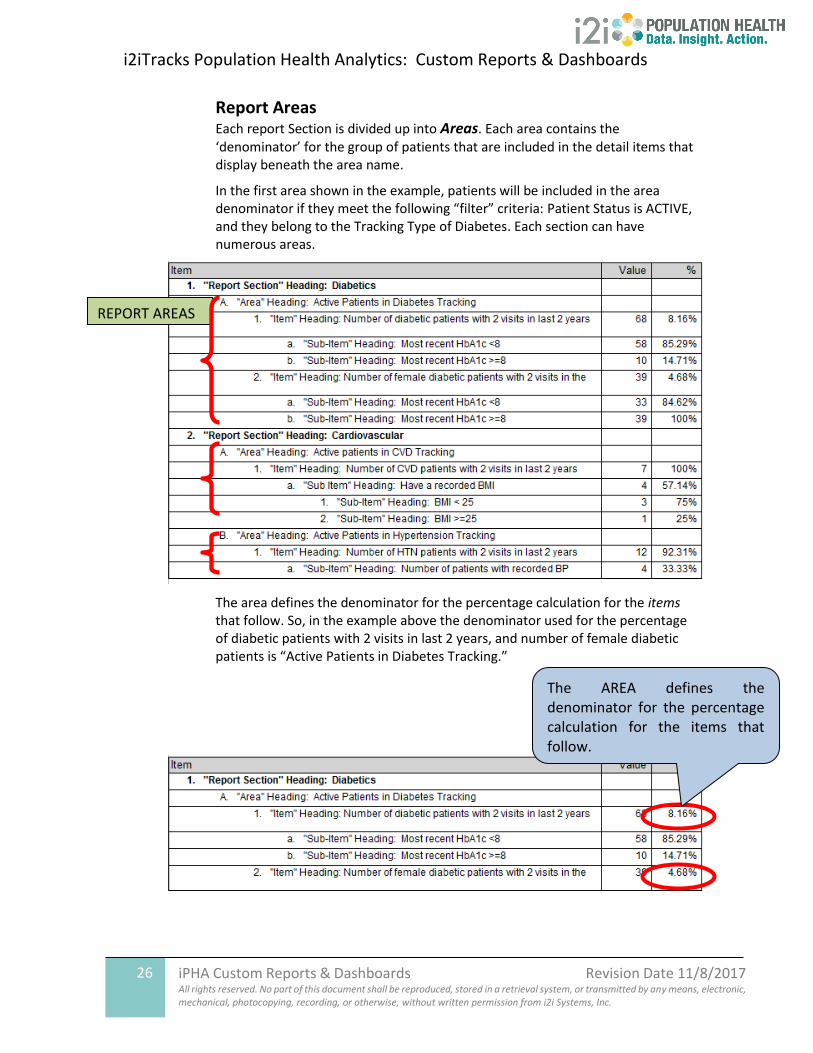
Report Areas Each report Section is divided up into Areas. Each area contains the ‘denominator’ for the group of patients that are included in the detail items that display beneath the area name.
In the first area shown in the example, patients will be included in the area denominator if they meet the following “filter” criteria: Patient Status is ACTIVE, and they belong to the Tracking Type of Diabetes. Each section can have numerous areas.
The area defines the denominator for the percentage calculation for the items that follow. So, in the example above the denominator used for the percentage of diabetic patients with 2 visits in last 2 years, and number of female diabetic patients is “Active Patients in Diabetes Tracking.”
REPORT AREAS
The AREA defines the denominator for the percentage calculation for the items that follow.
i2iTracks Population Health Analytics: Custom Reports & Dashboards
27 iPHA Custom Reports & Dashboards Revision Date 11/8/2017 All rights reserved. No part of this document shall be reproduced, stored in a retrieval system, or transmitted by any means, electronic, mechanical, photocopying, recording, or otherwise, without written permission from i2i Systems, Inc.
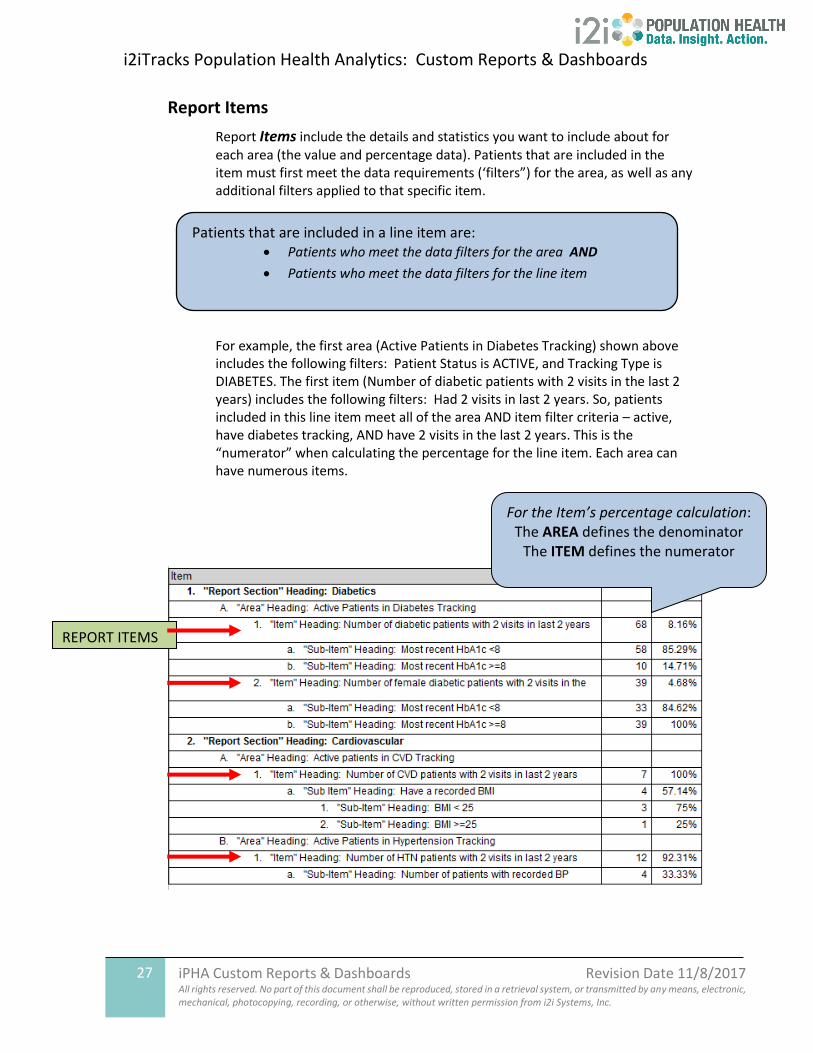
Report Items
Report Items include the details and statistics you want to include about for each area (the value and percentage data). Patients that are included in the item must first meet the data requirements (‘filters”) for the area, as well as any additional filters applied to that specific item.
For example, the first area (Active Patients in Diabetes Tracking) shown above includes the following filters: Patient Status is ACTIVE, and Tracking Type is DIABETES. The first item (Number of diabetic patients with 2 visits in the last 2 years) includes the following filters: Had 2 visits in last 2 years. So, patients included in this line item meet all of the area AND item filter criteria – active, have diabetes tracking, AND have 2 visits in the last 2 years. This is the “numerator” when calculating the percentage for the line item. Each area can have numerous items.
REPORT ITEMS
For the Item’s percentage calculation: The AREA defines the denominator
The ITEM defines the numerator
Patients that are included in a line item are: • Patients who meet the data filters for the area AND
• Patients who meet the data filters for the line item
i2iTracks Population Health Analytics: Custom Reports & Dashboards
28 iPHA Custom Reports & Dashboards Revision Date 11/8/2017 All rights reserved. No part of this document shall be reproduced, stored in a retrieval system, or transmitted by any means, electronic, mechanical, photocopying, recording, or otherwise, without written permission from i2i Systems, Inc.
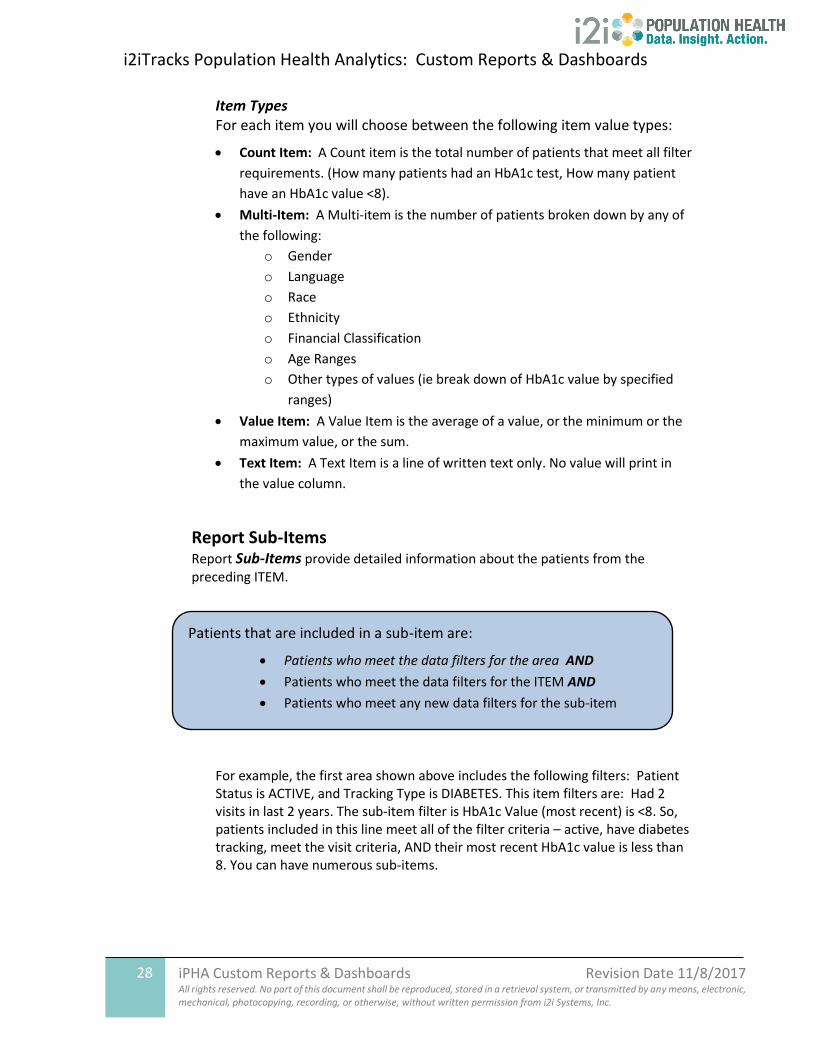
Item Types For each item you will choose between the following item value types:
• Count Item: A Count item is the total number of patients that meet all filter
requirements. (How many patients had an HbA1c test, How many patient
have an HbA1c value <8).
• Multi-Item: A Multi-item is the number of patients broken down by any of
the following:
o Gender
o Language
o Race
o Ethnicity
o Financial Classification
o Age Ranges
o Other types of values (ie break down of HbA1c value by specified
ranges)
• Value Item: A Value Item is the average of a value, or the minimum or the
maximum value, or the sum.
• Text Item: A Text Item is a line of written text only. No value will print in
the value column.
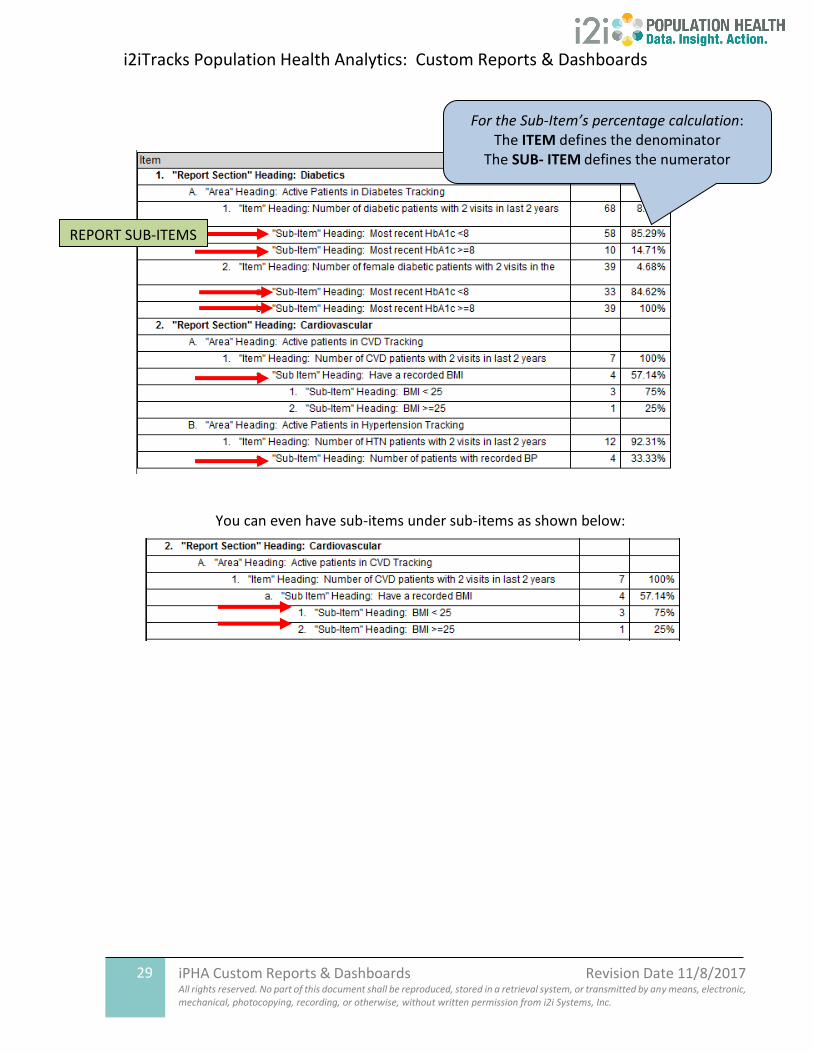
Report Sub-Items Report Sub-Items provide detailed information about the patients from the preceding ITEM.
For example, the first area shown above includes the following filters: Patient Status is ACTIVE, and Tracking Type is DIABETES. This item filters are: Had 2 visits in last 2 years. The sub-item filter is HbA1c Value (most recent) is <8. So, patients included in this line meet all of the filter criteria – active, have diabetes tracking, meet the visit criteria, AND their most recent HbA1c value is less than 8. You can have numerous sub-items.
Patients that are included in a sub-item are:
• Patients who meet the data filters for the area AND
• Patients who meet the data filters for the ITEM AND
• Patients who meet any new data filters for the sub-item
•
i2iTracks Population Health Analytics: Custom Reports & Dashboards
29 iPHA Custom Reports & Dashboards Revision Date 11/8/2017 All rights reserved. No part of this document shall be reproduced, stored in a retrieval system, or transmitted by any means, electronic, mechanical, photocopying, recording, or otherwise, without written permission from i2i Systems, Inc.
You can even have sub-items under sub-items as shown below:
REPORT SUB-ITEMS
For the Sub-Item’s percentage calculation: The ITEM defines the denominator
The SUB- ITEM defines the numerator
i2iTracks Population Health Analytics: Custom Reports & Dashboards
30 iPHA Custom Reports & Dashboards Revision Date 11/8/2017 All rights reserved. No part of this document shall be reproduced, stored in a retrieval system, or transmitted by any means, electronic, mechanical, photocopying, recording, or otherwise, without written permission from i2i Systems, Inc.
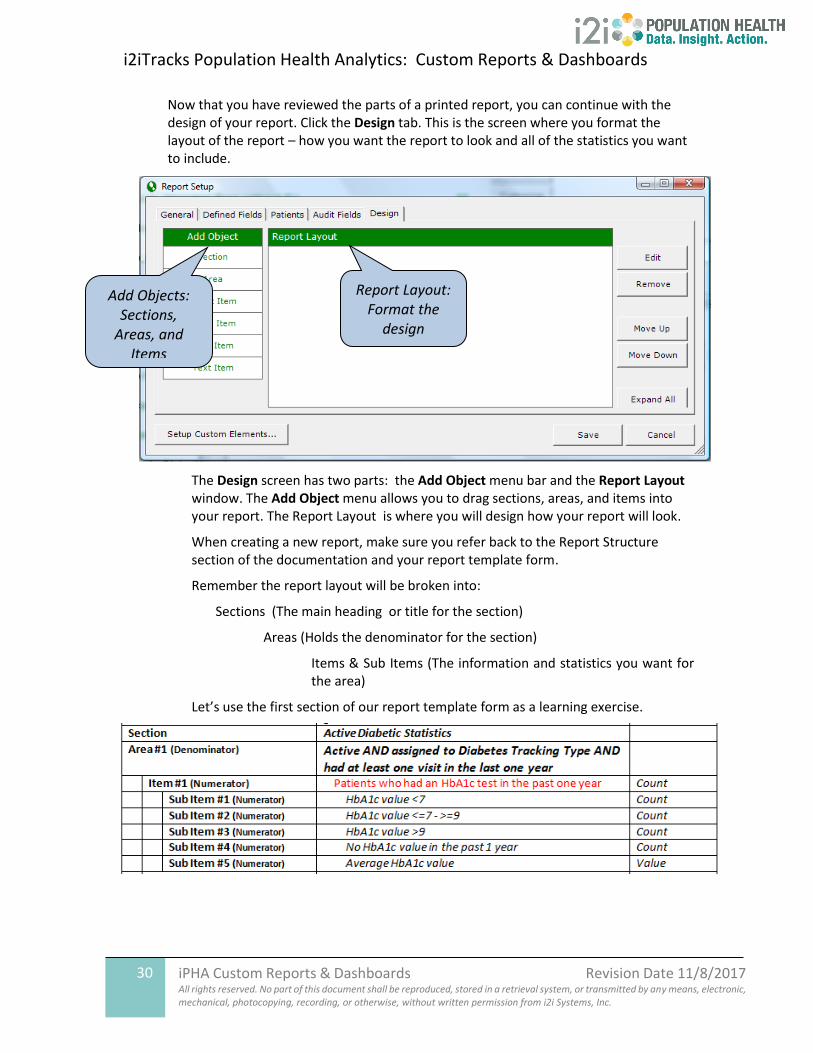
Now that you have reviewed the parts of a printed report, you can continue with the design of your report. Click the Design tab. This is the screen where you format the layout of the report – how you want the report to look and all of the statistics you want to include.
The Design screen has two parts: the Add Object menu bar and the Report Layout window. The Add Object menu allows you to drag sections, areas, and items into your report. The Report Layout is where you will design how your report will look.
When creating a new report, make sure you refer back to the Report Structure section of the documentation and your report template form.
Remember the report layout will be broken into:
Sections (The main heading or title for the section)
Areas (Holds the denominator for the section)
Items & Sub Items (The information and statistics you want for the area)
Let’s use the first section of our report template form as a learning exercise.
Add Objects: Sections,
Areas, and Items
Report Layout: Format the
design
i2iTracks Population Health Analytics: Custom Reports & Dashboards
31 iPHA Custom Reports & Dashboards Revision Date 11/8/2017 All rights reserved. No part of this document shall be reproduced, stored in a retrieval system, or transmitted by any means, electronic, mechanical, photocopying, recording, or otherwise, without written permission from i2i Systems, Inc.
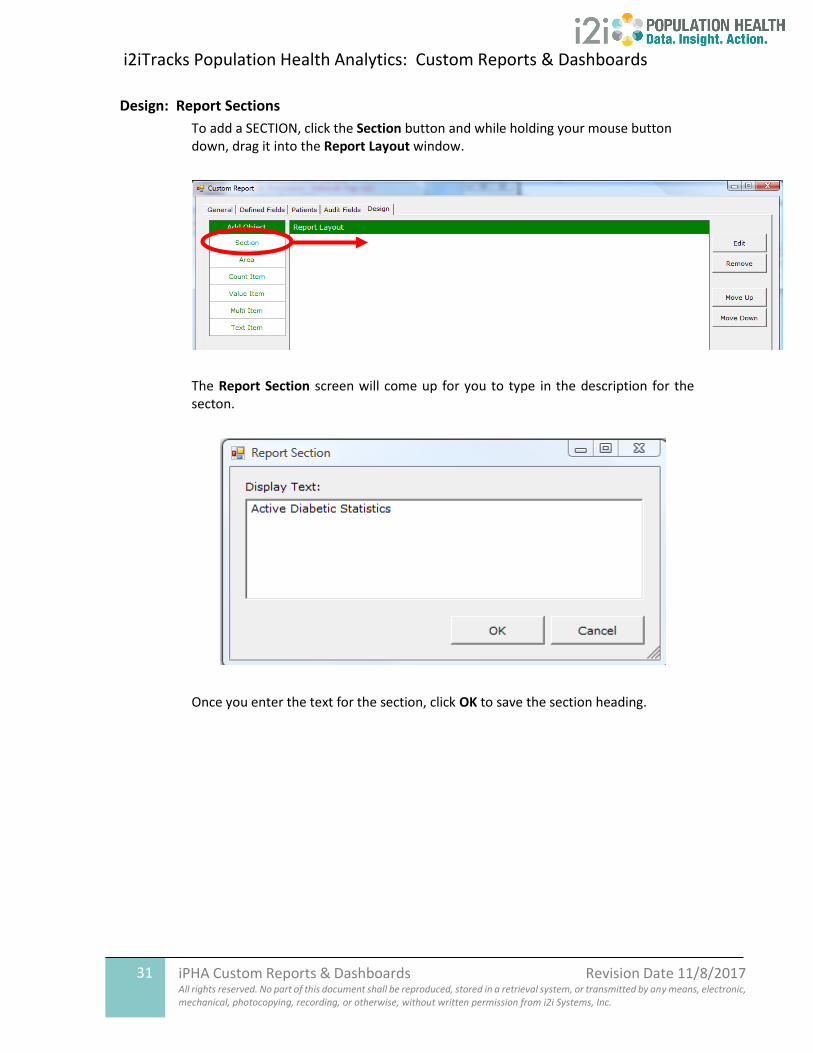
Design: Report Sections
To add a SECTION, click the Section button and while holding your mouse button down, drag it into the Report Layout window.
The Report Section screen will come up for you to type in the description for the secton.
Once you enter the text for the section, click OK to save the section heading.
i2iTracks Population Health Analytics: Custom Reports & Dashboards
32 iPHA Custom Reports & Dashboards Revision Date 11/8/2017 All rights reserved. No part of this document shall be reproduced, stored in a retrieval system, or transmitted by any means, electronic, mechanical, photocopying, recording, or otherwise, without written permission from i2i Systems, Inc.
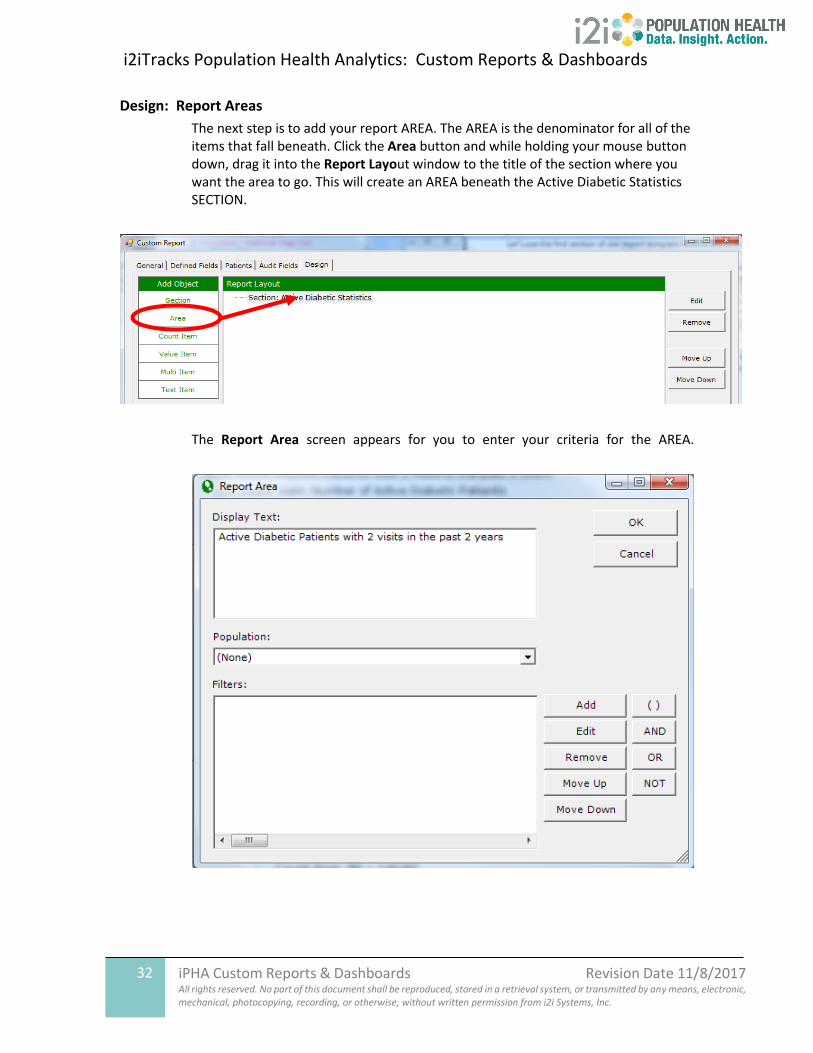
Design: Report Areas
The next step is to add your report AREA. The AREA is the denominator for all of the items that fall beneath. Click the Area button and while holding your mouse button down, drag it into the Report Layout window to the title of the section where you want the area to go. This will create an AREA beneath the Active Diabetic Statistics SECTION.
The Report Area screen appears for you to enter your criteria for the AREA.
i2iTracks Population Health Analytics: Custom Reports & Dashboards
33 iPHA Custom Reports & Dashboards Revision Date 11/8/2017 All rights reserved. No part of this document shall be reproduced, stored in a retrieval system, or transmitted by any means, electronic, mechanical, photocopying, recording, or otherwise, without written permission from i2i Systems, Inc.
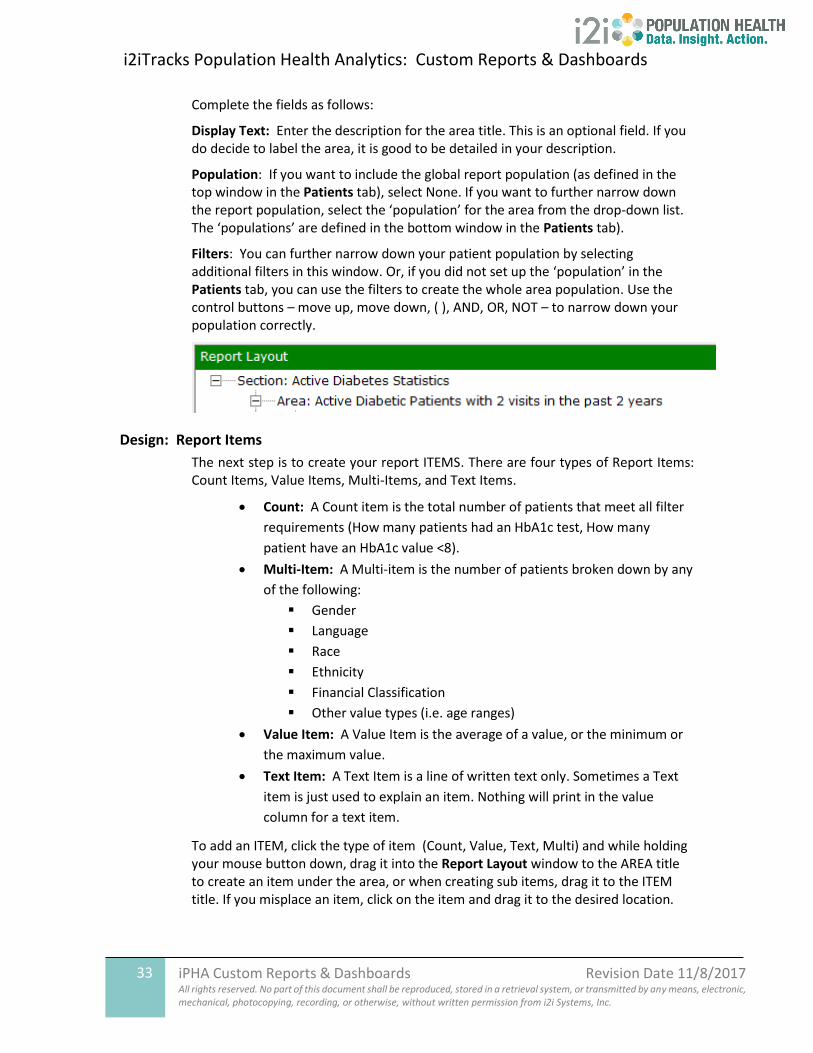
Complete the fields as follows:
Display Text: Enter the description for the area title. This is an optional field. If you do decide to label the area, it is good to be detailed in your description.
Population: If you want to include the global report population (as defined in the top window in the Patients tab), select None. If you want to further narrow down the report population, select the ‘population’ for the area from the drop-down list. The ‘populations’ are defined in the bottom window in the Patients tab).
Filters: You can further narrow down your patient population by selecting additional filters in this window. Or, if you did not set up the ‘population’ in the Patients tab, you can use the filters to create the whole area population. Use the control buttons – move up, move down, ( ), AND, OR, NOT – to narrow down your population correctly.
Design: Report Items
The next step is to create your report ITEMS. There are four types of Report Items: Count Items, Value Items, Multi-Items, and Text Items.
• Count: A Count item is the total number of patients that meet all filter
requirements (How many patients had an HbA1c test, How many
patient have an HbA1c value <8).
• Multi-Item: A Multi-item is the number of patients broken down by any
of the following:
▪ Gender
▪ Language
▪ Race
▪ Ethnicity
▪ Financial Classification
▪ Other value types (i.e. age ranges)
• Value Item: A Value Item is the average of a value, or the minimum or
the maximum value.
• Text Item: A Text Item is a line of written text only. Sometimes a Text
item is just used to explain an item. Nothing will print in the value
column for a text item.
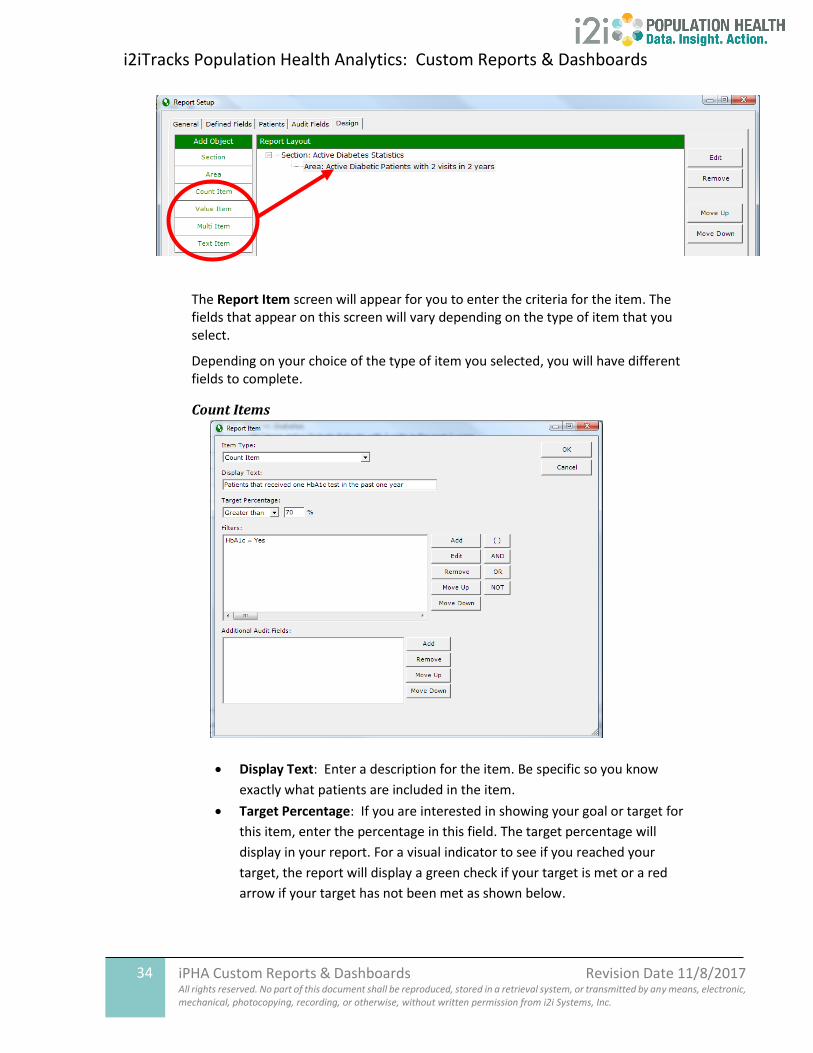
To add an ITEM, click the type of item (Count, Value, Text, Multi) and while holding your mouse button down, drag it into the Report Layout window to the AREA title to create an item under the area, or when creating sub items, drag it to the ITEM title. If you misplace an item, click on the item and drag it to the desired location.
i2iTracks Population Health Analytics: Custom Reports & Dashboards
34 iPHA Custom Reports & Dashboards Revision Date 11/8/2017 All rights reserved. No part of this document shall be reproduced, stored in a retrieval system, or transmitted by any means, electronic, mechanical, photocopying, recording, or otherwise, without written permission from i2i Systems, Inc.
The Report Item screen will appear for you to enter the criteria for the item. The fields that appear on this screen will vary depending on the type of item that you select.
Depending on your choice of the type of item you selected, you will have different fields to complete.
Count Items
• Display Text: Enter a description for the item. Be specific so you know
exactly what patients are included in the item.
• Target Percentage: If you are interested in showing your goal or target for
this item, enter the percentage in this field. The target percentage will
display in your report. For a visual indicator to see if you reached your
target, the report will display a green check if your target is met or a red
arrow if your target has not been met as shown below.
i2iTracks Population Health Analytics: Custom Reports & Dashboards
35 iPHA Custom Reports & Dashboards Revision Date 11/8/2017 All rights reserved. No part of this document shall be reproduced, stored in a retrieval system, or transmitted by any means, electronic, mechanical, photocopying, recording, or otherwise, without written permission from i2i Systems, Inc.
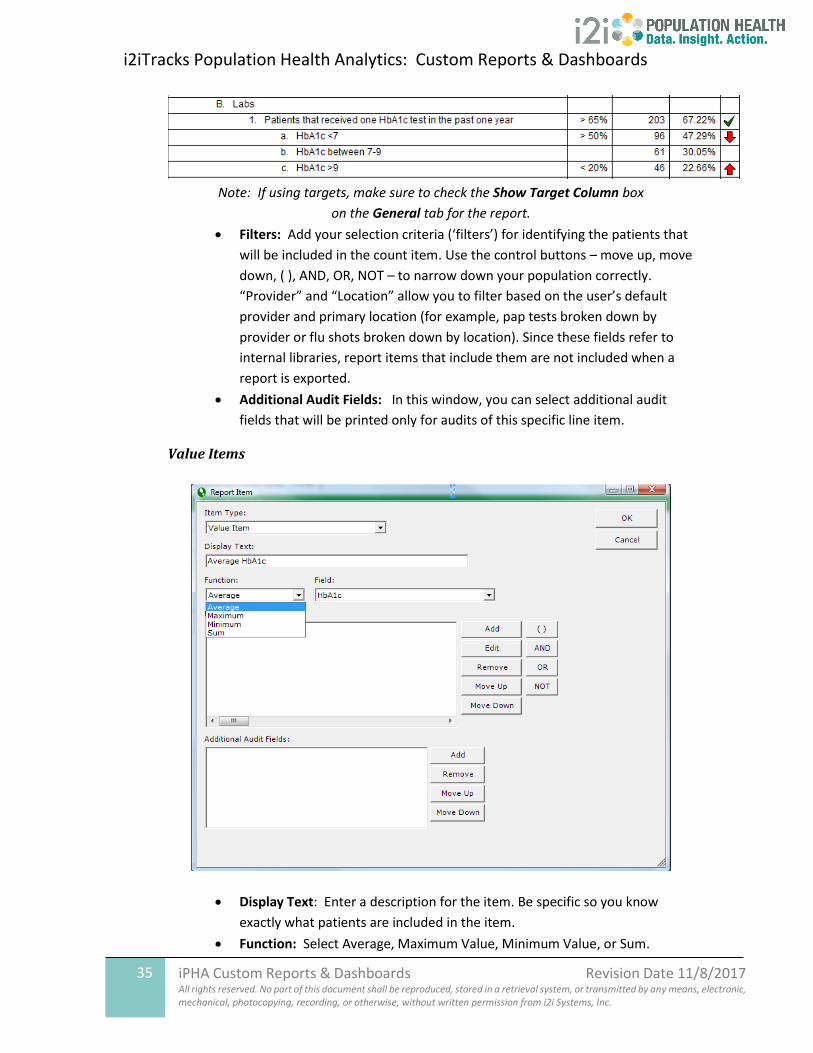
Note: If using targets, make sure to check the Show Target Column box
on the General tab for the report.
• Filters: Add your selection criteria (‘filters’) for identifying the patients that
will be included in the count item. Use the control buttons – move up, move
down, ( ), AND, OR, NOT – to narrow down your population correctly.
“Provider” and “Location” allow you to filter based on the user’s default
provider and primary location (for example, pap tests broken down by
provider or flu shots broken down by location). Since these fields refer to
internal libraries, report items that include them are not included when a
report is exported.
• Additional Audit Fields: In this window, you can select additional audit
fields that will be printed only for audits of this specific line item.
Value Items
• Display Text: Enter a description for the item. Be specific so you know
exactly what patients are included in the item.
• Function: Select Average, Maximum Value, Minimum Value, or Sum.
i2iTracks Population Health Analytics: Custom Reports & Dashboards
36 iPHA Custom Reports & Dashboards Revision Date 11/8/2017 All rights reserved. No part of this document shall be reproduced, stored in a retrieval system, or transmitted by any means, electronic, mechanical, photocopying, recording, or otherwise, without written permission from i2i Systems, Inc.
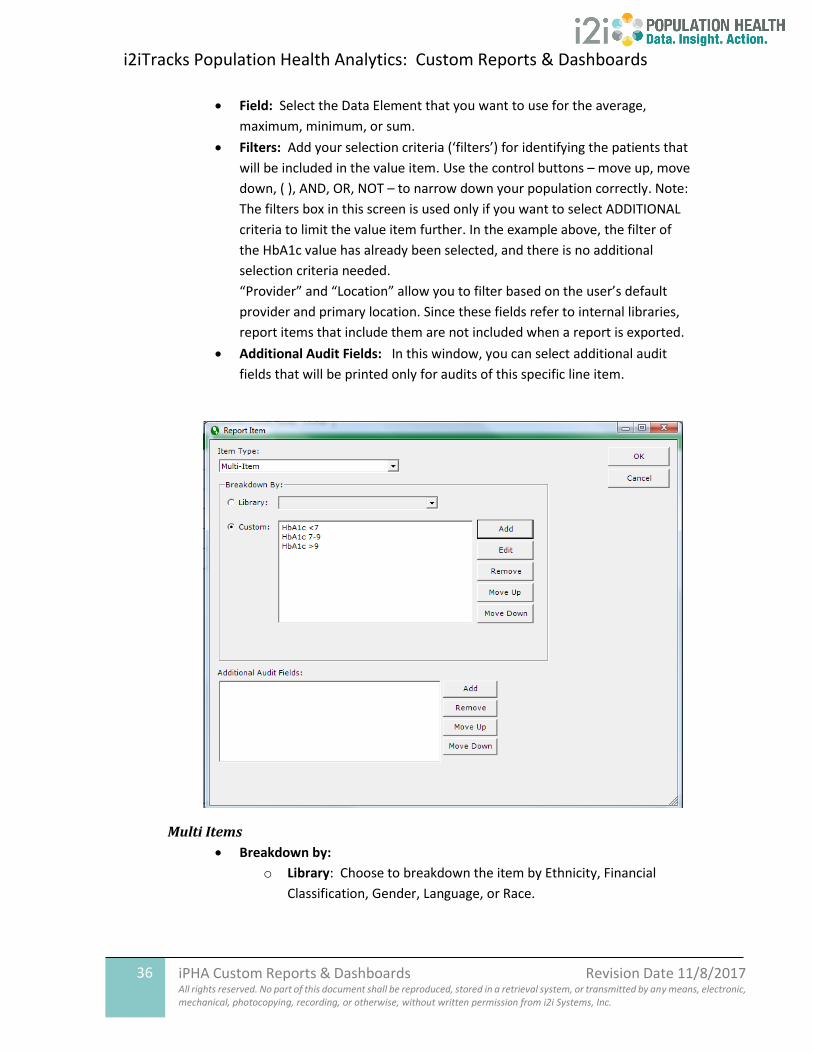
• Field: Select the Data Element that you want to use for the average,
maximum, minimum, or sum.
• Filters: Add your selection criteria (‘filters’) for identifying the patients that
will be included in the value item. Use the control buttons – move up, move
down, ( ), AND, OR, NOT – to narrow down your population correctly. Note:
The filters box in this screen is used only if you want to select ADDITIONAL
criteria to limit the value item further. In the example above, the filter of
the HbA1c value has already been selected, and there is no additional
selection criteria needed.
“Provider” and “Location” allow you to filter based on the user’s default
provider and primary location. Since these fields refer to internal libraries,
report items that include them are not included when a report is exported.
• Additional Audit Fields: In this window, you can select additional audit
fields that will be printed only for audits of this specific line item.
Multi Items
• Breakdown by:
o Library: Choose to breakdown the item by Ethnicity, Financial
Classification, Gender, Language, or Race.
i2iTracks Population Health Analytics: Custom Reports & Dashboards
37 iPHA Custom Reports & Dashboards Revision Date 11/8/2017 All rights reserved. No part of this document shall be reproduced, stored in a retrieval system, or transmitted by any means, electronic, mechanical, photocopying, recording, or otherwise, without written permission from i2i Systems, Inc.
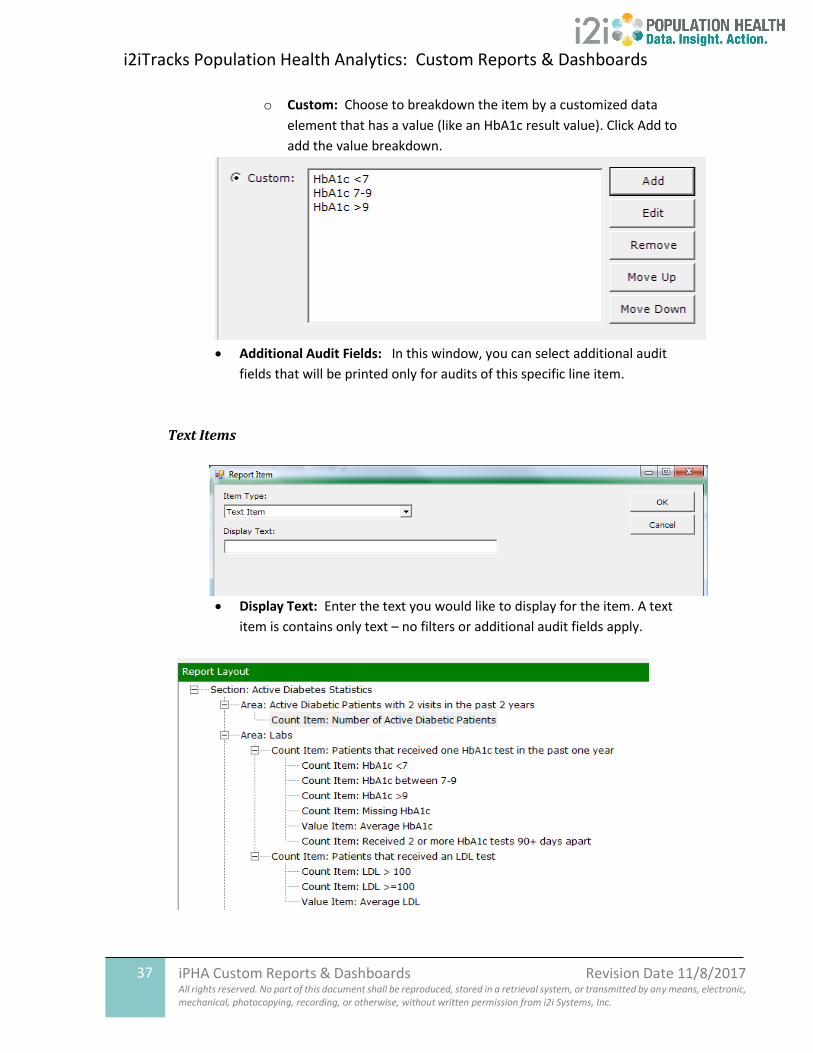
o Custom: Choose to breakdown the item by a customized data
element that has a value (like an HbA1c result value). Click Add to
add the value breakdown.
• Additional Audit Fields: In this window, you can select additional audit
fields that will be printed only for audits of this specific line item.
Text Items
• Display Text: Enter the text you would like to display for the item. A text
item is contains only text – no filters or additional audit fields apply.
i2iTracks Population Health Analytics: Custom Reports & Dashboards
38 iPHA Custom Reports & Dashboards Revision Date 11/8/2017 All rights reserved. No part of this document shall be reproduced, stored in a retrieval system, or transmitted by any means, electronic, mechanical, photocopying, recording, or otherwise, without written permission from i2i Systems, Inc.
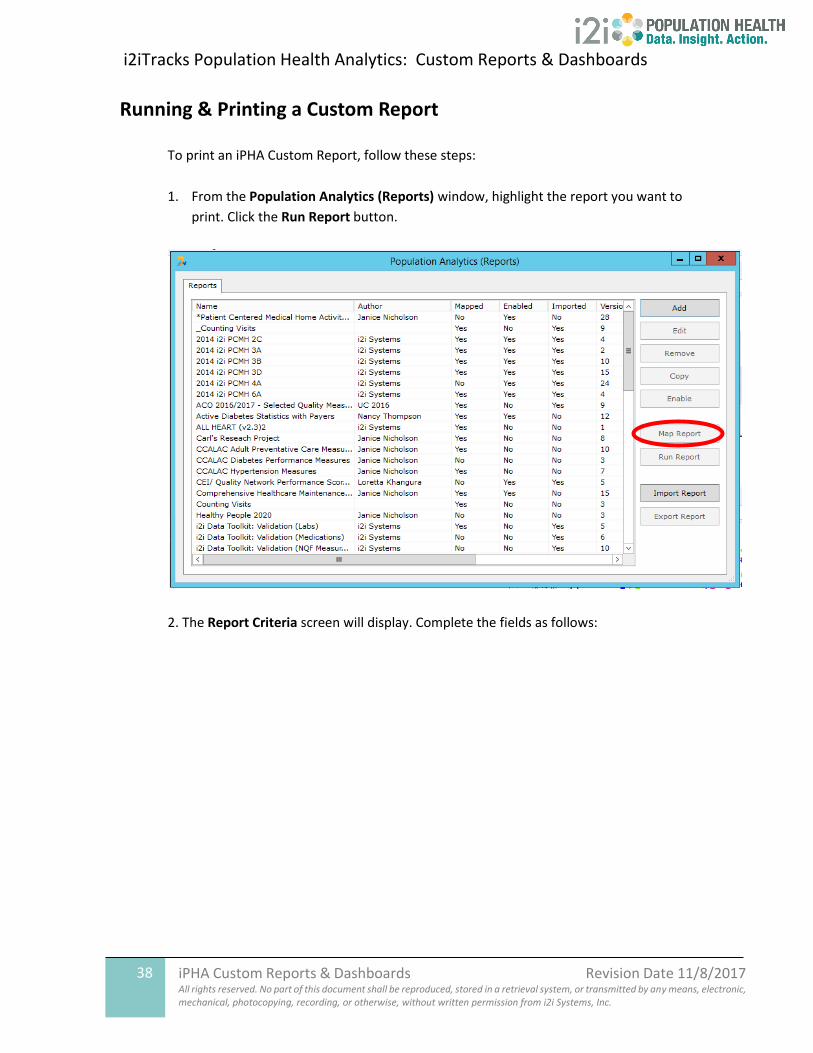
Running & Printing a Custom Report
To print an iPHA Custom Report, follow these steps:
1. From the Population Analytics (Reports) window, highlight the report you want to
print. Click the Run Report button.
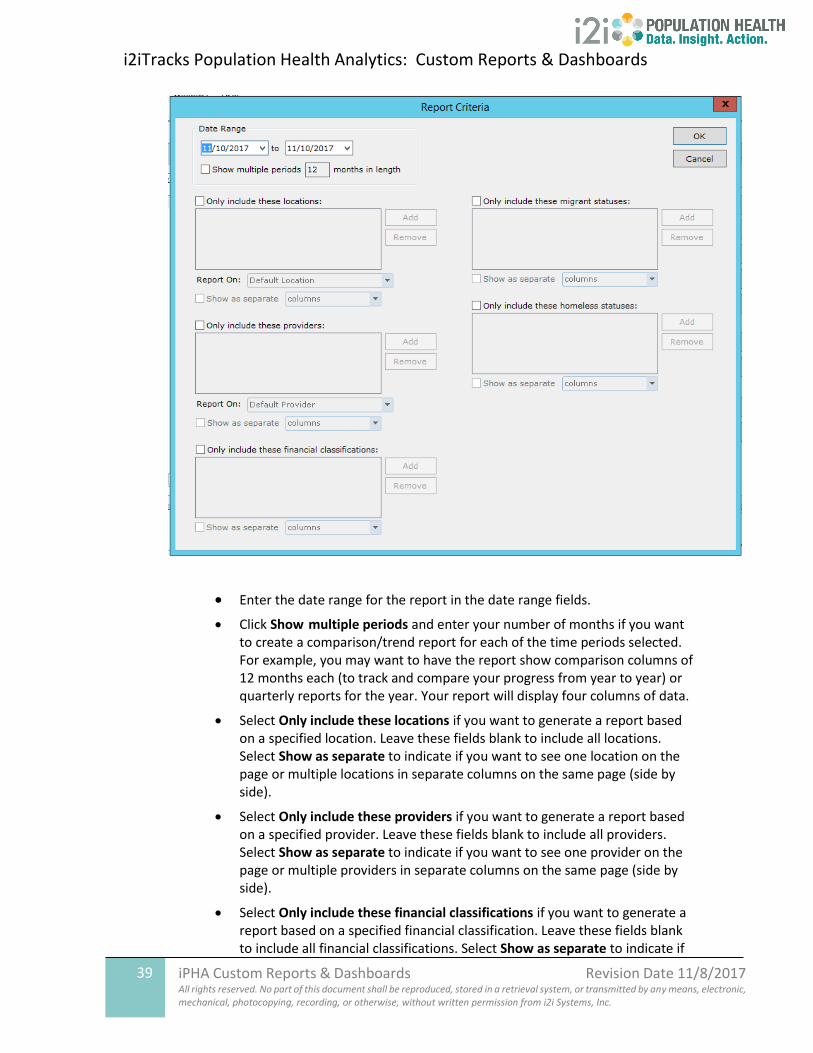
2. The Report Criteria screen will display. Complete the fields as follows:
i2iTracks Population Health Analytics: Custom Reports & Dashboards
39 iPHA Custom Reports & Dashboards Revision Date 11/8/2017 All rights reserved. No part of this document shall be reproduced, stored in a retrieval system, or transmitted by any means, electronic, mechanical, photocopying, recording, or otherwise, without written permission from i2i Systems, Inc.
• Enter the date range for the report in the date range fields.
• Click Show multiple periods and enter your number of months if you want to create a comparison/trend report for each of the time periods selected. For example, you may want to have the report show comparison columns of 12 months each (to track and compare your progress from year to year) or quarterly reports for the year. Your report will display four columns of data.
• Select Only include these locations if you want to generate a report based on a specified location. Leave these fields blank to include all locations. Select Show as separate to indicate if you want to see one location on the page or multiple locations in separate columns on the same page (side by side).
• Select Only include these providers if you want to generate a report based on a specified provider. Leave these fields blank to include all providers. Select Show as separate to indicate if you want to see one provider on the page or multiple providers in separate columns on the same page (side by side).
• Select Only include these financial classifications if you want to generate a report based on a specified financial classification. Leave these fields blank to include all financial classifications. Select Show as separate to indicate if
i2iTracks Population Health Analytics: Custom Reports & Dashboards
40 iPHA Custom Reports & Dashboards Revision Date 11/8/2017 All rights reserved. No part of this document shall be reproduced, stored in a retrieval system, or transmitted by any means, electronic, mechanical, photocopying, recording, or otherwise, without written permission from i2i Systems, Inc.
you want to see one financial class on the page or multiple financial classes in separate columns on the same page (side by side).
• Select Only include these Migrant Statuses if you want to generate a report based on a specific migrant status. Leave these fields blank to include all migrant statuses. Select Show as Separate to indicate if you want to see one migrant status on the page or multiple migrant statuses in separate columns on the same page (side by side).
• Select Only include these Homeless Statuses if you want to generate a report based on a specific homeless status. Leave these fields blank to include all homeless statuses. Select Show as Separate to indicate if you want to see one homeless status on the page or multiple homeless statuses in separate columns on the same page (side by side).
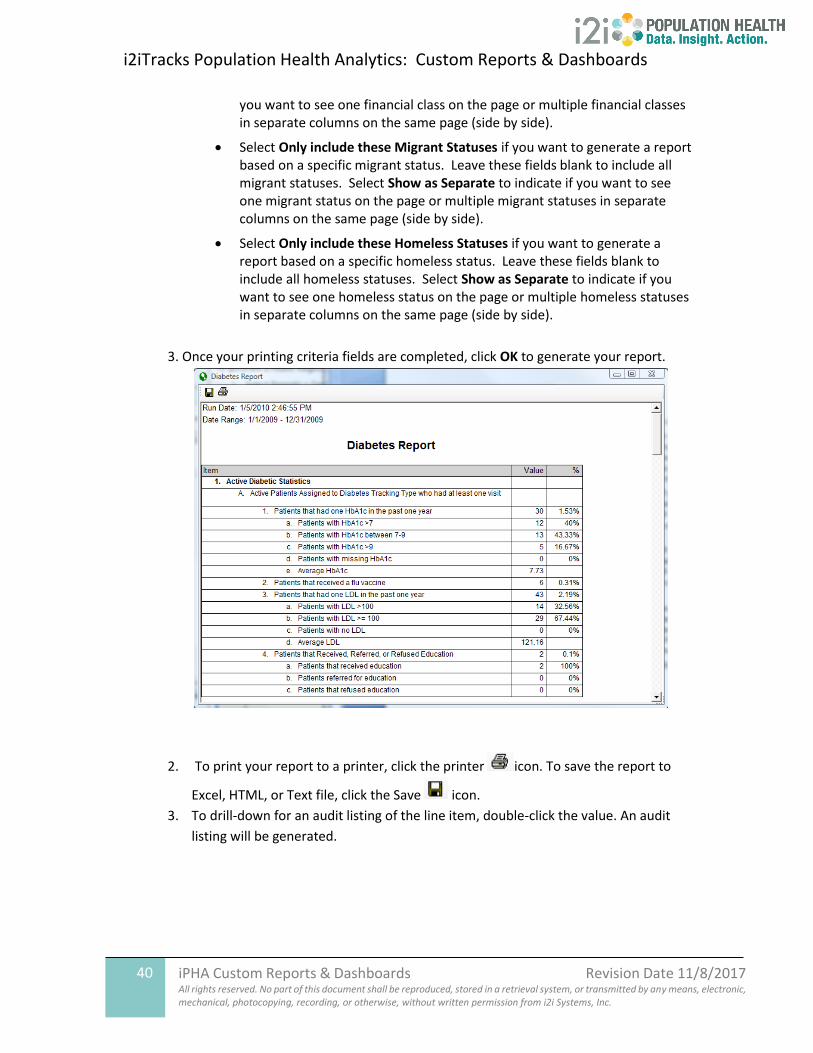
3. Once your printing criteria fields are completed, click OK to generate your report.
2. To print your report to a printer, click the printer icon. To save the report to
Excel, HTML, or Text file, click the Save icon.
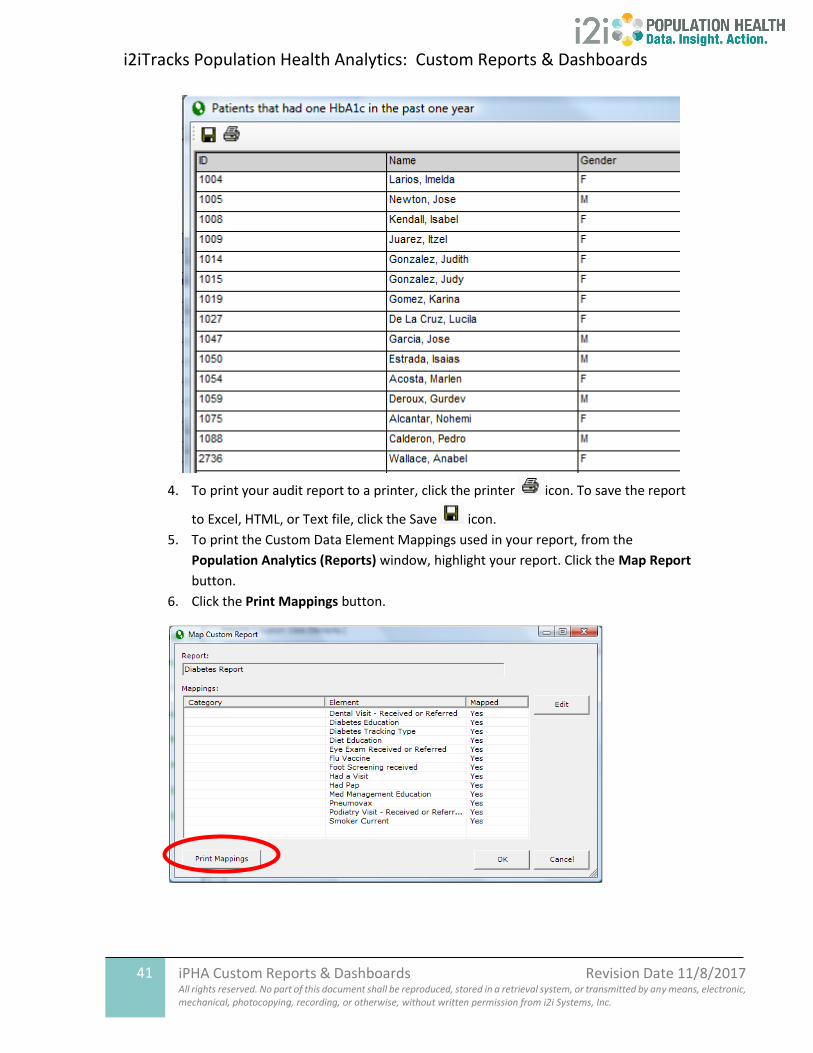
3. To drill-down for an audit listing of the line item, double-click the value. An audit
listing will be generated.
i2iTracks Population Health Analytics: Custom Reports & Dashboards
41 iPHA Custom Reports & Dashboards Revision Date 11/8/2017 All rights reserved. No part of this document shall be reproduced, stored in a retrieval system, or transmitted by any means, electronic, mechanical, photocopying, recording, or otherwise, without written permission from i2i Systems, Inc.
4. To print your audit report to a printer, click the printer icon. To save the report
to Excel, HTML, or Text file, click the Save icon.
5. To print the Custom Data Element Mappings used in your report, from the
Population Analytics (Reports) window, highlight your report. Click the Map Report
button.
6. Click the Print Mappings button.
i2iTracks Population Health Analytics: Custom Reports & Dashboards
42 iPHA Custom Reports & Dashboards Revision Date 11/8/2017 All rights reserved. No part of this document shall be reproduced, stored in a retrieval system, or transmitted by any means, electronic, mechanical, photocopying, recording, or otherwise, without written permission from i2i Systems, Inc.
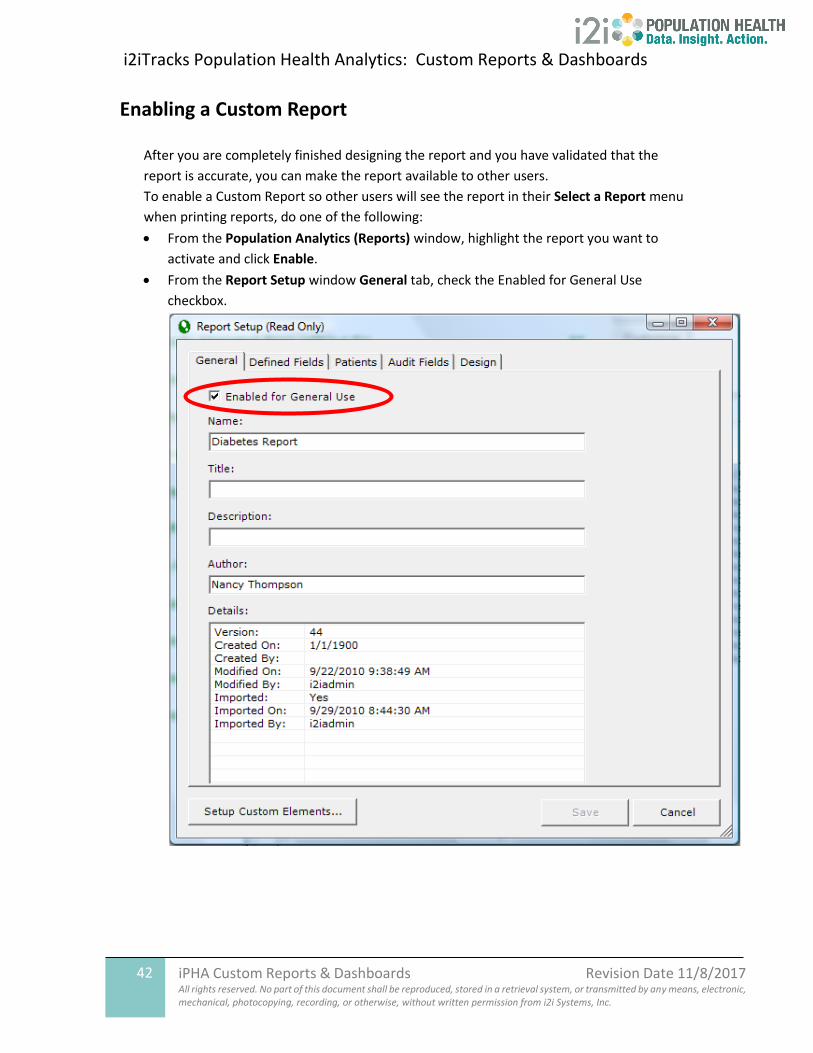
Enabling a Custom Report
After you are completely finished designing the report and you have validated that the
report is accurate, you can make the report available to other users.
To enable a Custom Report so other users will see the report in their Select a Report menu
when printing reports, do one of the following:
• From the Population Analytics (Reports) window, highlight the report you want to
activate and click Enable.
• From the Report Setup window General tab, check the Enabled for General Use
checkbox.
i2iTracks Population Health Analytics: Custom Reports & Dashboards
43 iPHA Custom Reports & Dashboards Revision Date 11/8/2017 All rights reserved. No part of this document shall be reproduced, stored in a retrieval system, or transmitted by any means, electronic, mechanical, photocopying, recording, or otherwise, without written permission from i2i Systems, Inc.
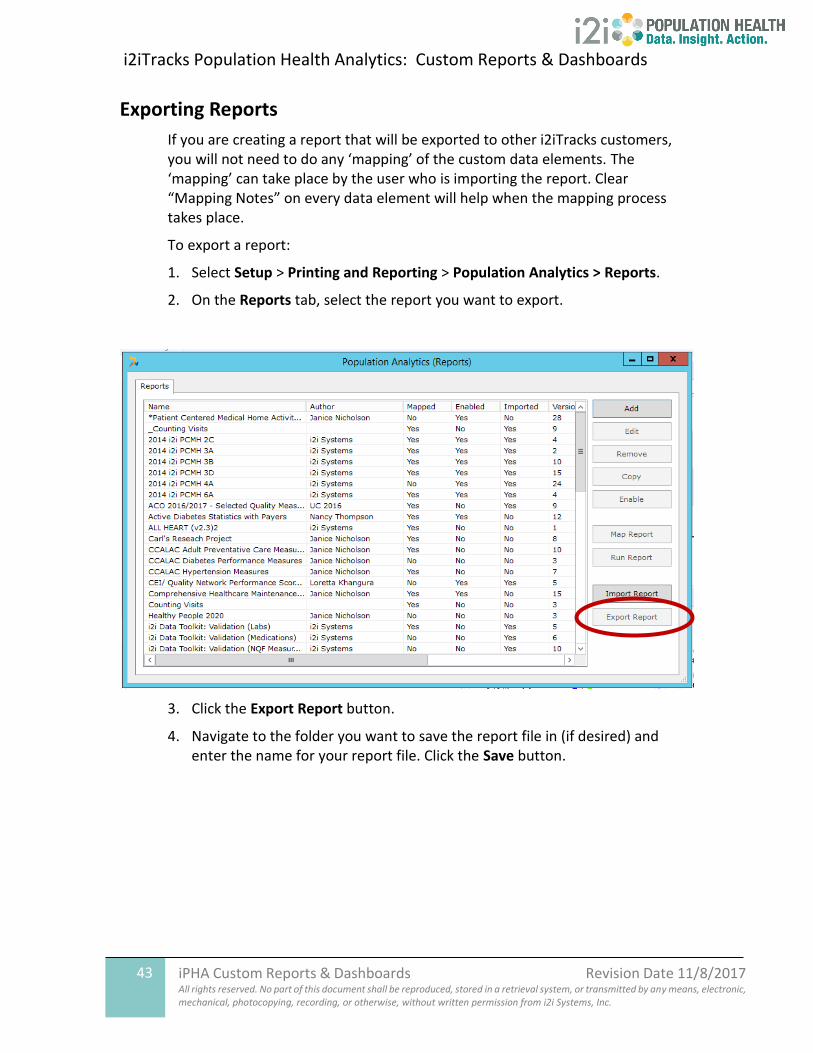
Exporting Reports
If you are creating a report that will be exported to other i2iTracks customers, you will not need to do any ‘mapping’ of the custom data elements. The ‘mapping’ can take place by the user who is importing the report. Clear “Mapping Notes” on every data element will help when the mapping process takes place.
To export a report:
1. Select Setup > Printing and Reporting > Population Analytics > Reports.
2. On the Reports tab, select the report you want to export.
3. Click the Export Report button.
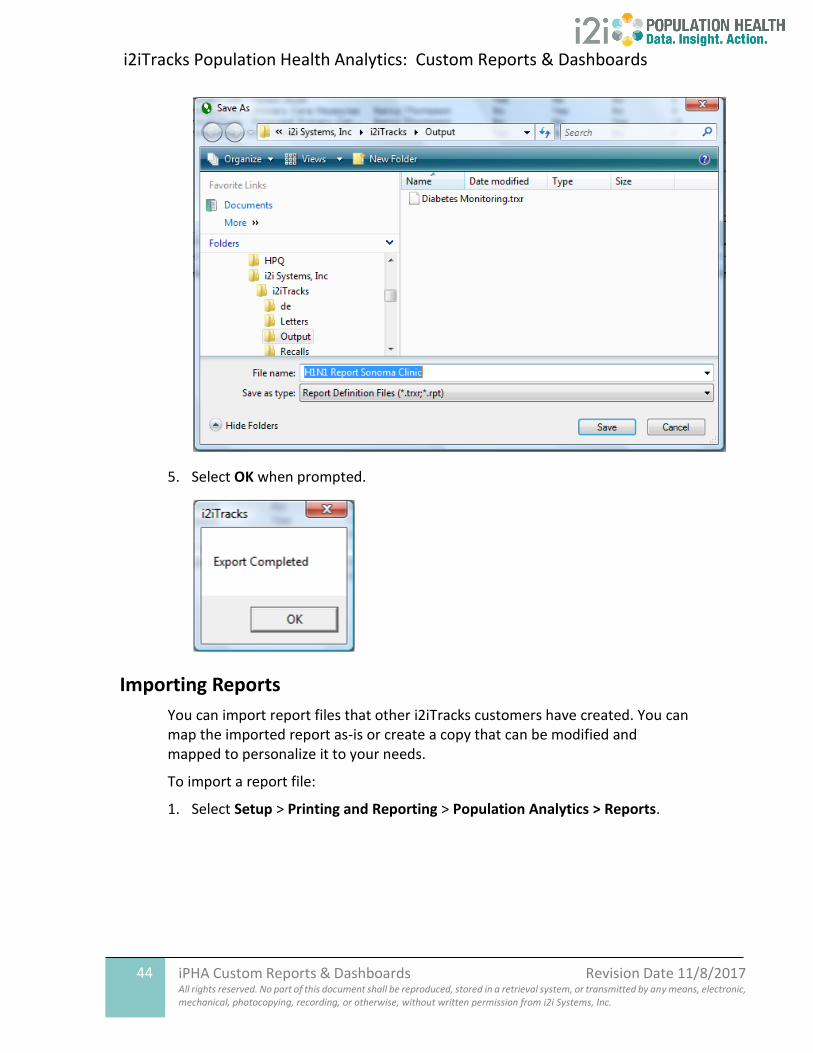
4. Navigate to the folder you want to save the report file in (if desired) and enter the name for your report file. Click the Save button.
i2iTracks Population Health Analytics: Custom Reports & Dashboards
44 iPHA Custom Reports & Dashboards Revision Date 11/8/2017 All rights reserved. No part of this document shall be reproduced, stored in a retrieval system, or transmitted by any means, electronic, mechanical, photocopying, recording, or otherwise, without written permission from i2i Systems, Inc.
5. Select OK when prompted.
Importing Reports
You can import report files that other i2iTracks customers have created. You can map the imported report as-is or create a copy that can be modified and mapped to personalize it to your needs.
To import a report file:
1. Select Setup > Printing and Reporting > Population Analytics > Reports.
i2iTracks Population Health Analytics: Custom Reports & Dashboards
45 iPHA Custom Reports & Dashboards Revision Date 11/8/2017 All rights reserved. No part of this document shall be reproduced, stored in a retrieval system, or transmitted by any means, electronic, mechanical, photocopying, recording, or otherwise, without written permission from i2i Systems, Inc.
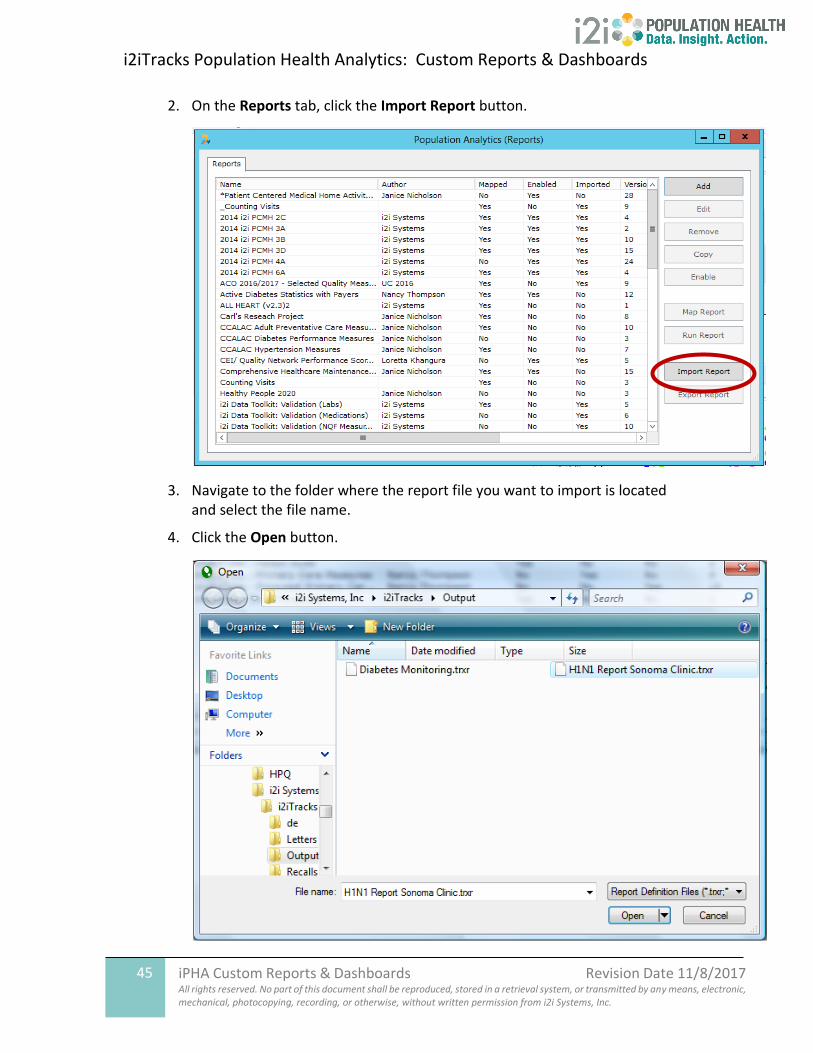
2. On the Reports tab, click the Import Report button.
3. Navigate to the folder where the report file you want to import is located and select the file name.
4. Click the Open button.
i2iTracks Population Health Analytics: Custom Reports & Dashboards
46 iPHA Custom Reports & Dashboards Revision Date 11/8/2017 All rights reserved. No part of this document shall be reproduced, stored in a retrieval system, or transmitted by any means, electronic, mechanical, photocopying, recording, or otherwise, without written permission from i2i Systems, Inc.
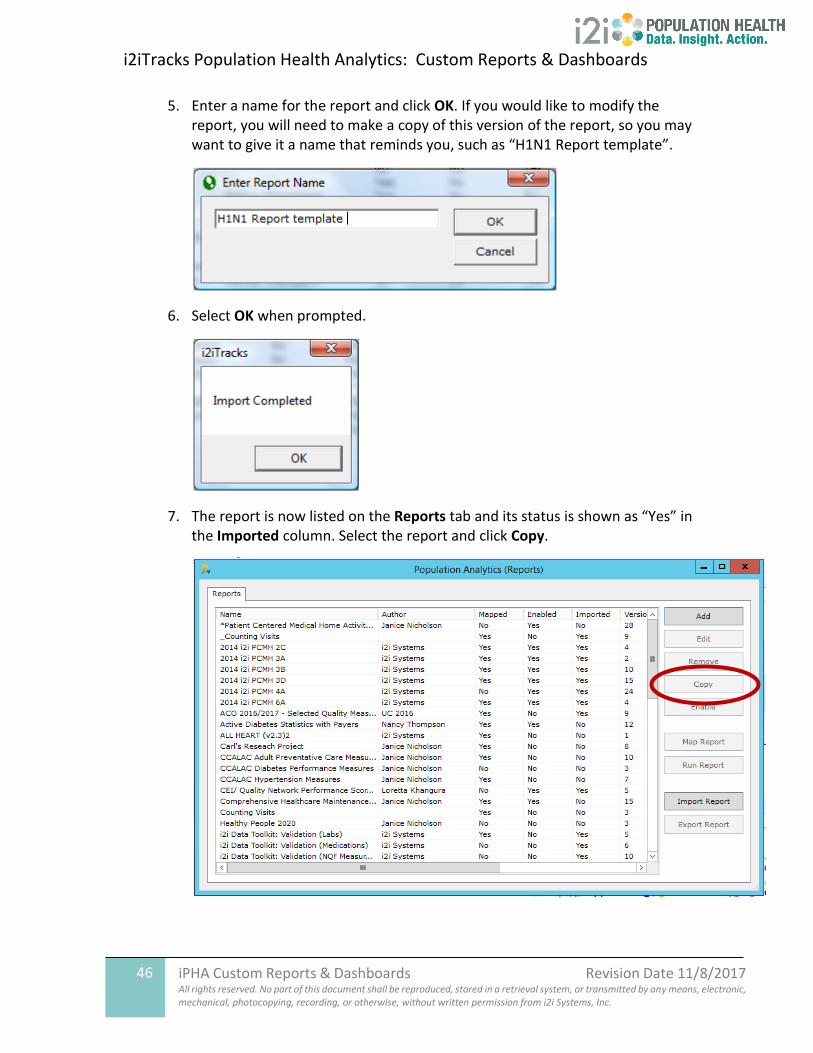
5. Enter a name for the report and click OK. If you would like to modify the report, you will need to make a copy of this version of the report, so you may want to give it a name that reminds you, such as “H1N1 Report template”.
6. Select OK when prompted.
7. The report is now listed on the Reports tab and its status is shown as “Yes” in the Imported column. Select the report and click Copy.
i2iTracks Population Health Analytics: Custom Reports & Dashboards
47 iPHA Custom Reports & Dashboards Revision Date 11/8/2017 All rights reserved. No part of this document shall be reproduced, stored in a retrieval system, or transmitted by any means, electronic, mechanical, photocopying, recording, or otherwise, without written permission from i2i Systems, Inc.
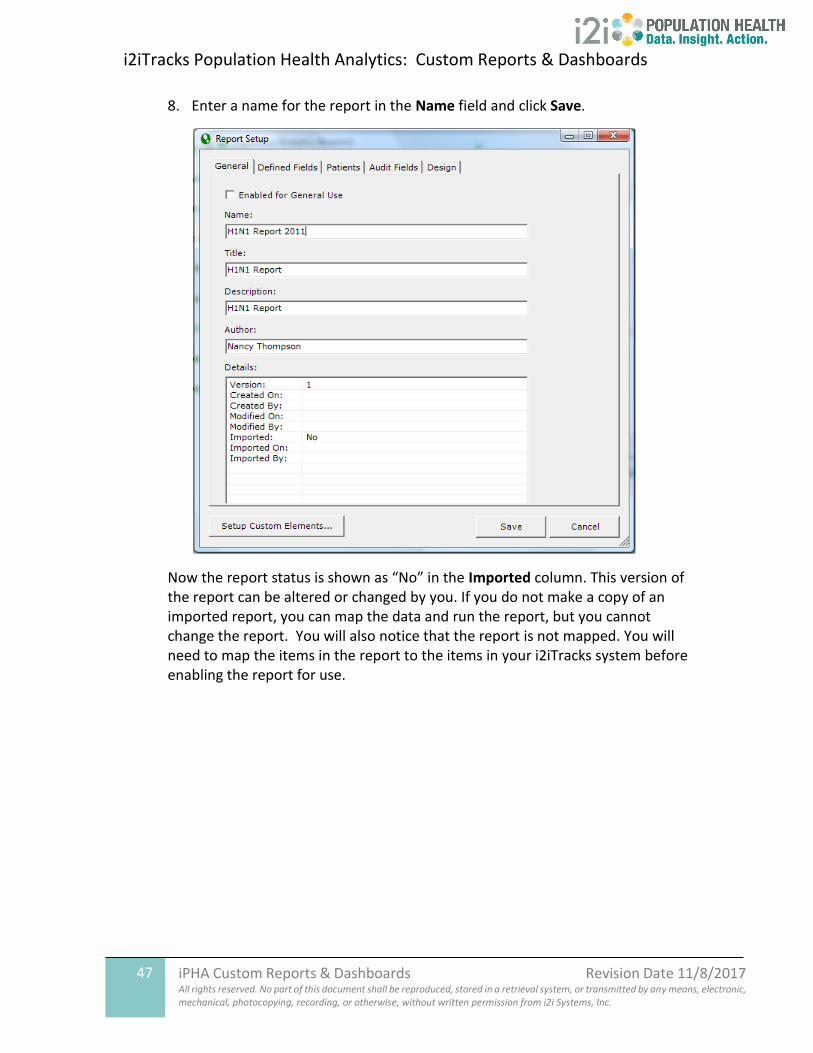
8. Enter a name for the report in the Name field and click Save.
Now the report status is shown as “No” in the Imported column. This version of the report can be altered or changed by you. If you do not make a copy of an imported report, you can map the data and run the report, but you cannot change the report. You will also notice that the report is not mapped. You will need to map the items in the report to the items in your i2iTracks system before enabling the report for use.
i2iTracks Population Health Analytics: Custom Reports & Dashboards
48 iPHA Custom Reports & Dashboards Revision Date 11/8/2017 All rights reserved. No part of this document shall be reproduced, stored in a retrieval system, or transmitted by any means, electronic, mechanical, photocopying, recording, or otherwise, without written permission from i2i Systems, Inc.
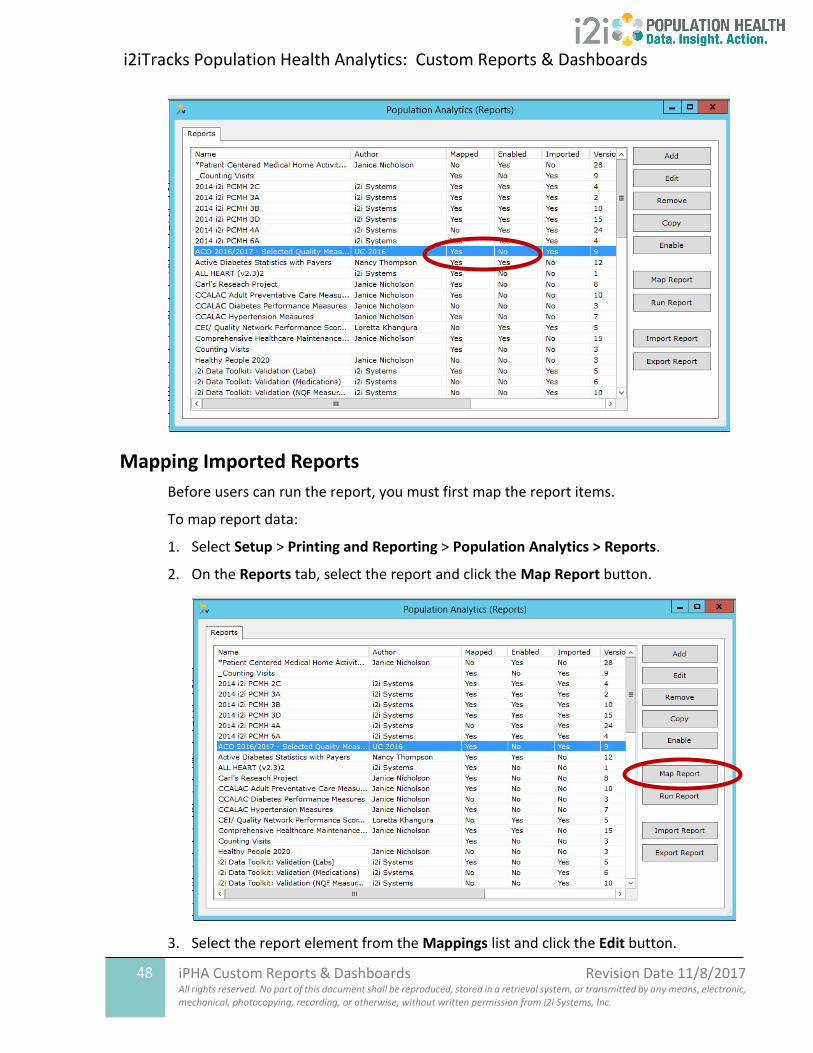
Mapping Imported Reports
Before users can run the report, you must first map the report items.
To map report data:
1. Select Setup > Printing and Reporting > Population Analytics > Reports.
2. On the Reports tab, select the report and click the Map Report button.
3. Select the report element from the Mappings list and click the Edit button.
i2iTracks Population Health Analytics: Custom Reports & Dashboards
49 iPHA Custom Reports & Dashboards Revision Date 11/8/2017 All rights reserved. No part of this document shall be reproduced, stored in a retrieval system, or transmitted by any means, electronic, mechanical, photocopying, recording, or otherwise, without written permission from i2i Systems, Inc.
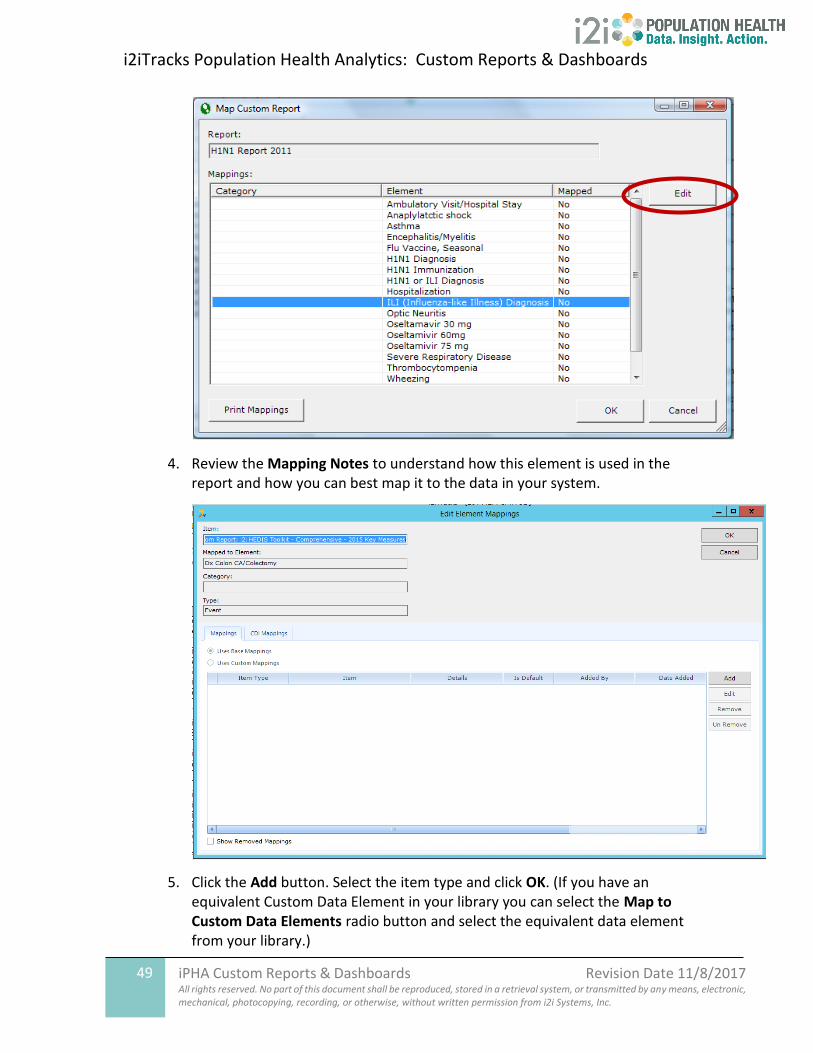
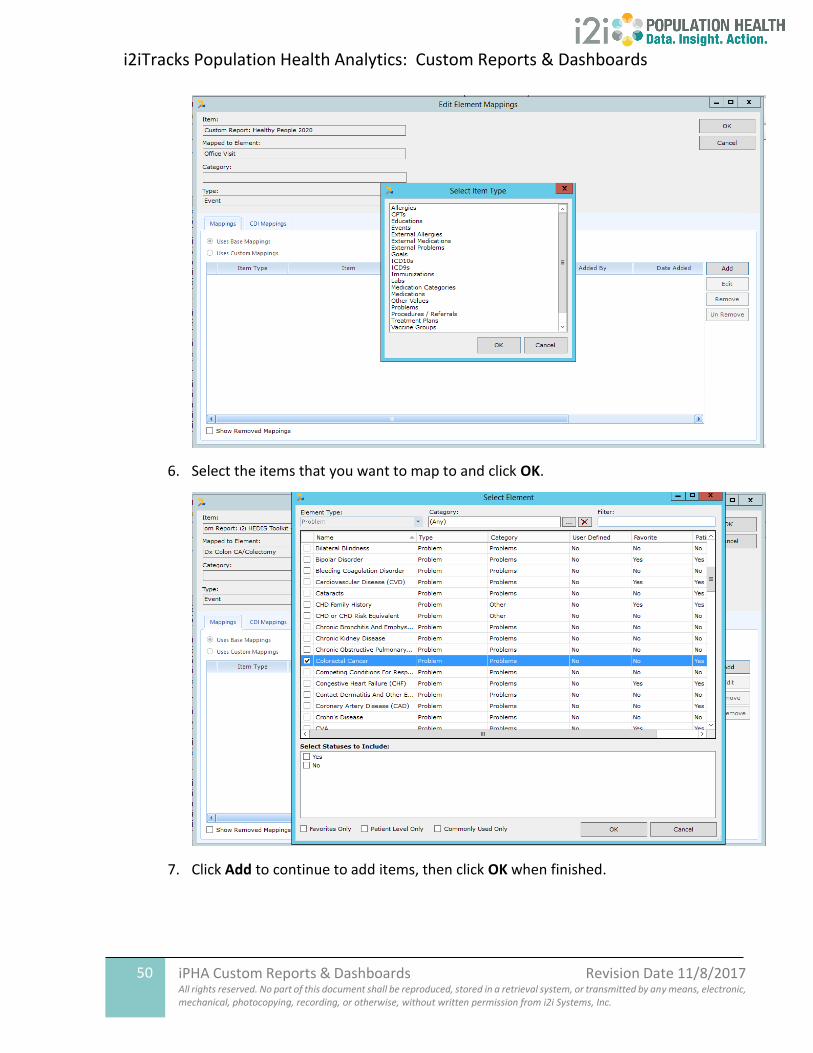
4. Review the Mapping Notes to understand how this element is used in the report and how you can best map it to the data in your system.
5. Click the Add button. Select the item type and click OK. (If you have an equivalent Custom Data Element in your library you can select the Map to Custom Data Elements radio button and select the equivalent data element from your library.)
i2iTracks Population Health Analytics: Custom Reports & Dashboards
50 iPHA Custom Reports & Dashboards Revision Date 11/8/2017 All rights reserved. No part of this document shall be reproduced, stored in a retrieval system, or transmitted by any means, electronic, mechanical, photocopying, recording, or otherwise, without written permission from i2i Systems, Inc.
6. Select the items that you want to map to and click OK.
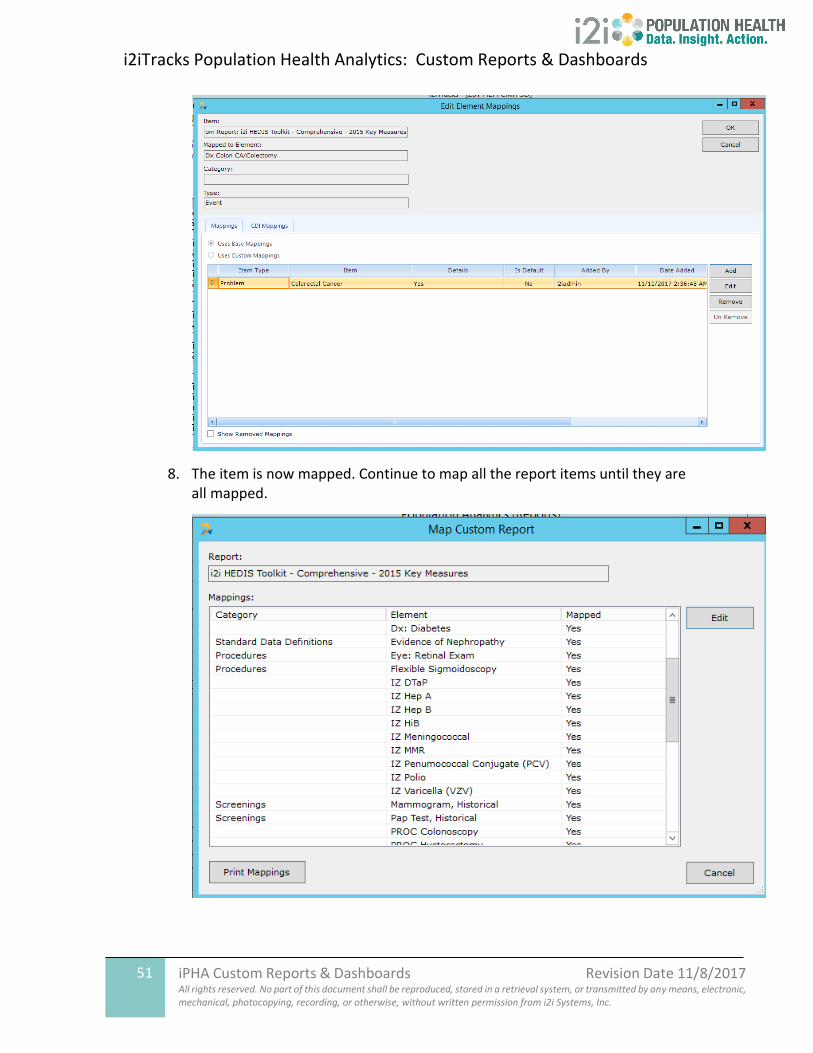
7. Click Add to continue to add items, then click OK when finished.
i2iTracks Population Health Analytics: Custom Reports & Dashboards
51 iPHA Custom Reports & Dashboards Revision Date 11/8/2017 All rights reserved. No part of this document shall be reproduced, stored in a retrieval system, or transmitted by any means, electronic, mechanical, photocopying, recording, or otherwise, without written permission from i2i Systems, Inc.
8. The item is now mapped. Continue to map all the report items until they are all mapped.
i2iTracks Population Health Analytics: Custom Reports & Dashboards
52 iPHA Custom Reports & Dashboards Revision Date 11/8/2017 All rights reserved. No part of this document shall be reproduced, stored in a retrieval system, or transmitted by any means, electronic, mechanical, photocopying, recording, or otherwise, without written permission from i2i Systems, Inc.
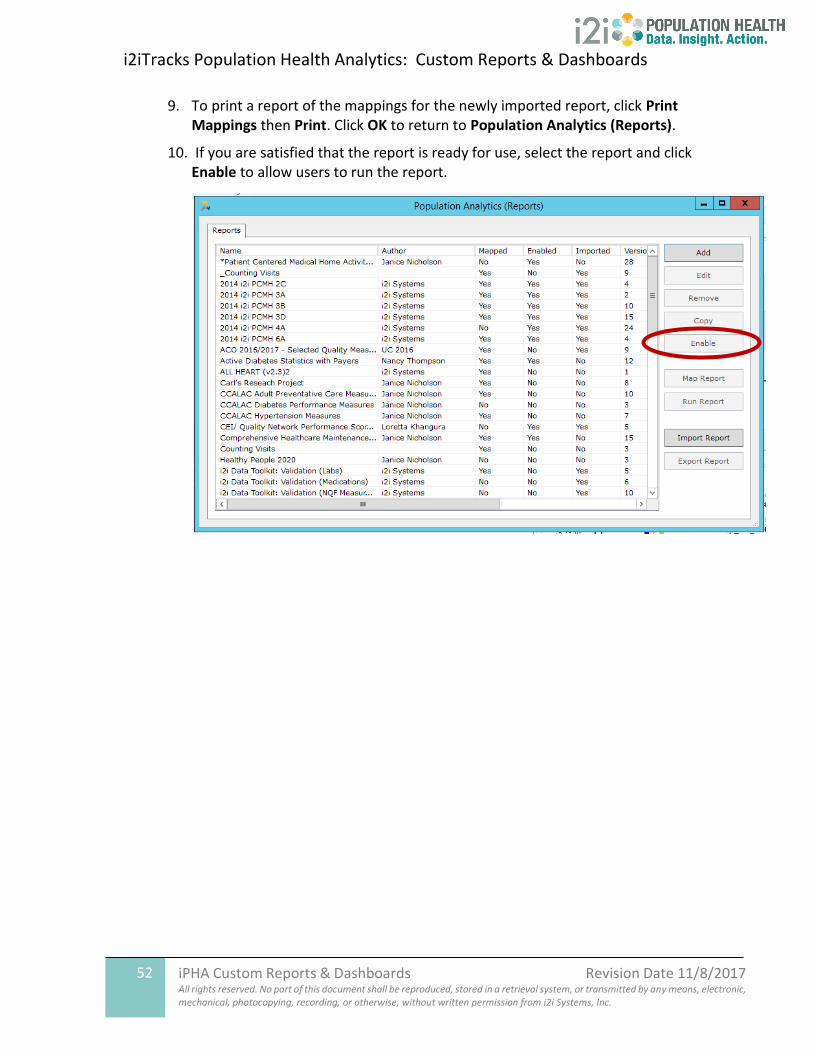
9. To print a report of the mappings for the newly imported report, click Print Mappings then Print. Click OK to return to Population Analytics (Reports).
10. If you are satisfied that the report is ready for use, select the report and click Enable to allow users to run the report.
i2iTracks Population Health Analytics: Custom Reports & Dashboards
53 iPHA Custom Reports & Dashboards Revision Date 11/8/2017 All rights reserved. No part of this document shall be reproduced, stored in a retrieval system, or transmitted by any means, electronic, mechanical, photocopying, recording, or otherwise, without written permission from i2i Systems, Inc.
Creating iPHA Custom Graphs Overview
You can create custom graphs, or series of graphs; display and print graphs; and add a Graphs
tab to i2iTracks Today screen. The following is an overview of the steps to take when creating a
graph in iPHA:
1. Understand how a graph is structured and document the information you want to
display in a graph.
2. Set up the data elements (fields and filters) you want to use in the report in the Custom
Data Elements library.
3. Design your graph.
a. Assign your graph a title.
b. Select the data elements from the library and define their parameters.
c. Identify the main Patient Population and any Sub-Populations you want to use
in your report.
d. Select the audit fields (data/details) that you would like to display for each
patient when printing an audit list.
e. Create the design/layout of the report – define x and y axis, reporting periods
and goal ranges.
6. Review and audit your graph for accuracy.
7. Enable the graph for use by other users so they will see the graph in their Select a Graph
Screen menu when printing graphs.
Creating iPHA Custom Graphs
Follow these steps to access and create iPHA Custom Graphs:
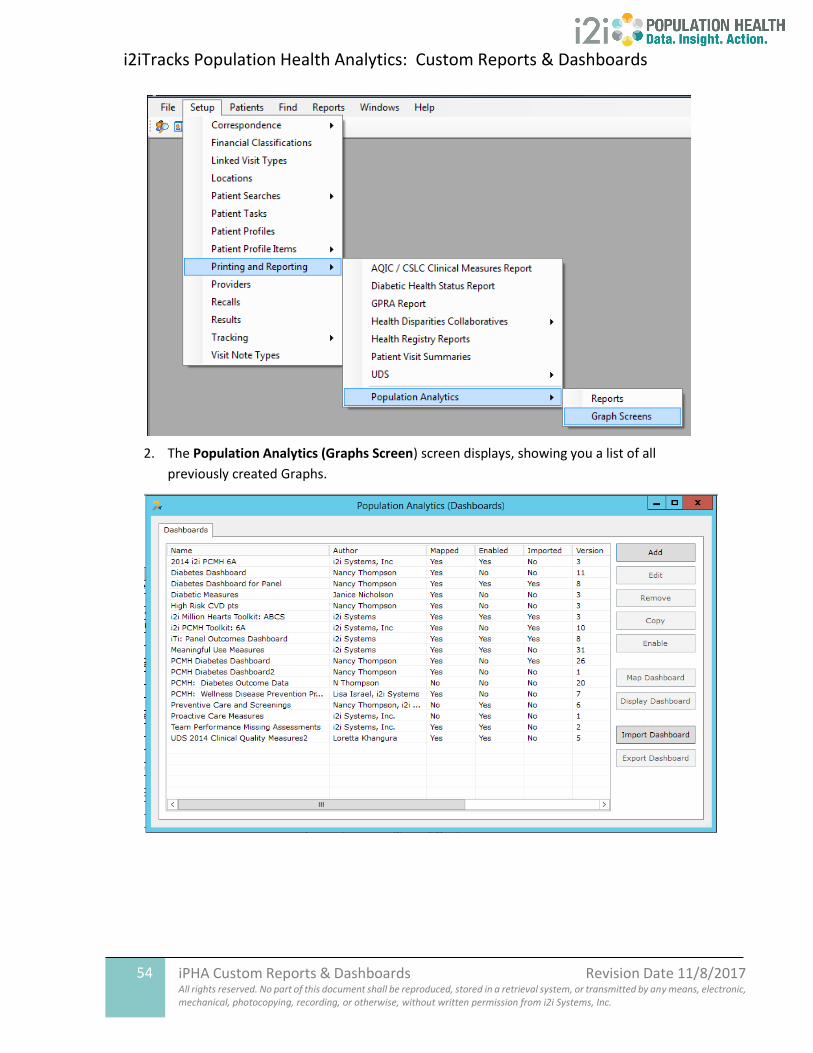
1. Setup > Printing and Reporting > Population Analytics > Graph Screens.
i2iTracks Population Health Analytics: Custom Reports & Dashboards
54 iPHA Custom Reports & Dashboards Revision Date 11/8/2017 All rights reserved. No part of this document shall be reproduced, stored in a retrieval system, or transmitted by any means, electronic, mechanical, photocopying, recording, or otherwise, without written permission from i2i Systems, Inc.
2. The Population Analytics (Graphs Screen) screen displays, showing you a list of all
previously created Graphs.
i2iTracks Population Health Analytics: Custom Reports & Dashboards
55 iPHA Custom Reports & Dashboards Revision Date 11/8/2017 All rights reserved. No part of this document shall be reproduced, stored in a retrieval system, or transmitted by any means, electronic, mechanical, photocopying, recording, or otherwise, without written permission from i2i Systems, Inc.
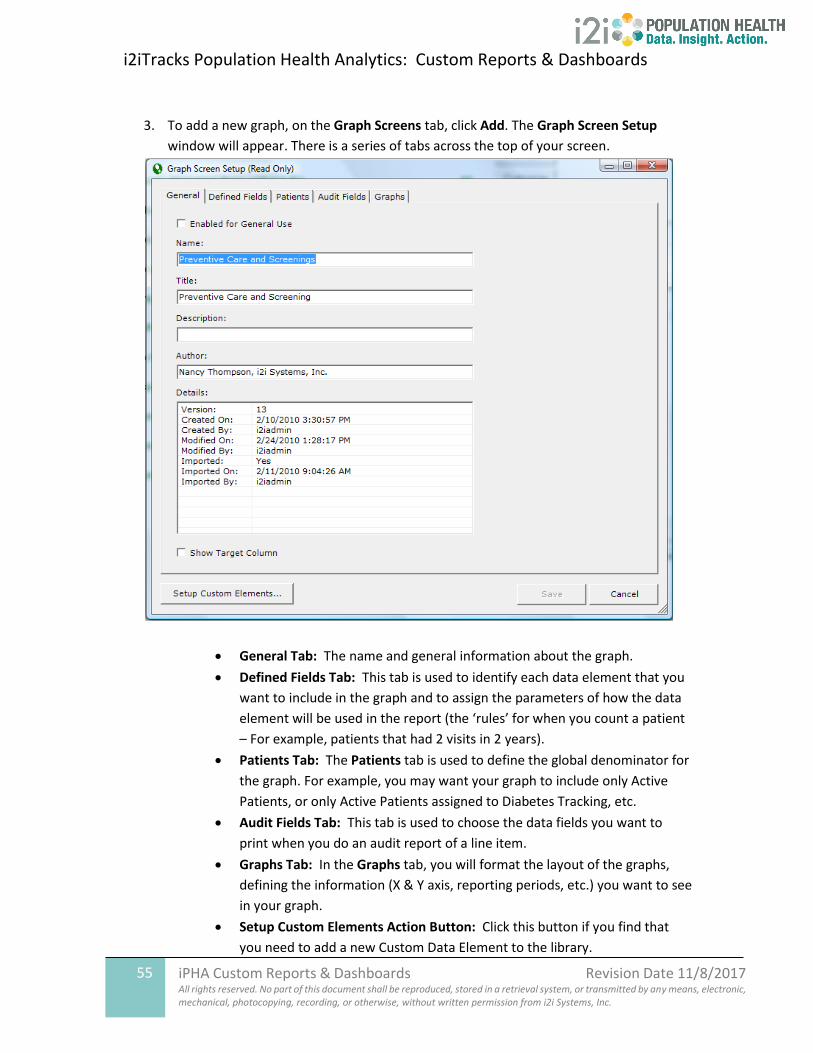
3. To add a new graph, on the Graph Screens tab, click Add. The Graph Screen Setup
window will appear. There is a series of tabs across the top of your screen.
• General Tab: The name and general information about the graph.
• Defined Fields Tab: This tab is used to identify each data element that you
want to include in the graph and to assign the parameters of how the data
element will be used in the report (the ‘rules’ for when you count a patient
– For example, patients that had 2 visits in 2 years).
• Patients Tab: The Patients tab is used to define the global denominator for
the graph. For example, you may want your graph to include only Active
Patients, or only Active Patients assigned to Diabetes Tracking, etc.
• Audit Fields Tab: This tab is used to choose the data fields you want to
print when you do an audit report of a line item.
• Graphs Tab: In the Graphs tab, you will format the layout of the graphs,
defining the information (X & Y axis, reporting periods, etc.) you want to see
in your graph.
• Setup Custom Elements Action Button: Click this button if you find that
you need to add a new Custom Data Element to the library.
i2iTracks Population Health Analytics: Custom Reports & Dashboards
56 iPHA Custom Reports & Dashboards Revision Date 11/8/2017 All rights reserved. No part of this document shall be reproduced, stored in a retrieval system, or transmitted by any means, electronic, mechanical, photocopying, recording, or otherwise, without written permission from i2i Systems, Inc.
Complete the General tab, Defined Fields tab, Patients tab and Audit Fields tab as
described starting on page 17 of this document.
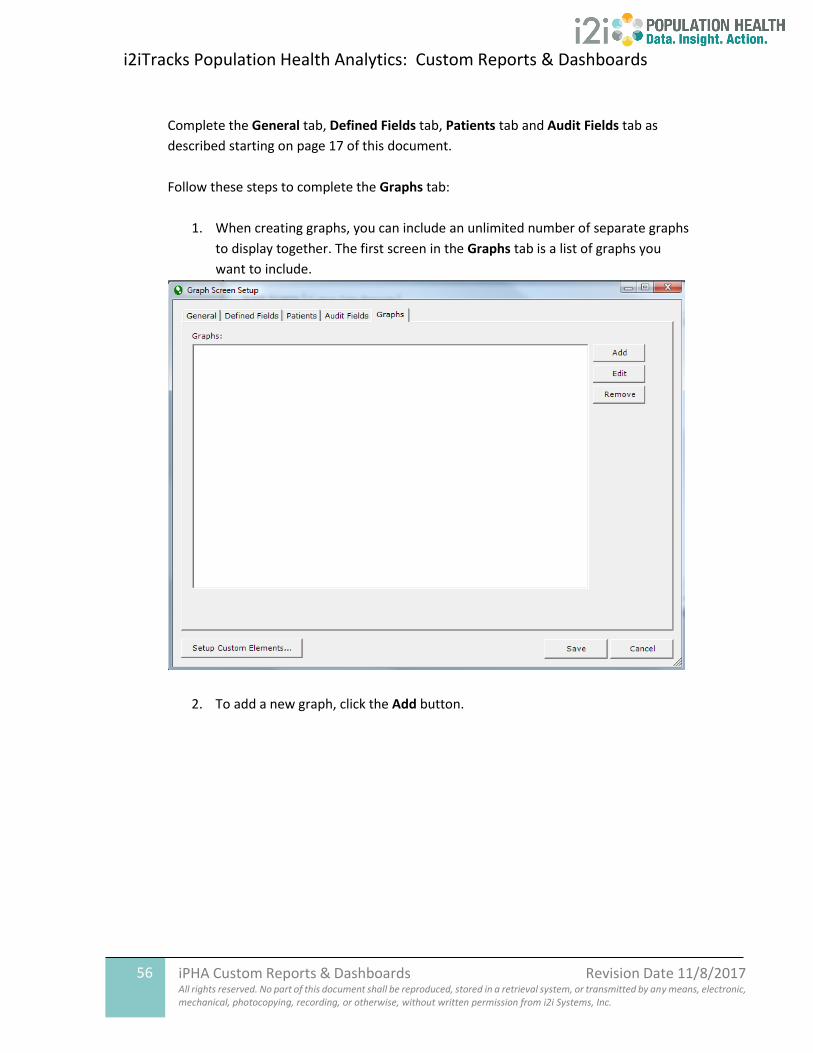
Follow these steps to complete the Graphs tab:
1. When creating graphs, you can include an unlimited number of separate graphs
to display together. The first screen in the Graphs tab is a list of graphs you
want to include.
2. To add a new graph, click the Add button.
i2iTracks Population Health Analytics: Custom Reports & Dashboards
57 iPHA Custom Reports & Dashboards Revision Date 11/8/2017 All rights reserved. No part of this document shall be reproduced, stored in a retrieval system, or transmitted by any means, electronic, mechanical, photocopying, recording, or otherwise, without written permission from i2i Systems, Inc.
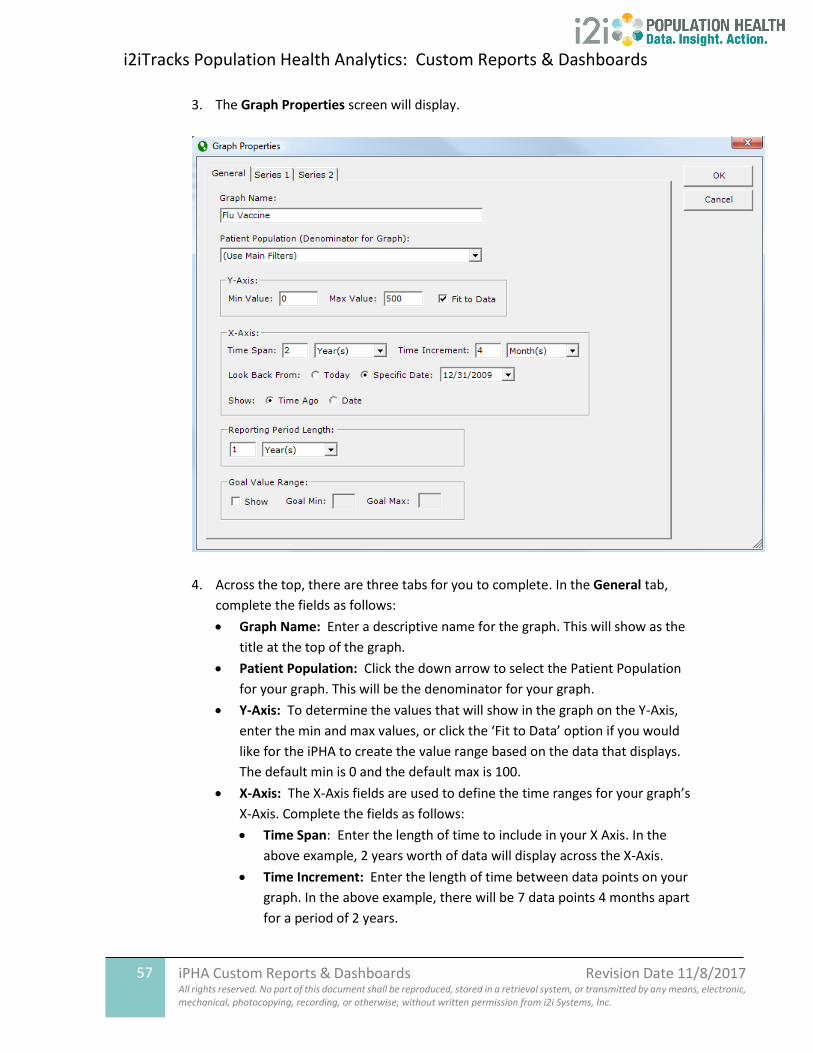
3. The Graph Properties screen will display.
4. Across the top, there are three tabs for you to complete. In the General tab,
complete the fields as follows:
• Graph Name: Enter a descriptive name for the graph. This will show as the
title at the top of the graph.
• Patient Population: Click the down arrow to select the Patient Population
for your graph. This will be the denominator for your graph.
• Y-Axis: To determine the values that will show in the graph on the Y-Axis,
enter the min and max values, or click the ‘Fit to Data’ option if you would
like for the iPHA to create the value range based on the data that displays.
The default min is 0 and the default max is 100.
• X-Axis: The X-Axis fields are used to define the time ranges for your graph’s
X-Axis. Complete the fields as follows:
• Time Span: Enter the length of time to include in your X Axis. In the
above example, 2 years worth of data will display across the X-Axis.
• Time Increment: Enter the length of time between data points on your
graph. In the above example, there will be 7 data points 4 months apart
for a period of 2 years.
i2iTracks Population Health Analytics: Custom Reports & Dashboards
58 iPHA Custom Reports & Dashboards Revision Date 11/8/2017 All rights reserved. No part of this document shall be reproduced, stored in a retrieval system, or transmitted by any means, electronic, mechanical, photocopying, recording, or otherwise, without written permission from i2i Systems, Inc.
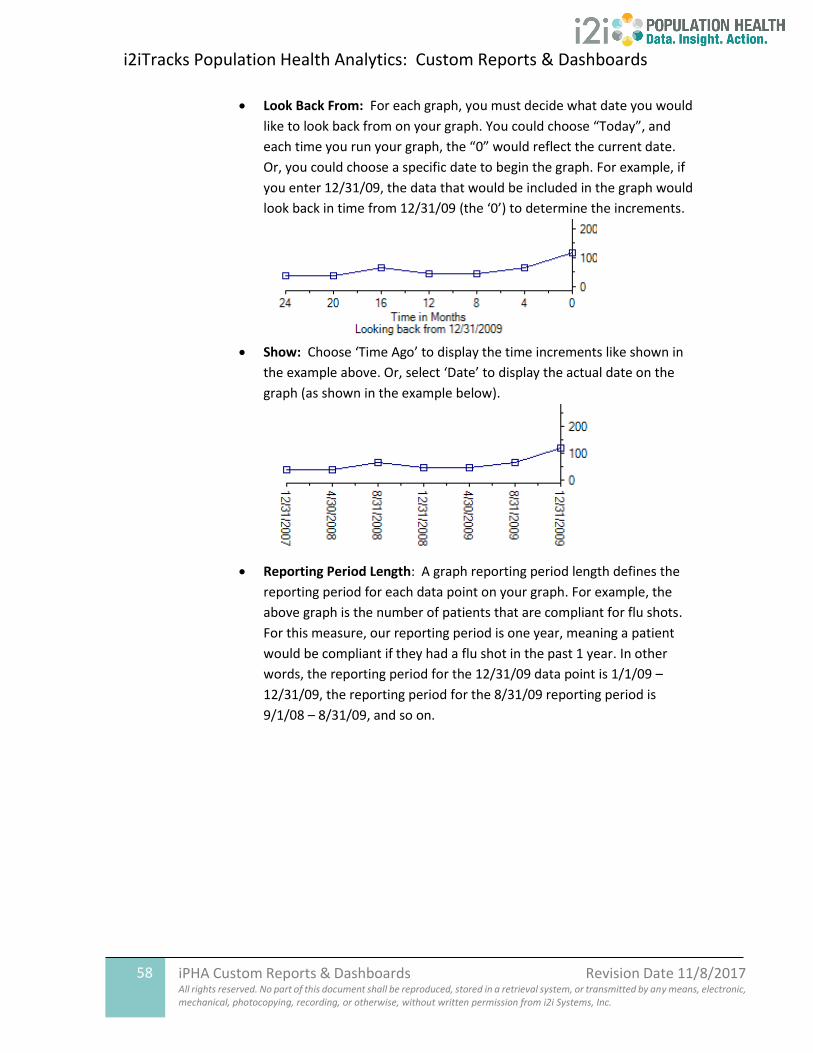
• Look Back From: For each graph, you must decide what date you would
like to look back from on your graph. You could choose “Today”, and
each time you run your graph, the “0” would reflect the current date.
Or, you could choose a specific date to begin the graph. For example, if
you enter 12/31/09, the data that would be included in the graph would
look back in time from 12/31/09 (the ‘0’) to determine the increments.
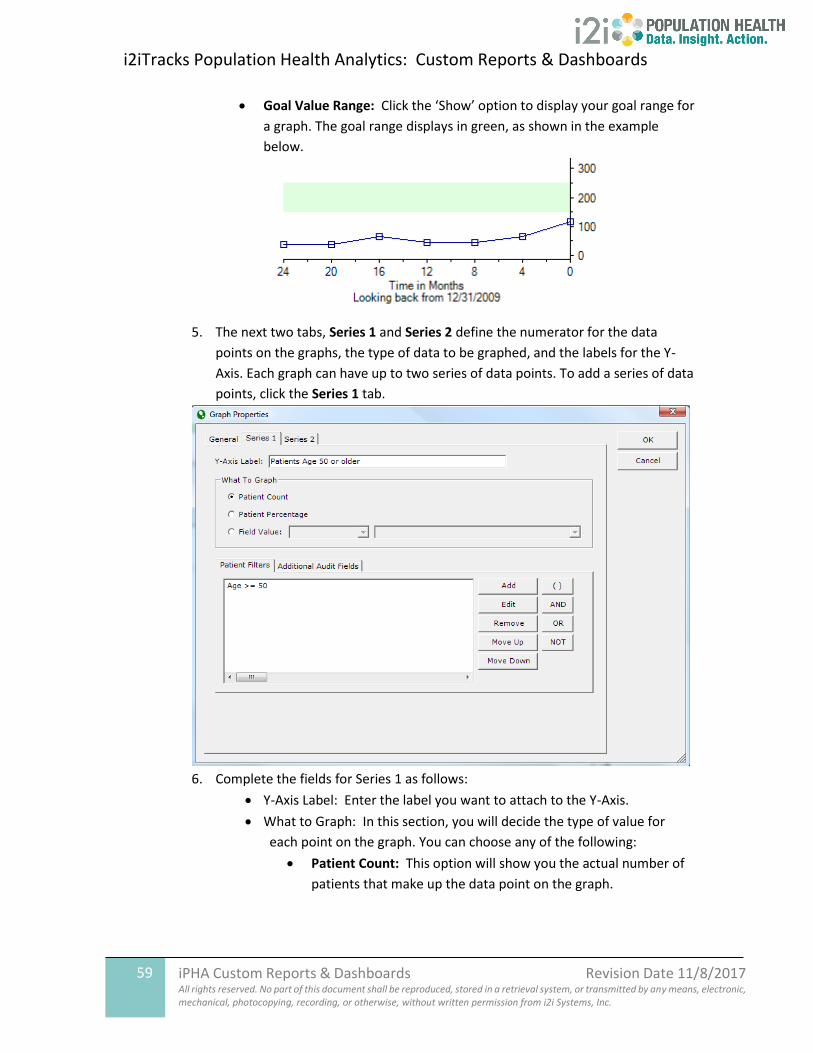
• Show: Choose ‘Time Ago’ to display the time increments like shown in
the example above. Or, select ‘Date’ to display the actual date on the
graph (as shown in the example below).
• Reporting Period Length: A graph reporting period length defines the
reporting period for each data point on your graph. For example, the
above graph is the number of patients that are compliant for flu shots.
For this measure, our reporting period is one year, meaning a patient
would be compliant if they had a flu shot in the past 1 year. In other
words, the reporting period for the 12/31/09 data point is 1/1/09 –
12/31/09, the reporting period for the 8/31/09 reporting period is
9/1/08 – 8/31/09, and so on.
i2iTracks Population Health Analytics: Custom Reports & Dashboards
59 iPHA Custom Reports & Dashboards Revision Date 11/8/2017 All rights reserved. No part of this document shall be reproduced, stored in a retrieval system, or transmitted by any means, electronic, mechanical, photocopying, recording, or otherwise, without written permission from i2i Systems, Inc.
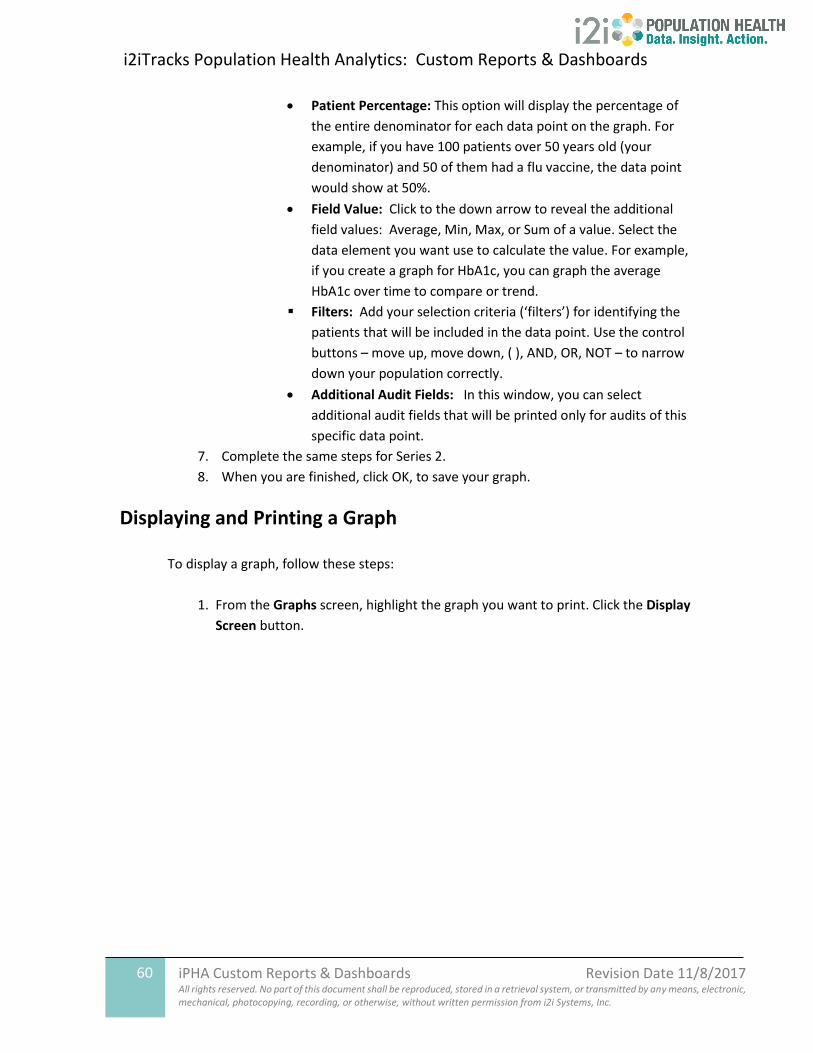
• Goal Value Range: Click the ‘Show’ option to display your goal range for
a graph. The goal range displays in green, as shown in the example
below.
5. The next two tabs, Series 1 and Series 2 define the numerator for the data
points on the graphs, the type of data to be graphed, and the labels for the Y-
Axis. Each graph can have up to two series of data points. To add a series of data
points, click the Series 1 tab.
6. Complete the fields for Series 1 as follows:
• Y-Axis Label: Enter the label you want to attach to the Y-Axis.
• What to Graph: In this section, you will decide the type of value for
each point on the graph. You can choose any of the following:
• Patient Count: This option will show you the actual number of
patients that make up the data point on the graph.
i2iTracks Population Health Analytics: Custom Reports & Dashboards
60 iPHA Custom Reports & Dashboards Revision Date 11/8/2017 All rights reserved. No part of this document shall be reproduced, stored in a retrieval system, or transmitted by any means, electronic, mechanical, photocopying, recording, or otherwise, without written permission from i2i Systems, Inc.
• Patient Percentage: This option will display the percentage of
the entire denominator for each data point on the graph. For
example, if you have 100 patients over 50 years old (your
denominator) and 50 of them had a flu vaccine, the data point
would show at 50%.
• Field Value: Click to the down arrow to reveal the additional
field values: Average, Min, Max, or Sum of a value. Select the
data element you want use to calculate the value. For example,
if you create a graph for HbA1c, you can graph the average
HbA1c over time to compare or trend.
▪ Filters: Add your selection criteria (‘filters’) for identifying the
patients that will be included in the data point. Use the control
buttons – move up, move down, ( ), AND, OR, NOT – to narrow
down your population correctly.
• Additional Audit Fields: In this window, you can select
additional audit fields that will be printed only for audits of this
specific data point.
7. Complete the same steps for Series 2.
8. When you are finished, click OK, to save your graph.
Displaying and Printing a Graph
To display a graph, follow these steps:
1. From the Graphs screen, highlight the graph you want to print. Click the Display
Screen button.

i2iTracks Population Health Analytics: Custom Reports & Dashboards
61 iPHA Custom Reports & Dashboards Revision Date 11/8/2017 All rights reserved. No part of this document shall be reproduced, stored in a retrieval system, or transmitted by any means, electronic, mechanical, photocopying, recording, or otherwise, without written permission from i2i Systems, Inc.
2. The Graph Criteria screen will display. Complete the fields as follows:
i2iTracks Population Health Analytics: Custom Reports & Dashboards
62 iPHA Custom Reports & Dashboards Revision Date 11/8/2017 All rights reserved. No part of this document shall be reproduced, stored in a retrieval system, or transmitted by any means, electronic, mechanical, photocopying, recording, or otherwise, without written permission from i2i Systems, Inc.
• Select Only include these locations if you want to generate graphs based on a specified location. Leave these fields blank to include all locations. Select Show as separate sets of graphs to indicate if you want to see each location on a separate tab.
• Select Only include these providers if you want to generate graphs based on a specified provider. Leave these fields blank to include all providers. Select Show as separate sets of graphs to indicate if you want to see each provider on a separate tab.
• Select Only include these financial classifications if you want to generate a graphs based on a specified financial classification. Leave these fields blank to include all financial classifications. Select "Show as separate sets of graphs" to indicate if you want to see each financial class on a separate tab.
3. Once your printing criteria fields are completed, click OK to generate your graphs.
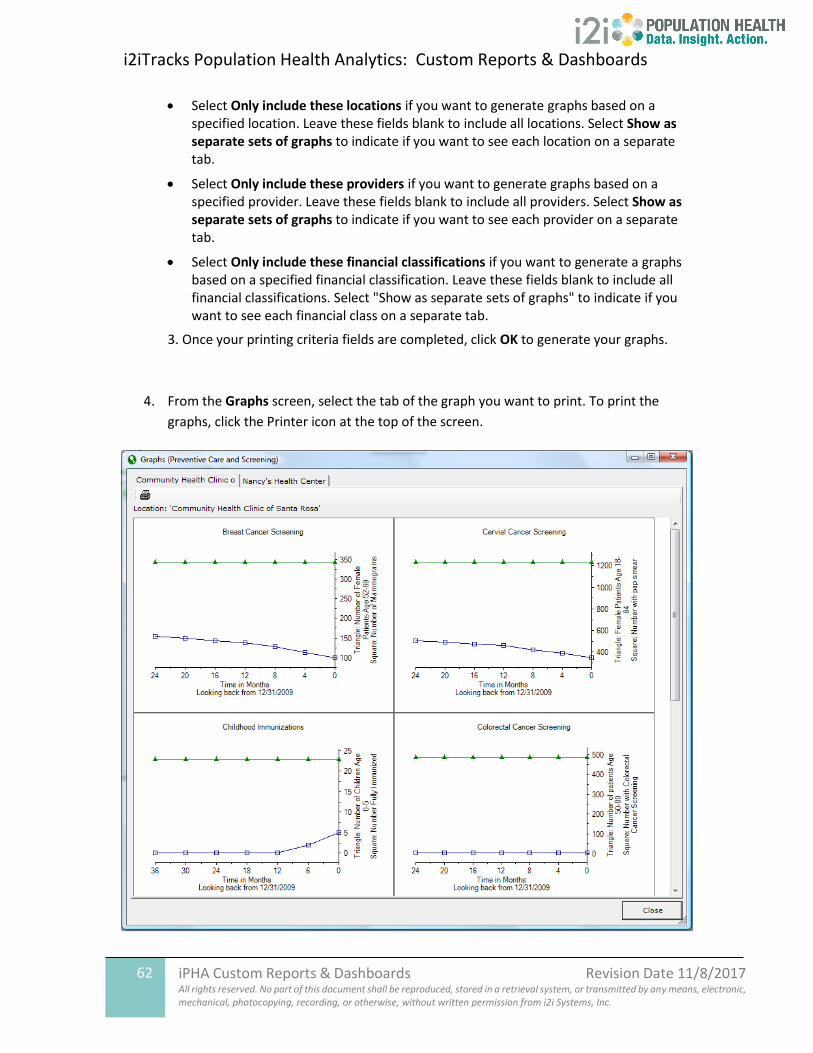
4. From the Graphs screen, select the tab of the graph you want to print. To print the
graphs, click the Printer icon at the top of the screen.
i2iTracks Population Health Analytics: Custom Reports & Dashboards
63 iPHA Custom Reports & Dashboards Revision Date 11/8/2017 All rights reserved. No part of this document shall be reproduced, stored in a retrieval system, or transmitted by any means, electronic, mechanical, photocopying, recording, or otherwise, without written permission from i2i Systems, Inc.
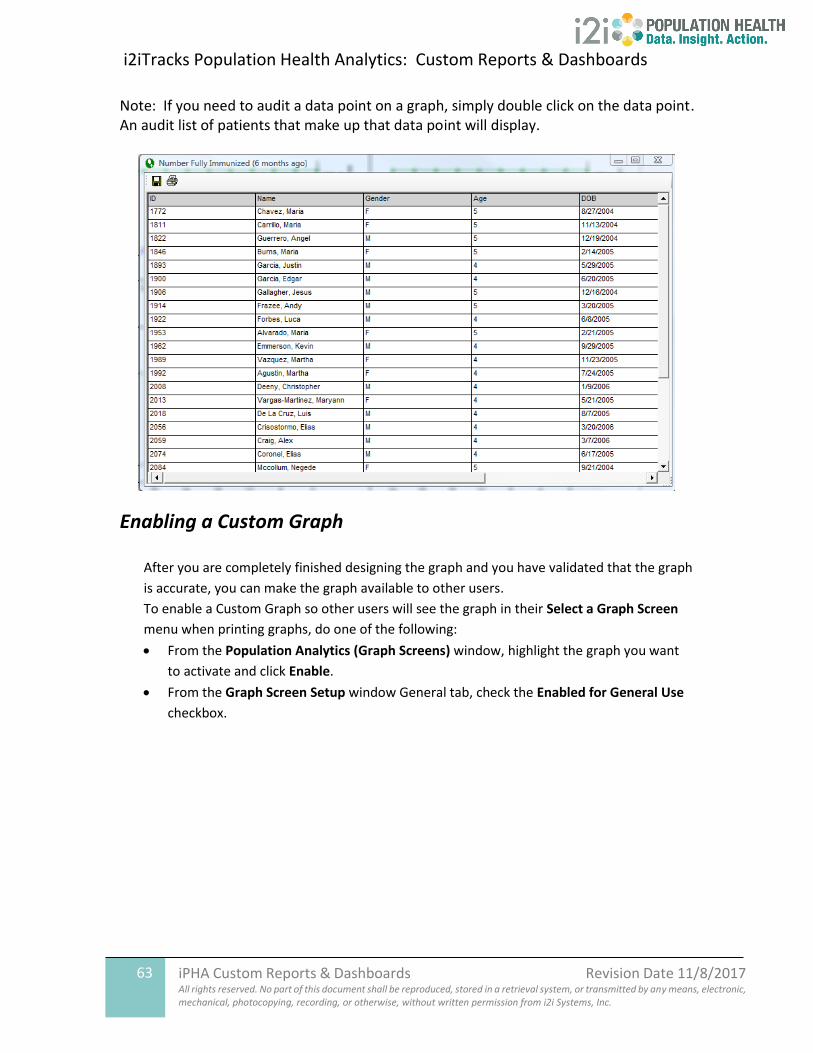
Note: If you need to audit a data point on a graph, simply double click on the data point. An audit list of patients that make up that data point will display.
Enabling a Custom Graph
After you are completely finished designing the graph and you have validated that the graph
is accurate, you can make the graph available to other users.
To enable a Custom Graph so other users will see the graph in their Select a Graph Screen
menu when printing graphs, do one of the following:
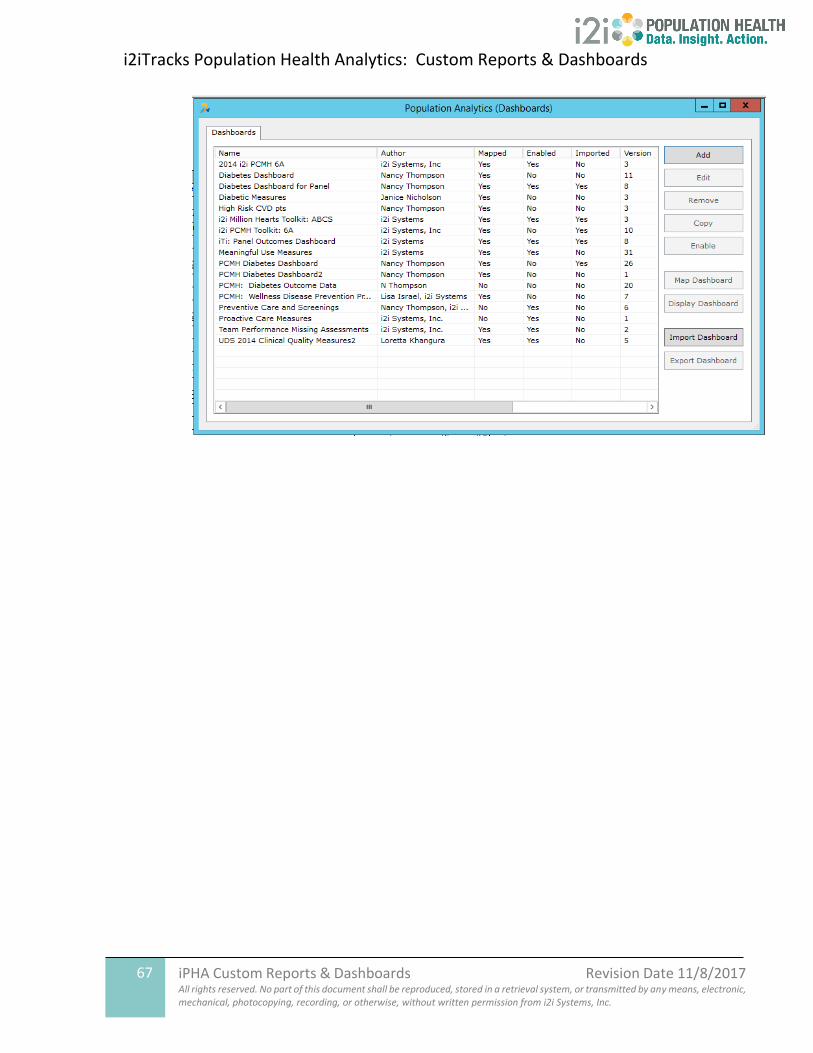
• From the Population Analytics (Graph Screens) window, highlight the graph you want
to activate and click Enable.
• From the Graph Screen Setup window General tab, check the Enabled for General Use
checkbox.

i2iTracks Population Health Analytics: Custom Reports & Dashboards
64 iPHA Custom Reports & Dashboards Revision Date 11/8/2017 All rights reserved. No part of this document shall be reproduced, stored in a retrieval system, or transmitted by any means, electronic, mechanical, photocopying, recording, or otherwise, without written permission from i2i Systems, Inc.
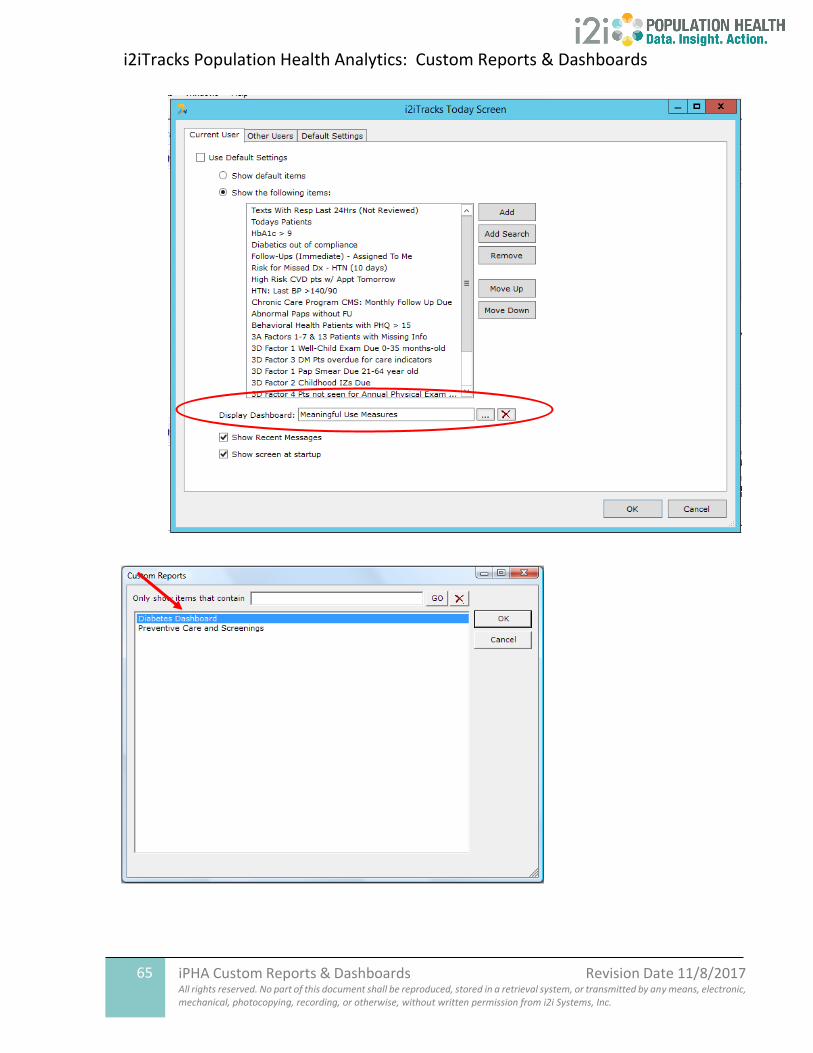
Dashboard on i2iTracks Today Screen The i2iTracks Today screen now includes a Dashboard tab which allows you to choose to
display a set of graphs from those created in the Population Analytics module.
To select graphs to display:
1. Select File > i2iTracks Today > Dashboard.
2. Select the graphs you want to display from the Display Graph Screen list.
i2iTracks Population Health Analytics: Custom Reports & Dashboards
65 iPHA Custom Reports & Dashboards Revision Date 11/8/2017 All rights reserved. No part of this document shall be reproduced, stored in a retrieval system, or transmitted by any means, electronic, mechanical, photocopying, recording, or otherwise, without written permission from i2i Systems, Inc.
i2iTracks Population Health Analytics: Custom Reports & Dashboards
66 iPHA Custom Reports & Dashboards Revision Date 11/8/2017 All rights reserved. No part of this document shall be reproduced, stored in a retrieval system, or transmitted by any means, electronic, mechanical, photocopying, recording, or otherwise, without written permission from i2i Systems, Inc.
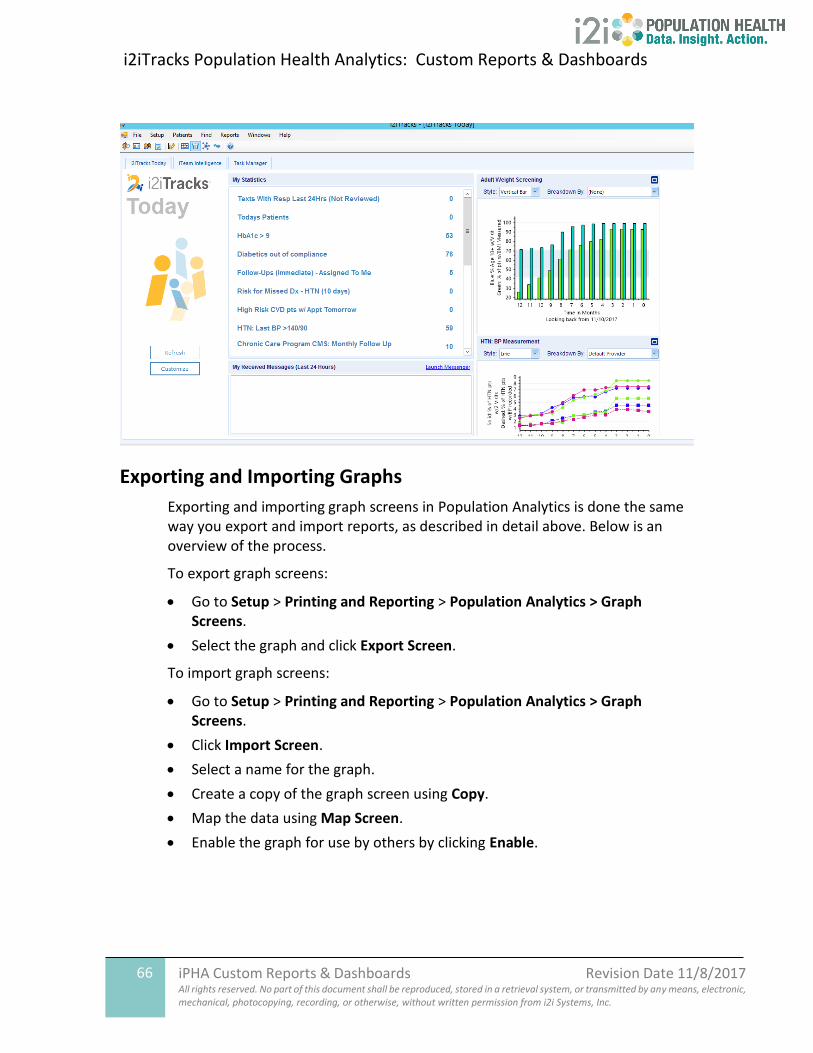
Exporting and Importing Graphs
Exporting and importing graph screens in Population Analytics is done the same way you export and import reports, as described in detail above. Below is an overview of the process.
To export graph screens:
• Go to Setup > Printing and Reporting > Population Analytics > Graph Screens.
• Select the graph and click Export Screen.
To import graph screens:
• Go to Setup > Printing and Reporting > Population Analytics > Graph Screens.
• Click Import Screen.
• Select a name for the graph.
• Create a copy of the graph screen using Copy.
• Map the data using Map Screen.
• Enable the graph for use by others by clicking Enable.
i2iTracks Population Health Analytics: Custom Reports & Dashboards
67 iPHA Custom Reports & Dashboards Revision Date 11/8/2017 All rights reserved. No part of this document shall be reproduced, stored in a retrieval system, or transmitted by any means, electronic, mechanical, photocopying, recording, or otherwise, without written permission from i2i Systems, Inc.
i2iTracks Population Health Analytics: Custom Reports & Dashboards
68 iPHA Custom Reports & Dashboards Revision Date 11/8/2017 All rights reserved. No part of this document shall be reproduced, stored in a retrieval system, or transmitted by any means, electronic, mechanical, photocopying, recording, or otherwise, without written permission from i2i Systems, Inc.
Glossary of Terms
Data Elements: Data Elements are the pieces of information (data) that you use in a report (age, gender, diabetes status, LDL values, BMI, etc.).
General Data Elements: General Data Elements include Age and Deceased Status
Patient Population: Also known as the denominator, the Patient Population defines the group of patients included in a report or a report area (Diabetic Patients, Female Patients, Active Patients).
Data Filters: A data filter is used to sift through your data to narrow down the patient population to include only the patients you want in your report.
Defined Fields: Defined fields are used to identify each data element that you want to include in a specific report and to assign the parameters of how the data element will be used in the report (the ‘rules’ that apply to your report - patients that had 2 visits in 2 years, patients with 2 HbA1c tests 90 days apart).
Audit Fields: Audit fields are the data fields you want to print when you do an audit report of a line item.
Report Section: An iPHA report is divided into segments called sections. A report can have numerous sections. Each section heading includes only a text field that describes each segment of the report.
Report Area: Each report section is divided up into areas. Each area contains the ‘denominator’ for the group of patients that are included in the detail items that display beneath the area name.
Report Item: Report items include the details and statistics you want to include about each report area (the value and percentage data).
Count Item: A Count item is the total number of patients that meet all filter requirements for that line item (How many patients had an HbA1c test, How many patient have an HbA1c value <8).
Multi-Item: A Multi-item is the number of patients broken down by any of the
following:
o Gender
o Language
o Race
o Ethnicity
o Financial Classification
o Age Ranges
o Other types of values (ie break down of HbA1c value by specified ranges)
i2iTracks Population Health Analytics: Custom Reports & Dashboards
69 iPHA Custom Reports & Dashboards Revision Date 11/8/2017 All rights reserved. No part of this document shall be reproduced, stored in a retrieval system, or transmitted by any means, electronic, mechanical, photocopying, recording, or otherwise, without written permission from i2i Systems, Inc.
Text Item: A Text Item is a line of written text only. No value will print in the value column.
Value Item: A Value Item is the average of a value, the sum of values, or the minimum
or the maximum value. A value item is used to generate a visit count (sum of
occurrences).