Embed Size (px)
Citation preview
IAEA/AQ/52
IAEA Analytical Quality in Nuclear Applications Series No. 52
Certification of Mass Fractions of Polycyclic Aromatic Hydrocarbons, Organochlorines and Polybrominated Diphenyl Ethers in IAEA-459 Marine Sediment Sample
INTERNATIONAL ATOMIC ENERGY AGENCYVIENNA
ISSN 2074–7659
Template has: 20 mm spineplease reset it to the corrected spine/
CERTIFICATION OF MASS FRACTIONS OF POLYCYCLIC
AROMATIC HYDROCARBONS, ORGANOCHLORINES AND
POLYBROMINATED DIPHENYL ETHERS IN IAEA-459 MARINE SEDIMENT SAMPLE
AFGHANISTANALBANIAALGERIAANGOLAANTIGUA AND BARBUDAARGENTINAARMENIAAUSTRALIAAUSTRIAAZERBAIJANBAHAMASBAHRAINBANGLADESHBARBADOSBELARUSBELGIUMBELIZEBENINBOLIVIA, PLURINATIONAL
STATE OFBOSNIA AND HERZEGOVINABOTSWANABRAZILBRUNEI DARUSSALAMBULGARIABURKINA FASOBURUNDICAMBODIACAMEROONCANADACENTRAL AFRICAN
REPUBLICCHADCHILECHINACOLOMBIACONGOCOSTA RICACÔTE D’IVOIRECROATIACUBACYPRUSCZECH REPUBLICDEMOCRATIC REPUBLIC
OF THE CONGODENMARKDJIBOUTIDOMINICADOMINICAN REPUBLICECUADOREGYPTEL SALVADORERITREAESTONIAETHIOPIAFIJIFINLANDFRANCEGABON
GEORGIAGERMANYGHANAGREECEGUATEMALAGUYANAHAITIHOLY SEEHONDURASHUNGARYICELANDINDIAINDONESIAIRAN, ISLAMIC REPUBLIC OF IRAQIRELANDISRAELITALYJAMAICAJAPANJORDANKAZAKHSTANKENYAKOREA, REPUBLIC OFKUWAITKYRGYZSTANLAO PEOPLE’S DEMOCRATIC
REPUBLICLATVIALEBANONLESOTHOLIBERIALIBYALIECHTENSTEINLITHUANIALUXEMBOURGMADAGASCARMALAWIMALAYSIAMALIMALTAMARSHALL ISLANDSMAURITANIAMAURITIUSMEXICOMONACOMONGOLIAMONTENEGROMOROCCOMOZAMBIQUEMYANMARNAMIBIANEPALNETHERLANDSNEW ZEALANDNICARAGUANIGERNIGERIANORWAY
OMANPAKISTANPALAUPANAMAPAPUA NEW GUINEAPARAGUAYPERUPHILIPPINESPOLANDPORTUGALQATARREPUBLIC OF MOLDOVAROMANIARUSSIAN FEDERATIONRWANDASAN MARINOSAUDI ARABIASENEGALSERBIASEYCHELLESSIERRA LEONESINGAPORESLOVAKIASLOVENIASOUTH AFRICASPAINSRI LANKASUDANSWAZILANDSWEDENSWITZERLANDSYRIAN ARAB REPUBLICTAJIKISTANTHAILANDTHE FORMER YUGOSLAV
REPUBLIC OF MACEDONIATOGOTRINIDAD AND TOBAGOTUNISIATURKEYTURKMENISTANUGANDAUKRAINEUNITED ARAB EMIRATESUNITED KINGDOM OF
GREAT BRITAIN AND NORTHERN IRELAND
UNITED REPUBLICOF TANZANIA
UNITED STATES OF AMERICAURUGUAYUZBEKISTANVANUATUVENEZUELA, BOLIVARIAN
REPUBLIC OF VIET NAMYEMENZAMBIAZIMBABWE
The following States are Members of the International Atomic Energy Agency:
The Agency’s Statute was approved on 23 October 1956 by the Conference on the Statute of the IAEA held at United Nations Headquarters, New York; it entered into force on 29 July 1957. The Headquarters of the Agency are situated in Vienna. Its principal objective is “to accelerate and enlarge the contribution of atomic energy to peace, health and prosperity throughout the world’’.
IAEA/AQ/52
IAEA Analytical Quality in Nuclear Applications Series No. 52
CERTIFICATION OF MASS FRACTIONS OF POLYCYCLIC
AROMATIC HYDROCARBONS, ORGANOCHLORINES AND
POLYBROMINATED DIPHENYL ETHERS IN IAEA-459 MARINE SEDIMENT SAMPLE
INTERNATIONAL ATOMIC ENERGY AGENCYVIENNA, 2017
COPYRIGHT NOTICE
All IAEA scientific and technical publications are protected by the terms of the Universal Copyright Convention as adopted in 1952 (Berne) and as revised in 1972 (Paris). The copyright has since been extended by the World Intellectual Property Organization (Geneva) to include electronic and virtual intellectual property. Permission to use whole or parts of texts contained in IAEA publications in printed or electronic form must be obtained and is usually subject to royalty agreements. Proposals for non-commercial reproductions and translations are welcomed and considered on a case-by-case basis. Enquiries should be addressed to the IAEA Publishing Section at:
Marketing and Sales Unit, Publishing SectionInternational Atomic Energy AgencyVienna International CentrePO Box 1001400 Vienna, Austriafax: +43 1 2600 29302tel.: +43 1 2600 22417email: [email protected] http://www.iaea.org/books
For further information on this publication, please contact:
IAEA Environment Laboratories, MonacoMarine Environmental Studies Laboratory
International Atomic Energy Agency4a Quai Antoine 1er, MC 98000
Principality of Monaco
CERTIFICATION OF MASS FRACTIONS OF POLYCYCLIC AROMATIC HYDROCARBONS, ORGANOCHLORINES AND POLYBROMINATED DIPHENYL ETHERS IN IAEA-459 MARINE SEDIMENT SAMPLE
IAEA, VIENNA, 2017IAEA/AQ/52
ISSN 2074–7659
© IAEA, 2017
Printed by the IAEA in AustriaOctober 2017
FOREWORD
One of the major programmes of the IAEA Environment Laboratories is to assist Member
States in the understanding, monitoring and protection of both terrestrial and marine
environments. To assess the impact of land and sea based pollution sources on marine coastal
environments, it is imperative to ensure the quality and comparability of the analytical data
generated by national and regional pollution monitoring programmes. Since the early 1970s,
the IAEA has assisted national laboratories and regional laboratory networks through the
production of certified reference materials, training in quality assurance and evaluation of
measurement performances by organizing worldwide and regional interlaboratory comparison
exercises and proficiency tests.
This publication describes the production of certified reference material IAEA-459, which is
produced following ISO Guides 34:2009 and 35:2006. This certified reference material is a
sediment sample with certified mass fractions of polycyclic aromatic hydrocarbons,
organochlorines and polybrominated diphenyl ethers. The assigned final values and their
associated uncertainties were derived from robust statistics on the results provided by selected
laboratories with demonstrated technical and quality competence, following the guidance
given in the ISO Guides. The material is used for quality control and assessment of method
performance for a number of organic analytes listed in the Stockholm Convention on
Persistent Organic Pollutants as well as other pollutants listed as priority substances included
in many environment monitoring programmes.
The IAEA is grateful to the Government of Monaco for its support and wishes to thank all
laboratories and participants who took part in the characterization study of this reference
material, in particular the Korea Institute of Ocean Science and Technology for the donation
of the raw material. The IAEA officers responsible for this publication were I. Tolosa,
R. Cassi and D. Huertas of the IAEA Environment Laboratories.
EDITORIAL NOTE
This publication has been prepared from the original material as submitted by the contributors and has not been edited by the editorial staff of the IAEA. The views expressed remain the responsibility of the contributors and do not necessarily reflect those of the IAEA or the governments of its Member States.
Neither the IAEA nor its Member States assume any responsibility for consequences which may arise from the use of this publication. This publication does not address questions of responsibility, legal or otherwise, for acts or omissions on the part of any person.
The use of particular designations of countries or territories does not imply any judgement by the publisher, the IAEA, as to the legal status of such countries or territories, of their authorities and institutions or of the delimitation of their boundaries.
The mention of names of specific companies or products (whether or not indicated as registered) does not imply any intention to infringe proprietary rights, nor should it be construed as an endorsement or recommendation on the part of the IAEA.
The IAEA has no responsibility for the persistence or accuracy of URLs for external or third party Internet web sites referred to in this publication and does not guarantee that any content on such web sites is, or will remain, accurate or appropriate.
CONTENTS
1. INTRODUCTION............................................................................................................................... 1
2. METHODOLOGY .............................................................................................................................. 2
2.1. COLLECTION AND PREPARATION OF THE MATERIAL ...........................................2
2.2. SELECTION OF LABORATORIES FOR THE CHARACTERIZATION STUDY ............2
2.3. HOMOGENEITY ASSESSMENT .....................................................................................2
2.4. STABILITY STUDY .........................................................................................................3
2.4.1. Short-term stability ..........................................................................................................3
2.5. CHARACTERIZATION ....................................................................................................4
2.6 . MOISTURE CONTENT....................................................................................................7
2.7 . ELEMENTAL COMPOSITION AND ISOTOPES VALUES ............................................7
3. RESULTS AND DISCUSSION ........................................................................................................ 7
3.1. RESULTS OF THE HOMOGENEITY STUDY .................................................................7
3.1.1. Between-unit homogeneity ..............................................................................................7
3.1.2. Within-unit homogeneity ............................................................................................... 10
3.2. RESULTS FOR STABILITY STUDY ............................................................................. 11
3.2.1. Short-term stability study............................................................................................... 11
3.2.2. Long-term stability study ............................................................................................... 11
3.3. DETERMINATION OF ASSIGNED VALUES AND UNCERTAINTIES ....................... 11
4. METROLOGICAL TRACEABILITY AND COMMUTABILITY ............................................. 23
5. CONCLUSIONS ............................................................................................................................... 23
APPENDIX I ................................................................................................................................................ 25
RESULTS FOR THE CERTIFIED MEASUREMENTS OF PAHS ....................................................... 25
APPENDIX II .............................................................................................................................................. 44
RESULTS FOR THE CERTIFIED MEASUREMENTS OF POLYCHORINATED BIPHENYLS (PCBs) .......................................................................................................................................................... 44
APPENDIX III ............................................................................................................................................. 66
RESULTS FOR THE CERTIFIED MEASUREMENTS OF ORGANOCHLORINATED
PESTICIDES................................................................................................................................................ 66
APPENDIX IV ............................................................................................................................................. 72
RESULTS FOR THE CERTIFIED MEASUREMENTS OF POLYBROMINATED DIPHENYL
ETHERS (PBDEs) ....................................................................................................................................... 72
APPENDIX V .............................................................................................................................................. 77
RESULTS FOR THE INFORMATION MEASUREMENTS OF POLYCYCLIC AROMATIC
HYDROCARBONS (PAHs) ...................................................................................................................... 77
APPENDIX VI ........................................................................................................................................... 101
RESULTS FOR THE INFORMATION MEASUREMENTS OF POLYCHLORINATED BIPHENYLS (PCBs)................................................................................................................................. 101
APPENDIX VII ......................................................................................................................................... 111
RESULTS FOR THE INFORMATION MEASUREMENTS OF ORGANOCHLORINATED
PESTICIDES.............................................................................................................................................. 111
APPENDIX VIII ........................................................................................................................................ 120
RESULTS FOR THE INFORMATION MEASUREMENTS OF POLYBROMINATED DIPHENYL
ETHERS (PBDEs) ..................................................................................................................................... 120
APPENDIX IX ........................................................................................................................................... 125
RESULTS FOR THE INFORMATION MEASUREMENTS OF ALIPHATIC HYDROCARBON 125
APPENDIX X ................................................................................................................................ 126
SYSTEMATIC NUMBERING OF PCB CONGENERS ....................................................................... 126
APPENDIX XI ........................................................................................................................................... 127
SYSTEMATIC NUMBERING OF PBDES CONGENERS .................................................................. 127
REFERENCES........................................................................................................................................... 128
LIST OF PARTICIPATING LABORATORIES .................................................................................... 129
CONTRIBUTORS TO DRAFTING AND REVIEW ............................................................................. 133
1
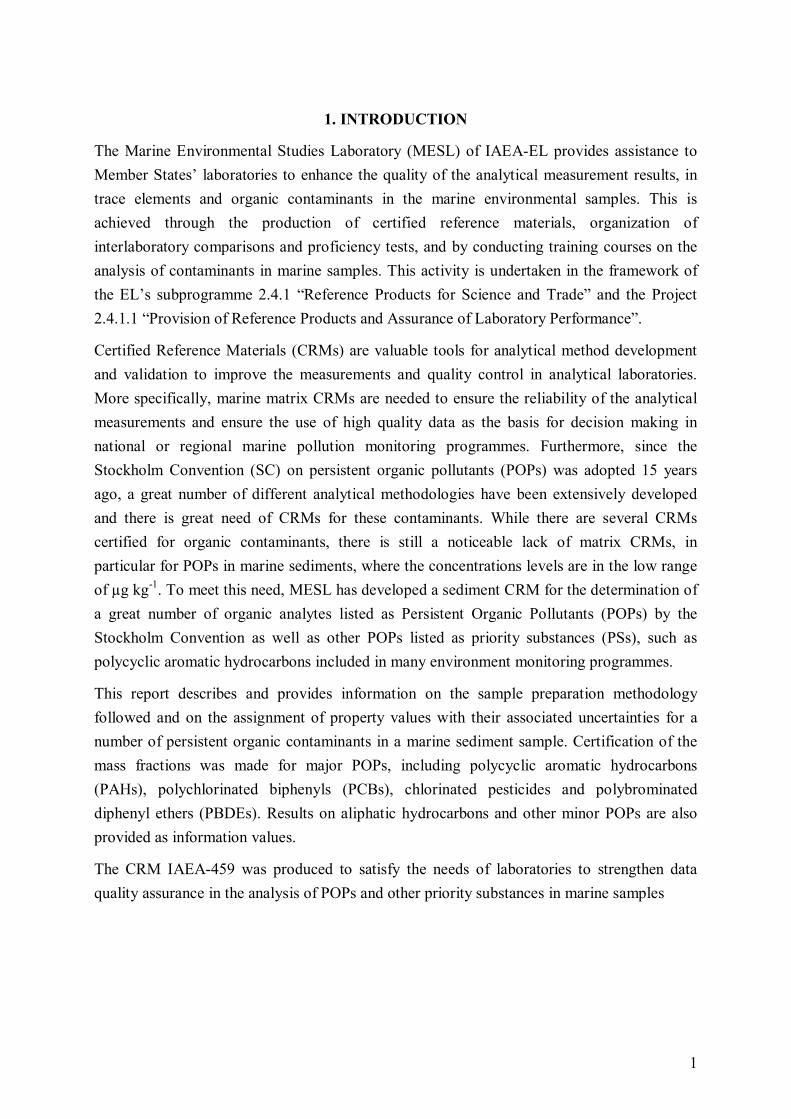
1. INTRODUCTION
The Marine Environmental Studies Laboratory (MESL) of IAEA-EL provides assistance to
Member States’ laboratories to enhance the quality of the analytical measurement results, in
trace elements and organic contaminants in the marine environmental samples. This is
achieved through the production of certified reference materials, organization of
interlaboratory comparisons and proficiency tests, and by conducting training courses on the
analysis of contaminants in marine samples. This activity is undertaken in the framework of
the EL’s subprogramme 2.4.1 “Reference Products for Science and Trade” and the Project
2.4.1.1 “Provision of Reference Products and Assurance of Laboratory Performance”.
Certified Reference Materials (CRMs) are valuable tools for analytical method development
and validation to improve the measurements and quality control in analytical laboratories.
More specifically, marine matrix CRMs are needed to ensure the reliability of the analytical
measurements and ensure the use of high quality data as the basis for decision making in
national or regional marine pollution monitoring programmes. Furthermore, since the
Stockholm Convention (SC) on persistent organic pollutants (POPs) was adopted 15 years
ago, a great number of different analytical methodologies have been extensively developed
and there is great need of CRMs for these contaminants. While there are several CRMs
certified for organic contaminants, there is still a noticeable lack of matrix CRMs, in
particular for POPs in marine sediments, where the concentrations levels are in the low range
of µg kg-1
. To meet this need, MESL has developed a sediment CRM for the determination of
a great number of organic analytes listed as Persistent Organic Pollutants (POPs) by the
Stockholm Convention as well as other POPs listed as priority substances (PSs), such as
polycyclic aromatic hydrocarbons included in many environment monitoring programmes.
This report describes and provides information on the sample preparation methodology
followed and on the assignment of property values with their associated uncertainties for a
number of persistent organic contaminants in a marine sediment sample. Certification of the
mass fractions was made for major POPs, including polycyclic aromatic hydrocarbons
(PAHs), polychlorinated biphenyls (PCBs), chlorinated pesticides and polybrominated
diphenyl ethers (PBDEs). Results on aliphatic hydrocarbons and other minor POPs are also
provided as information values.
The CRM IAEA-459 was produced to satisfy the needs of laboratories to strengthen data
quality assurance in the analysis of POPs and other priority substances in marine samples
2
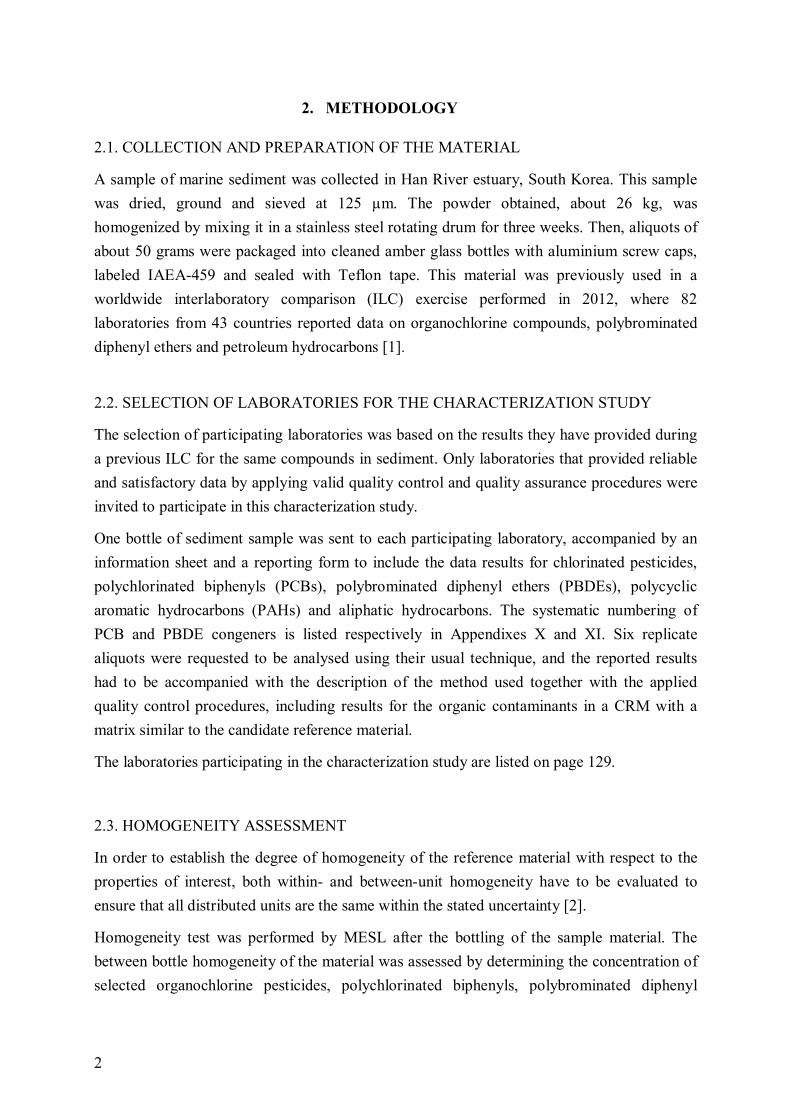
2. METHODOLOGY
2.1. COLLECTION AND PREPARATION OF THE MATERIAL
A sample of marine sediment was collected in Han River estuary, South Korea. This sample
was dried, ground and sieved at 125 µm. The powder obtained, about 26 kg, was
homogenized by mixing it in a stainless steel rotating drum for three weeks. Then, aliquots of
about 50 grams were packaged into cleaned amber glass bottles with aluminium screw caps,
labeled IAEA-459 and sealed with Teflon tape. This material was previously used in a
worldwide interlaboratory comparison (ILC) exercise performed in 2012, where 82
laboratories from 43 countries reported data on organochlorine compounds, polybrominated
diphenyl ethers and petroleum hydrocarbons [1].
2.2. SELECTION OF LABORATORIES FOR THE CHARACTERIZATION STUDY
The selection of participating laboratories was based on the results they have provided during
a previous ILC for the same compounds in sediment. Only laboratories that provided reliable
and satisfactory data by applying valid quality control and quality assurance procedures were
invited to participate in this characterization study.
One bottle of sediment sample was sent to each participating laboratory, accompanied by an
information sheet and a reporting form to include the data results for chlorinated pesticides,
polychlorinated biphenyls (PCBs), polybrominated diphenyl ethers (PBDEs), polycyclic
aromatic hydrocarbons (PAHs) and aliphatic hydrocarbons. The systematic numbering of
PCB and PBDE congeners is listed respectively in Appendixes X and XI. Six replicate
aliquots were requested to be analysed using their usual technique, and the reported results
had to be accompanied with the description of the method used together with the applied
quality control procedures, including results for the organic contaminants in a CRM with a
matrix similar to the candidate reference material.
The laboratories participating in the characterization study are listed on page 129.
2.3. HOMOGENEITY ASSESSMENT
In order to establish the degree of homogeneity of the reference material with respect to the
properties of interest, both within- and between-unit homogeneity have to be evaluated to
ensure that all distributed units are the same within the stated uncertainty [2].
Homogeneity test was performed by MESL after the bottling of the sample material. The
between bottle homogeneity of the material was assessed by determining the concentration of
selected organochlorine pesticides, polychlorinated biphenyls, polybrominated diphenyl
3
ethers and petroleum hydrocarbons in sample aliquots of 6 g taken from 10 bottles (about 3%
of the total batch) randomly selected during the whole bottling process of the bulk dry
powder. Each bottle unit was extracted and analysed without subsampling. Homogeneity
assessment based on the analysis of variance (ANOVA) to calculate between-unit variation
(sbb) and within bottle heterogeneity (swb) could therefore not be applied [2], but the ANOVA-
like approach [3, 4] was followed. The within-bottle homogeneity of the material was
assessed by determinations of the concentration of organochlorine (OC) pesticides,
polychlorinated biphenyls, polybrominated diphenyl ethers and petroleum hydrocarbons in six
sample aliquots of 6 g taken from 1 bottle. The same method of analysis was used to test the
between-bottle and within-bottle homogeneity. Samples were run in a random order to avoid
the instrumental analysis sequence following the same order of preparation.
2.4. STABILITY STUDY
Stability information is important to determine the presence of any potential degradation of
the analytes during sample transport to the customers (short-term stability) as well as
conditions for storage (long-term stability) of the material. Time, temperature, moisture and
radiation are usually the more pertinent parameters affecting stability of the samples. The
influence of light was minimized by using amber bottles, which were stored in the dark and
moisture was minimized by the drying preparation of the material. Consequently, only the
influence of time and temperature were investigated by using an isochronous stability design.
To test stability, selected units are exposed to different storage conditions during different
periods of time. Then, the units are transferred to conditions where additional potential
degradation is considered extremely unlikely (reference conditions). At the end of the
isochronous storage, the units are measured under repeatability conditions in a single run,
providing the best available precision for the stability study.
2.4.1. Short-term stability
The approach used to assess the transportation stability was based on an isochronous design
over 4 weeks. For that, a set of 4 units were stored in the dark at +20°C immediately after the
bottling and another set of 4 bottles at +40°C for 1, 2, 3 and 4 weeks respectively. After the
planned exposure time for each unit, were moved to reference conditions (-20°C temperature).
One independent measurement per bottle was performed under repeatability conditions. The
obtained results were compared with the results from samples kept at -20°C from the time
zero of this study. The tests were performed by measuring phenanthrene, fluoranthene, pyrene
by GC-MS and PCB 138, PCB 153, pp’-DDE and BDE-99 by GC-ECD. All measurements
were performed under repeatability conditions, with the purpose to improve the measurement
precision and consequently the power of the isochronous stability study.
4
2.5. CHARACTERIZATION
Characterization refers to the process of assigning a property value that can be reliably
assessed when its value is confirmed by several laboratories working independently and using
different methods, for each of which the accuracy has been well established [5]. The material
was initially analysed in the IAEA/NAEL in Monaco. The final characterization was based on
the results provided by selected laboratories with demonstrated technical and quality
competence
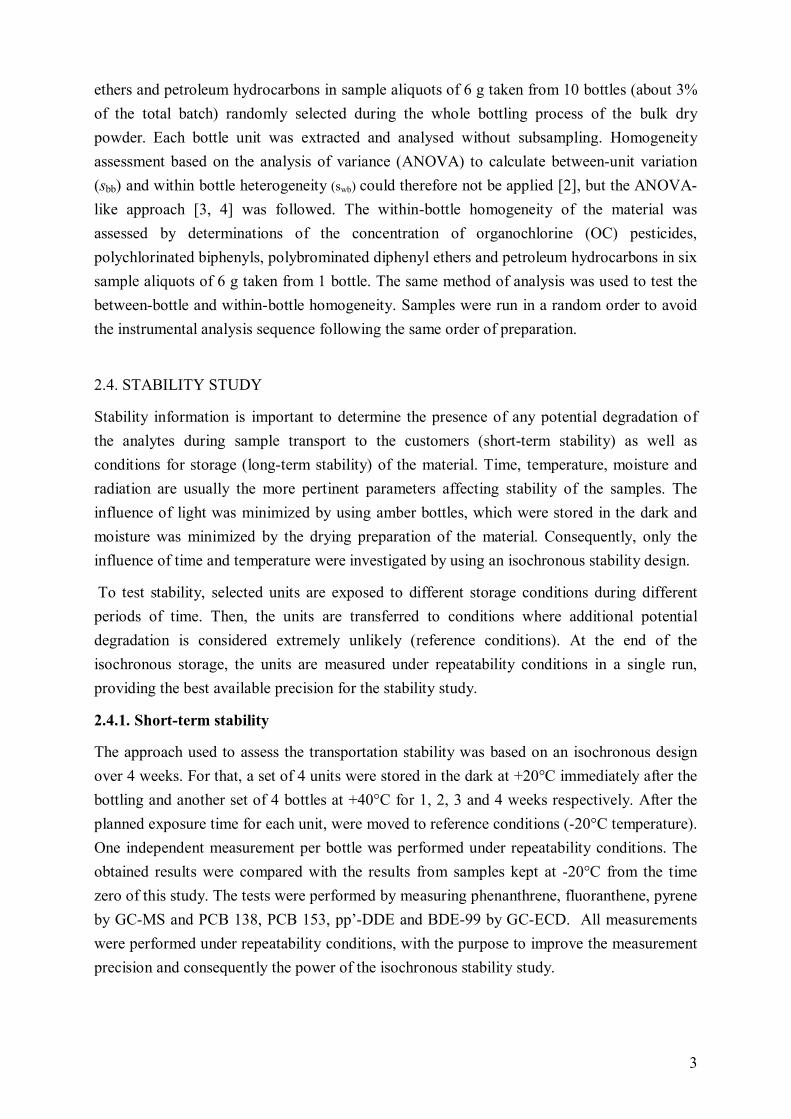
The characterization of the PAHs was performed by using three different analytical
techniques: gas chromatography/mass spectrometry (GC-MS), gas chromatography/high
resolution mass spectrometry (GC-HRMS) and high performance liquid
chromatography/fluorescence detector (HPLC–FLD) as summarized in Figure 1.
Fig. 1. Analytical methods used for the characterization of PAHs in the IAEA-459 sediment
sample. Abbreviations used to describe the instrumental techniques are given in Table 1.
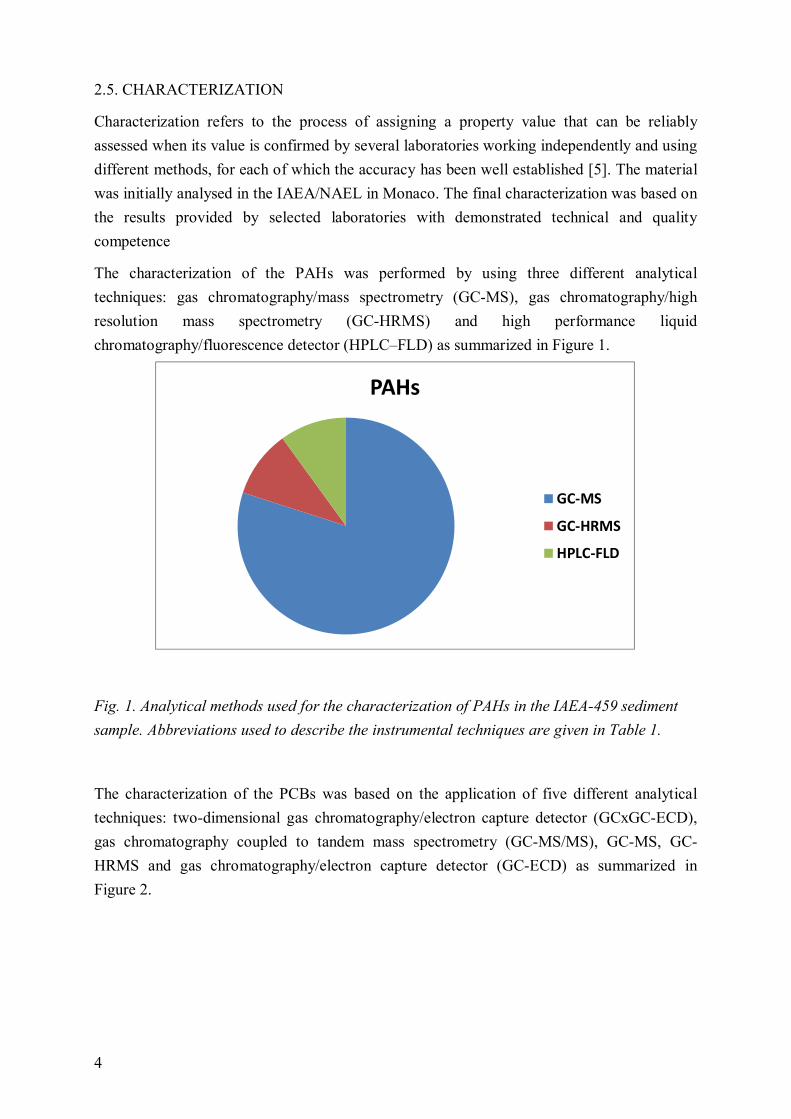
The characterization of the PCBs was based on the application of five different analytical
techniques: two-dimensional gas chromatography/electron capture detector (GCxGC-ECD),
gas chromatography coupled to tandem mass spectrometry (GC-MS/MS), GC-MS, GC-
HRMS and gas chromatography/electron capture detector (GC-ECD) as summarized in
Figure 2.
PAHs
GC-MS
GC-HRMS
HPLC-FLD
5
Fig. 2. Analytical methods used for the characterization of PCBs in the IAEA-459 sediment
sample. Abbreviations used to describe the instrumental techniques are given in Table 1.
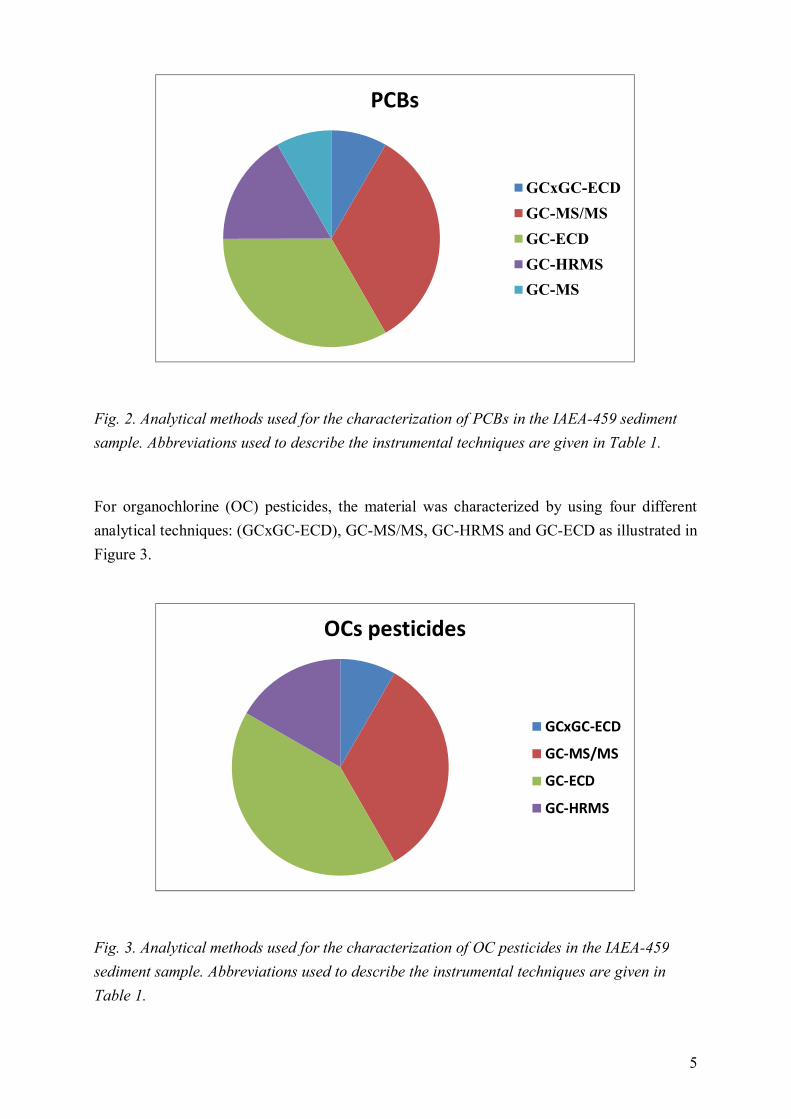
For organochlorine (OC) pesticides, the material was characterized by using four different
analytical techniques: (GCxGC-ECD), GC-MS/MS, GC-HRMS and GC-ECD as illustrated in
Figure 3.
Fig. 3. Analytical methods used for the characterization of OC pesticides in the IAEA-459
sediment sample. Abbreviations used to describe the instrumental techniques are given in
Table 1.
PCBs
GCxGC-ECD
GC-MS/MS
GC-ECD
GC-HRMS
GC-MS
OCs pesticides
GCxGC-ECD
GC-MS/MS
GC-ECD
GC-HRMS
6
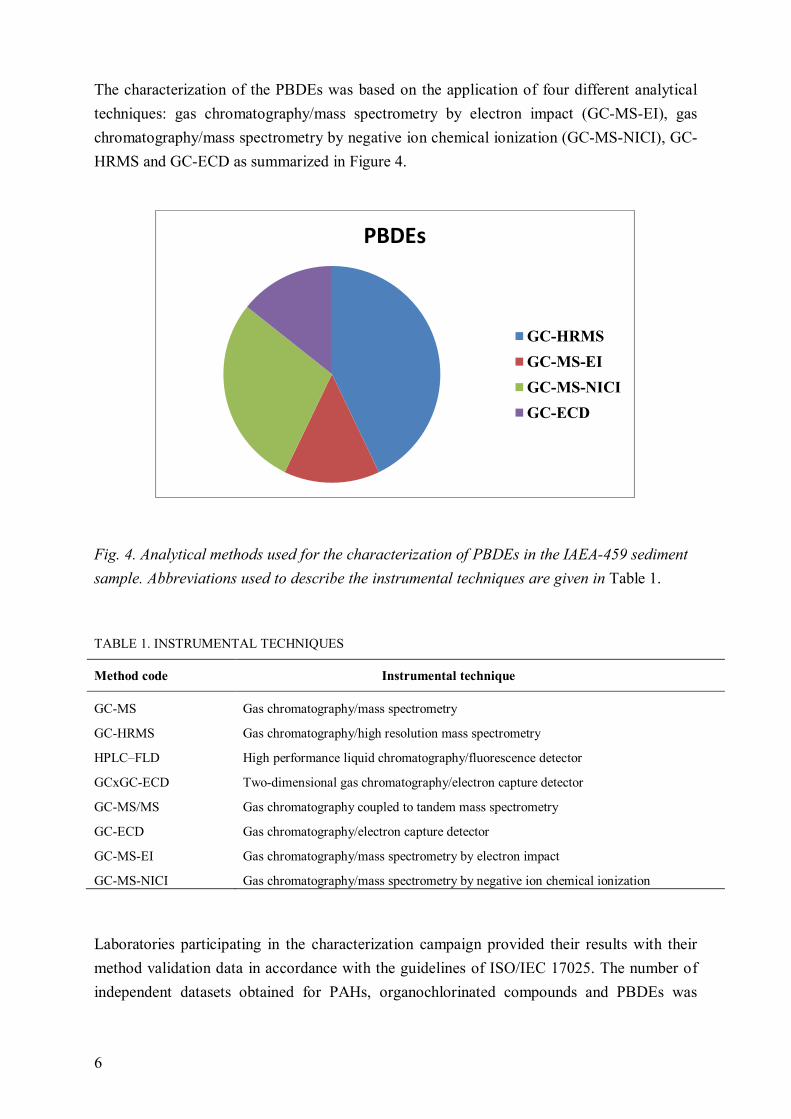
The characterization of the PBDEs was based on the application of four different analytical
techniques: gas chromatography/mass spectrometry by electron impact (GC-MS-EI), gas
chromatography/mass spectrometry by negative ion chemical ionization (GC-MS-NICI), GC-
HRMS and GC-ECD as summarized in Figure 4.
Fig. 4. Analytical methods used for the characterization of PBDEs in the IAEA-459 sediment
sample. Abbreviations used to describe the instrumental techniques are given in Table 1.
TABLE 1. INSTRUMENTAL TECHNIQUES
Method code Instrumental technique
GC-MS Gas chromatography/mass spectrometry
GC-HRMS Gas chromatography/high resolution mass spectrometry
HPLC–FLD High performance liquid chromatography/fluorescence detector
GCxGC-ECD Two-dimensional gas chromatography/electron capture detector
GC-MS/MS Gas chromatography coupled to tandem mass spectrometry
GC-ECD Gas chromatography/electron capture detector
GC-MS-EI Gas chromatography/mass spectrometry by electron impact
GC-MS-NICI Gas chromatography/mass spectrometry by negative ion chemical ionization
Laboratories participating in the characterization campaign provided their results with their
method validation data in accordance with the guidelines of ISO/IEC 17025. The number of
independent datasets obtained for PAHs, organochlorinated compounds and PBDEs was
PBDEs
GC-HRMS
GC-MS-EI
GC-MS-NICI
GC-ECD
7
respectively 10, 12 and 7. The basic principles for evaluation of measurement uncertainty
were followed according to the ISO Guide 35 [2] and the Guide to the Expression of
Uncertainty in Measurement (GUM) [6], which combines the different uncertainties of
characterization, inhomogeneity and instability.
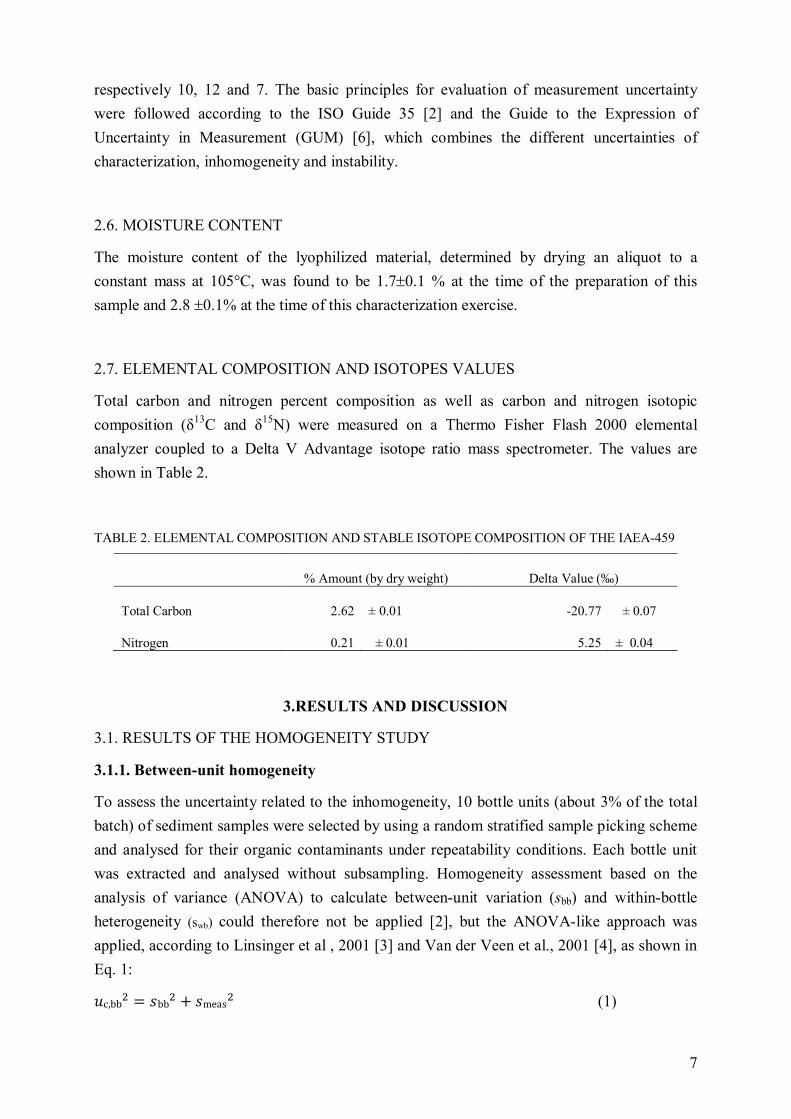
2.6. MOISTURE CONTENT
The moisture content of the lyophilized material, determined by drying an aliquot to a
constant mass at 105°C, was found to be 1.7±0.1 % at the time of the preparation of this
sample and 2.8 ±0.1% at the time of this characterization exercise.
2.7. ELEMENTAL COMPOSITION AND ISOTOPES VALUES
Total carbon and nitrogen percent composition as well as carbon and nitrogen isotopic
composition (δ13
C and δ15
N) were measured on a Thermo Fisher Flash 2000 elemental
analyzer coupled to a Delta V Advantage isotope ratio mass spectrometer. The values are
shown in Table 2.
TABLE 2. ELEMENTAL COMPOSITION AND STABLE ISOTOPE COMPOSITION OF THE IAEA-459
% Amount (by dry weight) Delta Value (‰)
Total Carbon 2.62 ± 0.01 -20.77 ± 0.07
Nitrogen 0.21 ± 0.01 5.25 ± 0.04
3.RESULTS AND DISCUSSION
3.1. RESULTS OF THE HOMOGENEITY STUDY
3.1.1. Between-unit homogeneity
To assess the uncertainty related to the inhomogeneity, 10 bottle units (about 3% of the total
batch) of sediment samples were selected by using a random stratified sample picking scheme
and analysed for their organic contaminants under repeatability conditions. Each bottle unit
was extracted and analysed without subsampling. Homogeneity assessment based on the
analysis of variance (ANOVA) to calculate between-unit variation (sbb) and within-bottle
heterogeneity (swb) could therefore not be applied [2], but the ANOVA-like approach was
applied, according to Linsinger et al , 2001 [3] and Van der Veen et al., 2001 [4], as shown in
Eq. 1:
�c,bb� = �bb� + �meas� (1)
8
which implies that
�bb� = �c,bb� − �meas� (2)
where uc,bb is the combined uncertainty of the between-unit experiment, expressed as the
uncertainty on a single unit; sbb is the variation between units and smeas is the intrinsic
variability of the method (smethod) divided by the square root of n, the number of replicates per
unit; sbb is the estimate of between-bottle variation in the material, named uhom.
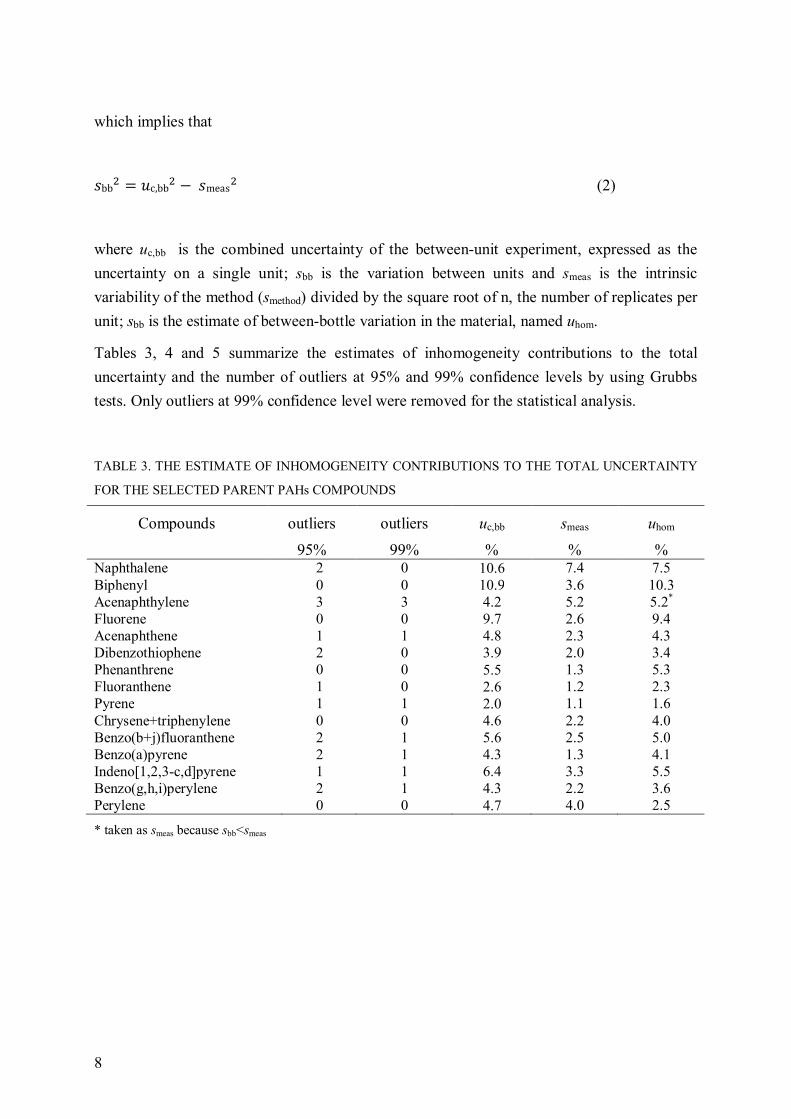
Tables 3, 4 and 5 summarize the estimates of inhomogeneity contributions to the total
uncertainty and the number of outliers at 95% and 99% confidence levels by using Grubbs
tests. Only outliers at 99% confidence level were removed for the statistical analysis.
TABLE 3. THE ESTIMATE OF INHOMOGENEITY CONTRIBUTIONS TO THE TOTAL UNCERTAINTY
FOR THE SELECTED PARENT PAHs COMPOUNDS
Compounds outliers outliers uc,bb smeas uhom
95% 99% % % % Naphthalene 2 0 10.6 7.4 7.5
Biphenyl 0 0 10.9 3.6 10.3
Acenaphthylene 3 3 4.2 5.2 5.2*
Fluorene 0 0 9.7 2.6 9.4
Acenaphthene 1 1 4.8 2.3 4.3
Dibenzothiophene 2 0 3.9 2.0 3.4
Phenanthrene 0 0 5.5 1.3 5.3
Fluoranthene 1 0 2.6 1.2 2.3
Pyrene 1 1 2.0 1.1 1.6
Chrysene+triphenylene 0 0 4.6 2.2 4.0
Benzo(b+j)fluoranthene 2 1 5.6 2.5 5.0
Benzo(a)pyrene 2 1 4.3 1.3 4.1
Indeno[1,2,3-c,d]pyrene 1 1 6.4 3.3 5.5
Benzo(g,h,i)perylene 2 1 4.3 2.2 3.6
Perylene 0 0 4.7 4.0 2.5
* taken as smeas because sbb<smeas
9
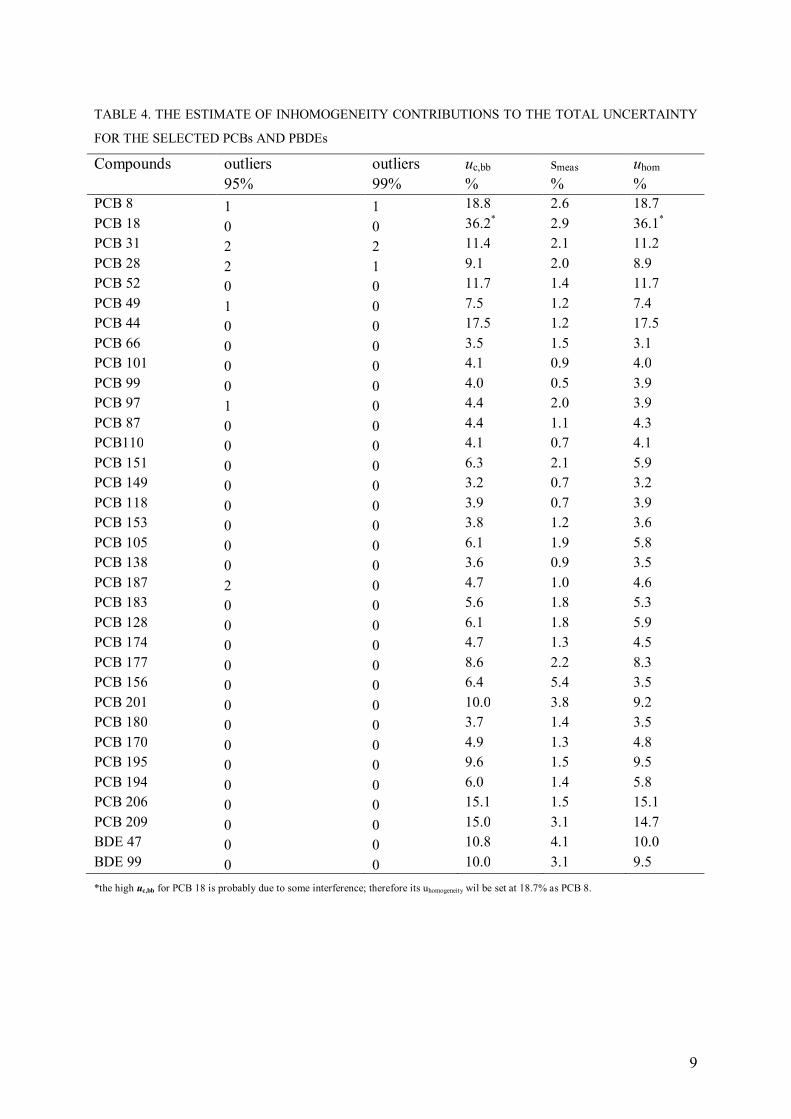
TABLE 4. THE ESTIMATE OF INHOMOGENEITY CONTRIBUTIONS TO THE TOTAL UNCERTAINTY
FOR THE SELECTED PCBs AND PBDEs
Compounds outliers outliers uc,bb smeas uhom
95% 99% % % %
PCB 8 1 1 18.8 2.6 18.7
PCB 18 0 0 36.2*
2.9 36.1*
PCB 31 2 2 11.4 2.1 11.2
PCB 28 2 1 9.1 2.0 8.9
PCB 52 0 0 11.7 1.4 11.7
PCB 49 1 0 7.5 1.2 7.4
PCB 44 0 0 17.5 1.2 17.5
PCB 66 0 0 3.5 1.5 3.1
PCB 101 0 0 4.1 0.9 4.0
PCB 99 0 0 4.0 0.5 3.9
PCB 97 1 0 4.4 2.0 3.9
PCB 87 0 0 4.4 1.1 4.3
PCB110 0 0 4.1 0.7 4.1
PCB 151 0 0 6.3 2.1 5.9
PCB 149 0 0 3.2 0.7 3.2
PCB 118 0 0 3.9 0.7 3.9
PCB 153 0 0 3.8 1.2 3.6
PCB 105 0 0 6.1 1.9 5.8
PCB 138 0 0 3.6 0.9 3.5
PCB 187 2 0 4.7 1.0 4.6
PCB 183 0 0 5.6 1.8 5.3
PCB 128 0 0 6.1 1.8 5.9
PCB 174 0 0 4.7 1.3 4.5
PCB 177 0 0 8.6 2.2 8.3
PCB 156 0 0 6.4 5.4 3.5
PCB 201 0 0 10.0 3.8 9.2
PCB 180 0 0 3.7 1.4 3.5
PCB 170 0 0 4.9 1.3 4.8
PCB 195 0 0 9.6 1.5 9.5
PCB 194 0 0 6.0 1.4 5.8
PCB 206 0 0 15.1 1.5 15.1
PCB 209 0 0 15.0 3.1 14.7
BDE 47 0 0 10.8 4.1 10.0
BDE 99 0 0 10.0 3.1 9.5
*the high uc,bb for PCB 18 is probably due to some interference; therefore its uhomogeneity wil be set at 18.7% as PCB 8.
10
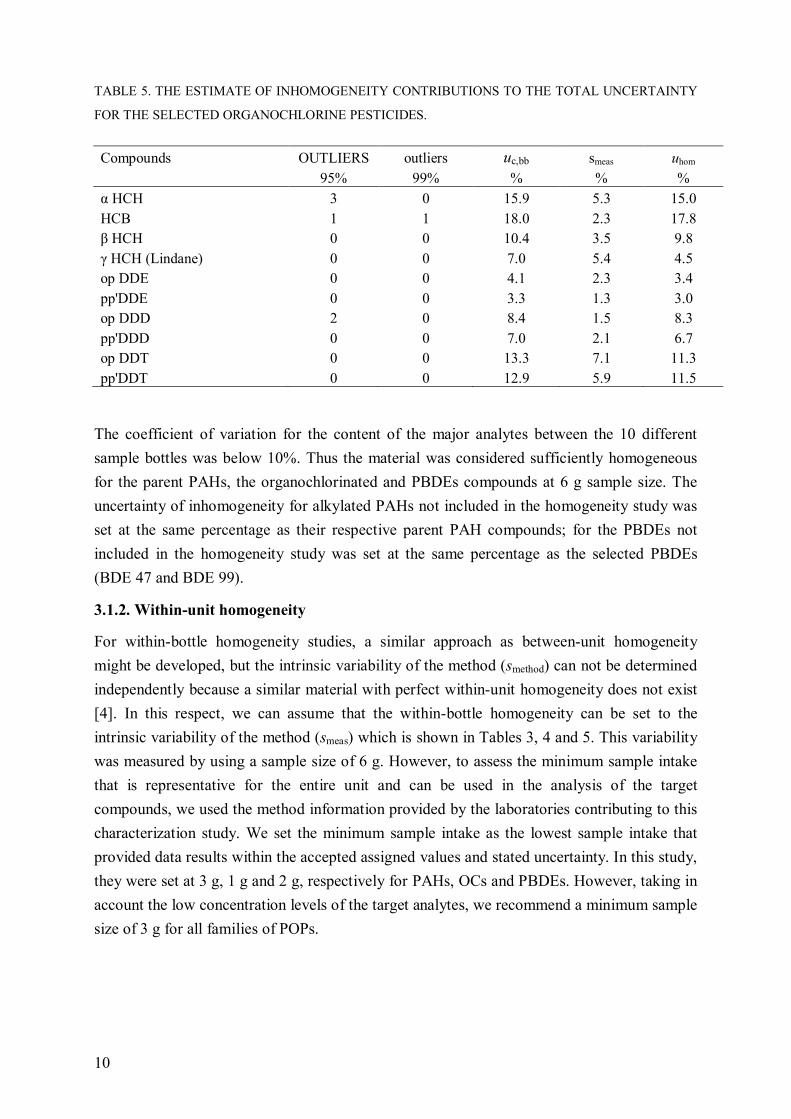
TABLE 5. THE ESTIMATE OF INHOMOGENEITY CONTRIBUTIONS TO THE TOTAL UNCERTAINTY
FOR THE SELECTED ORGANOCHLORINE PESTICIDES.
Compounds OUTLIERS outliers uc,bb smeas uhom
95% 99% % % %
α HCH 3 0 15.9 5.3 15.0
HCB 1 1 18.0 2.3 17.8
β HCH 0 0 10.4 3.5 9.8
γ HCH (Lindane) 0 0 7.0 5.4 4.5
op DDE 0 0 4.1 2.3 3.4
pp'DDE 0 0 3.3 1.3 3.0
op DDD 2 0 8.4 1.5 8.3
pp'DDD 0 0 7.0 2.1 6.7
op DDT 0 0 13.3 7.1 11.3
pp'DDT 0 0 12.9 5.9 11.5
The coefficient of variation for the content of the major analytes between the 10 different
sample bottles was below 10%. Thus the material was considered sufficiently homogeneous
for the parent PAHs, the organochlorinated and PBDEs compounds at 6 g sample size. The
uncertainty of inhomogeneity for alkylated PAHs not included in the homogeneity study was
set at the same percentage as their respective parent PAH compounds; for the PBDEs not
included in the homogeneity study was set at the same percentage as the selected PBDEs
(BDE 47 and BDE 99).
3.1.2. Within-unit homogeneity
For within-bottle homogeneity studies, a similar approach as between-unit homogeneity
might be developed, but the intrinsic variability of the method (smethod) can not be determined
independently because a similar material with perfect within-unit homogeneity does not exist
[4]. In this respect, we can assume that the within-bottle homogeneity can be set to the
intrinsic variability of the method (smeas) which is shown in Tables 3, 4 and 5. This variability
was measured by using a sample size of 6 g. However, to assess the minimum sample intake
that is representative for the entire unit and can be used in the analysis of the target
compounds, we used the method information provided by the laboratories contributing to this
characterization study. We set the minimum sample intake as the lowest sample intake that
provided data results within the accepted assigned values and stated uncertainty. In this study,
they were set at 3 g, 1 g and 2 g, respectively for PAHs, OCs and PBDEs. However, taking in
account the low concentration levels of the target analytes, we recommend a minimum sample
size of 3 g for all families of POPs.
11
3.2. RESULTS FOR STABILITY STUDY
3.2.1. Short-term stability study
The samples selected for short-term stability study were analysed and selected organic
contaminants (phenanthrene, fluoranthene, pyrene, PCB 138, PCB 153, pp’-DDE and BDE-
99) were evaluated individually for each temperature (20°C and 40°C). Measurements were
performed under repeatability conditions and linear regression lines were calculated for each
selected analyte and tested for significance on a 95% confidence level using a Student t-test
for slope significantly different from zero. No slope associated with any of the linearity plots
generated for each selected analyte was detected that differed significantly from zero. As
results did not show any significant trend of degradation over the timeframe at different
temperatures +20°C and +40°C, no special precautions regarding temperature control during
transport are needed. These results are supported by the chemical nature of the persistent
organic contaminants which owe a high chemical stability and persistence. Therefore, no
additional uncertainty with respect to instability due to transport needs to be taken into
account and the uncertainty associated with short-term stability under transport conditions is
taken as zero.
3.2.2. Long-term stability study
Long-term stability evaluation aims to determine if the certified values of the analyte(s)
remain valid during the 5 to 10 year lifetime of the certified reference material. Based on
experience with similar materials issued by the IAEA and statements of expiry dates on
certificates of other CRM providers such as NIST, the material is expected to be stable for 5-
10 years, provided that it will be stored in the dark at temperatures below 30°C [7, 8].
As no measurements on instability was determined over long term storage conditions, the
uncertainty for long-term stability was set as the intrinsic variability of the method smeas, which
is shown in Tables 3 for PAHs and Tables 4 and 5 for PCBs, OCs and PBDEs. The long-term
stability test will be monitored at regular intervals and changes, which may occur, will be
reflected in an updated certificate of analysis provided to the users.
3.3. DETERMINATION OF ASSIGNED VALUES AND UNCERTAINTIES
The determination of the assigned values and its standard uncertainty for organic
contaminants in the IAEA-459 sample were derived using the robust statistics approach,
which provide high resistance to the influence of extreme outlying values [2]. The robust
values of the average and standard deviation of the data was calculated using the Algorithm A
provided in the Annex C.1 from the ISO standard 13528 [9].
First, the set of p individual results were ranked in increasing order by (x1, x2, xi,…, xp). Then,
the median x* of the data was calculated as:
12
�∗ = median of��(i=1,2,3….p) (3)
The robust standard deviation of the data set was calculated:
�∗ = 1.483 ×median|�� − �∗|(i=1,2,3…..p) (4)
The final “cut-off” values used in the robust algorithm was estimated as:
� = 1.5 × �∗ (5)
For each xi, it was calculated:
��∗ = ���∗ = �∗ − �,if�� < �∗ − ���∗ = �∗ + �,if�� > �∗ + ���∗ = �∗,otherwise � (6)
New values for the robust mean x* and �∗ were updated as follows:
�∗ = ∑ � ∗!"# (7)s∗ = 1.134$%&'(∗)'∗*+&,)-* (8)
where the summation is over i
The robust estimates �∗ and �∗ were derived by an iterative calculation by updating the
values of x* and s* several times using the modified data, until the process converged to the
third significant figure of the robust standard deviation and robust average.
These estimate values were similar to other robust estimates of the mean calculated with the
algorithms offered by the Analytical Methods Committee of the Royal Society of Chemistry
(AMC) [10, 11].
The uncertainties associated with the assigned property values were conducted according to
ISO Guide 35 [2]. The relative combined uncertainty of the assigned property value of the
CRM involved combining the standard uncertainties associated with the characterization
(uchar), homogeneity (uhom), short term stability (ushort) and long-term stability (ustab). Because
the uncertainty component derived from the short term stability was insignificant and
assumed to be zero, the final expanded uncertainty was a combination of the other three
different contributions using the law of propagation of uncertainty as shown in Eq. 9:
. = / × 0�1234� + �5637� + �289� (9)
13
Where k is the coverage factor of 2, representing a confidence level of 95%
uhom was calculated as described in section 3.1.1.
ustab was calculated as described in section 3.2.2.
uchar was calculated as described in ISO 13528 [8] using Eq. 10:
�1234 = 1.25 × 5∗√# (10)
Where: s* is the robust standard deviation calculated from Eq. 8 and p is the number of
participating laboratories.
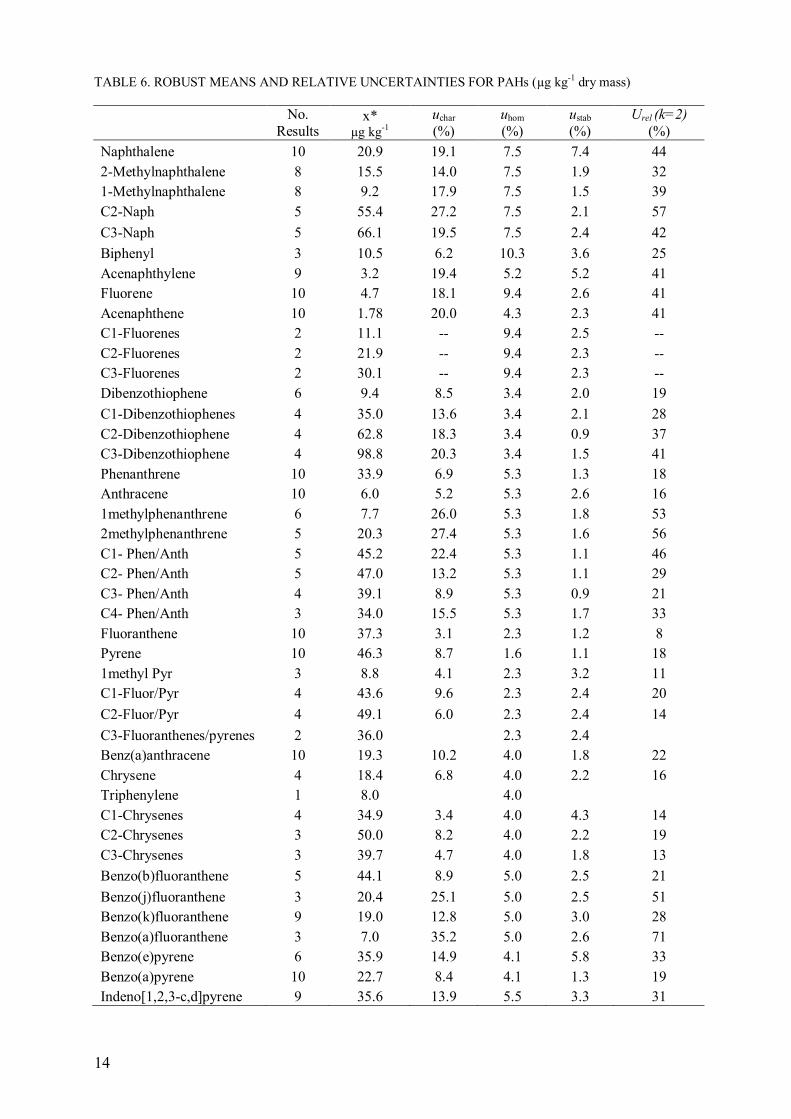
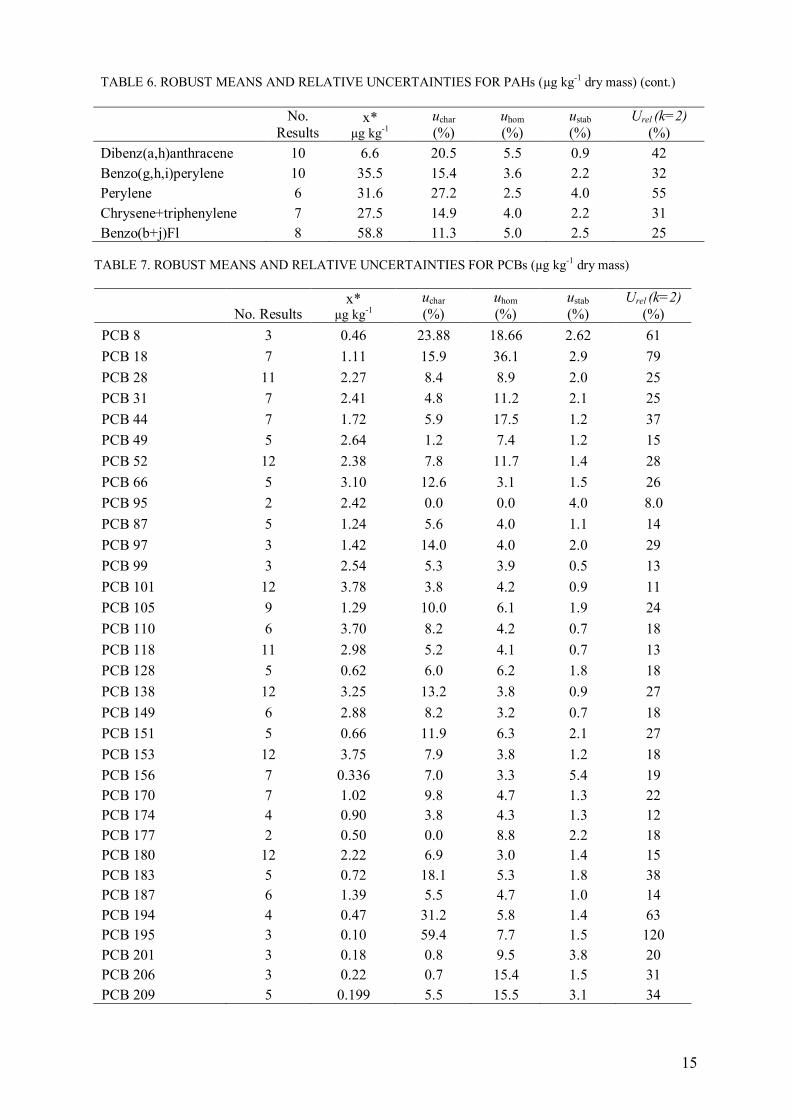
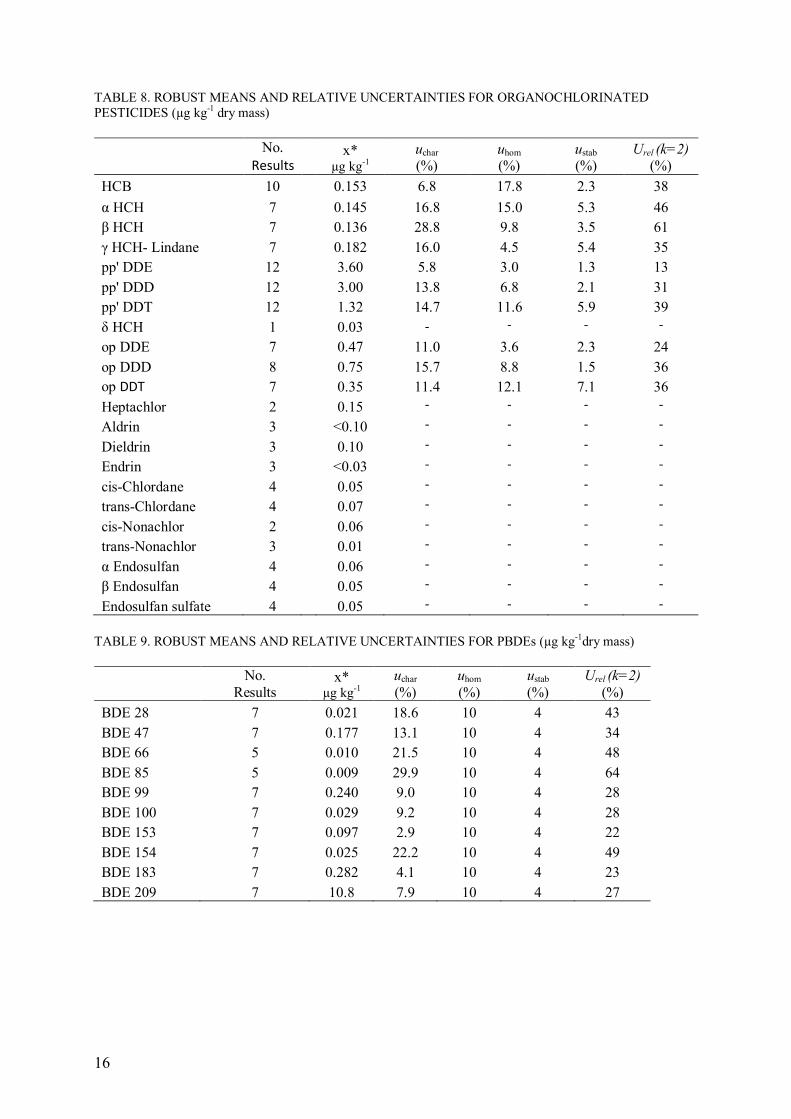
The final assigned values derived by robust mean are shown in Tables 6, 7, 8 and 9 together
with their individual and final uncertainty budget.
14
TABLE 6. ROBUST MEANS AND RELATIVE UNCERTAINTIES FOR PAHs (µg kg-1 dry mass)
No.
Results x*
µg kg-1
uchar
(%)
uhom
(%)
ustab
(%)
Urel (k=2)
(%)
Naphthalene 10 20.9 19.1 7.5 7.4 44
2-Methylnaphthalene 8 15.5 14.0 7.5 1.9 32
1-Methylnaphthalene 8 9.2 17.9 7.5 1.5 39
C2-Naph 5 55.4 27.2 7.5 2.1 57
C3-Naph 5 66.1 19.5 7.5 2.4 42
Biphenyl 3 10.5 6.2 10.3 3.6 25
Acenaphthylene 9 3.2 19.4 5.2 5.2 41
Fluorene 10 4.7 18.1 9.4 2.6 41
Acenaphthene 10 1.78 20.0 4.3 2.3 41
C1-Fluorenes 2 11.1 -- 9.4 2.5 --
C2-Fluorenes 2 21.9 -- 9.4 2.3 --
C3-Fluorenes 2 30.1 -- 9.4 2.3 --
Dibenzothiophene 6 9.4 8.5 3.4 2.0 19
C1-Dibenzothiophenes 4 35.0 13.6 3.4 2.1 28
C2-Dibenzothiophene 4 62.8 18.3 3.4 0.9 37
C3-Dibenzothiophene 4 98.8 20.3 3.4 1.5 41
Phenanthrene 10 33.9 6.9 5.3 1.3 18
Anthracene 10 6.0 5.2 5.3 2.6 16
1methylphenanthrene 6 7.7 26.0 5.3 1.8 53
2methylphenanthrene 5 20.3 27.4 5.3 1.6 56
C1- Phen/Anth 5 45.2 22.4 5.3 1.1 46
C2- Phen/Anth 5 47.0 13.2 5.3 1.1 29
C3- Phen/Anth 4 39.1 8.9 5.3 0.9 21
C4- Phen/Anth 3 34.0 15.5 5.3 1.7 33
Fluoranthene 10 37.3 3.1 2.3 1.2 8
Pyrene 10 46.3 8.7 1.6 1.1 18
1methyl Pyr 3 8.8 4.1 2.3 3.2 11
C1-Fluor/Pyr 4 43.6 9.6 2.3 2.4 20
C2-Fluor/Pyr 4 49.1 6.0 2.3 2.4 14
C3-Fluoranthenes/pyrenes 2 36.0
2.3 2.4 Benz(a)anthracene 10 19.3 10.2 4.0 1.8 22
Chrysene 4 18.4 6.8 4.0 2.2 16
Triphenylene 1 8.0
4.0
C1-Chrysenes 4 34.9 3.4 4.0 4.3 14
C2-Chrysenes 3 50.0 8.2 4.0 2.2 19
C3-Chrysenes 3 39.7 4.7 4.0 1.8 13
Benzo(b)fluoranthene 5 44.1 8.9 5.0 2.5 21
Benzo(j)fluoranthene 3 20.4 25.1 5.0 2.5 51
Benzo(k)fluoranthene 9 19.0 12.8 5.0 3.0 28
Benzo(a)fluoranthene 3 7.0 35.2 5.0 2.6 71
Benzo(e)pyrene 6 35.9 14.9 4.1 5.8 33
Benzo(a)pyrene 10 22.7 8.4 4.1 1.3 19
Indeno[1,2,3-c,d]pyrene 9 35.6 13.9 5.5 3.3 31
15
TABLE 6. ROBUST MEANS AND RELATIVE UNCERTAINTIES FOR PAHs (µg kg-1 dry mass) (cont.)
No.
Results x*
µg kg-1
uchar
(%)
uhom
(%)
ustab
(%)
Urel (k=2)
(%)
Dibenz(a,h)anthracene 10 6.6 20.5 5.5 0.9 42
Benzo(g,h,i)perylene 10 35.5 15.4 3.6 2.2 32
Perylene 6 31.6 27.2 2.5 4.0 55
Chrysene+triphenylene 7 27.5 14.9 4.0 2.2 31
Benzo(b+j)Fl 8 58.8 11.3 5.0 2.5 25
TABLE 7. ROBUST MEANS AND RELATIVE UNCERTAINTIES FOR PCBs (µg kg-1 dry mass)
No. Results x*
µg kg-1
uchar
(%)
uhom
(%)
ustab
(%)
Urel (k=2)
(%)
PCB 8 3 0.46 23.88 18.66 2.62 61
PCB 18 7 1.11 15.9 36.1 2.9 79
PCB 28 11 2.27 8.4 8.9 2.0 25
PCB 31 7 2.41 4.8 11.2 2.1 25
PCB 44 7 1.72 5.9 17.5 1.2 37
PCB 49 5 2.64 1.2 7.4 1.2 15
PCB 52 12 2.38 7.8 11.7 1.4 28
PCB 66 5 3.10 12.6 3.1 1.5 26
PCB 95 2 2.42 0.0 0.0 4.0 8.0
PCB 87 5 1.24 5.6 4.0 1.1 14
PCB 97 3 1.42 14.0 4.0 2.0 29
PCB 99 3 2.54 5.3 3.9 0.5 13
PCB 101 12 3.78 3.8 4.2 0.9 11
PCB 105 9 1.29 10.0 6.1 1.9 24
PCB 110 6 3.70 8.2 4.2 0.7 18
PCB 118 11 2.98 5.2 4.1 0.7 13
PCB 128 5 0.62 6.0 6.2 1.8 18
PCB 138 12 3.25 13.2 3.8 0.9 27
PCB 149 6 2.88 8.2 3.2 0.7 18
PCB 151 5 0.66 11.9 6.3 2.1 27
PCB 153 12 3.75 7.9 3.8 1.2 18
PCB 156 7 0.336 7.0 3.3 5.4 19
PCB 170 7 1.02 9.8 4.7 1.3 22
PCB 174 4 0.90 3.8 4.3 1.3 12
PCB 177 2 0.50 0.0 8.8 2.2 18
PCB 180 12 2.22 6.9 3.0 1.4 15
PCB 183 5 0.72 18.1 5.3 1.8 38
PCB 187 6 1.39 5.5 4.7 1.0 14
PCB 194 4 0.47 31.2 5.8 1.4 63
PCB 195 3 0.10 59.4 7.7 1.5 120
PCB 201 3 0.18 0.8 9.5 3.8 20
PCB 206 3 0.22 0.7 15.4 1.5 31
PCB 209 5 0.199 5.5 15.5 3.1 34
16
TABLE 8. ROBUST MEANS AND RELATIVE UNCERTAINTIES FOR ORGANOCHLORINATED
PESTICIDES (µg kg-1 dry mass)
No.
Results
x* µg kg-1
uchar (%)
uhom (%)
ustab (%)
Urel (k=2) (%)
HCB 10 0.153 6.8 17.8 2.3 38
α HCH 7 0.145 16.8 15.0 5.3 46
β HCH 7 0.136 28.8 9.8 3.5 61
γ HCH- Lindane 7 0.182 16.0 4.5 5.4 35
pp' DDE 12 3.60 5.8 3.0 1.3 13
pp' DDD 12 3.00 13.8 6.8 2.1 31
pp' DDT 12 1.32 14.7 11.6 5.9 39
δ HCH 1 0.03 - - - -
op DDE 7 0.47 11.0 3.6 2.3 24
op DDD 8 0.75 15.7 8.8 1.5 36
op DDT 7 0.35 11.4 12.1 7.1 36
Heptachlor 2 0.15 - - - -
Aldrin 3 <0.10 - - - -
Dieldrin 3 0.10 - - - -
Endrin 3 <0.03 - - - -
cis-Chlordane 4 0.05 - - - -
trans-Chlordane 4 0.07 - - - -
cis-Nonachlor 2 0.06 - - - -
trans-Nonachlor 3 0.01 - - - -
α Endosulfan 4 0.06 - - - -
β Endosulfan 4 0.05 - - - -
Endosulfan sulfate 4 0.05 - - - -
TABLE 9. ROBUST MEANS AND RELATIVE UNCERTAINTIES FOR PBDEs (µg kg-1dry mass)
No.
Results
x* µg kg-1
uchar
(%)
uhom
(%)
ustab
(%)
Urel (k=2)
(%)
BDE 28 7 0.021 18.6 10 4 43
BDE 47 7 0.177 13.1 10 4 34
BDE 66 5 0.010 21.5 10 4 48
BDE 85 5 0.009 29.9 10 4 64
BDE 99 7 0.240 9.0 10 4 28
BDE 100 7 0.029 9.2 10 4 28
BDE 153 7 0.097 2.9 10 4 22
BDE 154 7 0.025 22.2 10 4 49
BDE 183 7 0.282 4.1 10 4 23
BDE 209 7 10.8 7.9 10 4 27
17
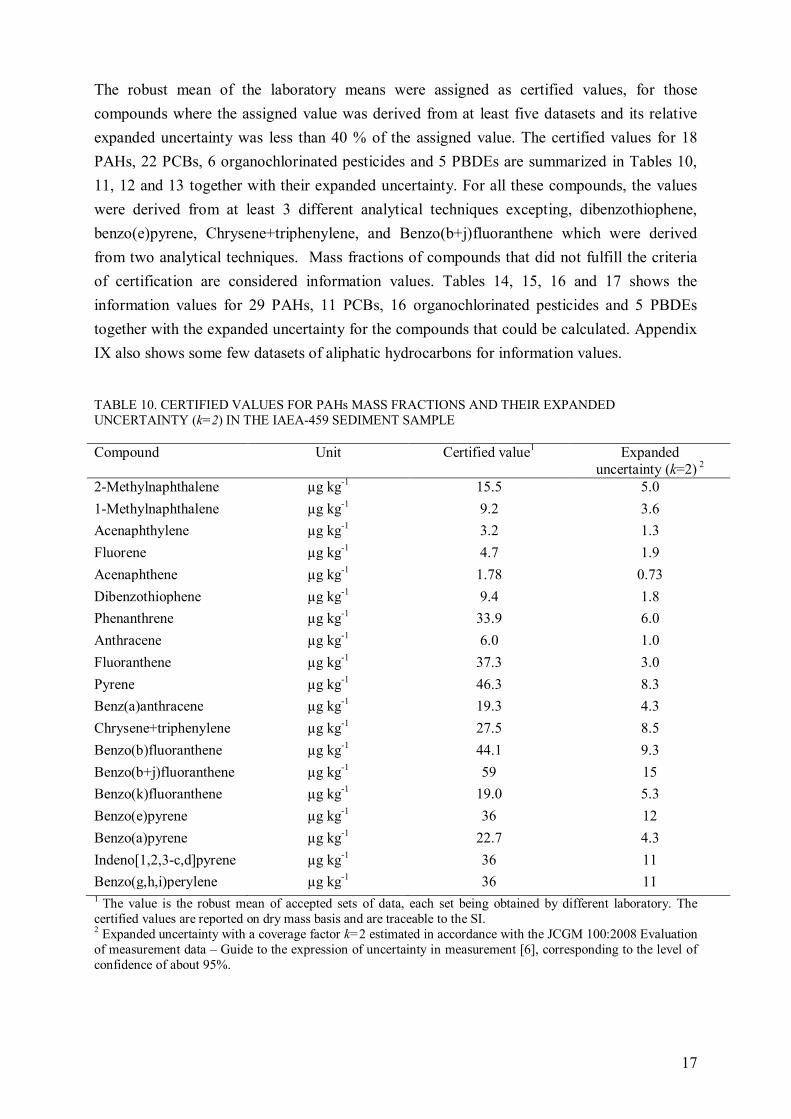
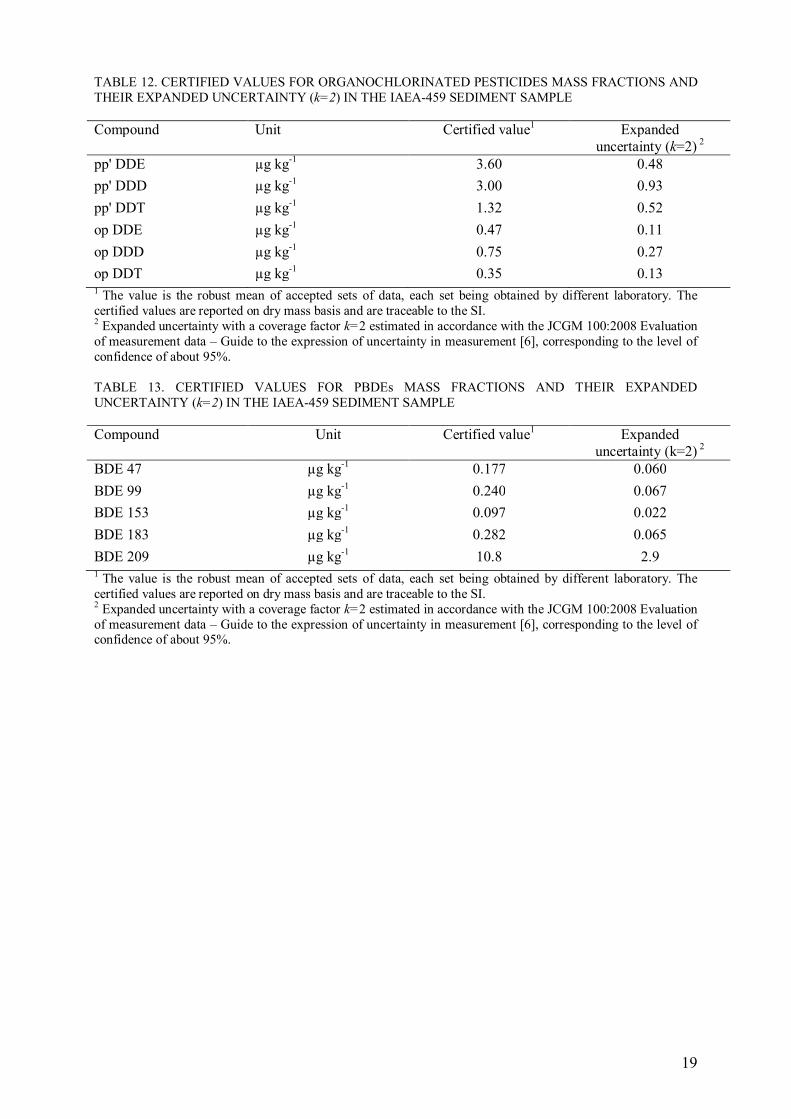
The robust mean of the laboratory means were assigned as certified values, for those
compounds where the assigned value was derived from at least five datasets and its relative
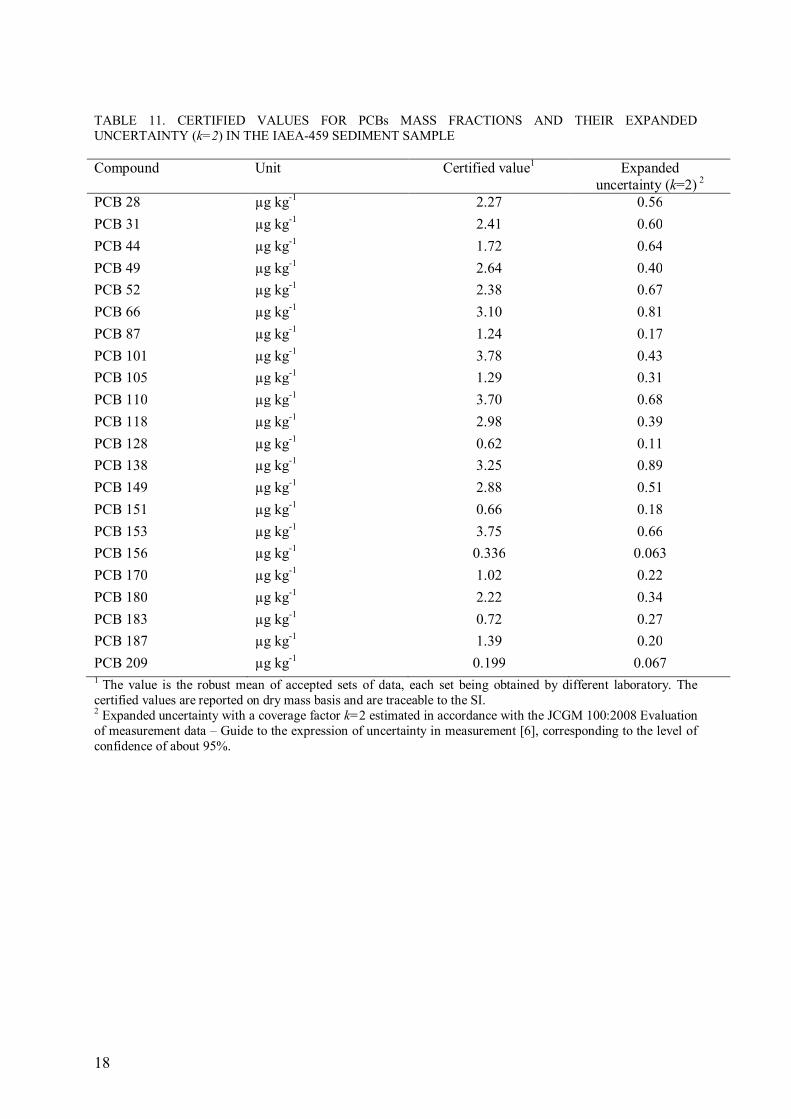
expanded uncertainty was less than 40 % of the assigned value. The certified values for 18
PAHs, 22 PCBs, 6 organochlorinated pesticides and 5 PBDEs are summarized in Tables 10,
11, 12 and 13 together with their expanded uncertainty. For all these compounds, the values
were derived from at least 3 different analytical techniques excepting, dibenzothiophene,
benzo(e)pyrene, Chrysene+triphenylene, and Benzo(b+j)fluoranthene which were derived
from two analytical techniques. Mass fractions of compounds that did not fulfill the criteria
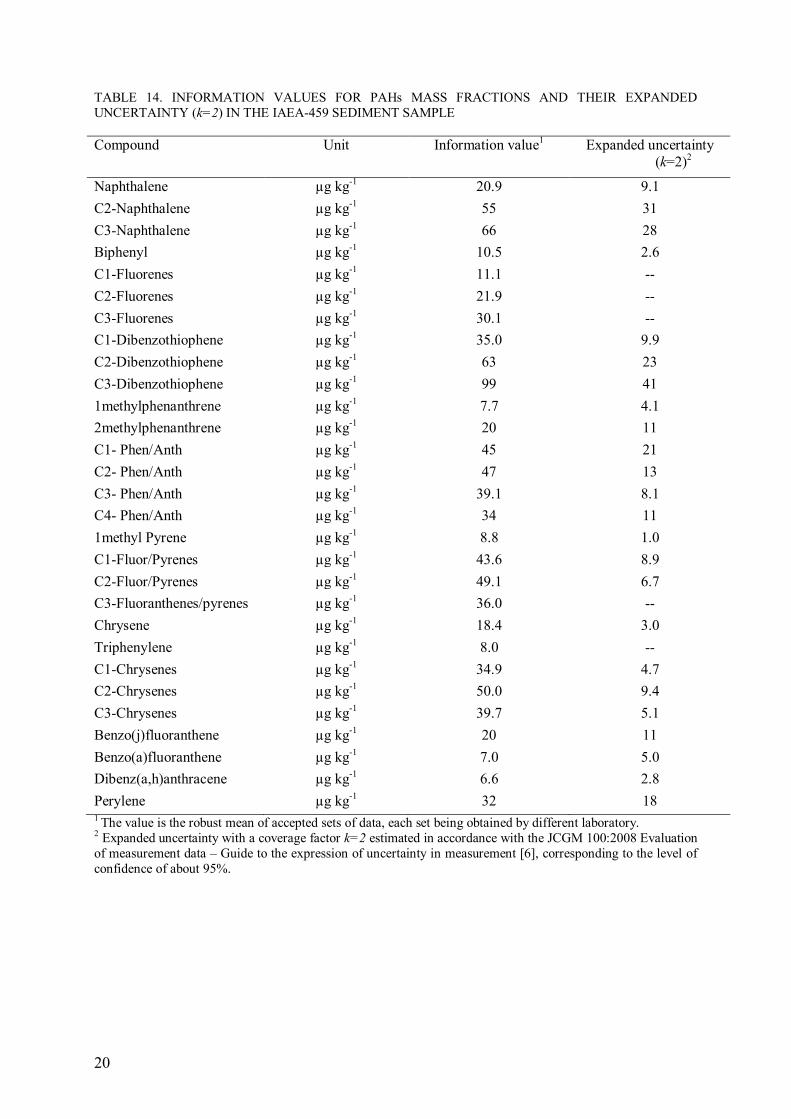
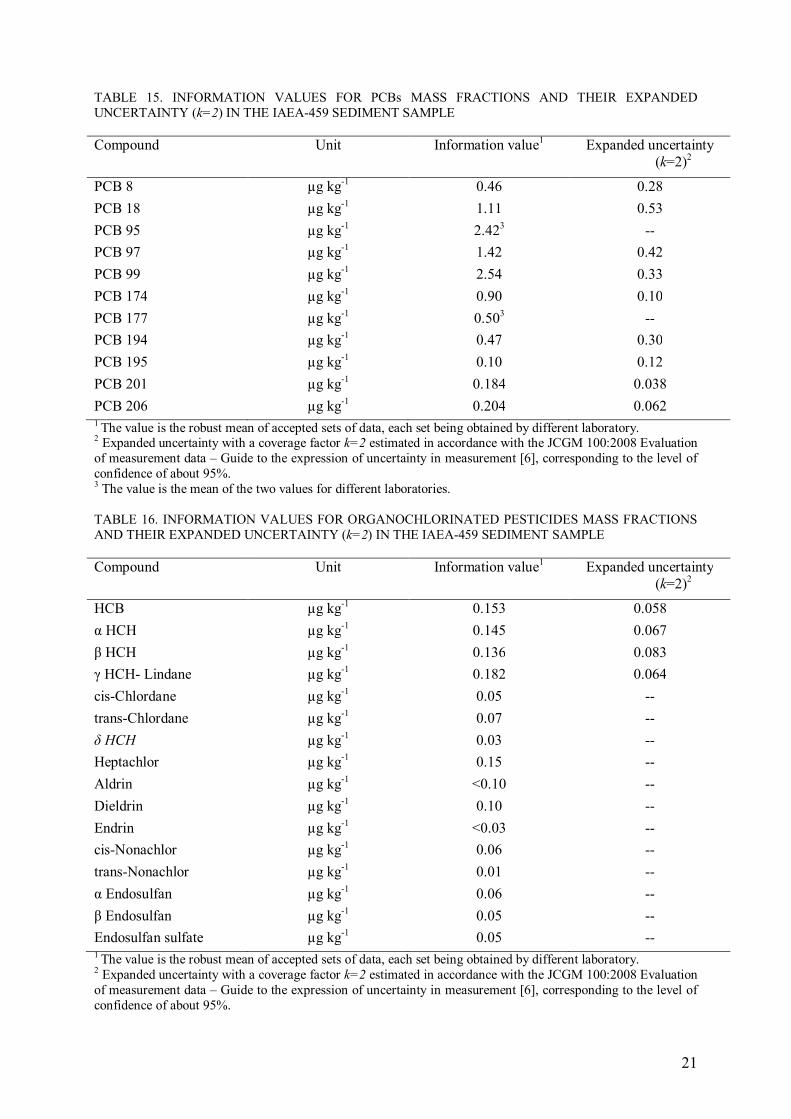
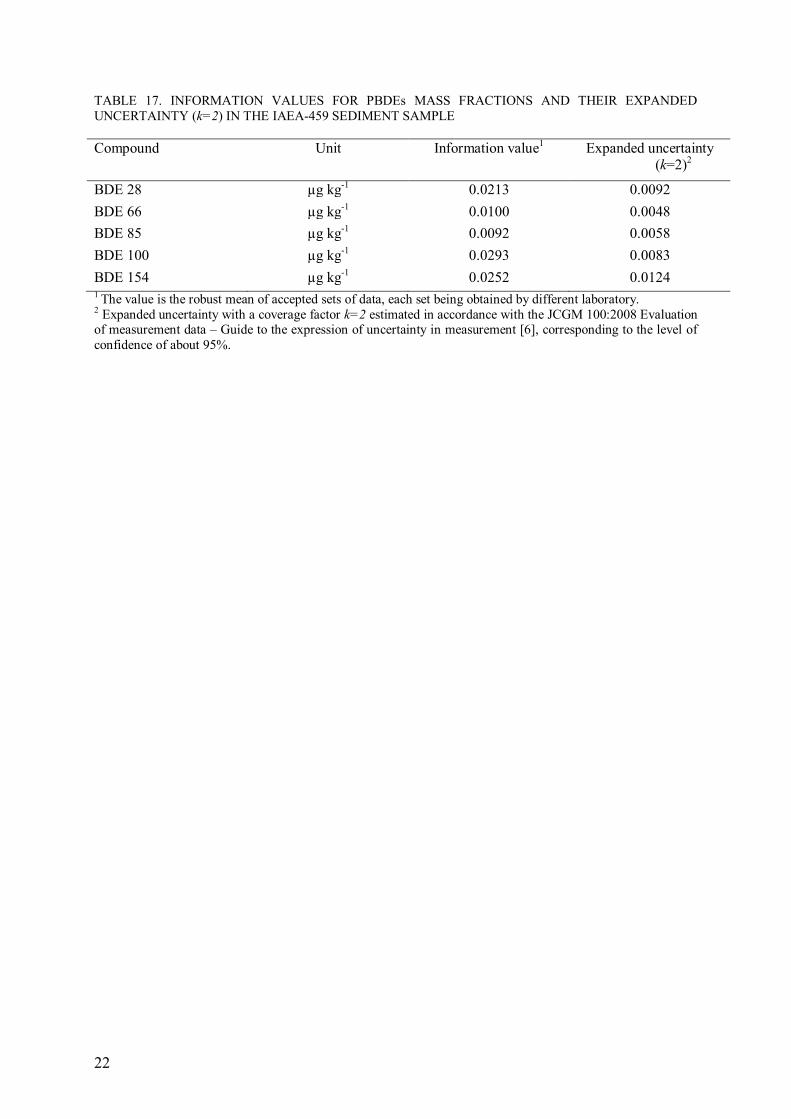
of certification are considered information values. Tables 14, 15, 16 and 17 shows the
information values for 29 PAHs, 11 PCBs, 16 organochlorinated pesticides and 5 PBDEs
together with the expanded uncertainty for the compounds that could be calculated. Appendix
IX also shows some few datasets of aliphatic hydrocarbons for information values.
TABLE 10. CERTIFIED VALUES FOR PAHs MASS FRACTIONS AND THEIR EXPANDED
UNCERTAINTY (k=2) IN THE IAEA-459 SEDIMENT SAMPLE
Compound Unit Certified value1 Expanded
uncertainty (k=2) 2
2-Methylnaphthalene µg kg-1
15.5 5.0
1-Methylnaphthalene µg kg-1
9.2 3.6
Acenaphthylene µg kg-1
3.2 1.3
Fluorene µg kg-1
4.7 1.9
Acenaphthene µg kg-1
1.78 0.73
Dibenzothiophene µg kg-1
9.4 1.8
Phenanthrene µg kg-1
33.9 6.0
Anthracene µg kg-1
6.0 1.0
Fluoranthene µg kg-1
37.3 3.0
Pyrene µg kg-1
46.3 8.3
Benz(a)anthracene µg kg-1
19.3 4.3
Chrysene+triphenylene µg kg-1
27.5 8.5
Benzo(b)fluoranthene µg kg-1
44.1 9.3
Benzo(b+j)fluoranthene µg kg-1
59 15
Benzo(k)fluoranthene µg kg-1
19.0 5.3
Benzo(e)pyrene µg kg-1
36 12
Benzo(a)pyrene µg kg-1
22.7 4.3
Indeno[1,2,3-c,d]pyrene µg kg-1
36 11
Benzo(g,h,i)perylene µg kg-1
36 11 1 The value is the robust mean of accepted sets of data, each set being obtained by different laboratory. The
certified values are reported on dry mass basis and are traceable to the SI. 2 Expanded uncertainty with a coverage factor k=2 estimated in accordance with the JCGM 100:2008 Evaluation
of measurement data – Guide to the expression of uncertainty in measurement [6], corresponding to the level of
confidence of about 95%.
18
TABLE 11. CERTIFIED VALUES FOR PCBs MASS FRACTIONS AND THEIR EXPANDED
UNCERTAINTY (k=2) IN THE IAEA-459 SEDIMENT SAMPLE
Compound Unit Certified value1 Expanded
uncertainty (k=2) 2
PCB 28 µg kg-1
2.27 0.56
PCB 31 µg kg-1
2.41 0.60
PCB 44 µg kg-1
1.72 0.64
PCB 49 µg kg-1
2.64 0.40
PCB 52 µg kg-1
2.38 0.67
PCB 66 µg kg-1
3.10 0.81
PCB 87 µg kg-1
1.24 0.17
PCB 101 µg kg-1
3.78 0.43
PCB 105 µg kg-1
1.29 0.31
PCB 110 µg kg-1
3.70 0.68
PCB 118 µg kg-1
2.98 0.39
PCB 128 µg kg-1
0.62 0.11
PCB 138 µg kg-1
3.25 0.89
PCB 149 µg kg-1
2.88 0.51
PCB 151 µg kg-1
0.66 0.18
PCB 153 µg kg-1
3.75 0.66
PCB 156 µg kg-1
0.336 0.063
PCB 170 µg kg-1
1.02 0.22
PCB 180 µg kg-1
2.22 0.34
PCB 183 µg kg-1
0.72 0.27
PCB 187 µg kg-1
1.39 0.20
PCB 209 µg kg-1
0.199 0.067 1 The value is the robust mean of accepted sets of data, each set being obtained by different laboratory. The
certified values are reported on dry mass basis and are traceable to the SI. 2 Expanded uncertainty with a coverage factor k=2 estimated in accordance with the JCGM 100:2008 Evaluation
of measurement data – Guide to the expression of uncertainty in measurement [6], corresponding to the level of
confidence of about 95%.
19
TABLE 12. CERTIFIED VALUES FOR ORGANOCHLORINATED PESTICIDES MASS FRACTIONS AND
THEIR EXPANDED UNCERTAINTY (k=2) IN THE IAEA-459 SEDIMENT SAMPLE
Compound Unit Certified value1 Expanded
uncertainty (k=2) 2
pp' DDE µg kg-1
3.60 0.48
pp' DDD µg kg-1
3.00 0.93
pp' DDT µg kg-1
1.32 0.52
op DDE µg kg-1
0.47 0.11
op DDD µg kg-1
0.75 0.27
op DDT µg kg-1
0.35 0.13 1 The value is the robust mean of accepted sets of data, each set being obtained by different laboratory. The
certified values are reported on dry mass basis and are traceable to the SI. 2 Expanded uncertainty with a coverage factor k=2 estimated in accordance with the JCGM 100:2008 Evaluation
of measurement data – Guide to the expression of uncertainty in measurement [6], corresponding to the level of
confidence of about 95%.
TABLE 13. CERTIFIED VALUES FOR PBDEs MASS FRACTIONS AND THEIR EXPANDED
UNCERTAINTY (k=2) IN THE IAEA-459 SEDIMENT SAMPLE
Compound Unit Certified value1 Expanded
uncertainty (k=2) 2
BDE 47 µg kg-1
0.177 0.060
BDE 99 µg kg-1
0.240 0.067
BDE 153 µg kg-1
0.097 0.022
BDE 183 µg kg-1
0.282 0.065
BDE 209 µg kg-1
10.8 2.9 1 The value is the robust mean of accepted sets of data, each set being obtained by different laboratory. The
certified values are reported on dry mass basis and are traceable to the SI. 2 Expanded uncertainty with a coverage factor k=2 estimated in accordance with the JCGM 100:2008 Evaluation
of measurement data – Guide to the expression of uncertainty in measurement [6], corresponding to the level of confidence of about 95%.
20
TABLE 14. INFORMATION VALUES FOR PAHs MASS FRACTIONS AND THEIR EXPANDED
UNCERTAINTY (k=2) IN THE IAEA-459 SEDIMENT SAMPLE
Compound Unit Information value1
Expanded uncertainty
(k=2)2
Naphthalene µg kg-1
20.9 9.1
C2-Naphthalene µg kg-1
55 31
C3-Naphthalene µg kg-1
66 28
Biphenyl µg kg-1
10.5 2.6
C1-Fluorenes µg kg-1
11.1 --
C2-Fluorenes µg kg-1
21.9 --
C3-Fluorenes µg kg-1
30.1 --
C1-Dibenzothiophene µg kg-1
35.0 9.9
C2-Dibenzothiophene µg kg-1
63 23
C3-Dibenzothiophene µg kg-1
99 41
1methylphenanthrene µg kg-1
7.7 4.1
2methylphenanthrene µg kg-1
20 11
C1- Phen/Anth µg kg-1
45 21
C2- Phen/Anth µg kg-1
47 13
C3- Phen/Anth µg kg-1
39.1 8.1
C4- Phen/Anth µg kg-1
34 11
1methyl Pyrene µg kg-1
8.8 1.0
C1-Fluor/Pyrenes µg kg-1
43.6 8.9
C2-Fluor/Pyrenes µg kg-1
49.1 6.7
C3-Fluoranthenes/pyrenes µg kg-1
36.0 --
Chrysene µg kg-1
18.4 3.0
Triphenylene µg kg-1
8.0 --
C1-Chrysenes µg kg-1
34.9 4.7
C2-Chrysenes µg kg-1
50.0 9.4
C3-Chrysenes µg kg-1
39.7 5.1
Benzo(j)fluoranthene µg kg-1
20 11
Benzo(a)fluoranthene µg kg-1
7.0 5.0
Dibenz(a,h)anthracene µg kg-1
6.6 2.8
Perylene µg kg-1
32 18 1 The value is the robust mean of accepted sets of data, each set being obtained by different laboratory. 2 Expanded uncertainty with a coverage factor k=2 estimated in accordance with the JCGM 100:2008 Evaluation
of measurement data – Guide to the expression of uncertainty in measurement [6], corresponding to the level of
confidence of about 95%.
21
TABLE 15. INFORMATION VALUES FOR PCBs MASS FRACTIONS AND THEIR EXPANDED
UNCERTAINTY (k=2) IN THE IAEA-459 SEDIMENT SAMPLE
Compound Unit Information value1
Expanded uncertainty
(k=2)2
PCB 8 µg kg-1
0.46 0.28
PCB 18 µg kg-1
1.11 0.53
PCB 95 µg kg-1
2.423 --
PCB 97 µg kg-1
1.42 0.42
PCB 99 µg kg-1
2.54 0.33
PCB 174 µg kg-1
0.90 0.10
PCB 177 µg kg-1
0.503
--
PCB 194 µg kg-1
0.47 0.30
PCB 195 µg kg-1
0.10 0.12
PCB 201 µg kg-1
0.184 0.038
PCB 206 µg kg-1
0.204 0.062 1 The value is the robust mean of accepted sets of data, each set being obtained by different laboratory. 2 Expanded uncertainty with a coverage factor k=2 estimated in accordance with the JCGM 100:2008 Evaluation
of measurement data – Guide to the expression of uncertainty in measurement [6], corresponding to the level of
confidence of about 95%. 3 The value is the mean of the two values for different laboratories.
TABLE 16. INFORMATION VALUES FOR ORGANOCHLORINATED PESTICIDES MASS FRACTIONS
AND THEIR EXPANDED UNCERTAINTY (k=2) IN THE IAEA-459 SEDIMENT SAMPLE
Compound Unit Information value1
Expanded uncertainty
(k=2)2
HCB µg kg-1
0.153 0.058
α HCH µg kg-1
0.145 0.067
β HCH µg kg-1
0.136 0.083
γ HCH- Lindane µg kg-1
0.182 0.064
cis-Chlordane µg kg-1
0.05 --
trans-Chlordane µg kg-1
0.07 --
δ HCH µg kg-1
0.03 --
Heptachlor µg kg-1
0.15 --
Aldrin µg kg-1
<0.10 --
Dieldrin µg kg-1
0.10 --
Endrin µg kg-1
<0.03 --
cis-Nonachlor µg kg-1
0.06 --
trans-Nonachlor µg kg-1
0.01 --
α Endosulfan µg kg-1
0.06 --
β Endosulfan µg kg-1
0.05 --
Endosulfan sulfate µg kg-1
0.05 -- 1 The value is the robust mean of accepted sets of data, each set being obtained by different laboratory. 2 Expanded uncertainty with a coverage factor k=2 estimated in accordance with the JCGM 100:2008 Evaluation
of measurement data – Guide to the expression of uncertainty in measurement [6], corresponding to the level of
confidence of about 95%.
22
TABLE 17. INFORMATION VALUES FOR PBDEs MASS FRACTIONS AND THEIR EXPANDED
UNCERTAINTY (k=2) IN THE IAEA-459 SEDIMENT SAMPLE
Compound Unit Information value1
Expanded uncertainty (k=2)
2
BDE 28 µg kg-1
0.0213 0.0092
BDE 66 µg kg-1
0.0100 0.0048
BDE 85 µg kg-1
0.0092 0.0058
BDE 100 µg kg-1
0.0293 0.0083
BDE 154 µg kg-1
0.0252 0.0124 1 The value is the robust mean of accepted sets of data, each set being obtained by different laboratory. 2 Expanded uncertainty with a coverage factor k=2 estimated in accordance with the JCGM 100:2008 Evaluation of measurement data – Guide to the expression of uncertainty in measurement [6], corresponding to the level of
confidence of about 95%.
23
4. METROLOGICAL TRACEABILITY AND COMMUTABILITY
Metrological traceability is defined as the property of a measurement result where the result is
related to a reference through a documented unbroken chain of calibrations, each contributing
to the measurement uncertainty [10]. The methods used by all participating laboratories were
validated by using matrix standard reference materials (CRMs) from NIST (SRM1941b, SRM
1944), IAEA (IAEA-408, IAEA-159) and materials characterized by QUASIMEME
proficiency tests (MS3 polycyclic aromatic hydrocarbons in sediment, MS2 chlorinated
organics in sediment). The fact, that values reported by participants are based on calibration
standard solutions of known purity, issued by accredited commercial companies with
documented unbroken chain of calibrations, demonstrates that the assigned values derived
from combining the individual results are traceable to International System of Unis (SI).
Furthermore, the agreement between the results generated by different analytical
methodologies ensures the comparability of the measurement results and validates the identity
of the measurand.
Commutability is a property of an RM, demonstrated by the closeness of agreement between
the relation among the measurement results for a stated quantity in this material, obtained
according to two given measurement procedures, and the relation obtained among the
measurement results for other specified materials [5].
A material is said to be commutable when the measurand in the routine test samples behaves
similar as in the CRM with respect to the different measurement procedures. This implies that
the application of the procedures to the CRM would produce the same quantitative value as
normal routine samples containing the same concentration of the measurand. In this respect,
IAEA-459 is a natural marine sediment sample and their analytical behaviour should be the
same as for a routine sample of dried sediment samples. The agreement between the data
acquired with different analytical procedures for the IAEA-459 characterization study
endorses the absence of any significant method bias and shows commutability of the material
for all certified organic compounds.
5. CONCLUSIONS
Combination of different data sets from at least two different analytical techniques has
allowed the assignment of certified concentrations for 22 PCBs, 6 OC pesticides, 5 PBDEs
24
and 18 PAHs following the recommendation of ISO Guide 35. The extensive characterization
at very low concentration levels and associated uncertainties will make CRM 459 a valuable
sediment reference material for use in the validation of analytical methods for the
determination of a great number of persistent organic contaminants listed at the Stockholm
Convention as well as other persistent and priority substances (PSs), such as polycyclic
aromatic hydrocarbons included within the environmental monitoring programs.
All available IAEA reference materials may be found in the Reference Material Online
Catalogue, http://nucleus.iaea.org/rpst/ReferenceProducts/ReferenceMaterials.
25
APPENDIX I
RESULTS FOR THE CERTIFIED MEASUREMENTS OF PAHS
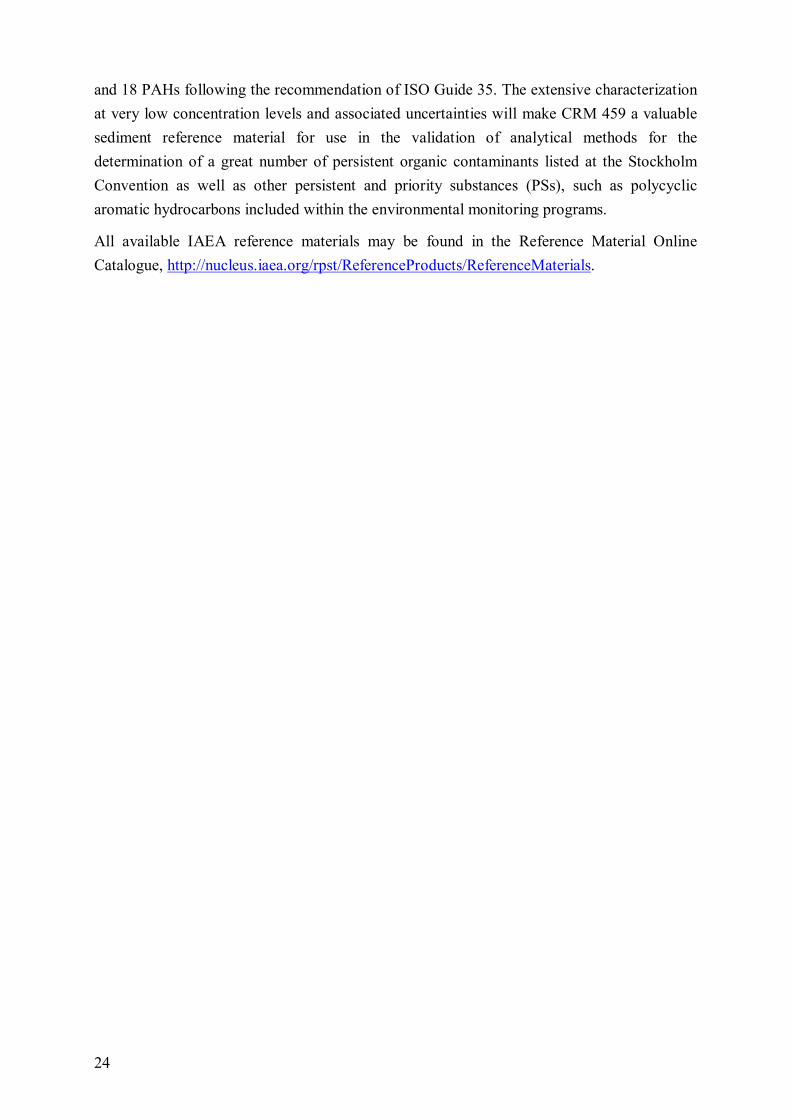
TABLE 18. RESULTS USED FOR THE CALCULATION OF CERTIFIED MASS FRACTION VALUES OF
2-METHYLNAPHTHALENE REPORTED BY PARTICIPANTS (µg kg-1)
LAB Code Mean Uncertainty* Detection limit Detector type: (C)RM used for QC
4 9.25 0.48 1.00 GC-MS SRM1941b
6 11.36 1.11 0.17 GC-MS/MS IAEA-408
8 16.00 0.20 1.12 GC-MS NIST 1944
9 13.73 0.33 <1 GC-MS RM IAEA-159
10 15.06
0.50 GC-MS IMR LRM
11 24.64 1.75 0.60 GC-HRMS
13 15.56 0.51 0.10 GC-MS NIST 1944
16 24.74 1.48 0.02 GC-MS NIST1941B
*Calculated as: 2x =√> where ? is the standard deviation and @ is the number of measurements reported by participants.
FIG. 5. Laboratory results for 2-Methylnaphthalene in IAEA-459 (µg kg-1).
0
5
10
15
20
25
30
4 6 8 9 10 11 13 16
µg
kg
-1
Laboratory Code
2-Methylnaphthalene
26
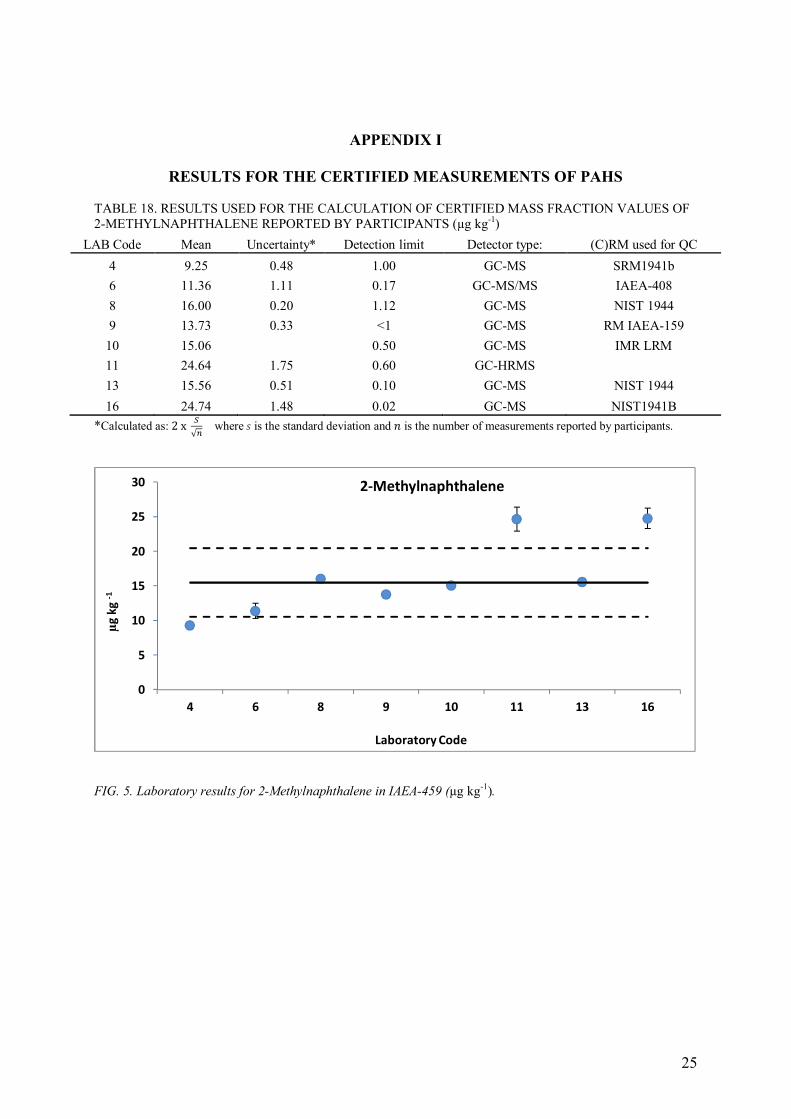
TABLE 19. RESULTS USED FOR THE CALCULATION OF CERTIFIED MASS FRACTION VALUES OF
1-METHYLNAPHTHALENE REPORTED BY PARTICIPANTS (µg kg-1)
LAB Code Mean Uncertainty* Detection limit Detector type: (C)RM use for QC
4 5.09 0.29 1.00 GC-MS SRM1941b
6 4.72 0.55 0.10 GC-MS/MS IAEA-408
8 9.83 0.07 0.89 GC-MS NIST 1944
9 7.42 0.17 <1 GC-MS RM IAEA-159
10 10.08
0.50 GC-MS IMR LRM
11 13.98 1.12 0.60 GC-HRMS
13 9.95 0.38 0.10 GC-MS NIST 1944
16 12.44 0.70 0.02 GC-MS NIST1941B
*Calculated as: 2x =√> where ? is the standard deviation and @ is the number of measurements reported by participants.
FIG. 6. Laboratory results for 1-Methylnaphthalene in IAEA-459 (µg kg-1).
0
2
4
6
8
10
12
14
16
4 6 8 9 10 11 13 16
µg
kg
-1
Laboratory Code
1-Methylnaphthalene
27
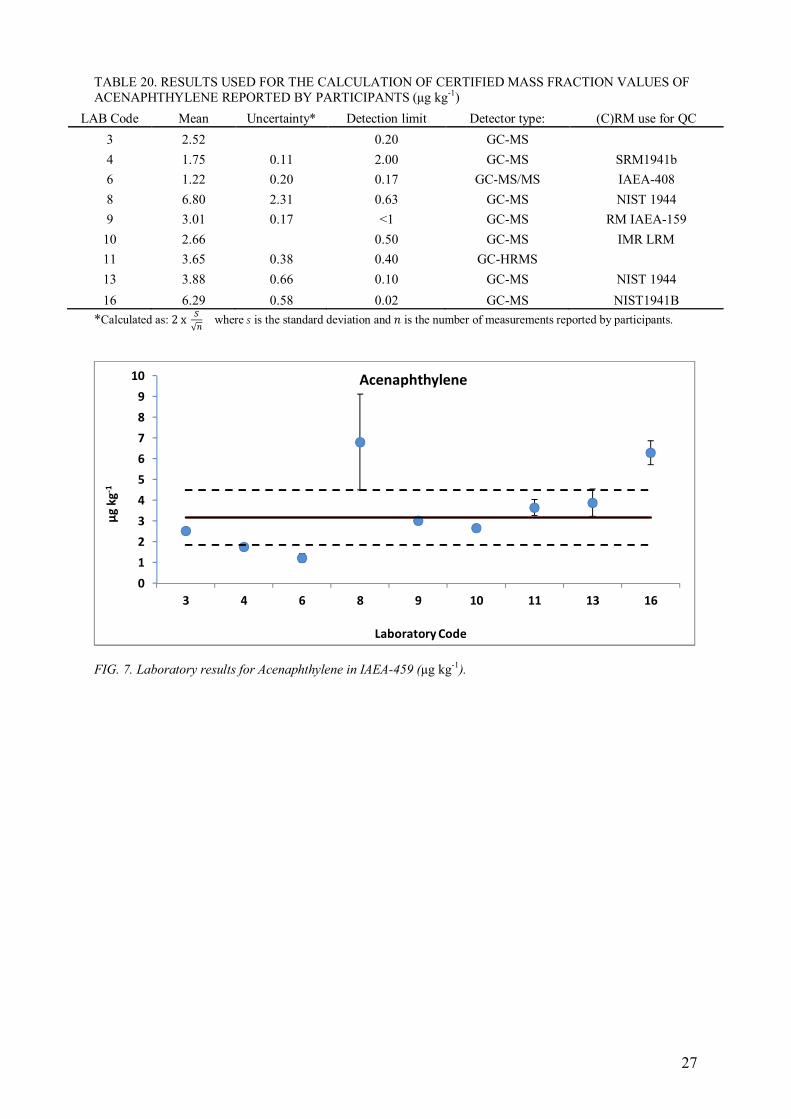
TABLE 20. RESULTS USED FOR THE CALCULATION OF CERTIFIED MASS FRACTION VALUES OF
ACENAPHTHYLENE REPORTED BY PARTICIPANTS (µg kg-1)
LAB Code Mean Uncertainty* Detection limit Detector type: (C)RM use for QC
3 2.52
0.20 GC-MS
4 1.75 0.11 2.00 GC-MS SRM1941b
6 1.22 0.20 0.17 GC-MS/MS IAEA-408
8 6.80 2.31 0.63 GC-MS NIST 1944
9 3.01 0.17 <1 GC-MS RM IAEA-159
10 2.66
0.50 GC-MS IMR LRM
11 3.65 0.38 0.40 GC-HRMS
13 3.88 0.66 0.10 GC-MS NIST 1944
16 6.29 0.58 0.02 GC-MS NIST1941B
*Calculated as: 2x =√> where ? is the standard deviation and @ is the number of measurements reported by participants.
FIG. 7. Laboratory results for Acenaphthylene in IAEA-459 (µg kg-1).
0
1
2
3
4
5
6
7
8
9
10
3 4 6 8 9 10 11 13 16
µg
kg
-1
Laboratory Code
Acenaphthylene
28
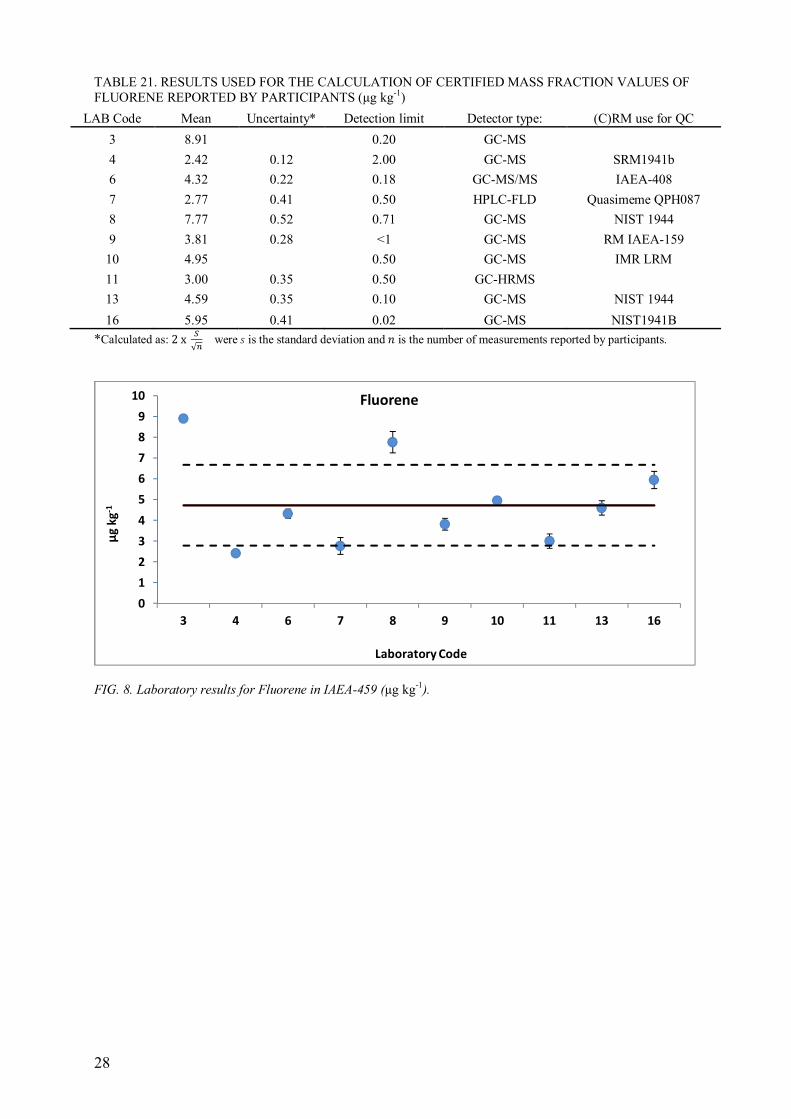
TABLE 21. RESULTS USED FOR THE CALCULATION OF CERTIFIED MASS FRACTION VALUES OF
FLUORENE REPORTED BY PARTICIPANTS (µg kg-1)
LAB Code Mean Uncertainty* Detection limit Detector type: (C)RM use for QC
3 8.91
0.20 GC-MS
4 2.42 0.12 2.00 GC-MS SRM1941b
6 4.32 0.22 0.18 GC-MS/MS IAEA-408
7 2.77 0.41 0.50 HPLC-FLD Quasimeme QPH087
8 7.77 0.52 0.71 GC-MS NIST 1944
9 3.81 0.28 <1 GC-MS RM IAEA-159
10 4.95
0.50 GC-MS IMR LRM
11 3.00 0.35 0.50 GC-HRMS
13 4.59 0.35 0.10 GC-MS NIST 1944
16 5.95 0.41 0.02 GC-MS NIST1941B
*Calculated as: 2x =√> were ? is the standard deviation and @ is the number of measurements reported by participants.
FIG. 8. Laboratory results for Fluorene in IAEA-459 (µg kg-1).
0
1
2
3
4
5
6
7
8
9
10
3 4 6 7 8 9 10 11 13 16
µg
kg
-1
Laboratory Code
Fluorene
29
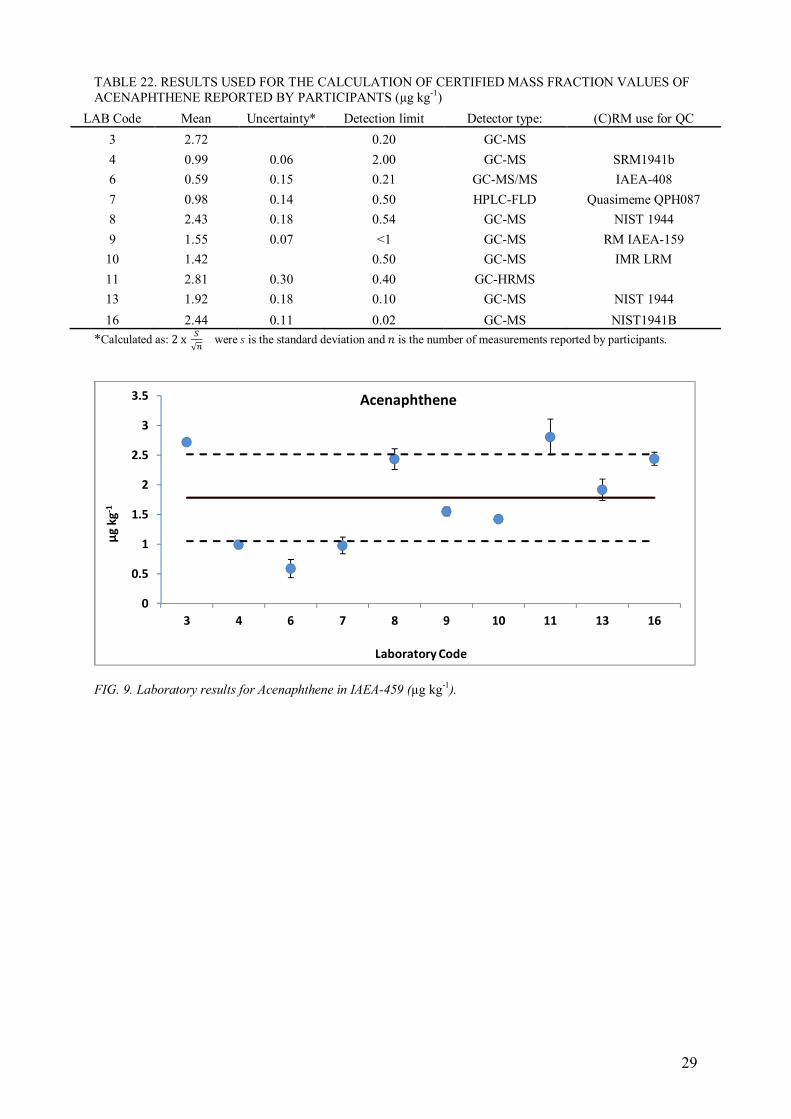
TABLE 22. RESULTS USED FOR THE CALCULATION OF CERTIFIED MASS FRACTION VALUES OF
ACENAPHTHENE REPORTED BY PARTICIPANTS (µg kg-1)
LAB Code Mean Uncertainty* Detection limit Detector type: (C)RM use for QC
3 2.72
0.20 GC-MS
4 0.99 0.06 2.00 GC-MS SRM1941b
6 0.59 0.15 0.21 GC-MS/MS IAEA-408
7 0.98 0.14 0.50 HPLC-FLD Quasimeme QPH087
8 2.43 0.18 0.54 GC-MS NIST 1944
9 1.55 0.07 <1 GC-MS RM IAEA-159
10 1.42
0.50 GC-MS IMR LRM
11 2.81 0.30 0.40 GC-HRMS
13 1.92 0.18 0.10 GC-MS NIST 1944
16 2.44 0.11 0.02 GC-MS NIST1941B
*Calculated as: 2x =√> were ? is the standard deviation and @ is the number of measurements reported by participants.
FIG. 9. Laboratory results for Acenaphthene in IAEA-459 (µg kg-1).
0
0.5
1
1.5
2
2.5
3
3.5
3 4 6 7 8 9 10 11 13 16
µg
kg
-1
Laboratory Code
Acenaphthene
30
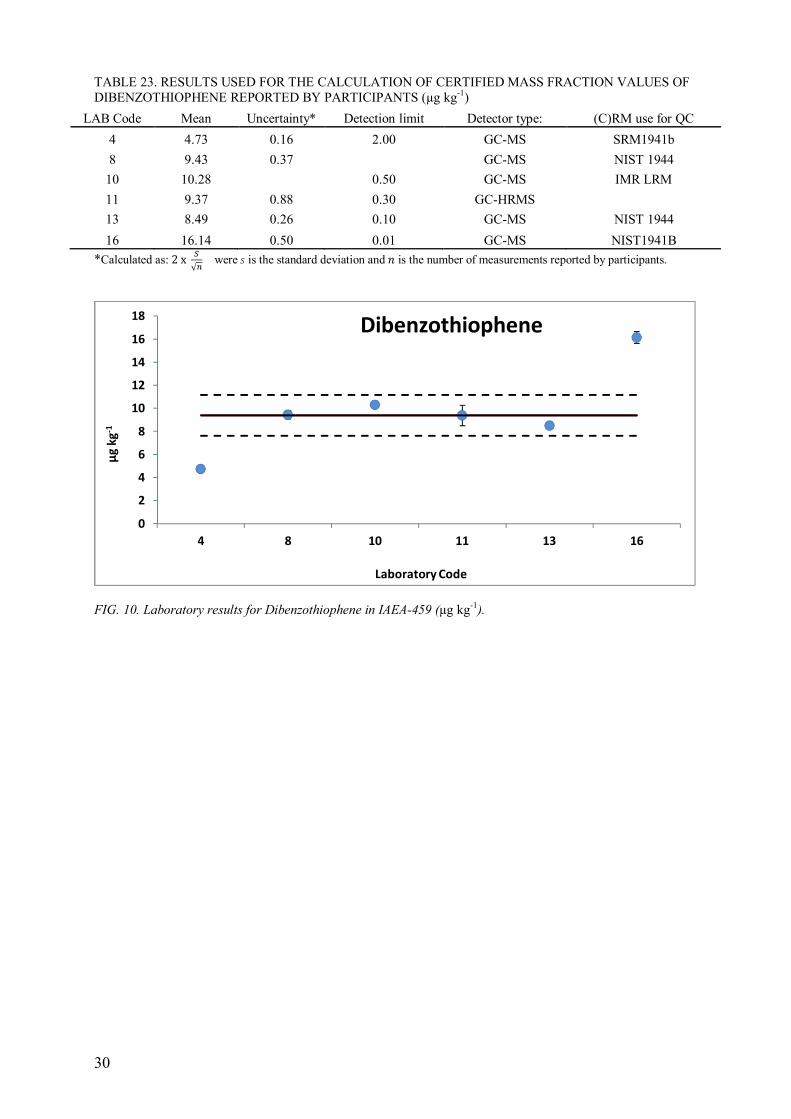
TABLE 23. RESULTS USED FOR THE CALCULATION OF CERTIFIED MASS FRACTION VALUES OF
DIBENZOTHIOPHENE REPORTED BY PARTICIPANTS (µg kg-1)
LAB Code Mean Uncertainty* Detection limit Detector type: (C)RM use for QC
4 4.73 0.16 2.00 GC-MS SRM1941b
8 9.43 0.37
GC-MS NIST 1944
10 10.28
0.50 GC-MS IMR LRM
11 9.37 0.88 0.30 GC-HRMS
13 8.49 0.26 0.10 GC-MS NIST 1944
16 16.14 0.50 0.01 GC-MS NIST1941B
*Calculated as: 2x =√> were ? is the standard deviation and @ is the number of measurements reported by participants.
FIG. 10. Laboratory results for Dibenzothiophene in IAEA-459 (µg kg-1).
0
2
4
6
8
10
12
14
16
18
4 8 10 11 13 16
µg
kg
-1
Laboratory Code
Dibenzothiophene
31
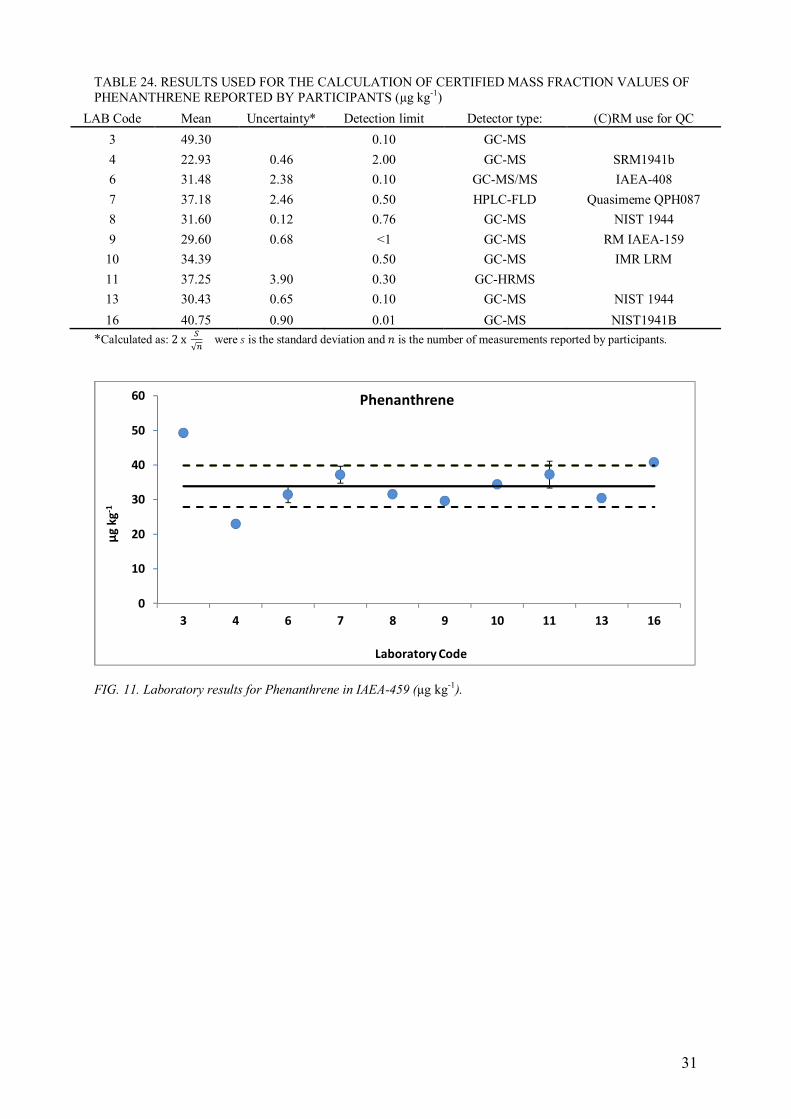
TABLE 24. RESULTS USED FOR THE CALCULATION OF CERTIFIED MASS FRACTION VALUES OF
PHENANTHRENE REPORTED BY PARTICIPANTS (µg kg-1)
LAB Code Mean Uncertainty* Detection limit Detector type: (C)RM use for QC
3 49.30
0.10 GC-MS
4 22.93 0.46 2.00 GC-MS SRM1941b
6 31.48 2.38 0.10 GC-MS/MS IAEA-408
7 37.18 2.46 0.50 HPLC-FLD Quasimeme QPH087
8 31.60 0.12 0.76 GC-MS NIST 1944
9 29.60 0.68 <1 GC-MS RM IAEA-159
10 34.39
0.50 GC-MS IMR LRM
11 37.25 3.90 0.30 GC-HRMS
13 30.43 0.65 0.10 GC-MS NIST 1944
16 40.75 0.90 0.01 GC-MS NIST1941B
*Calculated as: 2x =√> were ? is the standard deviation and @ is the number of measurements reported by participants.
FIG. 11. Laboratory results for Phenanthrene in IAEA-459 (µg kg-1).
0
10
20
30
40
50
60
3 4 6 7 8 9 10 11 13 16
µg
kg
-1
Laboratory Code
Phenanthrene
32
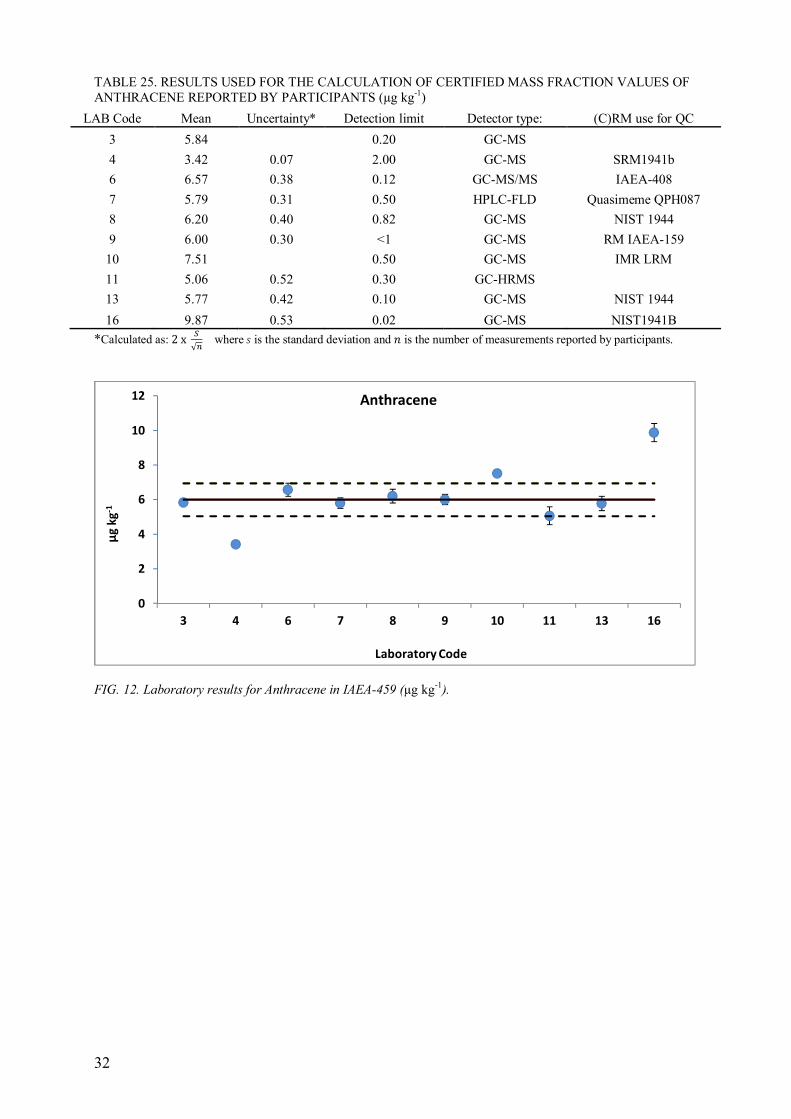
TABLE 25. RESULTS USED FOR THE CALCULATION OF CERTIFIED MASS FRACTION VALUES OF
ANTHRACENE REPORTED BY PARTICIPANTS (µg kg-1)
LAB Code Mean Uncertainty* Detection limit Detector type: (C)RM use for QC
3 5.84
0.20 GC-MS
4 3.42 0.07 2.00 GC-MS SRM1941b
6 6.57 0.38 0.12 GC-MS/MS IAEA-408
7 5.79 0.31 0.50 HPLC-FLD Quasimeme QPH087
8 6.20 0.40 0.82 GC-MS NIST 1944
9 6.00 0.30 <1 GC-MS RM IAEA-159
10 7.51
0.50 GC-MS IMR LRM
11 5.06 0.52 0.30 GC-HRMS
13 5.77 0.42 0.10 GC-MS NIST 1944
16 9.87 0.53 0.02 GC-MS NIST1941B
*Calculated as: 2x =√> where ? is the standard deviation and @ is the number of measurements reported by participants.
FIG. 12. Laboratory results for Anthracene in IAEA-459 (µg kg-1).
0
2
4
6
8
10
12
3 4 6 7 8 9 10 11 13 16
µg
kg
-1
Laboratory Code
Anthracene
33
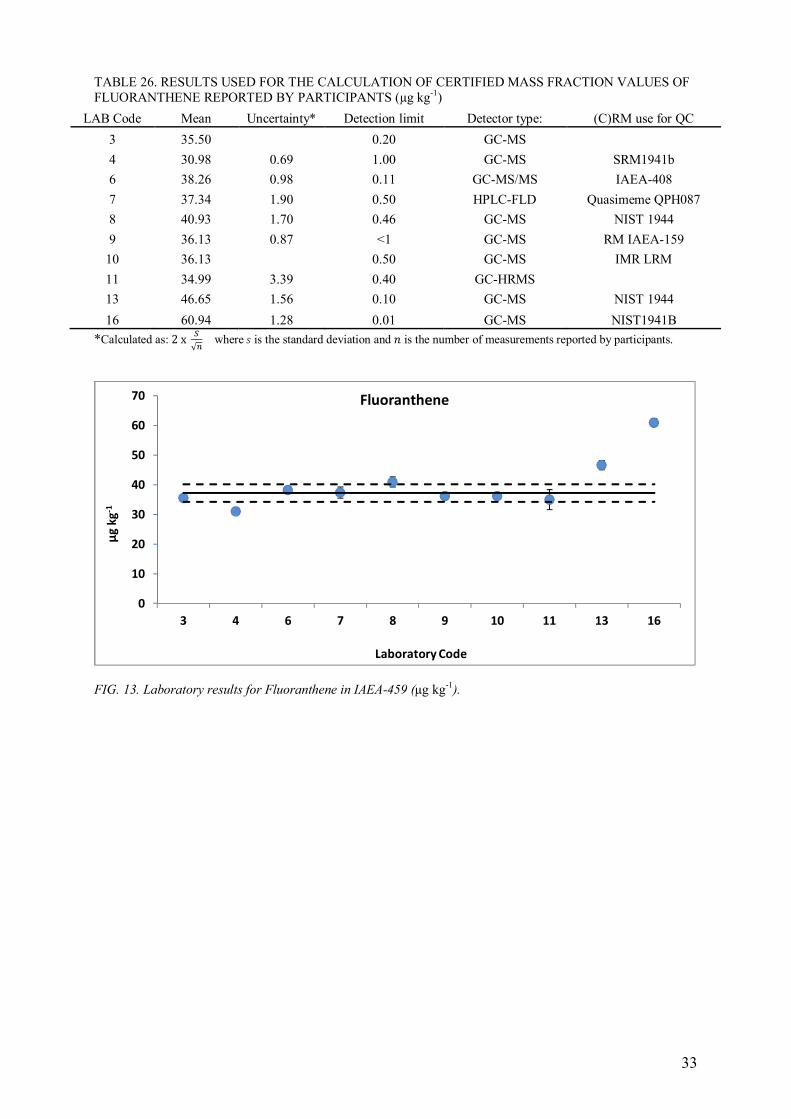
TABLE 26. RESULTS USED FOR THE CALCULATION OF CERTIFIED MASS FRACTION VALUES OF
FLUORANTHENE REPORTED BY PARTICIPANTS (µg kg-1)
LAB Code Mean Uncertainty* Detection limit Detector type: (C)RM use for QC
3 35.50
0.20 GC-MS
4 30.98 0.69 1.00 GC-MS SRM1941b
6 38.26 0.98 0.11 GC-MS/MS IAEA-408
7 37.34 1.90 0.50 HPLC-FLD Quasimeme QPH087
8 40.93 1.70 0.46 GC-MS NIST 1944
9 36.13 0.87 <1 GC-MS RM IAEA-159
10 36.13
0.50 GC-MS IMR LRM
11 34.99 3.39 0.40 GC-HRMS
13 46.65 1.56 0.10 GC-MS NIST 1944
16 60.94 1.28 0.01 GC-MS NIST1941B
*Calculated as: 2x =√> where ? is the standard deviation and @ is the number of measurements reported by participants.
FIG. 13. Laboratory results for Fluoranthene in IAEA-459 (µg kg-1).
0
10
20
30
40
50
60
70
3 4 6 7 8 9 10 11 13 16
µg
kg
-1
Laboratory Code
Fluoranthene
34
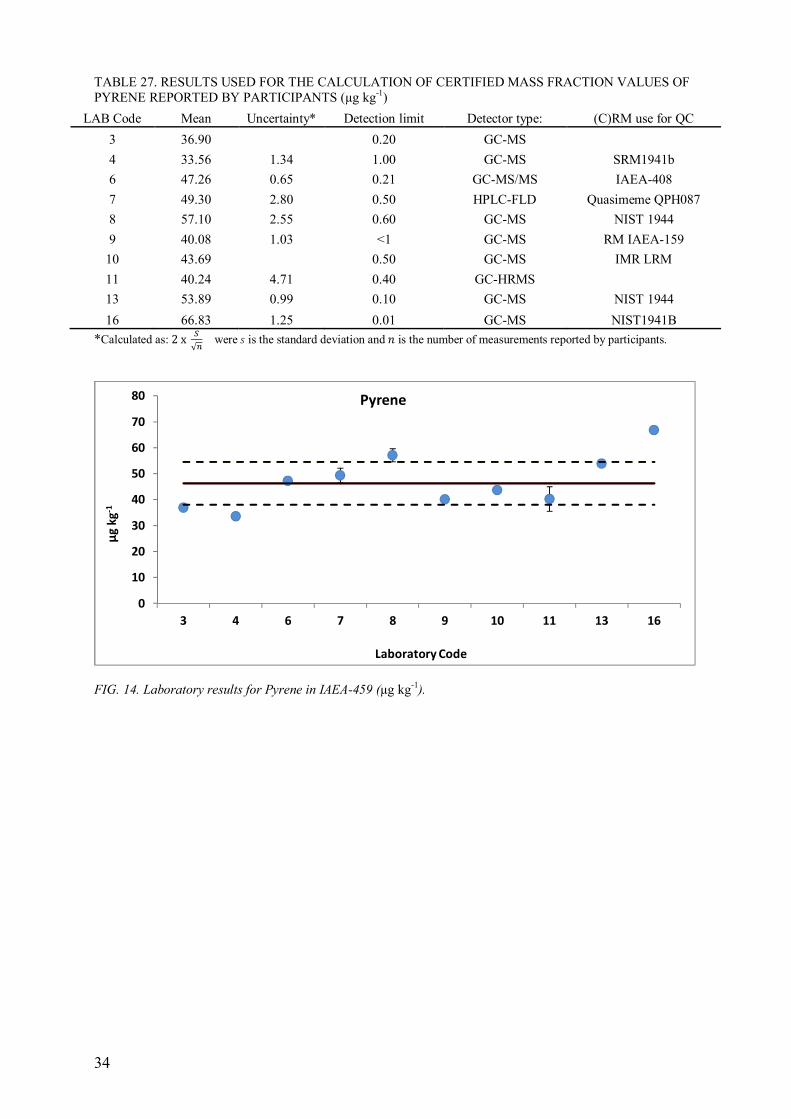
TABLE 27. RESULTS USED FOR THE CALCULATION OF CERTIFIED MASS FRACTION VALUES OF
PYRENE REPORTED BY PARTICIPANTS (µg kg-1)
LAB Code Mean Uncertainty* Detection limit Detector type: (C)RM use for QC
3 36.90
0.20 GC-MS
4 33.56 1.34 1.00 GC-MS SRM1941b
6 47.26 0.65 0.21 GC-MS/MS IAEA-408
7 49.30 2.80 0.50 HPLC-FLD Quasimeme QPH087
8 57.10 2.55 0.60 GC-MS NIST 1944
9 40.08 1.03 <1 GC-MS RM IAEA-159
10 43.69
0.50 GC-MS IMR LRM
11 40.24 4.71 0.40 GC-HRMS
13 53.89 0.99 0.10 GC-MS NIST 1944
16 66.83 1.25 0.01 GC-MS NIST1941B
*Calculated as: 2x =√> were ? is the standard deviation and @ is the number of measurements reported by participants.
FIG. 14. Laboratory results for Pyrene in IAEA-459 (µg kg-1).
0
10
20
30
40
50
60
70
80
3 4 6 7 8 9 10 11 13 16
µg
kg
-1
Laboratory Code
Pyrene
35
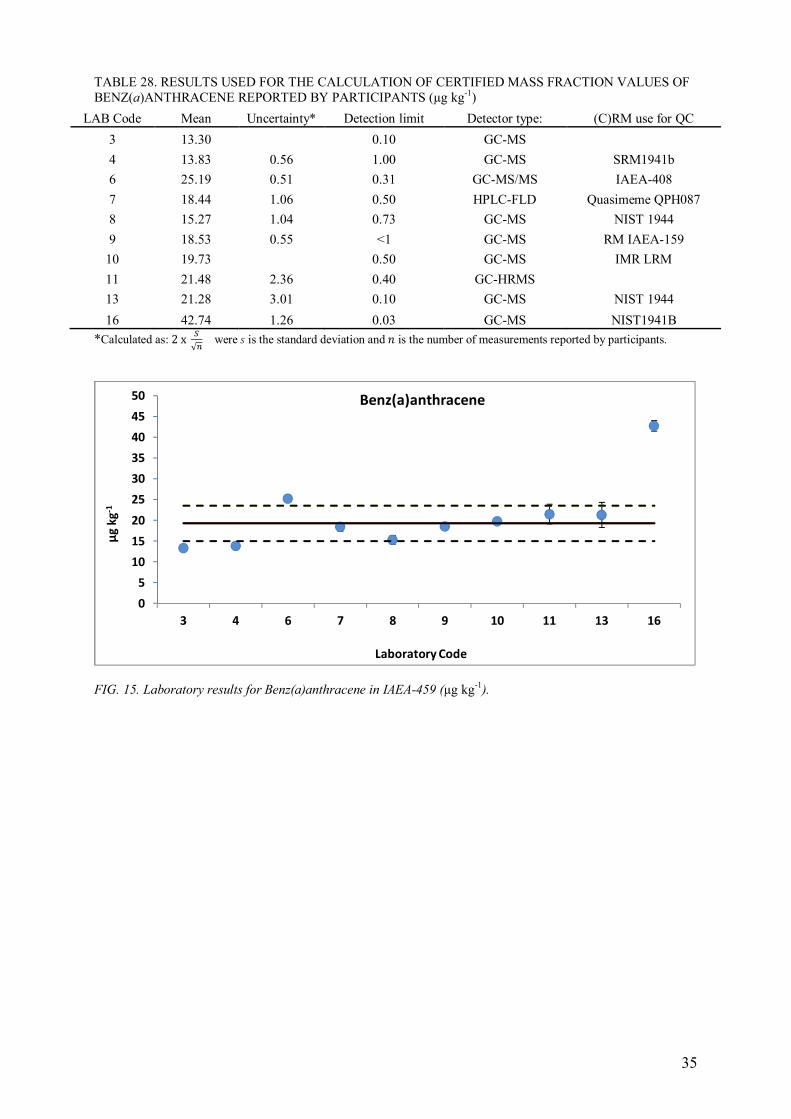
TABLE 28. RESULTS USED FOR THE CALCULATION OF CERTIFIED MASS FRACTION VALUES OF
BENZ(a)ANTHRACENE REPORTED BY PARTICIPANTS (µg kg-1)
LAB Code Mean Uncertainty* Detection limit Detector type: (C)RM use for QC
3 13.30
0.10 GC-MS
4 13.83 0.56 1.00 GC-MS SRM1941b
6 25.19 0.51 0.31 GC-MS/MS IAEA-408
7 18.44 1.06 0.50 HPLC-FLD Quasimeme QPH087
8 15.27 1.04 0.73 GC-MS NIST 1944
9 18.53 0.55 <1 GC-MS RM IAEA-159
10 19.73
0.50 GC-MS IMR LRM
11 21.48 2.36 0.40 GC-HRMS
13 21.28 3.01 0.10 GC-MS NIST 1944
16 42.74 1.26 0.03 GC-MS NIST1941B
*Calculated as: 2x =√> were ? is the standard deviation and @ is the number of measurements reported by participants.
FIG. 15. Laboratory results for Benz(a)anthracene in IAEA-459 (µg kg-1).
0
5
10
15
20
25
30
35
40
45
50
3 4 6 7 8 9 10 11 13 16
µg
kg
-1
Laboratory Code
Benz(a)anthracene
36
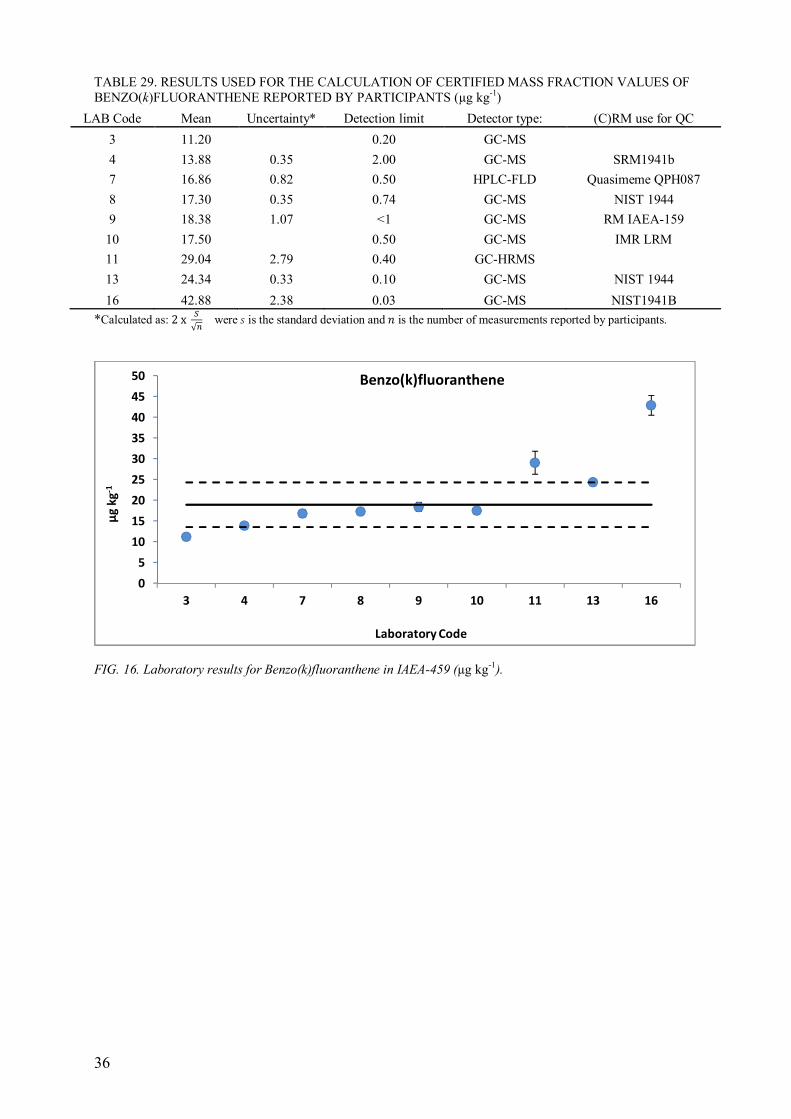
TABLE 29. RESULTS USED FOR THE CALCULATION OF CERTIFIED MASS FRACTION VALUES OF
BENZO(k)FLUORANTHENE REPORTED BY PARTICIPANTS (µg kg-1)
LAB Code Mean Uncertainty* Detection limit Detector type: (C)RM use for QC
3 11.20
0.20 GC-MS
4 13.88 0.35 2.00 GC-MS SRM1941b
7 16.86 0.82 0.50 HPLC-FLD Quasimeme QPH087
8 17.30 0.35 0.74 GC-MS NIST 1944
9 18.38 1.07 <1 GC-MS RM IAEA-159
10 17.50
0.50 GC-MS IMR LRM
11 29.04 2.79 0.40 GC-HRMS
13 24.34 0.33 0.10 GC-MS NIST 1944
16 42.88 2.38 0.03 GC-MS NIST1941B
*Calculated as: 2x =√> were ? is the standard deviation and @ is the number of measurements reported by participants.
FIG. 16. Laboratory results for Benzo(k)fluoranthene in IAEA-459 (µg kg-1).
0
5
10
15
20
25
30
35
40
45
50
3 4 7 8 9 10 11 13 16
µg
kg
-1
Laboratory Code
Benzo(k)fluoranthene
37
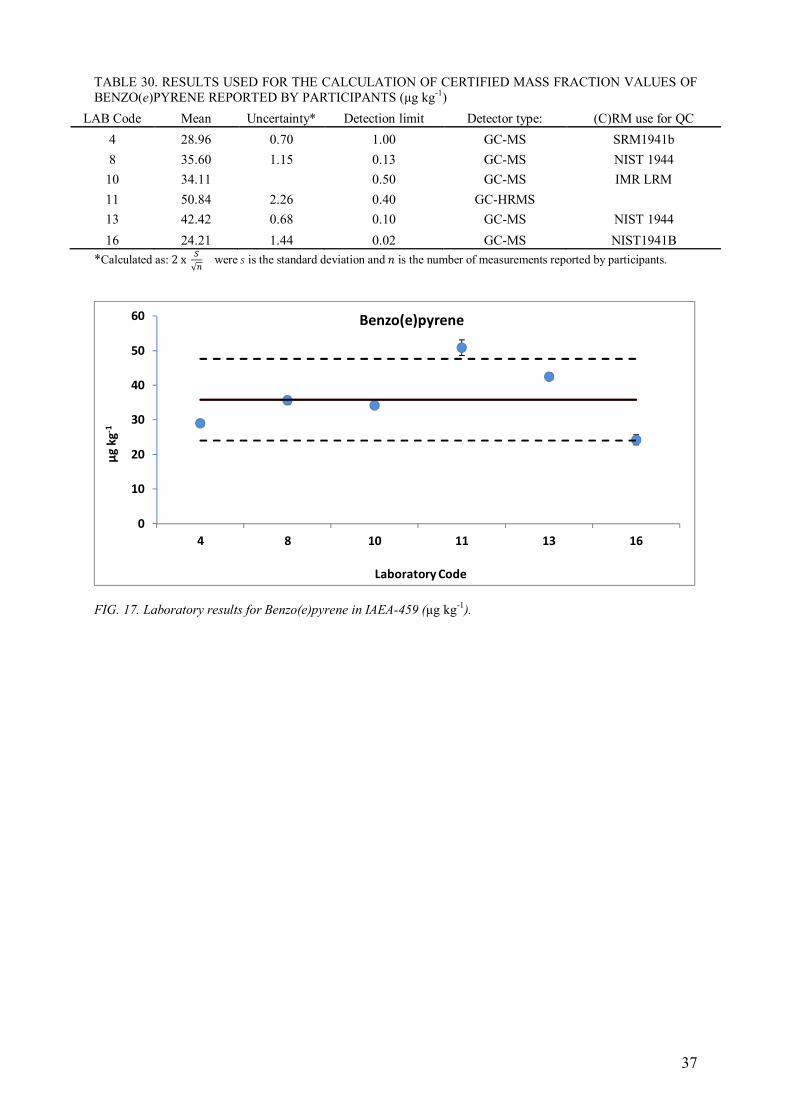
TABLE 30. RESULTS USED FOR THE CALCULATION OF CERTIFIED MASS FRACTION VALUES OF
BENZO(e)PYRENE REPORTED BY PARTICIPANTS (µg kg-1)
LAB Code Mean Uncertainty* Detection limit Detector type: (C)RM use for QC
4 28.96 0.70 1.00 GC-MS SRM1941b
8 35.60 1.15 0.13 GC-MS NIST 1944
10 34.11
0.50 GC-MS IMR LRM
11 50.84 2.26 0.40 GC-HRMS
13 42.42 0.68 0.10 GC-MS NIST 1944
16 24.21 1.44 0.02 GC-MS NIST1941B
*Calculated as: 2x =√> were ? is the standard deviation and @ is the number of measurements reported by participants.
FIG. 17. Laboratory results for Benzo(e)pyrene in IAEA-459 (µg kg-1).
0
10
20
30
40
50
60
4 8 10 11 13 16
µg
kg
-1
Laboratory Code
Benzo(e)pyrene
38
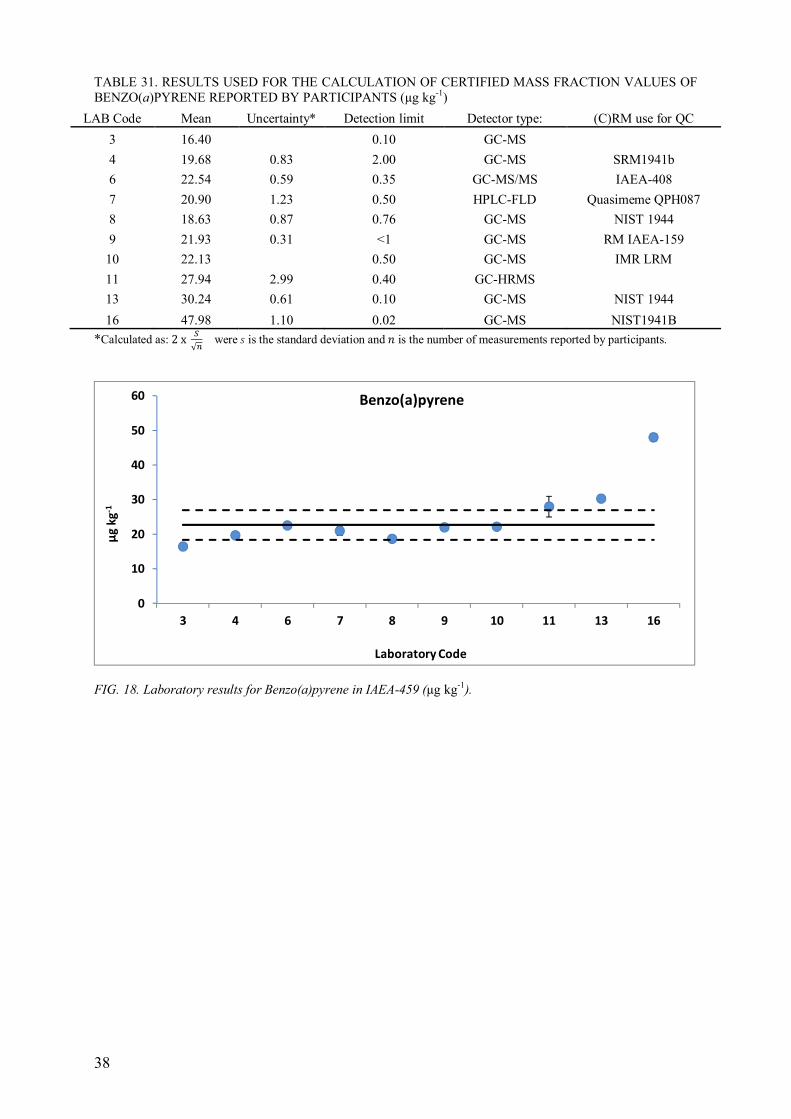
TABLE 31. RESULTS USED FOR THE CALCULATION OF CERTIFIED MASS FRACTION VALUES OF
BENZO(a)PYRENE REPORTED BY PARTICIPANTS (µg kg-1)
LAB Code Mean Uncertainty* Detection limit Detector type: (C)RM use for QC
3 16.40
0.10 GC-MS
4 19.68 0.83 2.00 GC-MS SRM1941b
6 22.54 0.59 0.35 GC-MS/MS IAEA-408
7 20.90 1.23 0.50 HPLC-FLD Quasimeme QPH087
8 18.63 0.87 0.76 GC-MS NIST 1944
9 21.93 0.31 <1 GC-MS RM IAEA-159
10 22.13
0.50 GC-MS IMR LRM
11 27.94 2.99 0.40 GC-HRMS
13 30.24 0.61 0.10 GC-MS NIST 1944
16 47.98 1.10 0.02 GC-MS NIST1941B
*Calculated as: 2x =√> were ? is the standard deviation and @ is the number of measurements reported by participants.
FIG. 18. Laboratory results for Benzo(a)pyrene in IAEA-459 (µg kg-1).
0
10
20
30
40
50
60
3 4 6 7 8 9 10 11 13 16
µg
kg
-1
Laboratory Code
Benzo(a)pyrene
39
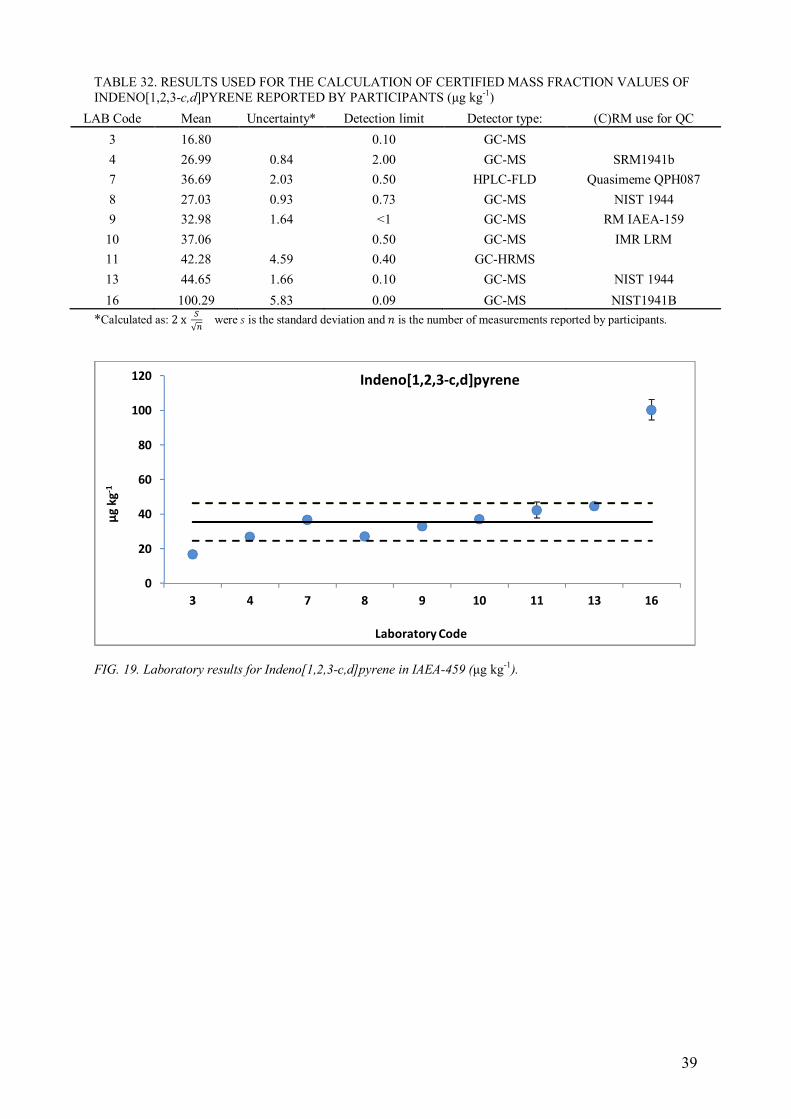
TABLE 32. RESULTS USED FOR THE CALCULATION OF CERTIFIED MASS FRACTION VALUES OF
INDENO[1,2,3-c,d]PYRENE REPORTED BY PARTICIPANTS (µg kg-1)
LAB Code Mean Uncertainty* Detection limit Detector type: (C)RM use for QC
3 16.80
0.10 GC-MS
4 26.99 0.84 2.00 GC-MS SRM1941b
7 36.69 2.03 0.50 HPLC-FLD Quasimeme QPH087
8 27.03 0.93 0.73 GC-MS NIST 1944
9 32.98 1.64 <1 GC-MS RM IAEA-159
10 37.06
0.50 GC-MS IMR LRM
11 42.28 4.59 0.40 GC-HRMS
13 44.65 1.66 0.10 GC-MS NIST 1944
16 100.29 5.83 0.09 GC-MS NIST1941B
*Calculated as: 2x =√> were ? is the standard deviation and @ is the number of measurements reported by participants.
FIG. 19. Laboratory results for Indeno[1,2,3-c,d]pyrene in IAEA-459 (µg kg-1).
0
20
40
60
80
100
120
3 4 7 8 9 10 11 13 16
µg
kg
-1
Laboratory Code
Indeno[1,2,3-c,d]pyrene
40
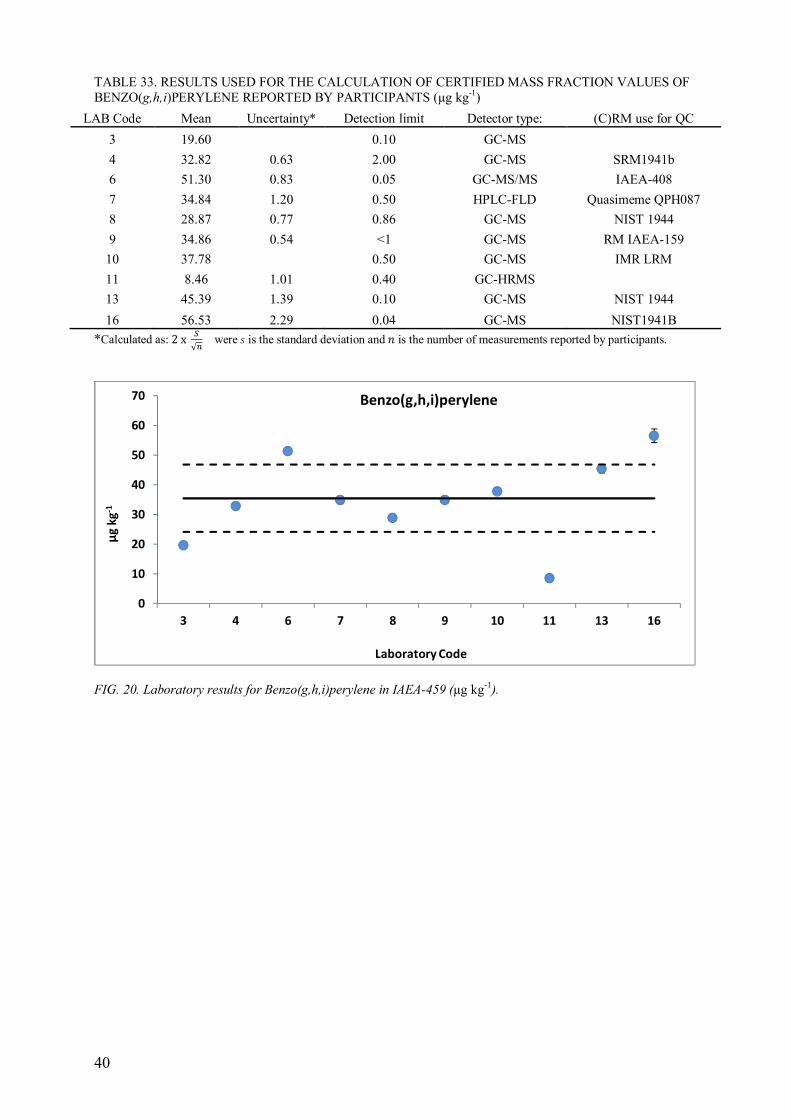
TABLE 33. RESULTS USED FOR THE CALCULATION OF CERTIFIED MASS FRACTION VALUES OF
BENZO(g,h,i)PERYLENE REPORTED BY PARTICIPANTS (µg kg-1)
LAB Code Mean Uncertainty* Detection limit Detector type: (C)RM use for QC
3 19.60
0.10 GC-MS
4 32.82 0.63 2.00 GC-MS SRM1941b
6 51.30 0.83 0.05 GC-MS/MS IAEA-408
7 34.84 1.20 0.50 HPLC-FLD Quasimeme QPH087
8 28.87 0.77 0.86 GC-MS NIST 1944
9 34.86 0.54 <1 GC-MS RM IAEA-159
10 37.78
0.50 GC-MS IMR LRM
11 8.46 1.01 0.40 GC-HRMS
13 45.39 1.39 0.10 GC-MS NIST 1944
16 56.53 2.29 0.04 GC-MS NIST1941B
*Calculated as: 2x =√> were ? is the standard deviation and @ is the number of measurements reported by participants.
FIG. 20. Laboratory results for Benzo(g,h,i)perylene in IAEA-459 (µg kg-1).
0
10
20
30
40
50
60
70
3 4 6 7 8 9 10 11 13 16
µg
kg
-1
Laboratory Code
Benzo(g,h,i)perylene
41
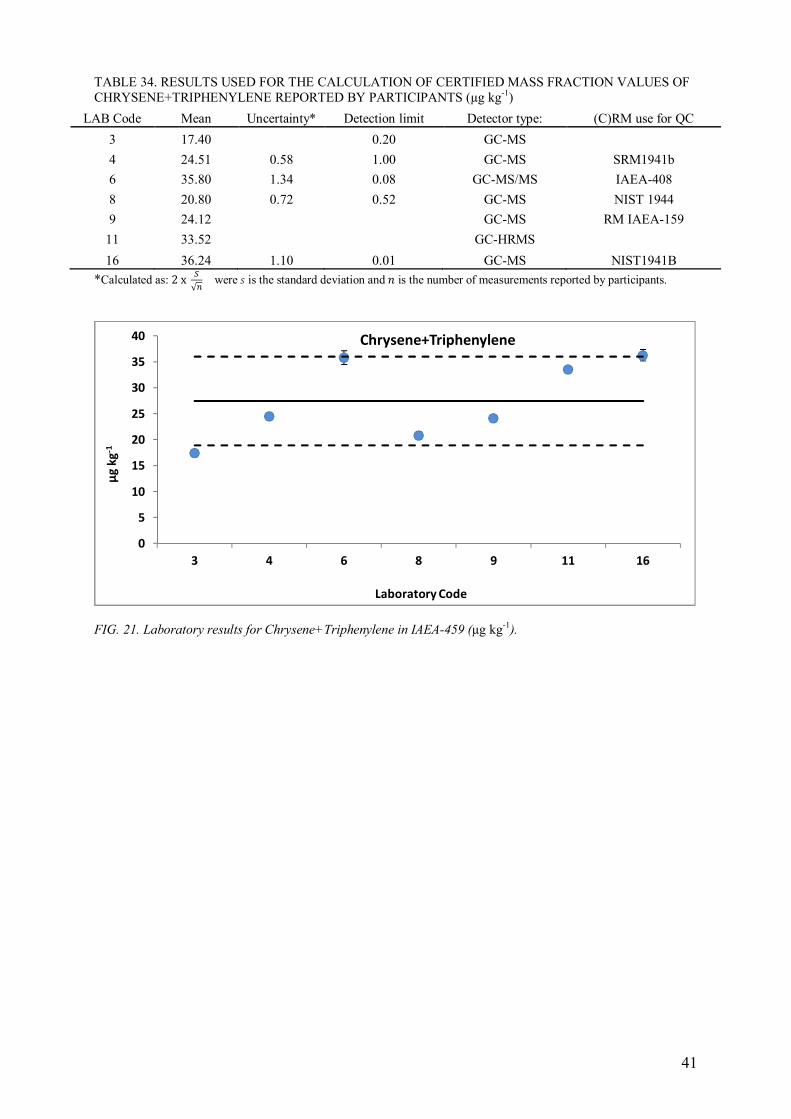
TABLE 34. RESULTS USED FOR THE CALCULATION OF CERTIFIED MASS FRACTION VALUES OF
CHRYSENE+TRIPHENYLENE REPORTED BY PARTICIPANTS (µg kg-1)
LAB Code Mean Uncertainty* Detection limit Detector type: (C)RM use for QC
3 17.40
0.20 GC-MS
4 24.51 0.58 1.00 GC-MS SRM1941b
6 35.80 1.34 0.08 GC-MS/MS IAEA-408
8 20.80 0.72 0.52 GC-MS NIST 1944
9 24.12
GC-MS RM IAEA-159
11 33.52
GC-HRMS
16 36.24 1.10 0.01 GC-MS NIST1941B
*Calculated as: 2x =√> were ? is the standard deviation and @ is the number of measurements reported by participants.
FIG. 21. Laboratory results for Chrysene+Triphenylene in IAEA-459 (µg kg-1).
0
5
10
15
20
25
30
35
40
3 4 6 8 9 11 16
µg
kg
-1
Laboratory Code
Chrysene+Triphenylene
42
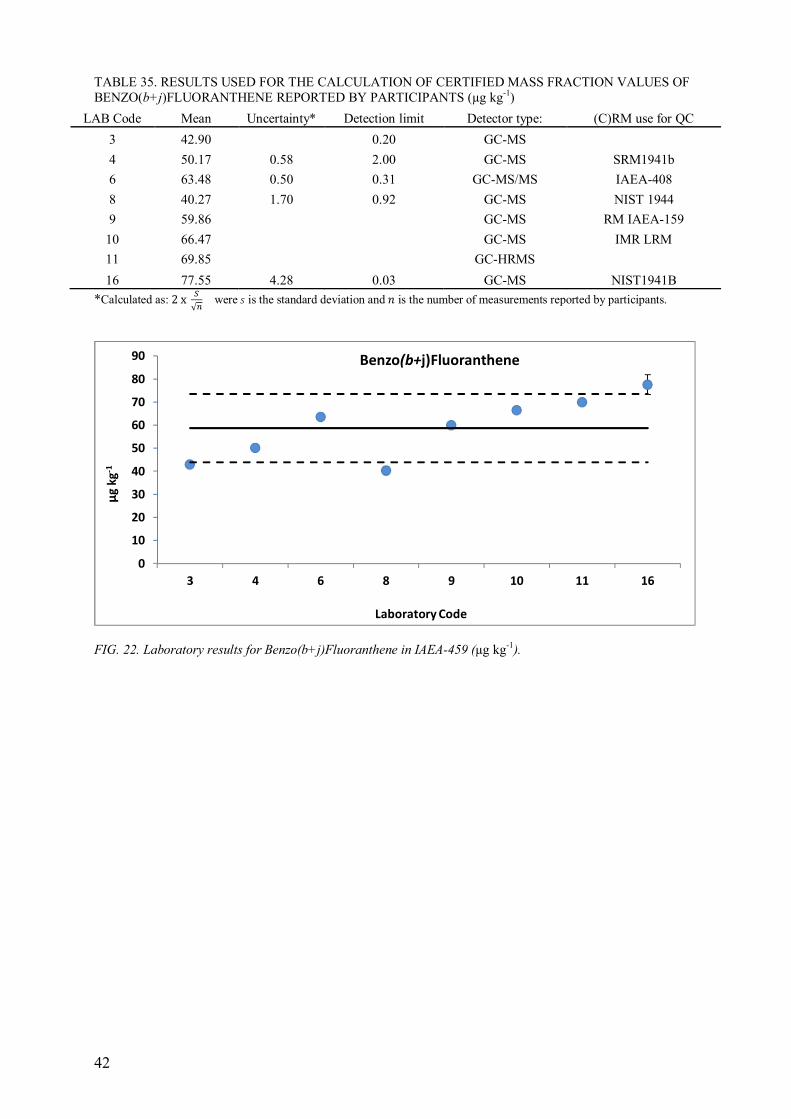
TABLE 35. RESULTS USED FOR THE CALCULATION OF CERTIFIED MASS FRACTION VALUES OF
BENZO(b+j)FLUORANTHENE REPORTED BY PARTICIPANTS (µg kg-1)
LAB Code Mean Uncertainty* Detection limit Detector type: (C)RM use for QC
3 42.90
0.20 GC-MS
4 50.17 0.58 2.00 GC-MS SRM1941b
6 63.48 0.50 0.31 GC-MS/MS IAEA-408
8 40.27 1.70 0.92 GC-MS NIST 1944
9 59.86
GC-MS RM IAEA-159
10 66.47
GC-MS IMR LRM
11 69.85
GC-HRMS
16 77.55 4.28 0.03 GC-MS NIST1941B
*Calculated as: 2x =√> were ? is the standard deviation and @ is the number of measurements reported by participants.
FIG. 22. Laboratory results for Benzo(b+j)Fluoranthene in IAEA-459 (µg kg-1).
0
10
20
30
40
50
60
70
80
90
3 4 6 8 9 10 11 16
µg
kg
-1
Laboratory Code
Benzo(b+j)Fluoranthene
43
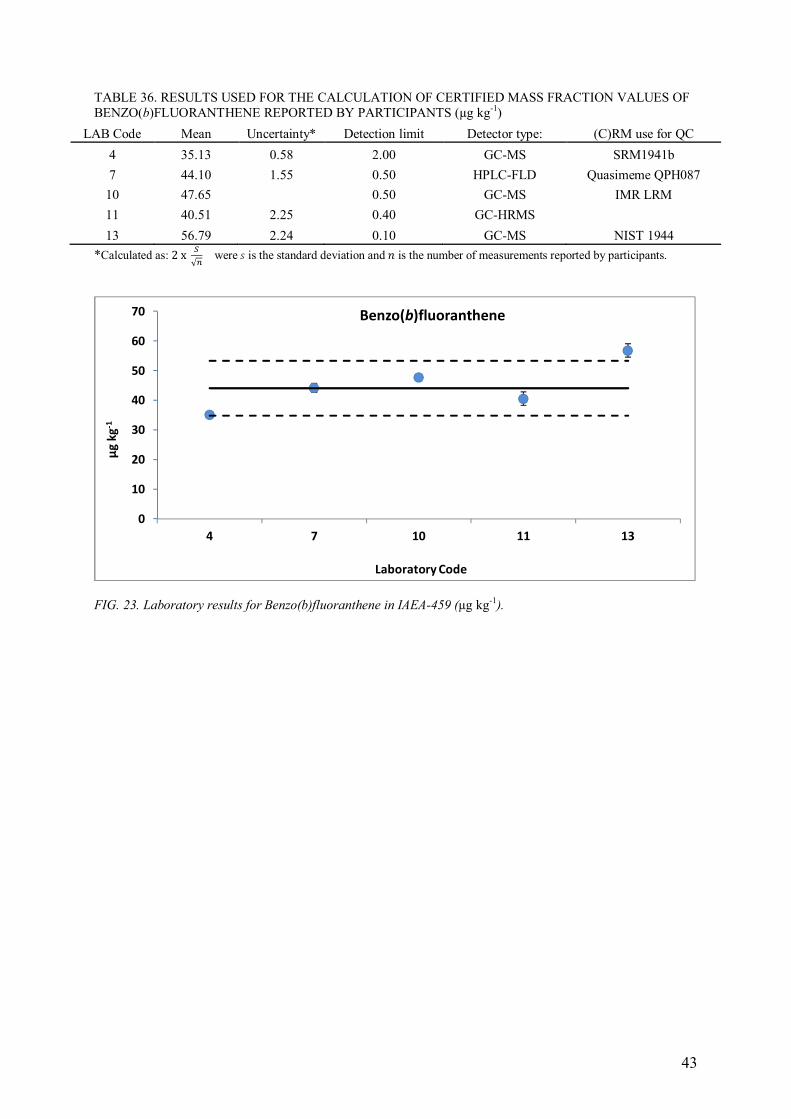
TABLE 36. RESULTS USED FOR THE CALCULATION OF CERTIFIED MASS FRACTION VALUES OF
BENZO(b)FLUORANTHENE REPORTED BY PARTICIPANTS (µg kg-1)
LAB Code Mean Uncertainty* Detection limit Detector type: (C)RM use for QC
4 35.13 0.58 2.00 GC-MS SRM1941b
7 44.10 1.55 0.50 HPLC-FLD Quasimeme QPH087
10 47.65
0.50 GC-MS IMR LRM
11 40.51 2.25 0.40 GC-HRMS
13 56.79 2.24 0.10 GC-MS NIST 1944
*Calculated as: 2x =√> were ? is the standard deviation and @ is the number of measurements reported by participants.
FIG. 23. Laboratory results for Benzo(b)fluoranthene in IAEA-459 (µg kg-1).
0
10
20
30
40
50
60
70
4 7 10 11 13
µg
kg
-1
Laboratory Code
Benzo(b)fluoranthene
44
APPENDIX II
RESULTS FOR THE CERTIFIED MEASUREMENTS OF POLYCHORINATED
BIPHENYLS (PCBs)
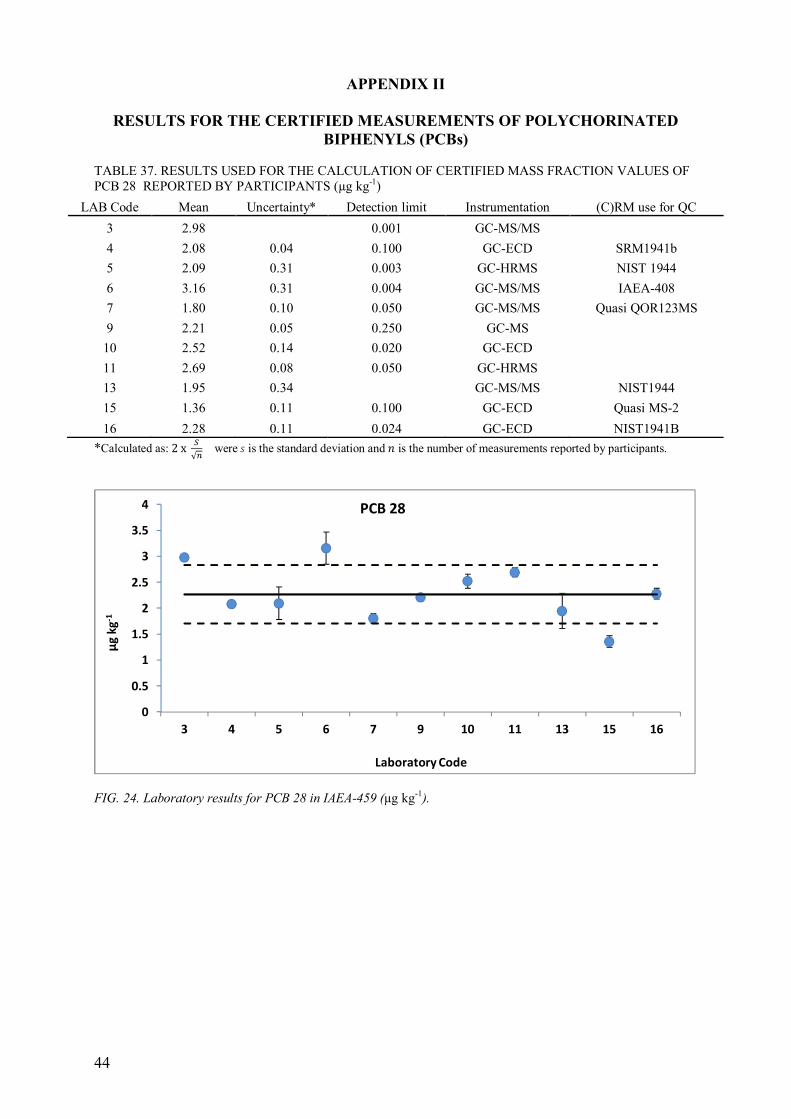
TABLE 37. RESULTS USED FOR THE CALCULATION OF CERTIFIED MASS FRACTION VALUES OF
PCB 28 REPORTED BY PARTICIPANTS (µg kg-1)
LAB Code Mean Uncertainty* Detection limit Instrumentation (C)RM use for QC
3 2.98
0.001 GC-MS/MS
4 2.08 0.04 0.100 GC-ECD SRM1941b
5 2.09 0.31 0.003 GC-HRMS NIST 1944
6 3.16 0.31 0.004 GC-MS/MS IAEA-408
7 1.80 0.10 0.050 GC-MS/MS Quasi QOR123MS
9 2.21 0.05 0.250 GC-MS
10 2.52 0.14 0.020 GC-ECD
11 2.69 0.08 0.050 GC-HRMS
13 1.95 0.34
GC-MS/MS NIST1944
15 1.36 0.11 0.100 GC-ECD Quasi MS-2
16 2.28 0.11 0.024 GC-ECD NIST1941B
*Calculated as: 2x =√> were ? is the standard deviation and @ is the number of measurements reported by participants.
FIG. 24. Laboratory results for PCB 28 in IAEA-459 (µg kg-1).
0
0.5
1
1.5
2
2.5
3
3.5
4
3 4 5 6 7 9 10 11 13 15 16
µg
kg
-1
Laboratory Code
PCB 28
45
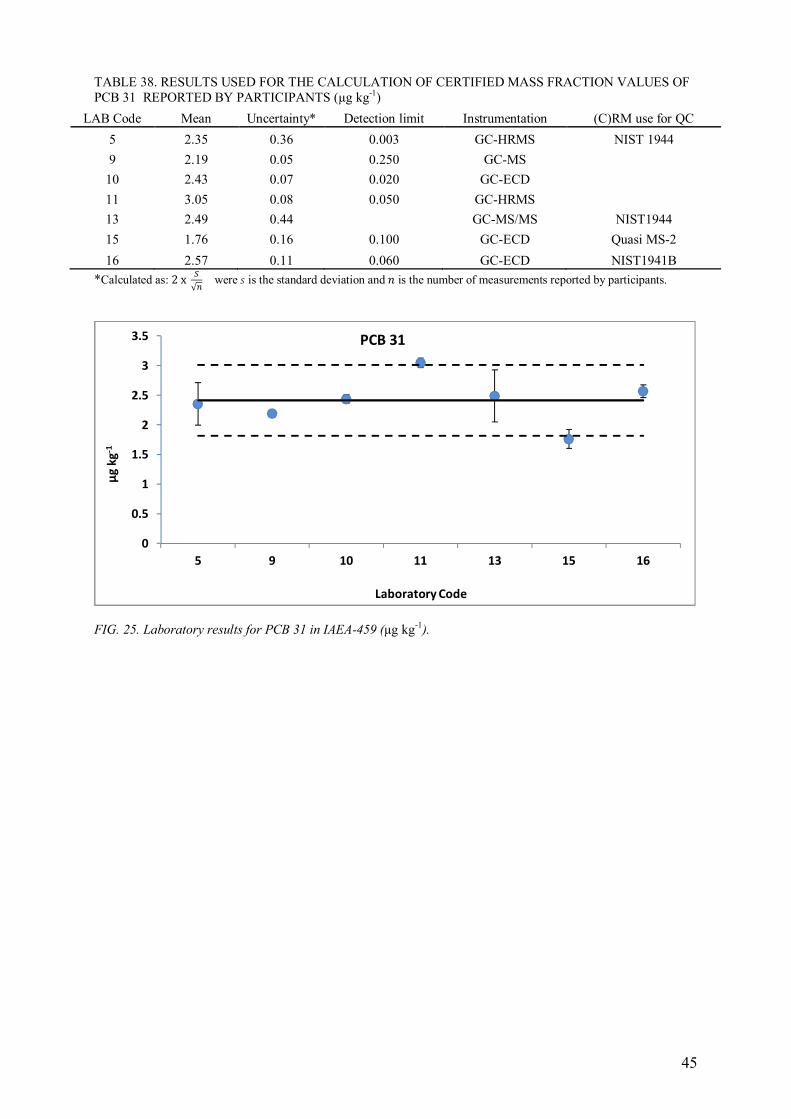
TABLE 38. RESULTS USED FOR THE CALCULATION OF CERTIFIED MASS FRACTION VALUES OF
PCB 31 REPORTED BY PARTICIPANTS (µg kg-1)
LAB Code Mean Uncertainty* Detection limit Instrumentation (C)RM use for QC
5 2.35 0.36 0.003 GC-HRMS NIST 1944
9 2.19 0.05 0.250 GC-MS
10 2.43 0.07 0.020 GC-ECD
11 3.05 0.08 0.050 GC-HRMS
13 2.49 0.44
GC-MS/MS NIST1944
15 1.76 0.16 0.100 GC-ECD Quasi MS-2
16 2.57 0.11 0.060 GC-ECD NIST1941B
*Calculated as: 2x =√> were ? is the standard deviation and @ is the number of measurements reported by participants.
FIG. 25. Laboratory results for PCB 31 in IAEA-459 (µg kg-1).
0
0.5
1
1.5
2
2.5
3
3.5
5 9 10 11 13 15 16
µg
kg
-1
Laboratory Code
PCB 31
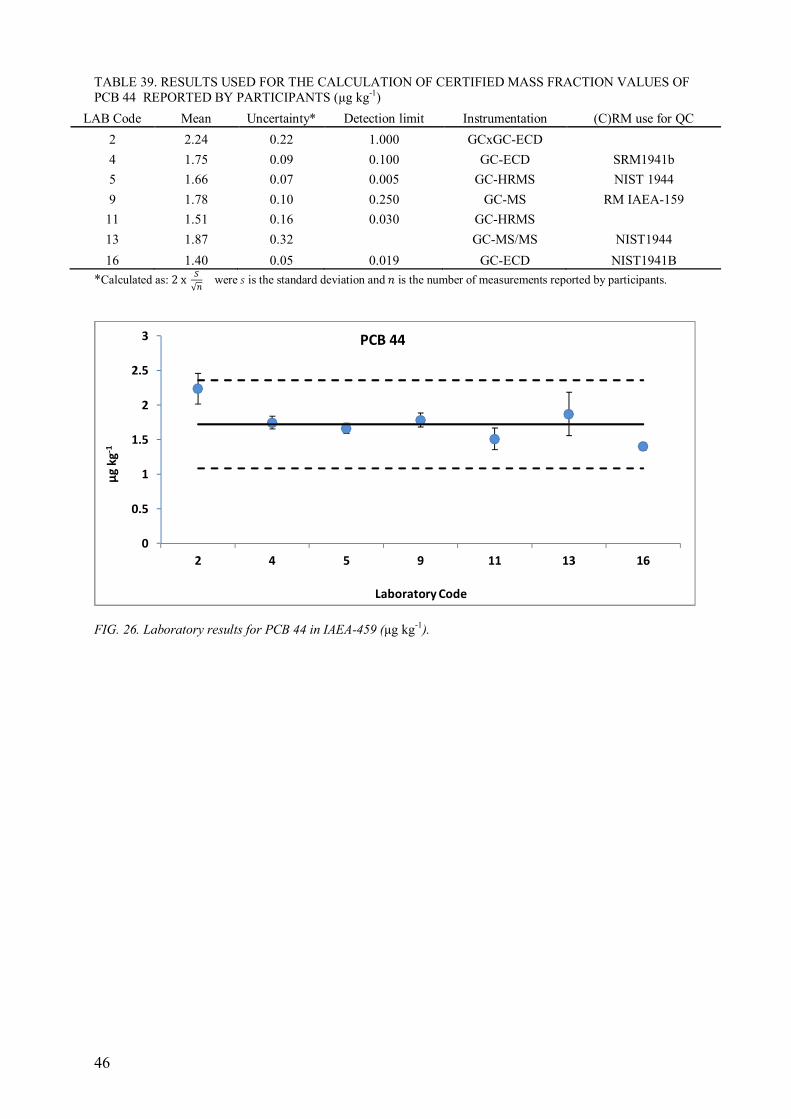
46
TABLE 39. RESULTS USED FOR THE CALCULATION OF CERTIFIED MASS FRACTION VALUES OF
PCB 44 REPORTED BY PARTICIPANTS (µg kg-1)
LAB Code Mean Uncertainty* Detection limit Instrumentation (C)RM use for QC
2 2.24 0.22 1.000 GCxGC-ECD
4 1.75 0.09 0.100 GC-ECD SRM1941b
5 1.66 0.07 0.005 GC-HRMS NIST 1944
9 1.78 0.10 0.250 GC-MS RM IAEA-159
11 1.51 0.16 0.030 GC-HRMS
13 1.87 0.32
GC-MS/MS NIST1944
16 1.40 0.05 0.019 GC-ECD NIST1941B
*Calculated as: 2x =√> were ? is the standard deviation and @ is the number of measurements reported by participants.
FIG. 26. Laboratory results for PCB 44 in IAEA-459 (µg kg-1).
0
0.5
1
1.5
2
2.5
3
2 4 5 9 11 13 16
µg
kg
-1
Laboratory Code
PCB 44
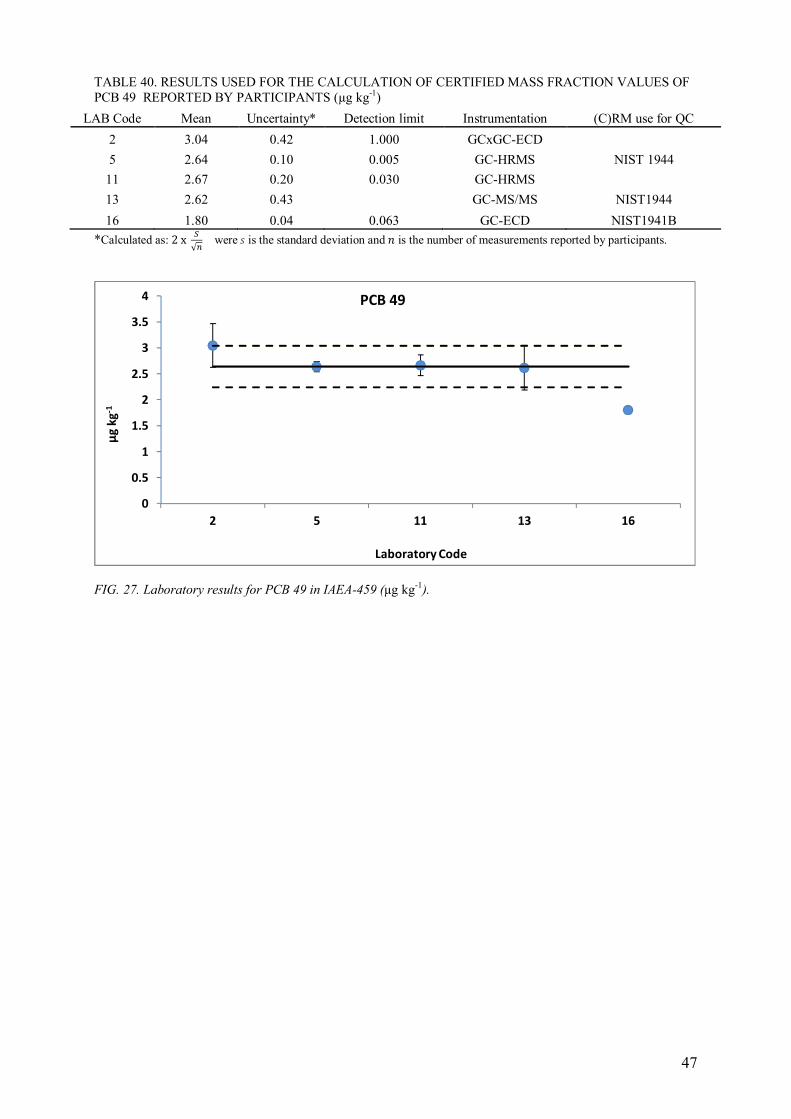
47
TABLE 40. RESULTS USED FOR THE CALCULATION OF CERTIFIED MASS FRACTION VALUES OF
PCB 49 REPORTED BY PARTICIPANTS (µg kg-1)
LAB Code Mean Uncertainty* Detection limit Instrumentation (C)RM use for QC
2 3.04 0.42 1.000 GCxGC-ECD
5 2.64 0.10 0.005 GC-HRMS NIST 1944
11 2.67 0.20 0.030 GC-HRMS
13 2.62 0.43
GC-MS/MS NIST1944
16 1.80 0.04 0.063 GC-ECD NIST1941B
*Calculated as: 2x =√> were ? is the standard deviation and @ is the number of measurements reported by participants.
FIG. 27. Laboratory results for PCB 49 in IAEA-459 (µg kg-1).
0
0.5
1
1.5
2
2.5
3
3.5
4
2 5 11 13 16
µg
kg
-1
Laboratory Code
PCB 49
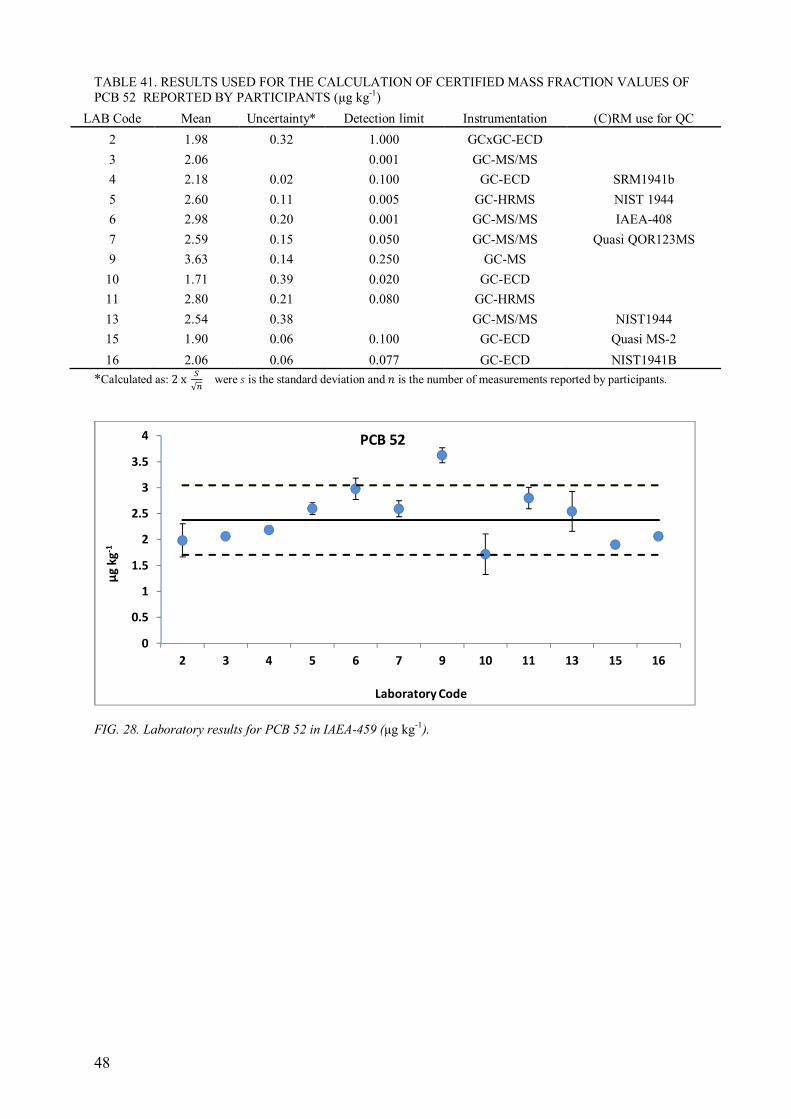
48
TABLE 41. RESULTS USED FOR THE CALCULATION OF CERTIFIED MASS FRACTION VALUES OF
PCB 52 REPORTED BY PARTICIPANTS (µg kg-1)
LAB Code Mean Uncertainty* Detection limit Instrumentation (C)RM use for QC
2 1.98 0.32 1.000 GCxGC-ECD
3 2.06
0.001 GC-MS/MS
4 2.18 0.02 0.100 GC-ECD SRM1941b
5 2.60 0.11 0.005 GC-HRMS NIST 1944
6 2.98 0.20 0.001 GC-MS/MS IAEA-408
7 2.59 0.15 0.050 GC-MS/MS Quasi QOR123MS
9 3.63 0.14 0.250 GC-MS
10 1.71 0.39 0.020 GC-ECD
11 2.80 0.21 0.080 GC-HRMS
13 2.54 0.38
GC-MS/MS NIST1944
15 1.90 0.06 0.100 GC-ECD Quasi MS-2
16 2.06 0.06 0.077 GC-ECD NIST1941B
*Calculated as: 2x =√> were ? is the standard deviation and @ is the number of measurements reported by participants.
FIG. 28. Laboratory results for PCB 52 in IAEA-459 (µg kg-1).
0
0.5
1
1.5
2
2.5
3
3.5
4
2 3 4 5 6 7 9 10 11 13 15 16
µg
kg
-1
Laboratory Code
PCB 52
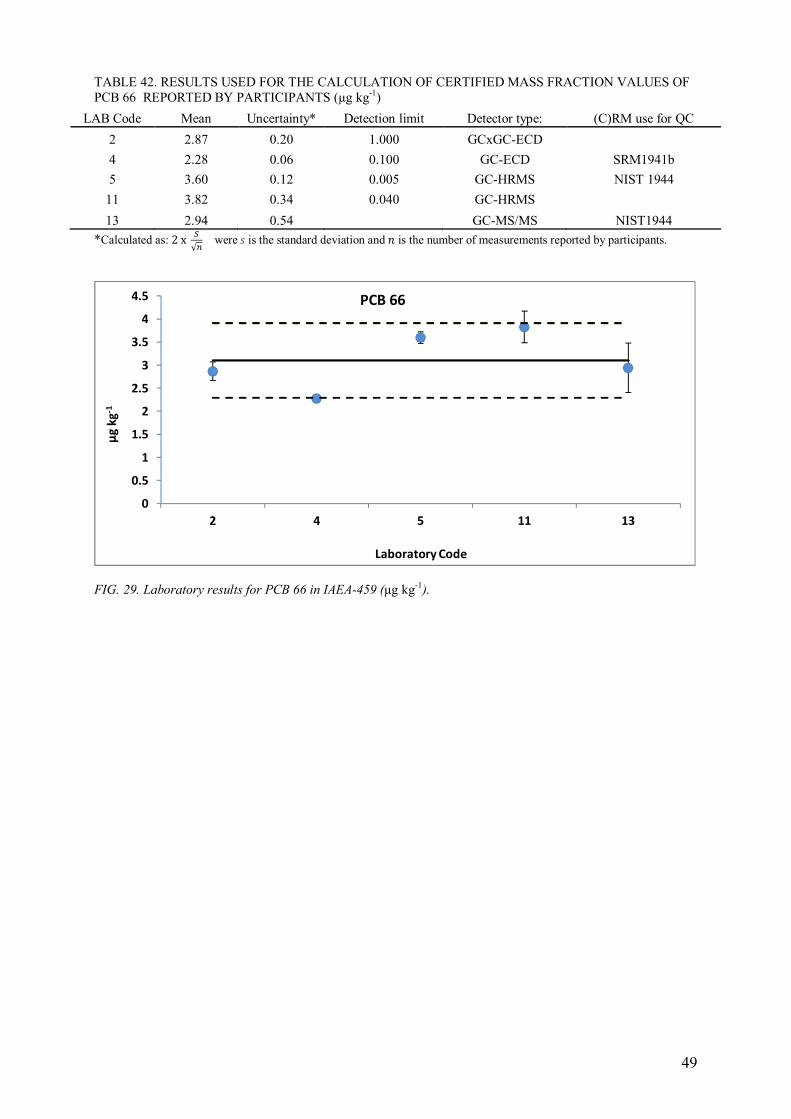
49
TABLE 42. RESULTS USED FOR THE CALCULATION OF CERTIFIED MASS FRACTION VALUES OF
PCB 66 REPORTED BY PARTICIPANTS (µg kg-1)
LAB Code Mean Uncertainty* Detection limit Detector type: (C)RM use for QC
2 2.87 0.20 1.000 GCxGC-ECD
4 2.28 0.06 0.100 GC-ECD SRM1941b
5 3.60 0.12 0.005 GC-HRMS NIST 1944
11 3.82 0.34 0.040 GC-HRMS
13 2.94 0.54 GC-MS/MS NIST1944
*Calculated as: 2x =√> were ? is the standard deviation and @ is the number of measurements reported by participants.
FIG. 29. Laboratory results for PCB 66 in IAEA-459 (µg kg-1).
0
0.5
1
1.5
2
2.5
3
3.5
4
4.5
2 4 5 11 13
µg
kg
-1
Laboratory Code
PCB 66
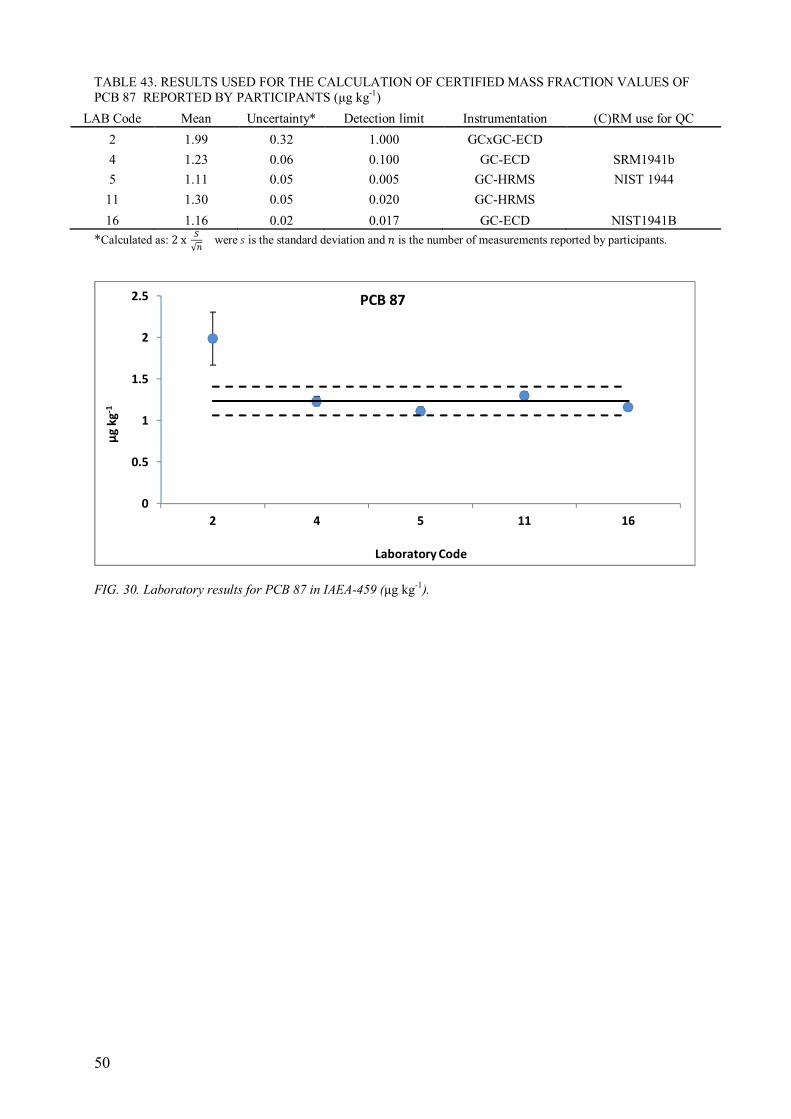
50
TABLE 43. RESULTS USED FOR THE CALCULATION OF CERTIFIED MASS FRACTION VALUES OF
PCB 87 REPORTED BY PARTICIPANTS (µg kg-1)
LAB Code Mean Uncertainty* Detection limit Instrumentation (C)RM use for QC
2 1.99 0.32 1.000 GCxGC-ECD
4 1.23 0.06 0.100 GC-ECD SRM1941b
5 1.11 0.05 0.005 GC-HRMS NIST 1944
11 1.30 0.05 0.020 GC-HRMS
16 1.16 0.02 0.017 GC-ECD NIST1941B
*Calculated as: 2x =√> were ? is the standard deviation and @ is the number of measurements reported by participants.
FIG. 30. Laboratory results for PCB 87 in IAEA-459 (µg kg-1).
0
0.5
1
1.5
2
2.5
2 4 5 11 16
µg
kg
-1
Laboratory Code
PCB 87
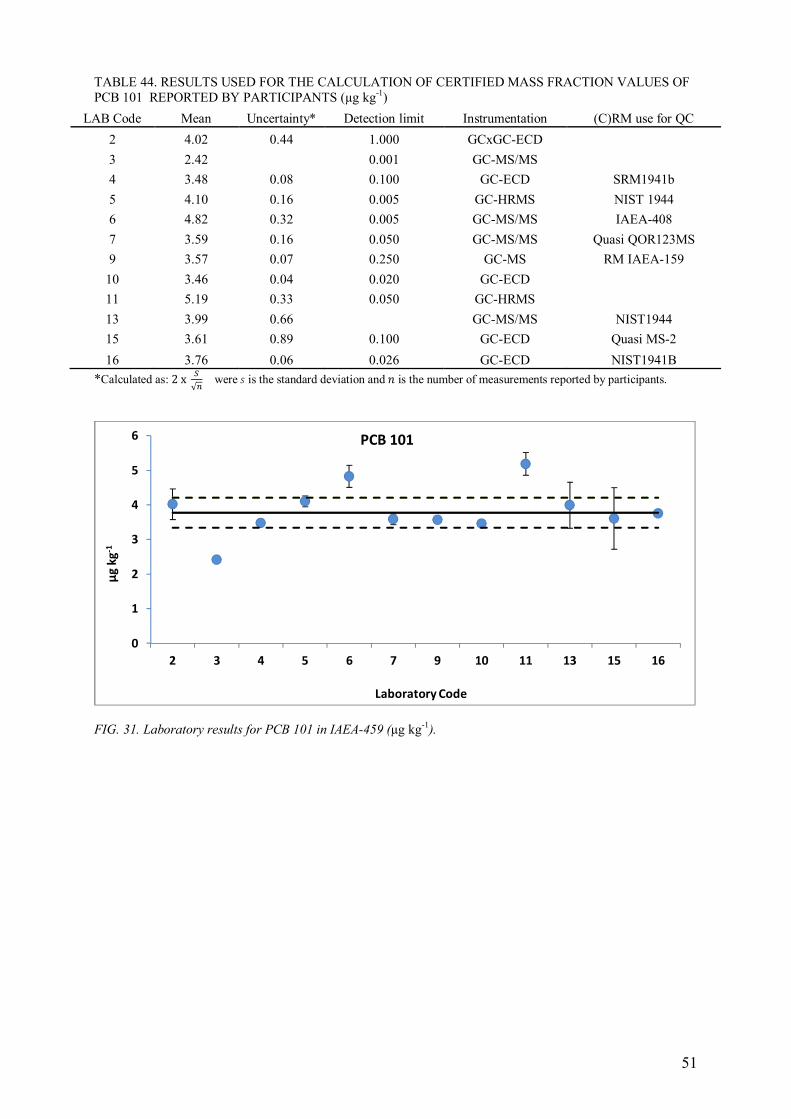
51
TABLE 44. RESULTS USED FOR THE CALCULATION OF CERTIFIED MASS FRACTION VALUES OF
PCB 101 REPORTED BY PARTICIPANTS (µg kg-1)
LAB Code Mean Uncertainty* Detection limit Instrumentation (C)RM use for QC
2 4.02 0.44 1.000 GCxGC-ECD
3 2.42
0.001 GC-MS/MS
4 3.48 0.08 0.100 GC-ECD SRM1941b
5 4.10 0.16 0.005 GC-HRMS NIST 1944
6 4.82 0.32 0.005 GC-MS/MS IAEA-408
7 3.59 0.16 0.050 GC-MS/MS Quasi QOR123MS
9 3.57 0.07 0.250 GC-MS RM IAEA-159
10 3.46 0.04 0.020 GC-ECD
11 5.19 0.33 0.050 GC-HRMS
13 3.99 0.66
GC-MS/MS NIST1944
15 3.61 0.89 0.100 GC-ECD Quasi MS-2
16 3.76 0.06 0.026 GC-ECD NIST1941B
*Calculated as: 2x =√> were ? is the standard deviation and @ is the number of measurements reported by participants.
FIG. 31. Laboratory results for PCB 101 in IAEA-459 (µg kg-1).
0
1
2
3
4
5
6
2 3 4 5 6 7 9 10 11 13 15 16
µg
kg
-1
Laboratory Code
PCB 101
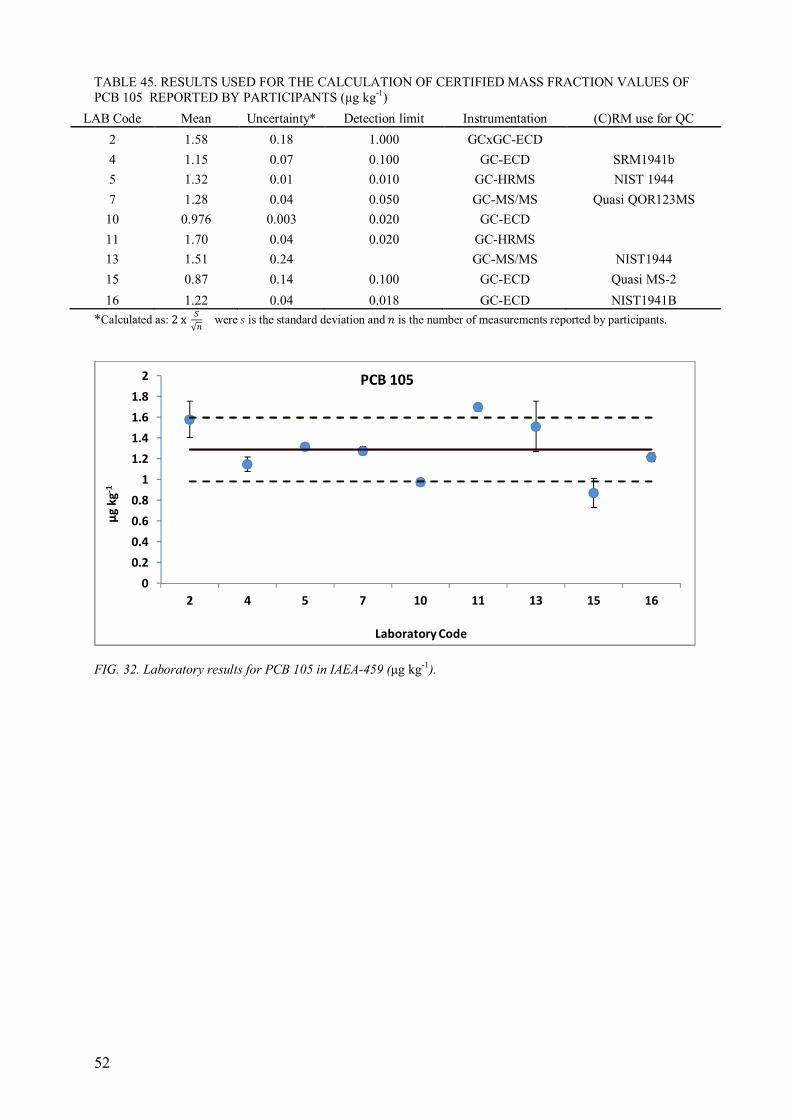
52
TABLE 45. RESULTS USED FOR THE CALCULATION OF CERTIFIED MASS FRACTION VALUES OF
PCB 105 REPORTED BY PARTICIPANTS (µg kg-1)
LAB Code Mean Uncertainty* Detection limit Instrumentation (C)RM use for QC
2 1.58 0.18 1.000 GCxGC-ECD
4 1.15 0.07 0.100 GC-ECD SRM1941b
5 1.32 0.01 0.010 GC-HRMS NIST 1944
7 1.28 0.04 0.050 GC-MS/MS Quasi QOR123MS
10 0.976 0.003 0.020 GC-ECD
11 1.70 0.04 0.020 GC-HRMS
13 1.51 0.24
GC-MS/MS NIST1944
15 0.87 0.14 0.100 GC-ECD Quasi MS-2
16 1.22 0.04 0.018 GC-ECD NIST1941B
*Calculated as: 2x =√> were ? is the standard deviation and @ is the number of measurements reported by participants.
FIG. 32. Laboratory results for PCB 105 in IAEA-459 (µg kg-1).
0
0.2
0.4
0.6
0.8
1
1.2
1.4
1.6
1.8
2
2 4 5 7 10 11 13 15 16
µg
kg
-1
Laboratory Code
PCB 105
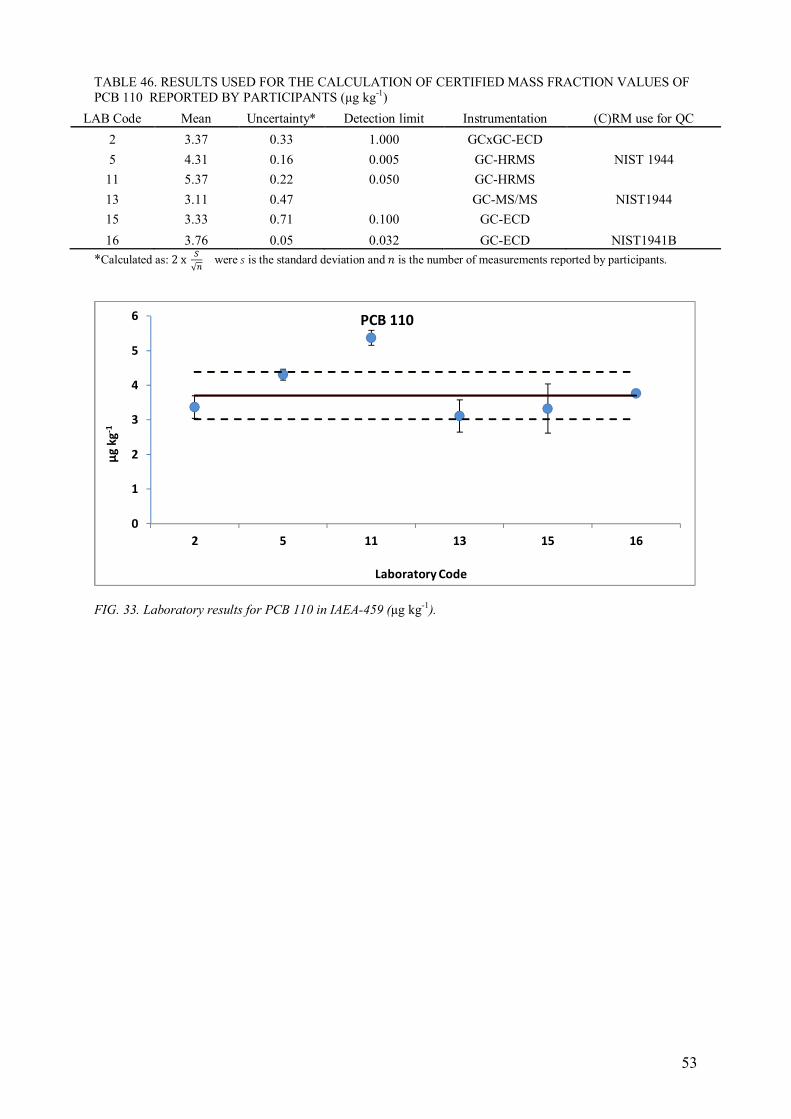
53
TABLE 46. RESULTS USED FOR THE CALCULATION OF CERTIFIED MASS FRACTION VALUES OF
PCB 110 REPORTED BY PARTICIPANTS (µg kg-1)
LAB Code Mean Uncertainty* Detection limit Instrumentation (C)RM use for QC
2 3.37 0.33 1.000 GCxGC-ECD
5 4.31 0.16 0.005 GC-HRMS NIST 1944
11 5.37 0.22 0.050 GC-HRMS
13 3.11 0.47
GC-MS/MS NIST1944
15 3.33 0.71 0.100 GC-ECD
16 3.76 0.05 0.032 GC-ECD NIST1941B
*Calculated as: 2x =√> were ? is the standard deviation and @ is the number of measurements reported by participants.
FIG. 33. Laboratory results for PCB 110 in IAEA-459 (µg kg-1).
0
1
2
3
4
5
6
2 5 11 13 15 16
µg
kg
-1
Laboratory Code
PCB 110
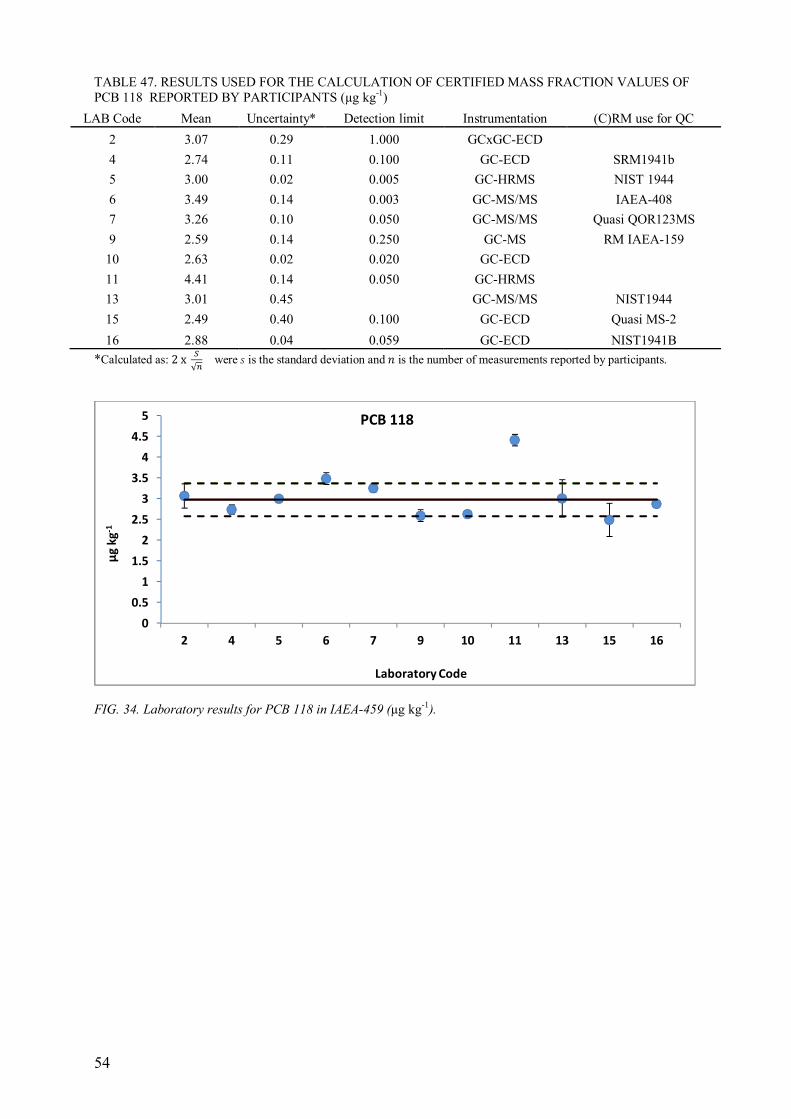
54
TABLE 47. RESULTS USED FOR THE CALCULATION OF CERTIFIED MASS FRACTION VALUES OF
PCB 118 REPORTED BY PARTICIPANTS (µg kg-1)
LAB Code Mean Uncertainty* Detection limit Instrumentation (C)RM use for QC
2 3.07 0.29 1.000 GCxGC-ECD
4 2.74 0.11 0.100 GC-ECD SRM1941b
5 3.00 0.02 0.005 GC-HRMS NIST 1944
6 3.49 0.14 0.003 GC-MS/MS IAEA-408
7 3.26 0.10 0.050 GC-MS/MS Quasi QOR123MS
9 2.59 0.14 0.250 GC-MS RM IAEA-159
10 2.63 0.02 0.020 GC-ECD
11 4.41 0.14 0.050 GC-HRMS
13 3.01 0.45
GC-MS/MS NIST1944
15 2.49 0.40 0.100 GC-ECD Quasi MS-2
16 2.88 0.04 0.059 GC-ECD NIST1941B
*Calculated as: 2x =√> were ? is the standard deviation and @ is the number of measurements reported by participants.
FIG. 34. Laboratory results for PCB 118 in IAEA-459 (µg kg-1).
0
0.5
1
1.5
2
2.5
3
3.5
4
4.5
5
2 4 5 6 7 9 10 11 13 15 16
µg
kg
-1
Laboratory Code
PCB 118
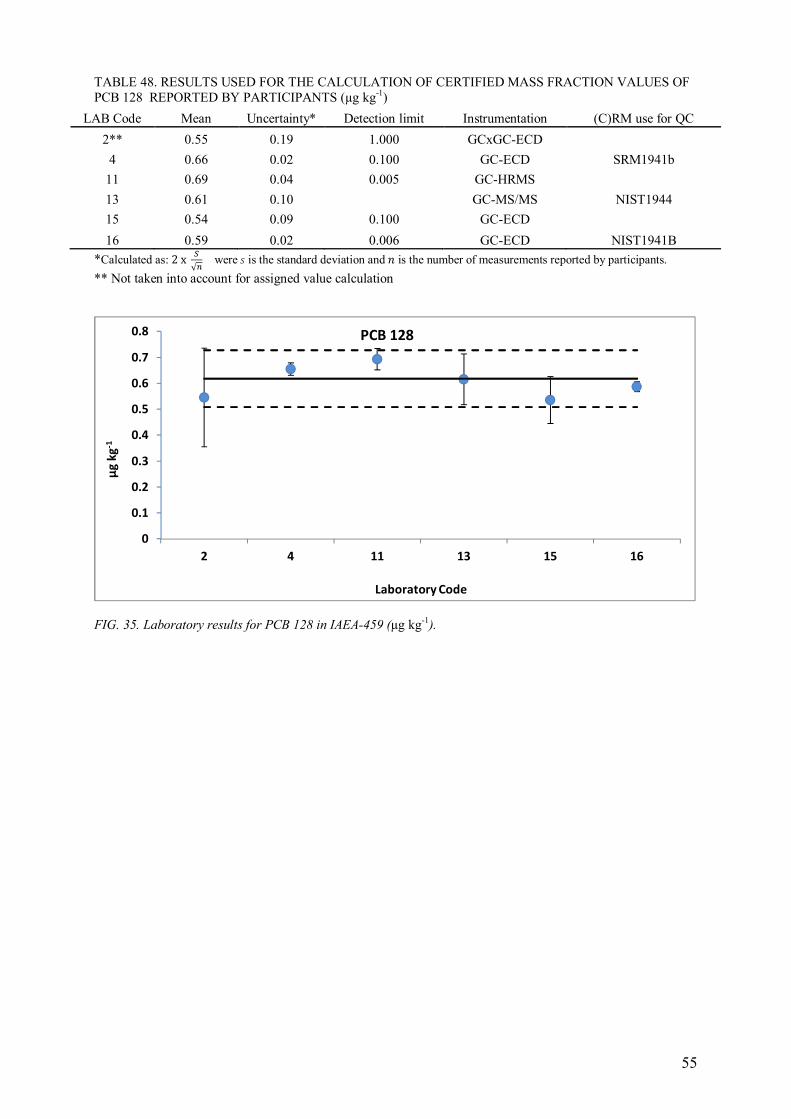
55
TABLE 48. RESULTS USED FOR THE CALCULATION OF CERTIFIED MASS FRACTION VALUES OF
PCB 128 REPORTED BY PARTICIPANTS (µg kg-1)
LAB Code Mean Uncertainty* Detection limit Instrumentation (C)RM use for QC
2** 0.55 0.19 1.000 GCxGC-ECD
4 0.66 0.02 0.100 GC-ECD SRM1941b
11 0.69 0.04 0.005 GC-HRMS
13 0.61 0.10
GC-MS/MS NIST1944
15 0.54 0.09 0.100 GC-ECD
16 0.59 0.02 0.006 GC-ECD NIST1941B
*Calculated as: 2x =√> were ? is the standard deviation and @ is the number of measurements reported by participants.
** Not taken into account for assigned value calculation
FIG. 35. Laboratory results for PCB 128 in IAEA-459 (µg kg-1).
0
0.1
0.2
0.3
0.4
0.5
0.6
0.7
0.8
2 4 11 13 15 16
µg
kg
-1
Laboratory Code
PCB 128
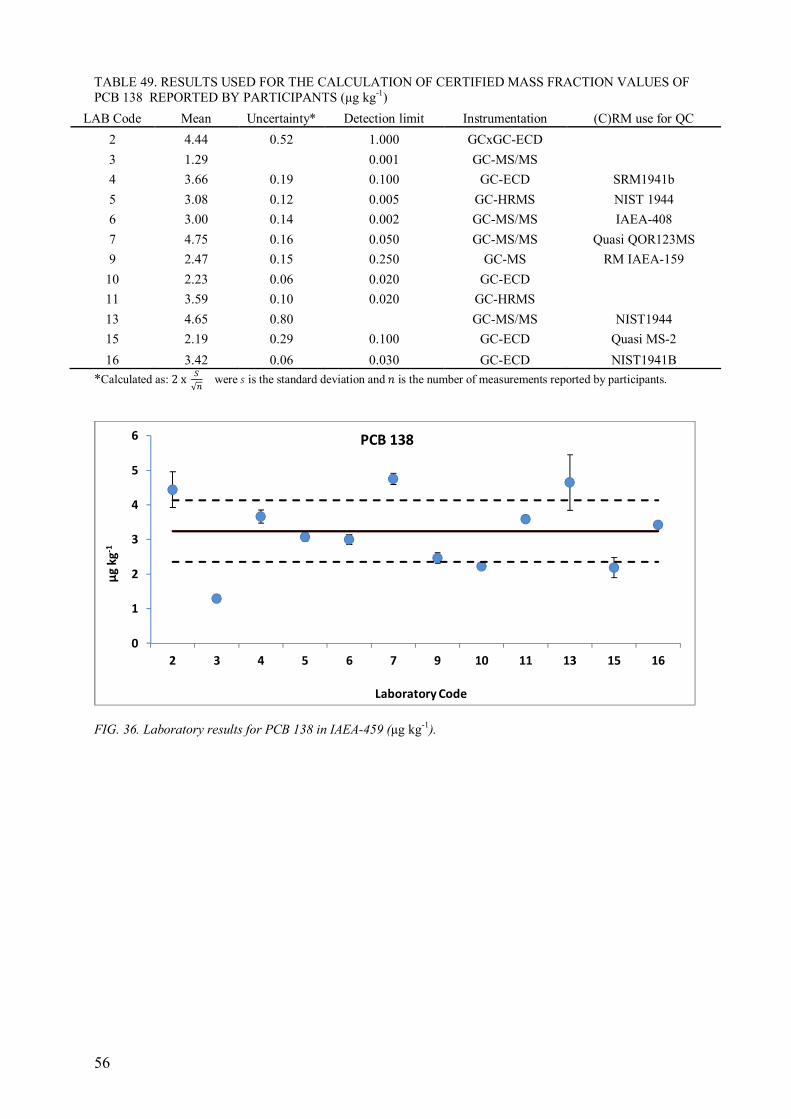
56
TABLE 49. RESULTS USED FOR THE CALCULATION OF CERTIFIED MASS FRACTION VALUES OF
PCB 138 REPORTED BY PARTICIPANTS (µg kg-1)
LAB Code Mean Uncertainty* Detection limit Instrumentation (C)RM use for QC
2 4.44 0.52 1.000 GCxGC-ECD
3 1.29
0.001 GC-MS/MS
4 3.66 0.19 0.100 GC-ECD SRM1941b
5 3.08 0.12 0.005 GC-HRMS NIST 1944
6 3.00 0.14 0.002 GC-MS/MS IAEA-408
7 4.75 0.16 0.050 GC-MS/MS Quasi QOR123MS
9 2.47 0.15 0.250 GC-MS RM IAEA-159
10 2.23 0.06 0.020 GC-ECD
11 3.59 0.10 0.020 GC-HRMS
13 4.65 0.80
GC-MS/MS NIST1944
15 2.19 0.29 0.100 GC-ECD Quasi MS-2
16 3.42 0.06 0.030 GC-ECD NIST1941B
*Calculated as: 2x =√> were ? is the standard deviation and @ is the number of measurements reported by participants.
FIG. 36. Laboratory results for PCB 138 in IAEA-459 (µg kg-1).
0
1
2
3
4
5
6
2 3 4 5 6 7 9 10 11 13 15 16
µg
kg
-1
Laboratory Code
PCB 138
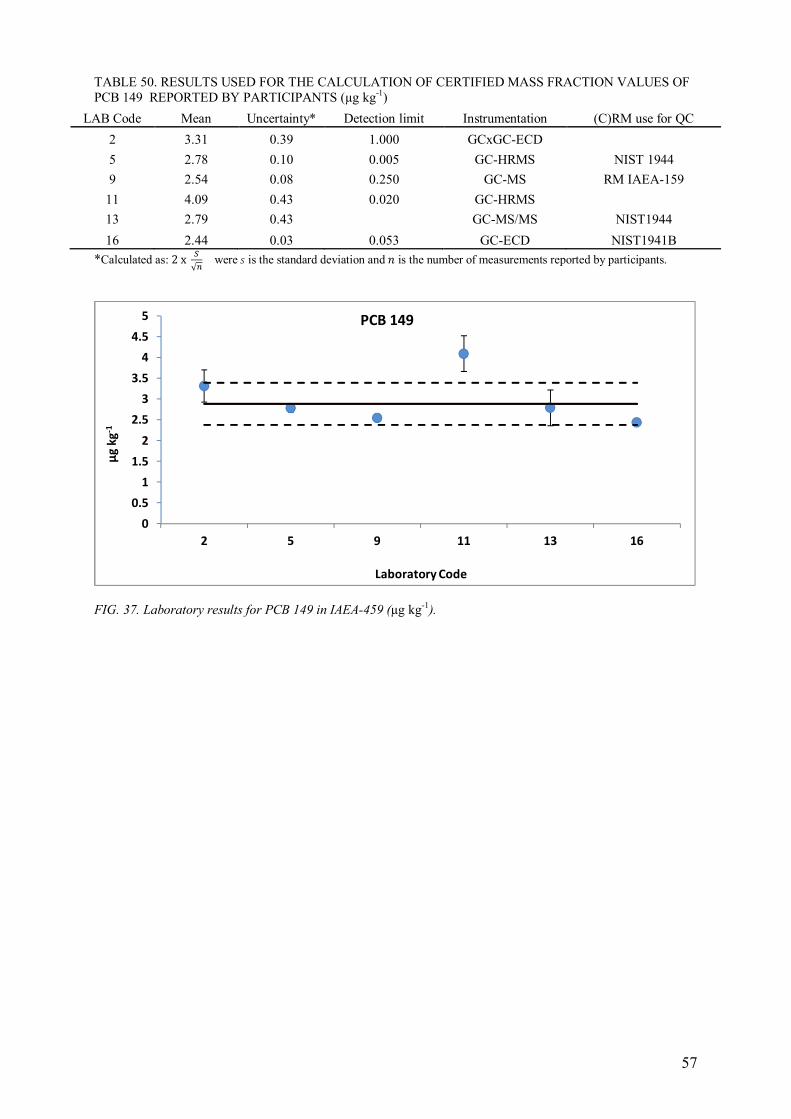
57
TABLE 50. RESULTS USED FOR THE CALCULATION OF CERTIFIED MASS FRACTION VALUES OF
PCB 149 REPORTED BY PARTICIPANTS (µg kg-1)
LAB Code Mean Uncertainty* Detection limit Instrumentation (C)RM use for QC
2 3.31 0.39 1.000 GCxGC-ECD
5 2.78 0.10 0.005 GC-HRMS NIST 1944
9 2.54 0.08 0.250 GC-MS RM IAEA-159
11 4.09 0.43 0.020 GC-HRMS
13 2.79 0.43
GC-MS/MS NIST1944
16 2.44 0.03 0.053 GC-ECD NIST1941B
*Calculated as: 2x =√> were ? is the standard deviation and @ is the number of measurements reported by participants.
FIG. 37. Laboratory results for PCB 149 in IAEA-459 (µg kg-1).
0
0.5
1
1.5
2
2.5
3
3.5
4
4.5
5
2 5 9 11 13 16
µg
kg
-1
Laboratory Code
PCB 149
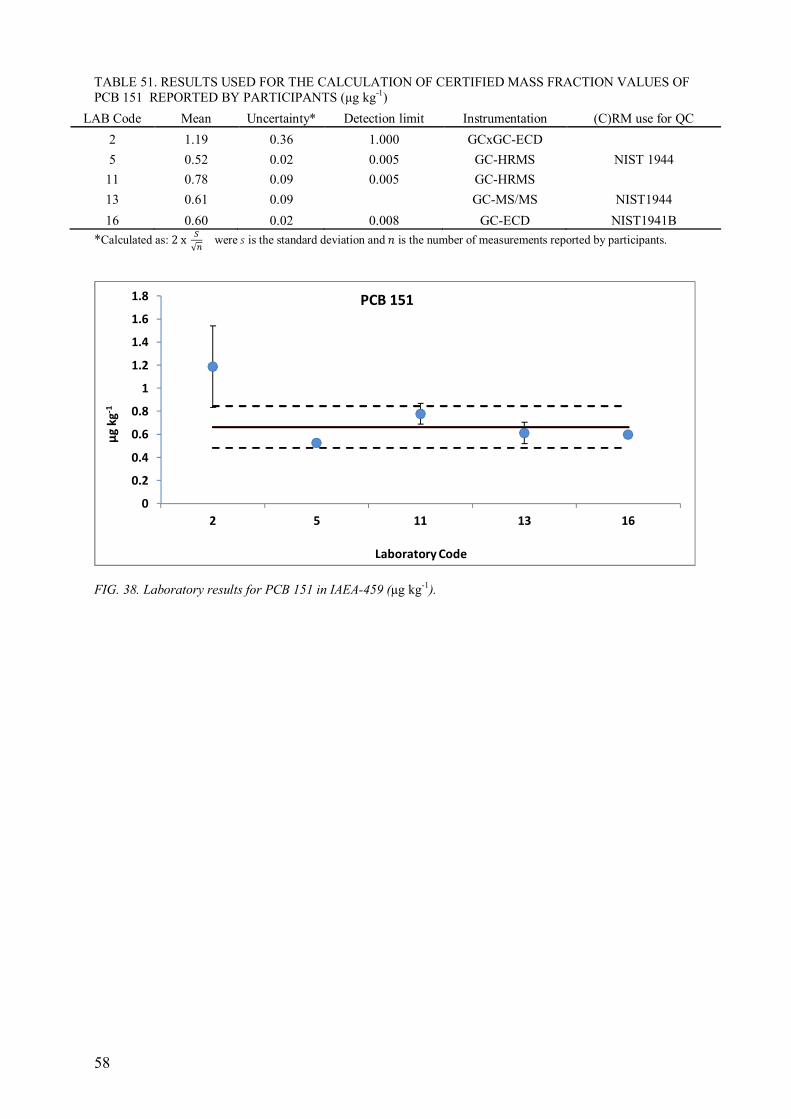
58
TABLE 51. RESULTS USED FOR THE CALCULATION OF CERTIFIED MASS FRACTION VALUES OF
PCB 151 REPORTED BY PARTICIPANTS (µg kg-1)
LAB Code Mean Uncertainty* Detection limit Instrumentation (C)RM use for QC
2 1.19 0.36 1.000 GCxGC-ECD
5 0.52 0.02 0.005 GC-HRMS NIST 1944
11 0.78 0.09 0.005 GC-HRMS
13 0.61 0.09
GC-MS/MS NIST1944
16 0.60 0.02 0.008 GC-ECD NIST1941B
*Calculated as: 2x =√> were ? is the standard deviation and @ is the number of measurements reported by participants.
FIG. 38. Laboratory results for PCB 151 in IAEA-459 (µg kg-1).
0
0.2
0.4
0.6
0.8
1
1.2
1.4
1.6
1.8
2 5 11 13 16
µg
kg
-1
Laboratory Code
PCB 151
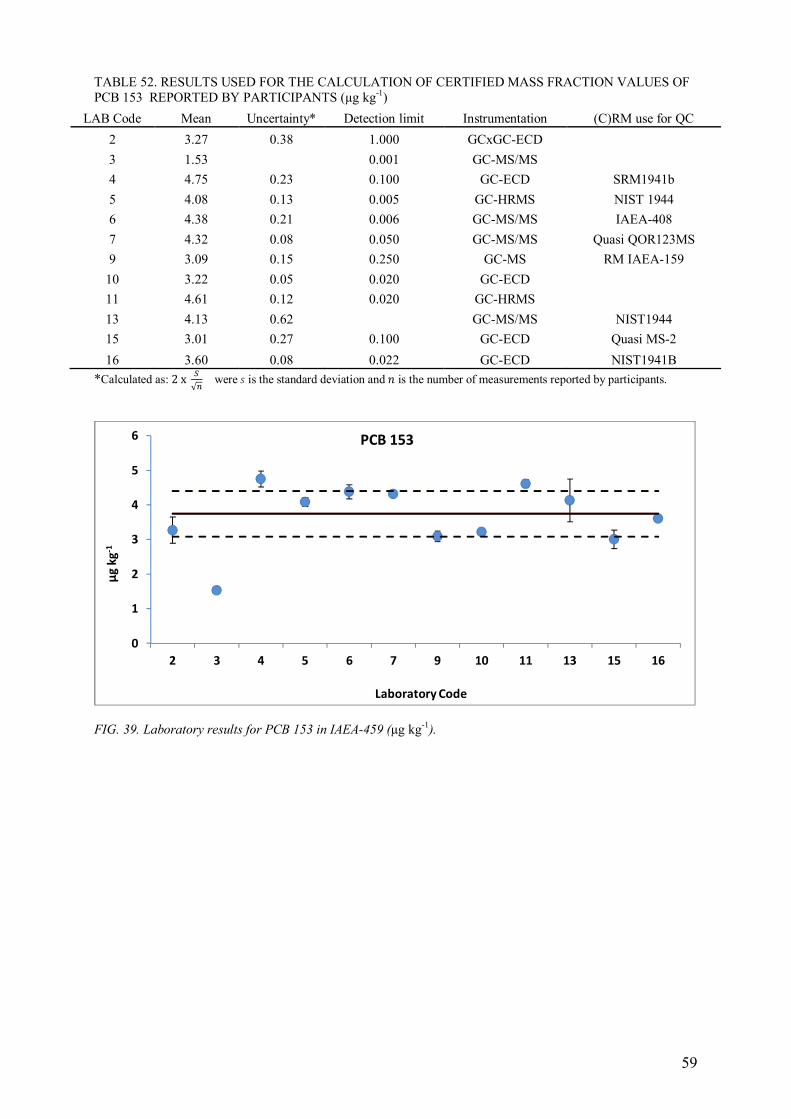
59
TABLE 52. RESULTS USED FOR THE CALCULATION OF CERTIFIED MASS FRACTION VALUES OF
PCB 153 REPORTED BY PARTICIPANTS (µg kg-1)
LAB Code Mean Uncertainty* Detection limit Instrumentation (C)RM use for QC
2 3.27 0.38 1.000 GCxGC-ECD
3 1.53
0.001 GC-MS/MS
4 4.75 0.23 0.100 GC-ECD SRM1941b
5 4.08 0.13 0.005 GC-HRMS NIST 1944
6 4.38 0.21 0.006 GC-MS/MS IAEA-408
7 4.32 0.08 0.050 GC-MS/MS Quasi QOR123MS
9 3.09 0.15 0.250 GC-MS RM IAEA-159
10 3.22 0.05 0.020 GC-ECD
11 4.61 0.12 0.020 GC-HRMS
13 4.13 0.62
GC-MS/MS NIST1944
15 3.01 0.27 0.100 GC-ECD Quasi MS-2
16 3.60 0.08 0.022 GC-ECD NIST1941B
*Calculated as: 2x =√> were ? is the standard deviation and @ is the number of measurements reported by participants.
FIG. 39. Laboratory results for PCB 153 in IAEA-459 (µg kg-1).
0
1
2
3
4
5
6
2 3 4 5 6 7 9 10 11 13 15 16
µg
kg
-1
Laboratory Code
PCB 153
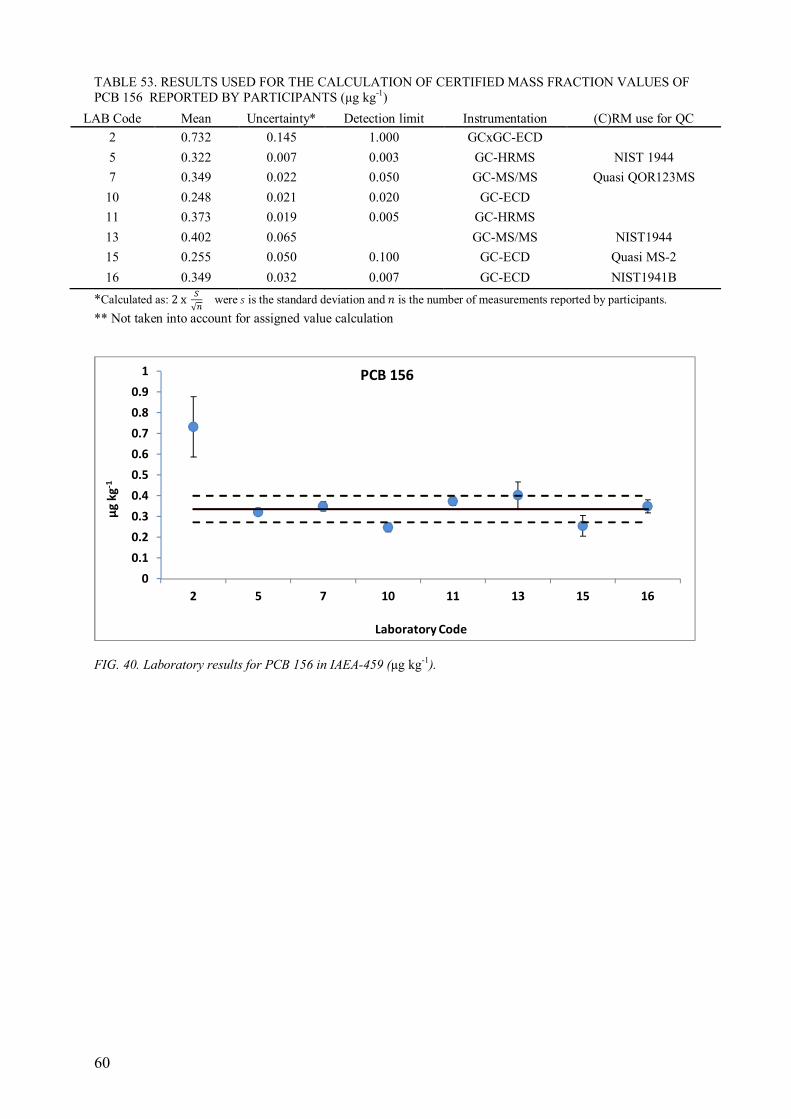
60
TABLE 53. RESULTS USED FOR THE CALCULATION OF CERTIFIED MASS FRACTION VALUES OF
PCB 156 REPORTED BY PARTICIPANTS (µg kg-1)
LAB Code Mean Uncertainty* Detection limit Instrumentation (C)RM use for QC
2 0.732 0.145 1.000 GCxGC-ECD
5 0.322 0.007 0.003 GC-HRMS NIST 1944
7 0.349 0.022 0.050 GC-MS/MS Quasi QOR123MS
10 0.248 0.021 0.020 GC-ECD
11 0.373 0.019 0.005 GC-HRMS
13 0.402 0.065
GC-MS/MS NIST1944
15 0.255 0.050 0.100 GC-ECD Quasi MS-2
16 0.349 0.032 0.007 GC-ECD NIST1941B
*Calculated as: 2x =√> were ? is the standard deviation and @ is the number of measurements reported by participants.
** Not taken into account for assigned value calculation
FIG. 40. Laboratory results for PCB 156 in IAEA-459 (µg kg-1).
0
0.1
0.2
0.3
0.4
0.5
0.6
0.7
0.8
0.9
1
2 5 7 10 11 13 15 16
µg
kg
-1
Laboratory Code
PCB 156
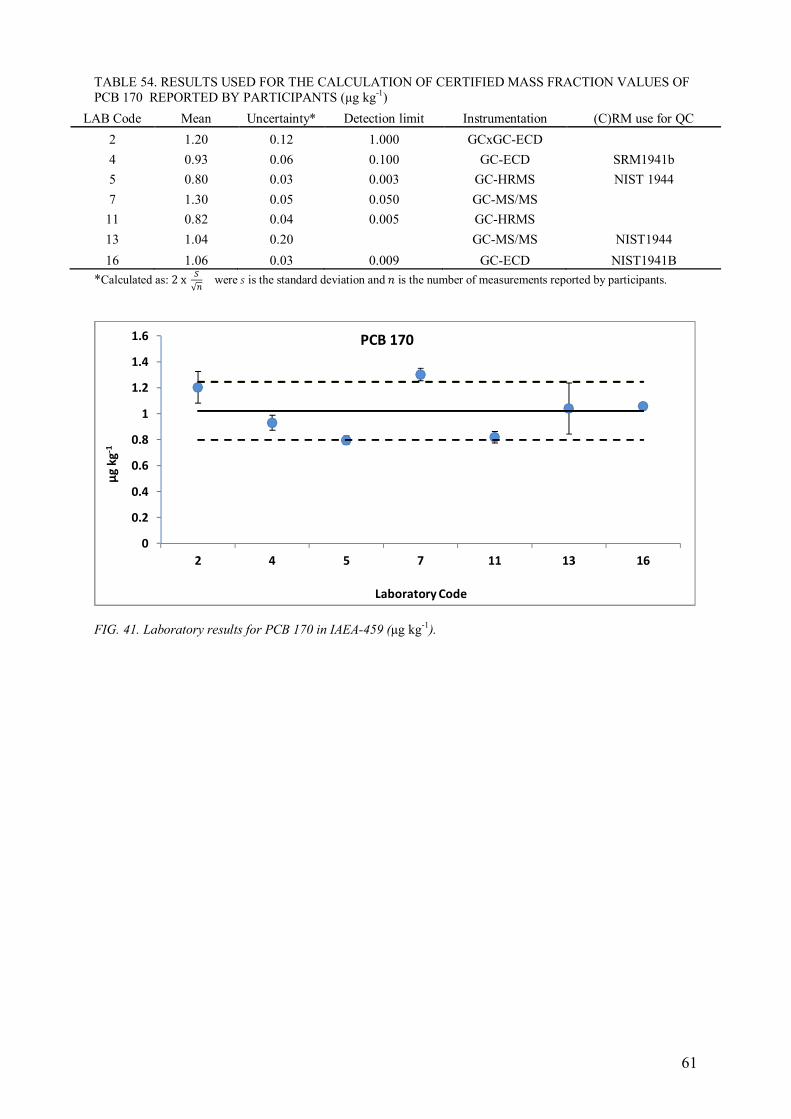
61
TABLE 54. RESULTS USED FOR THE CALCULATION OF CERTIFIED MASS FRACTION VALUES OF
PCB 170 REPORTED BY PARTICIPANTS (µg kg-1)
LAB Code Mean Uncertainty* Detection limit Instrumentation (C)RM use for QC
2 1.20 0.12 1.000 GCxGC-ECD
4 0.93 0.06 0.100 GC-ECD SRM1941b
5 0.80 0.03 0.003 GC-HRMS NIST 1944
7 1.30 0.05 0.050 GC-MS/MS
11 0.82 0.04 0.005 GC-HRMS
13 1.04 0.20
GC-MS/MS NIST1944
16 1.06 0.03 0.009 GC-ECD NIST1941B
*Calculated as: 2x =√> were ? is the standard deviation and @ is the number of measurements reported by participants.
FIG. 41. Laboratory results for PCB 170 in IAEA-459 (µg kg-1).
0
0.2
0.4
0.6
0.8
1
1.2
1.4
1.6
2 4 5 7 11 13 16
µg
kg
-1
Laboratory Code
PCB 170
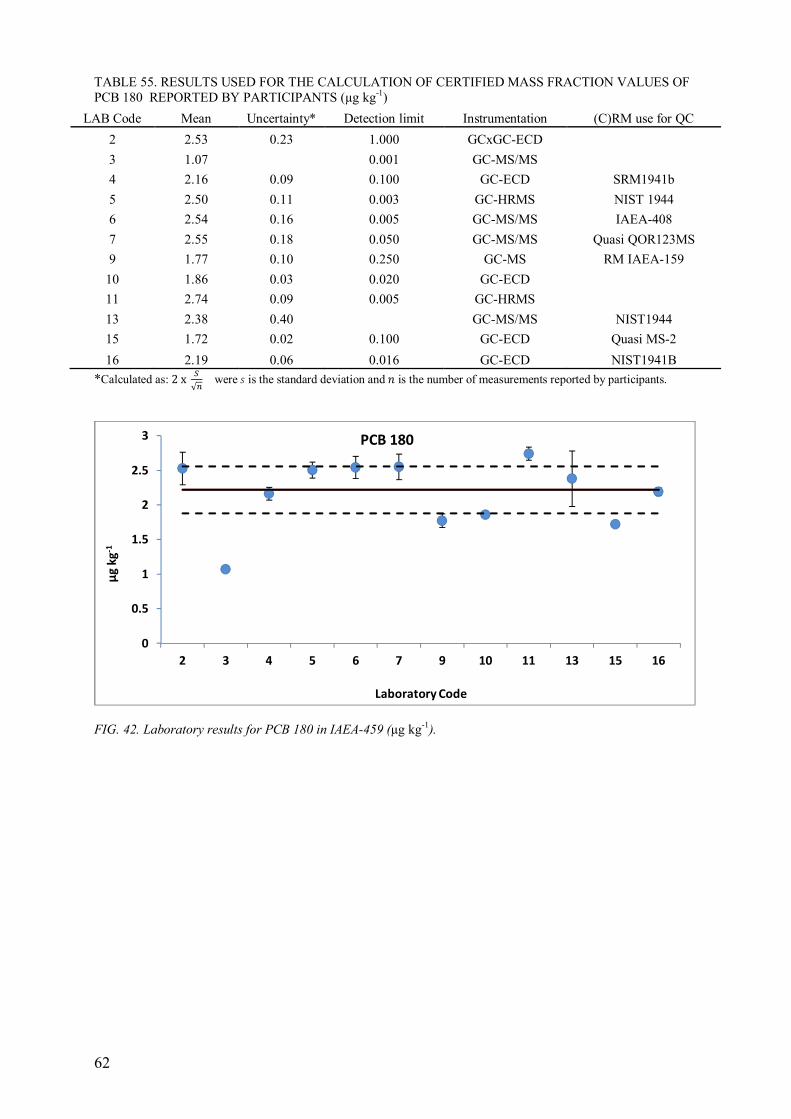
62
TABLE 55. RESULTS USED FOR THE CALCULATION OF CERTIFIED MASS FRACTION VALUES OF
PCB 180 REPORTED BY PARTICIPANTS (µg kg-1)
LAB Code Mean Uncertainty* Detection limit Instrumentation (C)RM use for QC
2 2.53 0.23 1.000 GCxGC-ECD
3 1.07
0.001 GC-MS/MS
4 2.16 0.09 0.100 GC-ECD SRM1941b
5 2.50 0.11 0.003 GC-HRMS NIST 1944
6 2.54 0.16 0.005 GC-MS/MS IAEA-408
7 2.55 0.18 0.050 GC-MS/MS Quasi QOR123MS
9 1.77 0.10 0.250 GC-MS RM IAEA-159
10 1.86 0.03 0.020 GC-ECD
11 2.74 0.09 0.005 GC-HRMS
13 2.38 0.40
GC-MS/MS NIST1944
15 1.72 0.02 0.100 GC-ECD Quasi MS-2
16 2.19 0.06 0.016 GC-ECD NIST1941B
*Calculated as: 2x =√> were ? is the standard deviation and @ is the number of measurements reported by participants.
FIG. 42. Laboratory results for PCB 180 in IAEA-459 (µg kg-1).
0
0.5
1
1.5
2
2.5
3
2 3 4 5 6 7 9 10 11 13 15 16
µg
kg
-1
Laboratory Code
PCB 180
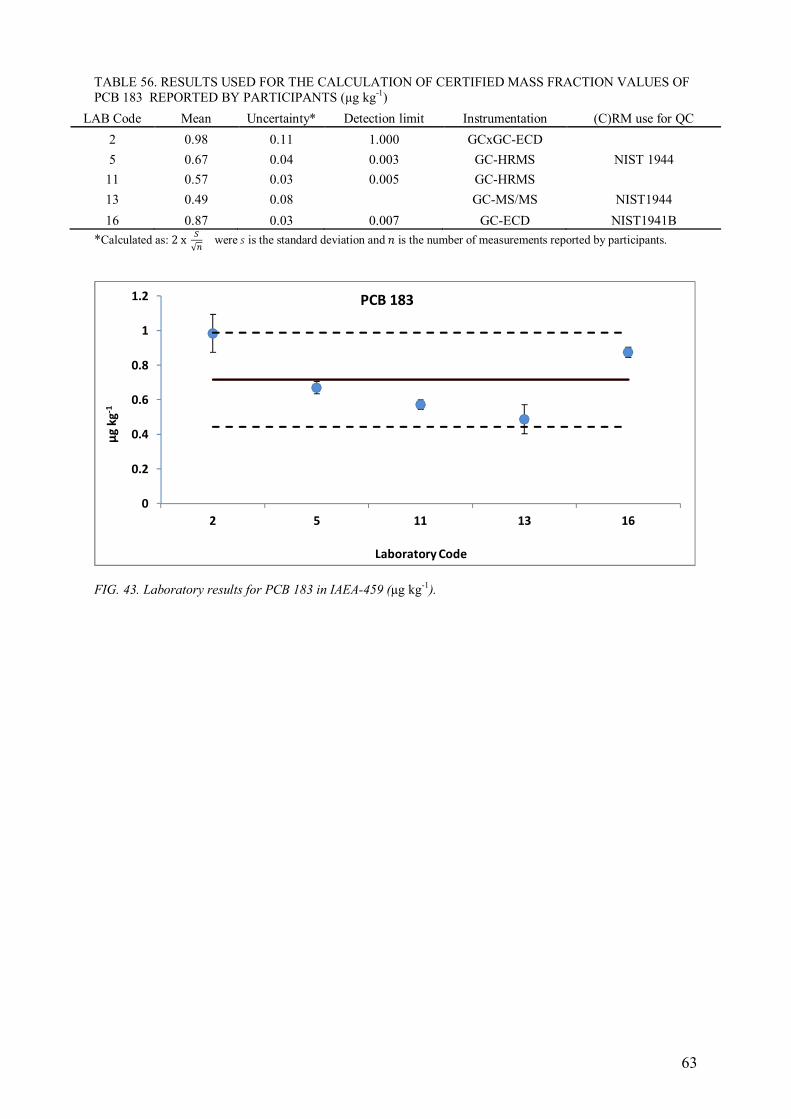
63
TABLE 56. RESULTS USED FOR THE CALCULATION OF CERTIFIED MASS FRACTION VALUES OF
PCB 183 REPORTED BY PARTICIPANTS (µg kg-1)
LAB Code Mean Uncertainty* Detection limit Instrumentation (C)RM use for QC
2 0.98 0.11 1.000 GCxGC-ECD
5 0.67 0.04 0.003 GC-HRMS NIST 1944
11 0.57 0.03 0.005 GC-HRMS
13 0.49 0.08
GC-MS/MS NIST1944
16 0.87 0.03 0.007 GC-ECD NIST1941B
*Calculated as: 2x =√> were ? is the standard deviation and @ is the number of measurements reported by participants.
FIG. 43. Laboratory results for PCB 183 in IAEA-459 (µg kg-1).
0
0.2
0.4
0.6
0.8
1
1.2
2 5 11 13 16
µg
kg
-1
Laboratory Code
PCB 183
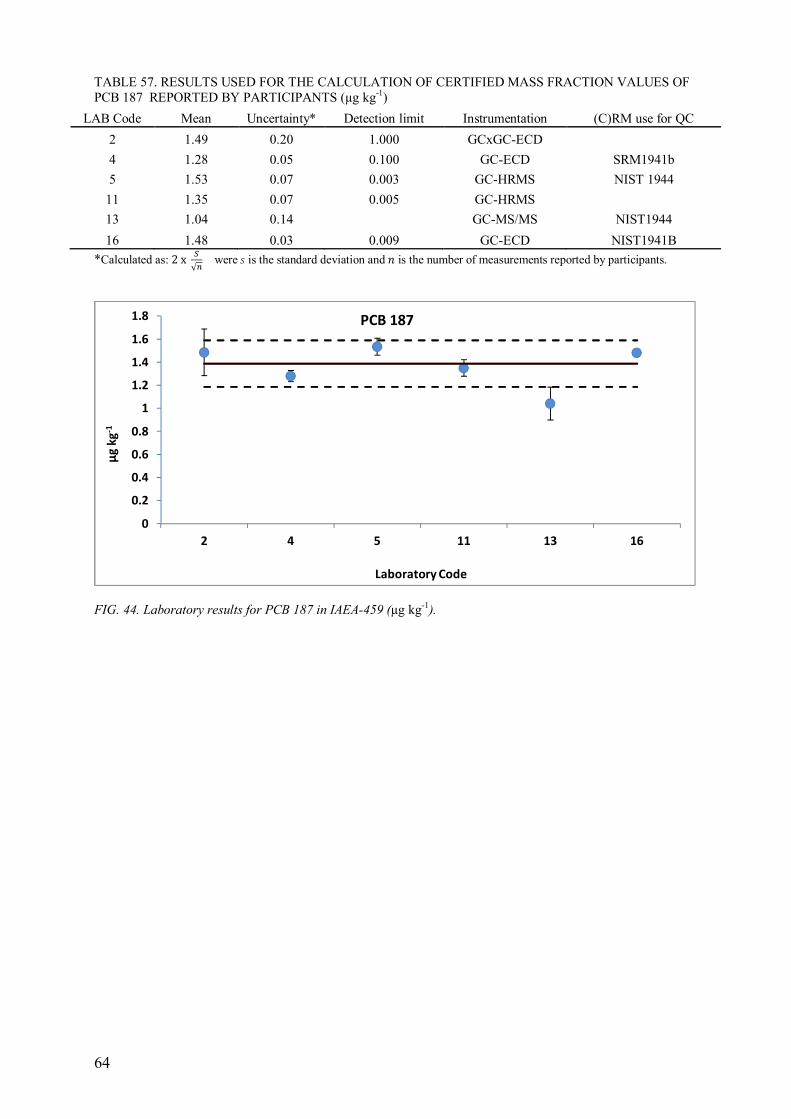
64
TABLE 57. RESULTS USED FOR THE CALCULATION OF CERTIFIED MASS FRACTION VALUES OF
PCB 187 REPORTED BY PARTICIPANTS (µg kg-1)
LAB Code Mean Uncertainty* Detection limit Instrumentation (C)RM use for QC
2 1.49 0.20 1.000 GCxGC-ECD
4 1.28 0.05 0.100 GC-ECD SRM1941b
5 1.53 0.07 0.003 GC-HRMS NIST 1944
11 1.35 0.07 0.005 GC-HRMS
13 1.04 0.14
GC-MS/MS NIST1944
16 1.48 0.03 0.009 GC-ECD NIST1941B
*Calculated as: 2x =√> were ? is the standard deviation and @ is the number of measurements reported by participants.
FIG. 44. Laboratory results for PCB 187 in IAEA-459 (µg kg-1).
0
0.2
0.4
0.6
0.8
1
1.2
1.4
1.6
1.8
2 4 5 11 13 16
µg
kg
-1
Laboratory Code
PCB 187
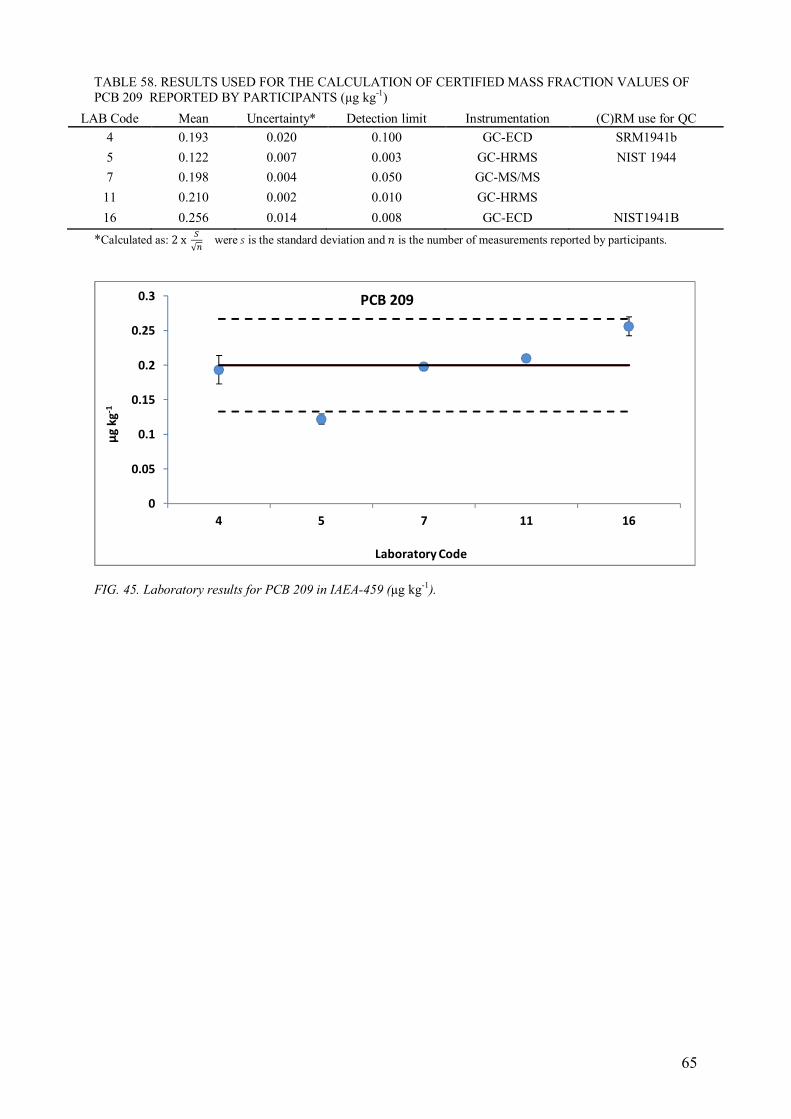
65
TABLE 58. RESULTS USED FOR THE CALCULATION OF CERTIFIED MASS FRACTION VALUES OF
PCB 209 REPORTED BY PARTICIPANTS (µg kg-1)
LAB Code Mean Uncertainty* Detection limit Instrumentation (C)RM use for QC
4 0.193 0.020 0.100 GC-ECD SRM1941b
5 0.122 0.007 0.003 GC-HRMS NIST 1944
7 0.198 0.004 0.050 GC-MS/MS
11 0.210 0.002 0.010 GC-HRMS
16 0.256 0.014 0.008 GC-ECD NIST1941B
*Calculated as: 2x =√> were ? is the standard deviation and @ is the number of measurements reported by participants.
FIG. 45. Laboratory results for PCB 209 in IAEA-459 (µg kg-1).
0
0.05
0.1
0.15
0.2
0.25
0.3
4 5 7 11 16
µg
kg
-1
Laboratory Code
PCB 209
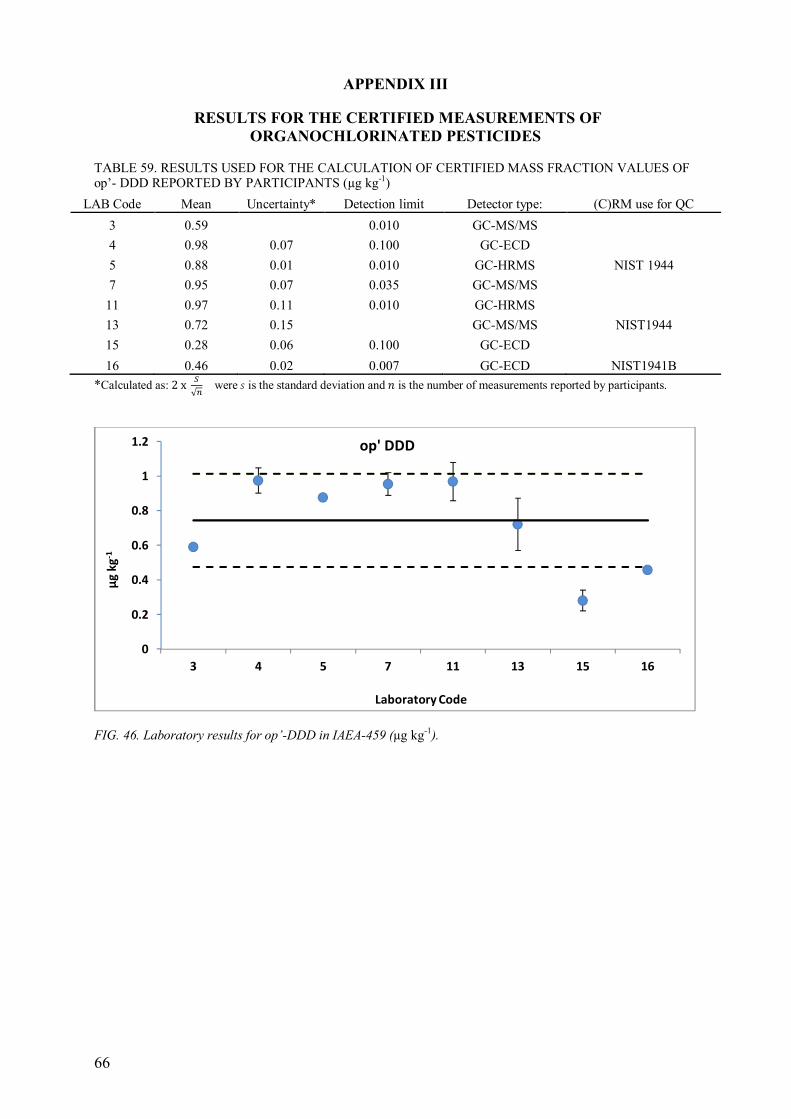
66
APPENDIX III
RESULTS FOR THE CERTIFIED MEASUREMENTS OF
ORGANOCHLORINATED PESTICIDES
TABLE 59. RESULTS USED FOR THE CALCULATION OF CERTIFIED MASS FRACTION VALUES OF op’- DDD REPORTED BY PARTICIPANTS (µg kg-1)
LAB Code Mean Uncertainty* Detection limit Detector type: (C)RM use for QC
3 0.59
0.010 GC-MS/MS
4 0.98 0.07 0.100 GC-ECD
5 0.88 0.01 0.010 GC-HRMS NIST 1944
7 0.95 0.07 0.035 GC-MS/MS
11 0.97 0.11 0.010 GC-HRMS
13 0.72 0.15
GC-MS/MS NIST1944
15 0.28 0.06 0.100 GC-ECD
16 0.46 0.02 0.007 GC-ECD NIST1941B
*Calculated as: 2x =√> were ? is the standard deviation and @ is the number of measurements reported by participants.
FIG. 46. Laboratory results for op’-DDD in IAEA-459 (µg kg-1).
0
0.2
0.4
0.6
0.8
1
1.2
3 4 5 7 11 13 15 16
µg
kg
-1
Laboratory Code
op' DDD
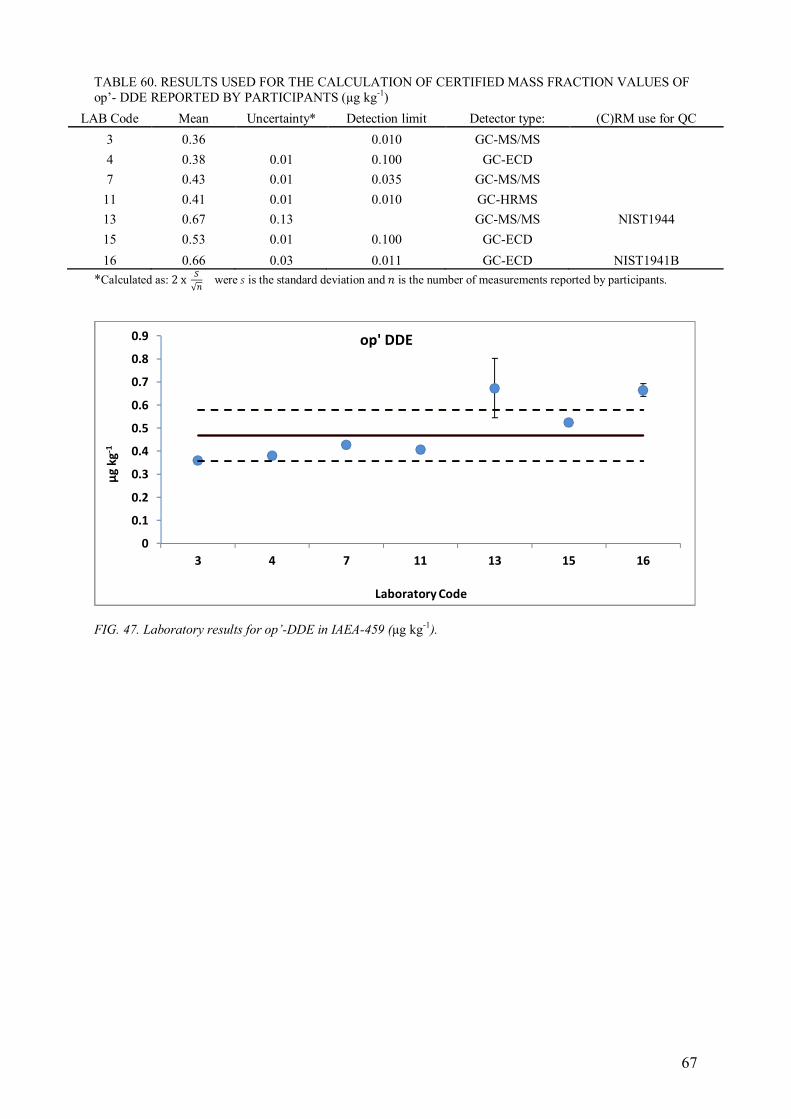
67
TABLE 60. RESULTS USED FOR THE CALCULATION OF CERTIFIED MASS FRACTION VALUES OF
op’- DDE REPORTED BY PARTICIPANTS (µg kg-1)
LAB Code Mean Uncertainty* Detection limit Detector type: (C)RM use for QC
3 0.36
0.010 GC-MS/MS
4 0.38 0.01 0.100 GC-ECD
7 0.43 0.01 0.035 GC-MS/MS
11 0.41 0.01 0.010 GC-HRMS
13 0.67 0.13
GC-MS/MS NIST1944
15 0.53 0.01 0.100 GC-ECD
16 0.66 0.03 0.011 GC-ECD NIST1941B
*Calculated as: 2x =√> were ? is the standard deviation and @ is the number of measurements reported by participants.
FIG. 47. Laboratory results for op’-DDE in IAEA-459 (µg kg-1).
0
0.1
0.2
0.3
0.4
0.5
0.6
0.7
0.8
0.9
3 4 7 11 13 15 16
µg
kg
-1
Laboratory Code
op' DDE
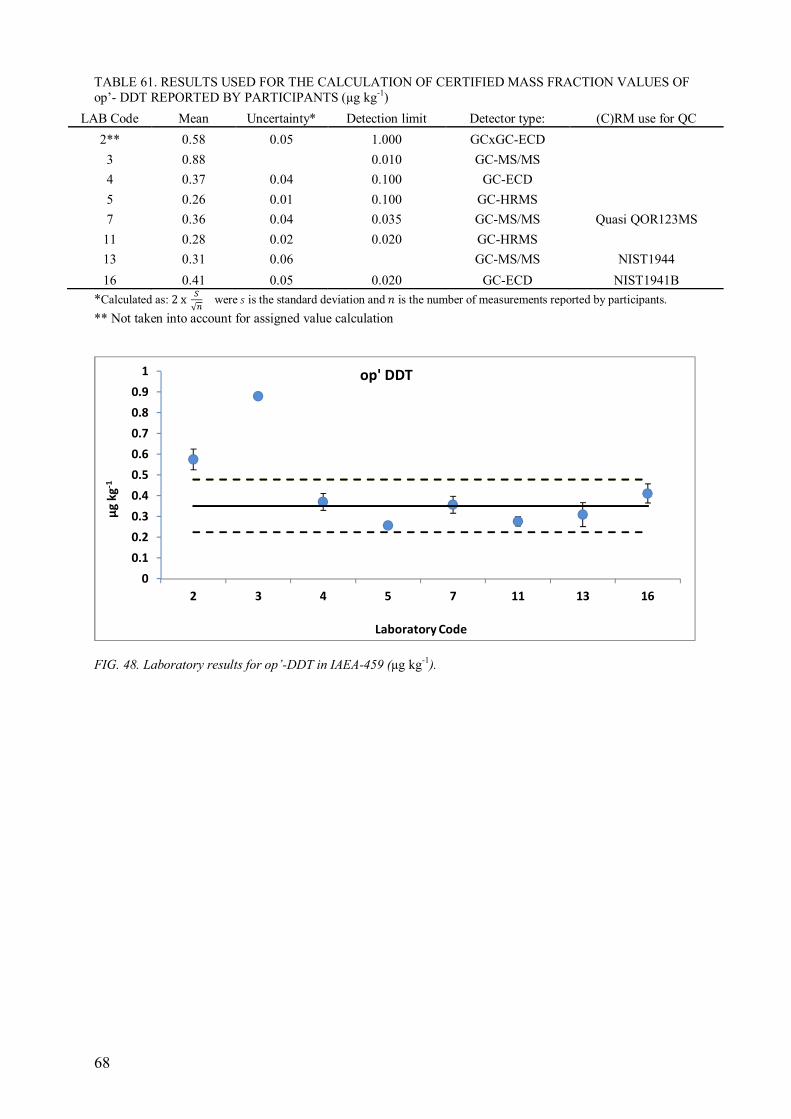
68
TABLE 61. RESULTS USED FOR THE CALCULATION OF CERTIFIED MASS FRACTION VALUES OF
op’- DDT REPORTED BY PARTICIPANTS (µg kg-1)
LAB Code Mean Uncertainty* Detection limit Detector type: (C)RM use for QC
2** 0.58 0.05 1.000 GCxGC-ECD
3 0.88
0.010 GC-MS/MS
4 0.37 0.04 0.100 GC-ECD
5 0.26 0.01 0.100 GC-HRMS
7 0.36 0.04 0.035 GC-MS/MS Quasi QOR123MS
11 0.28 0.02 0.020 GC-HRMS
13 0.31 0.06
GC-MS/MS NIST1944
16 0.41 0.05 0.020 GC-ECD NIST1941B
*Calculated as: 2x =√> were ? is the standard deviation and @ is the number of measurements reported by participants.
** Not taken into account for assigned value calculation
FIG. 48. Laboratory results for op’-DDT in IAEA-459 (µg kg-1).
0
0.1
0.2
0.3
0.4
0.5
0.6
0.7
0.8
0.9
1
2 3 4 5 7 11 13 16
µg
kg
-1
Laboratory Code
op' DDT
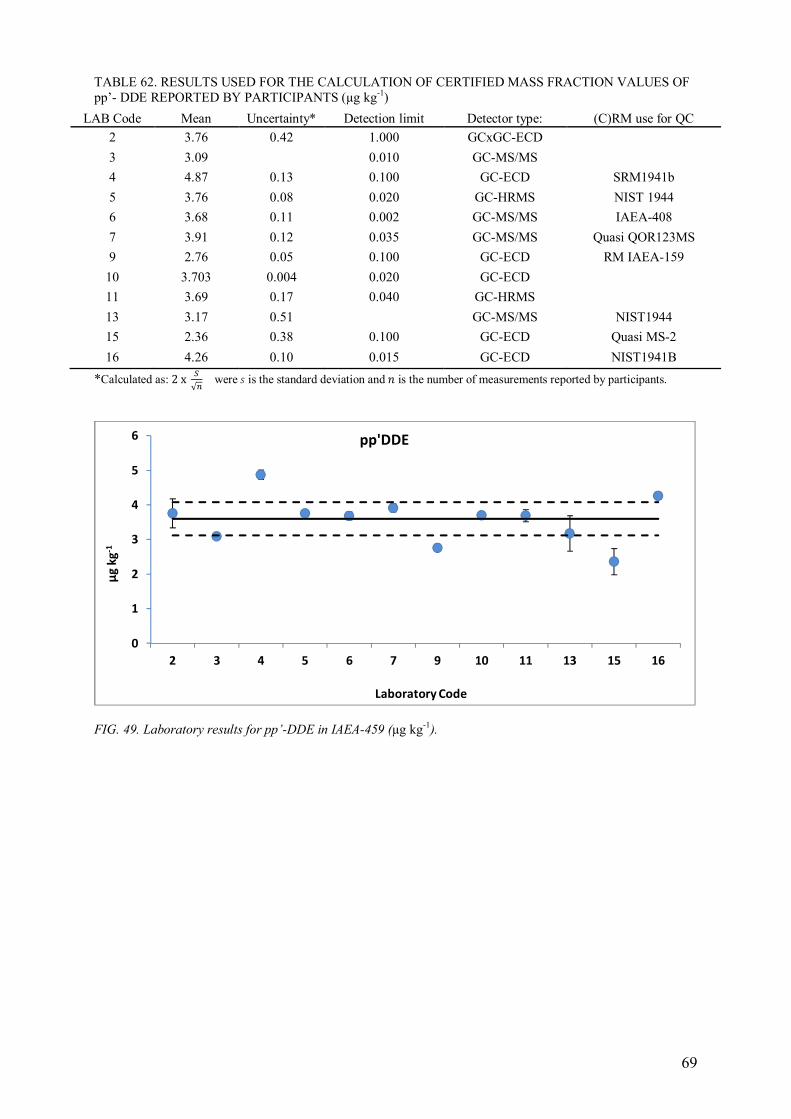
69
TABLE 62. RESULTS USED FOR THE CALCULATION OF CERTIFIED MASS FRACTION VALUES OF
pp’- DDE REPORTED BY PARTICIPANTS (µg kg-1)
LAB Code Mean Uncertainty* Detection limit Detector type: (C)RM use for QC
2 3.76 0.42 1.000 GCxGC-ECD
3 3.09
0.010 GC-MS/MS
4 4.87 0.13 0.100 GC-ECD SRM1941b
5 3.76 0.08 0.020 GC-HRMS NIST 1944
6 3.68 0.11 0.002 GC-MS/MS IAEA-408
7 3.91 0.12 0.035 GC-MS/MS Quasi QOR123MS
9 2.76 0.05 0.100 GC-ECD RM IAEA-159
10 3.703 0.004 0.020 GC-ECD
11 3.69 0.17 0.040 GC-HRMS
13 3.17 0.51
GC-MS/MS NIST1944
15 2.36 0.38 0.100 GC-ECD Quasi MS-2
16 4.26 0.10 0.015 GC-ECD NIST1941B
*Calculated as: 2x =√> were ? is the standard deviation and @ is the number of measurements reported by participants.
FIG. 49. Laboratory results for pp’-DDE in IAEA-459 (µg kg-1).
0
1
2
3
4
5
6
2 3 4 5 6 7 9 10 11 13 15 16
µg
kg
-1
Laboratory Code
pp'DDE
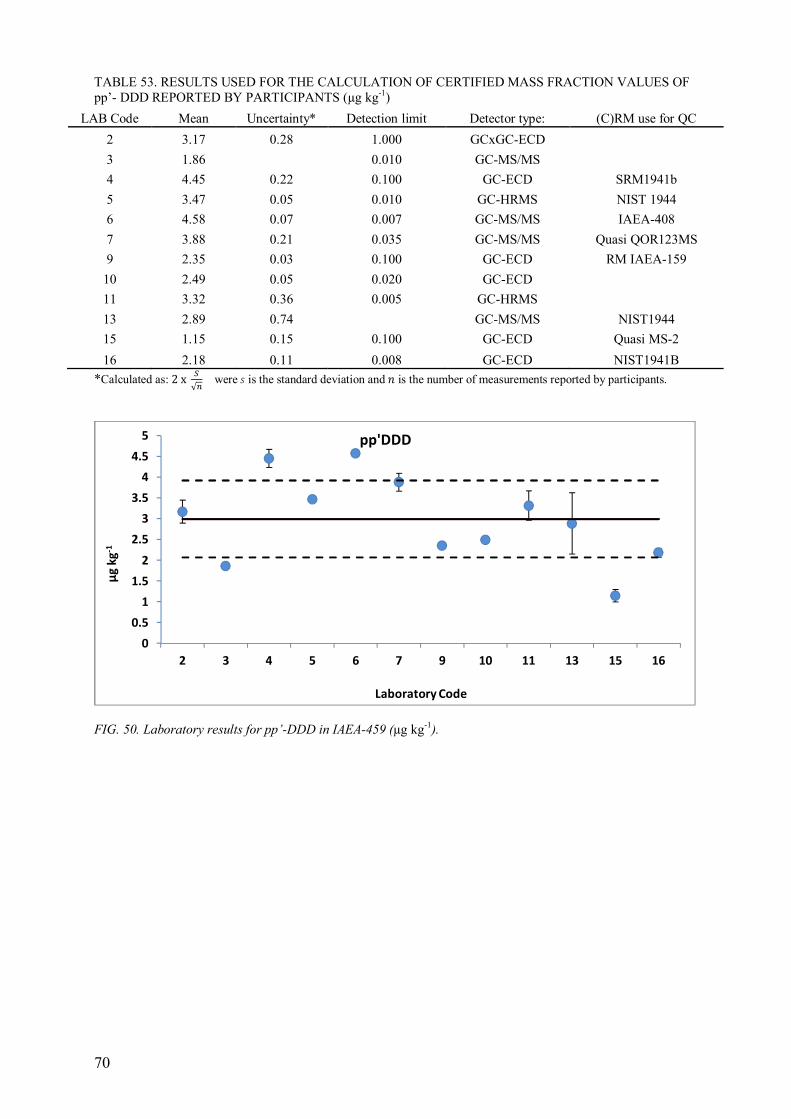
70
TABLE 53. RESULTS USED FOR THE CALCULATION OF CERTIFIED MASS FRACTION VALUES OF
pp’- DDD REPORTED BY PARTICIPANTS (µg kg-1)
LAB Code Mean Uncertainty* Detection limit Detector type: (C)RM use for QC
2 3.17 0.28 1.000 GCxGC-ECD
3 1.86
0.010 GC-MS/MS
4 4.45 0.22 0.100 GC-ECD SRM1941b
5 3.47 0.05 0.010 GC-HRMS NIST 1944
6 4.58 0.07 0.007 GC-MS/MS IAEA-408
7 3.88 0.21 0.035 GC-MS/MS Quasi QOR123MS
9 2.35 0.03 0.100 GC-ECD RM IAEA-159
10 2.49 0.05 0.020 GC-ECD
11 3.32 0.36 0.005 GC-HRMS
13 2.89 0.74
GC-MS/MS NIST1944
15 1.15 0.15 0.100 GC-ECD Quasi MS-2
16 2.18 0.11 0.008 GC-ECD NIST1941B
*Calculated as: 2x =√> were ? is the standard deviation and @ is the number of measurements reported by participants.
FIG. 50. Laboratory results for pp’-DDD in IAEA-459 (µg kg-1).
0
0.5
1
1.5
2
2.5
3
3.5
4
4.5
5
2 3 4 5 6 7 9 10 11 13 15 16
µg
kg
-1
Laboratory Code
pp'DDD
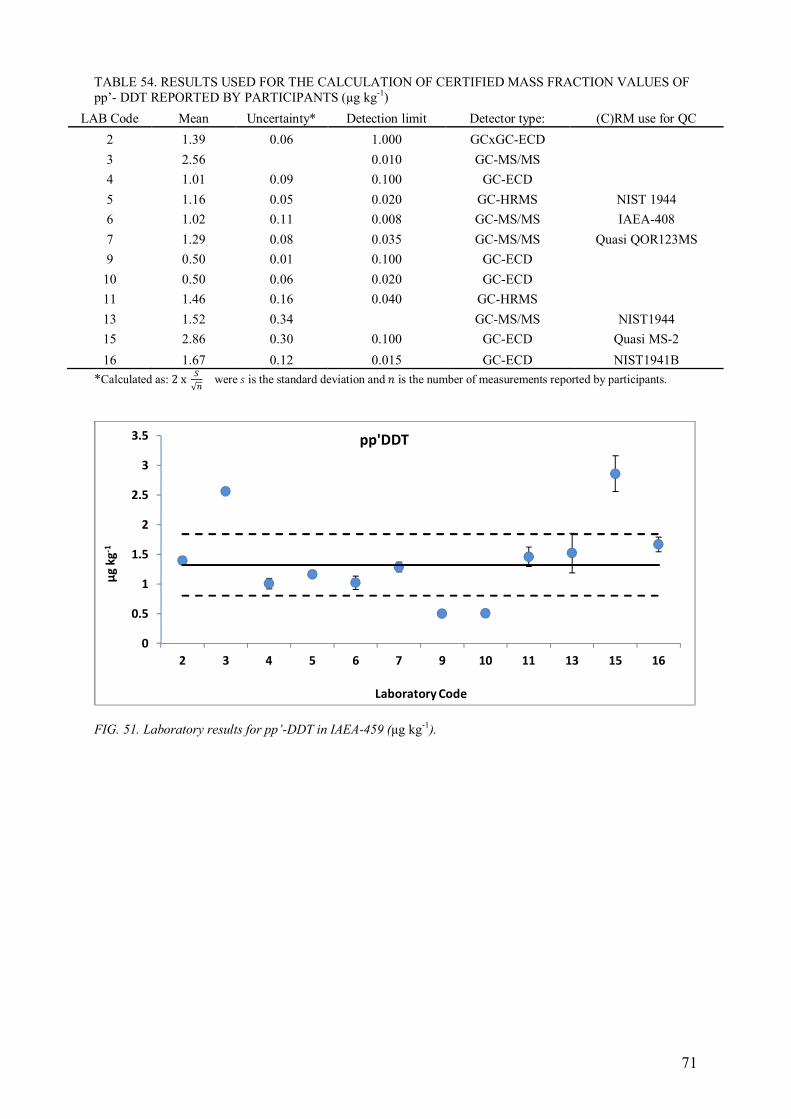
71
TABLE 54. RESULTS USED FOR THE CALCULATION OF CERTIFIED MASS FRACTION VALUES OF
pp’- DDT REPORTED BY PARTICIPANTS (µg kg-1)
LAB Code Mean Uncertainty* Detection limit Detector type: (C)RM use for QC
2 1.39 0.06 1.000 GCxGC-ECD
3 2.56
0.010 GC-MS/MS
4 1.01 0.09 0.100 GC-ECD
5 1.16 0.05 0.020 GC-HRMS NIST 1944
6 1.02 0.11 0.008 GC-MS/MS IAEA-408
7 1.29 0.08 0.035 GC-MS/MS Quasi QOR123MS
9 0.50 0.01 0.100 GC-ECD
10 0.50 0.06 0.020 GC-ECD
11 1.46 0.16 0.040 GC-HRMS
13 1.52 0.34
GC-MS/MS NIST1944
15 2.86 0.30 0.100 GC-ECD Quasi MS-2
16 1.67 0.12 0.015 GC-ECD NIST1941B
*Calculated as: 2x =√> were ? is the standard deviation and @ is the number of measurements reported by participants.
FIG. 51. Laboratory results for pp’-DDT in IAEA-459 (µg kg-1).
0
0.5
1
1.5
2
2.5
3
3.5
2 3 4 5 6 7 9 10 11 13 15 16
µg
kg
-1
Laboratory Code
pp'DDT
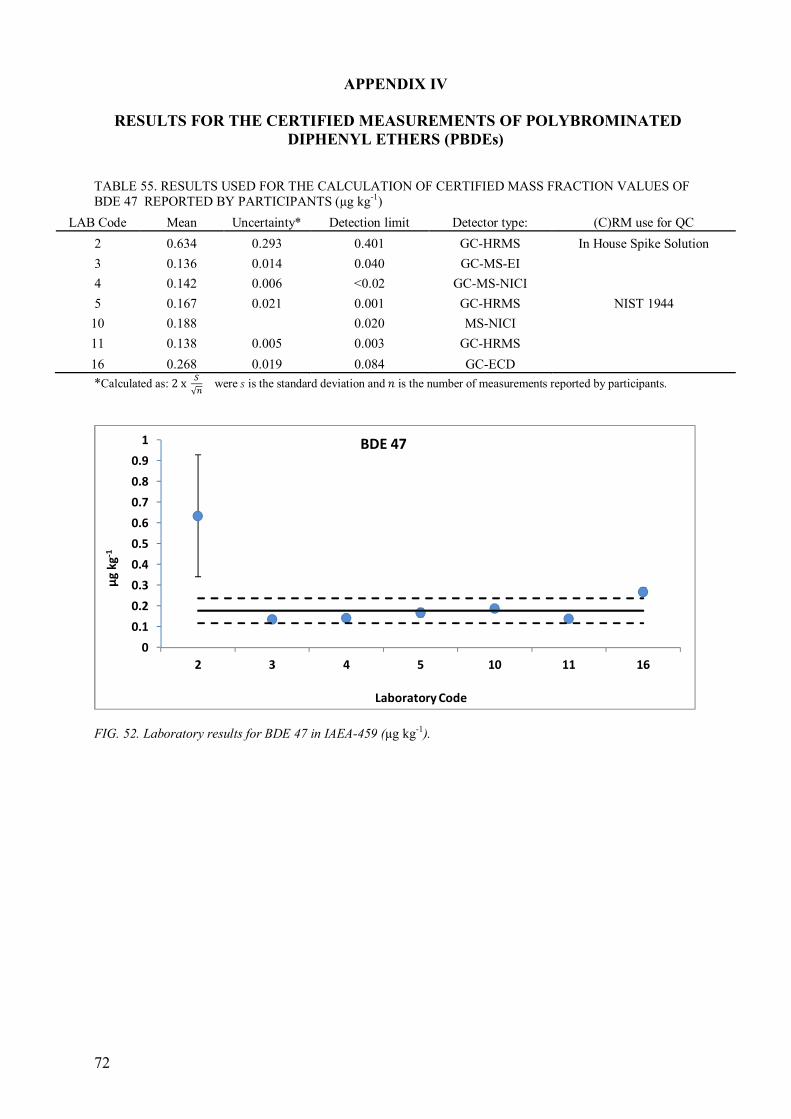
72
APPENDIX IV
RESULTS FOR THE CERTIFIED MEASUREMENTS OF POLYBROMINATED
DIPHENYL ETHERS (PBDEs)
TABLE 55. RESULTS USED FOR THE CALCULATION OF CERTIFIED MASS FRACTION VALUES OF
BDE 47 REPORTED BY PARTICIPANTS (µg kg-1)
LAB Code Mean Uncertainty* Detection limit Detector type: (C)RM use for QC
2 0.634 0.293 0.401 GC-HRMS In House Spike Solution
3 0.136 0.014 0.040 GC-MS-EI
4 0.142 0.006 <0.02 GC-MS-NICI
5 0.167 0.021 0.001 GC-HRMS NIST 1944
10 0.188
0.020 MS-NICI
11 0.138 0.005 0.003 GC-HRMS
16 0.268 0.019 0.084 GC-ECD
*Calculated as: 2x =√> were ? is the standard deviation and @ is the number of measurements reported by participants.
FIG. 52. Laboratory results for BDE 47 in IAEA-459 (µg kg-1).
0
0.1
0.2
0.3
0.4
0.5
0.6
0.7
0.8
0.9
1
2 3 4 5 10 11 16
µg
kg
-1
Laboratory Code
BDE 47
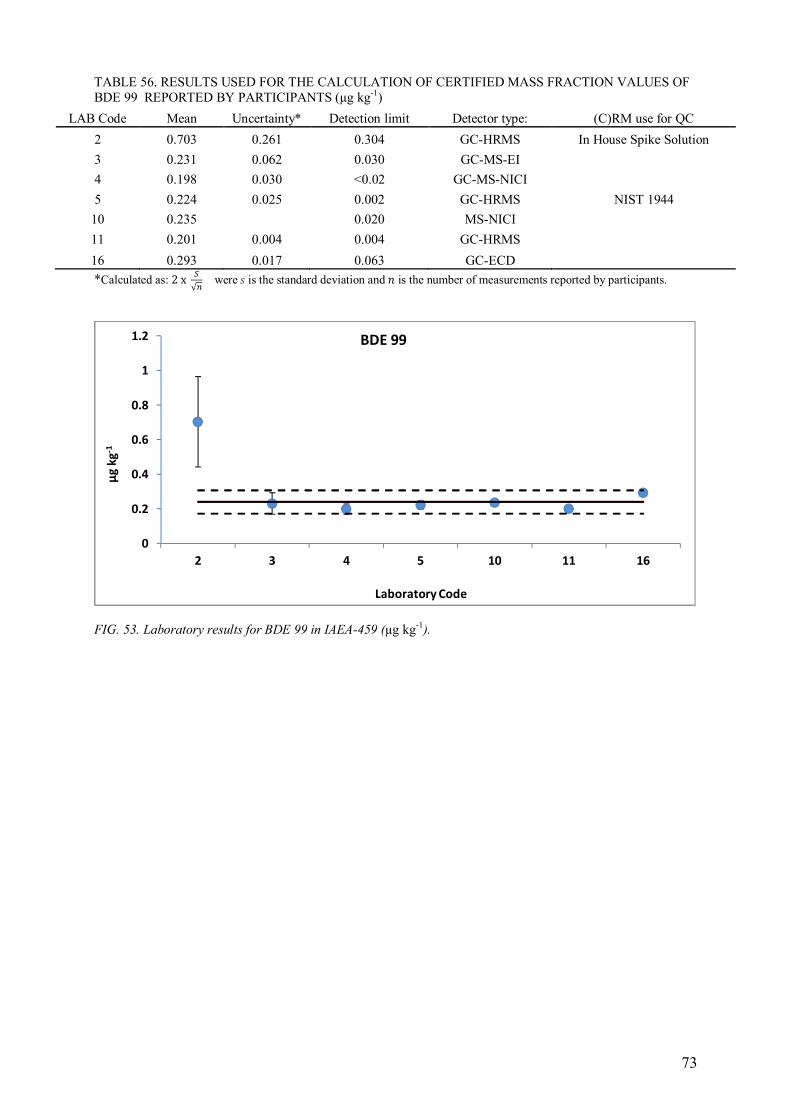
73
TABLE 56. RESULTS USED FOR THE CALCULATION OF CERTIFIED MASS FRACTION VALUES OF
BDE 99 REPORTED BY PARTICIPANTS (µg kg-1)
LAB Code Mean Uncertainty* Detection limit Detector type: (C)RM use for QC
2 0.703 0.261 0.304 GC-HRMS In House Spike Solution
3 0.231 0.062 0.030 GC-MS-EI
4 0.198 0.030 <0.02 GC-MS-NICI
5 0.224 0.025 0.002 GC-HRMS NIST 1944
10 0.235
0.020 MS-NICI
11 0.201 0.004 0.004 GC-HRMS
16 0.293 0.017 0.063 GC-ECD
*Calculated as: 2x =√> were ? is the standard deviation and @ is the number of measurements reported by participants.
FIG. 53. Laboratory results for BDE 99 in IAEA-459 (µg kg-1).
0
0.2
0.4
0.6
0.8
1
1.2
2 3 4 5 10 11 16
µg
kg
-1
Laboratory Code
BDE 99
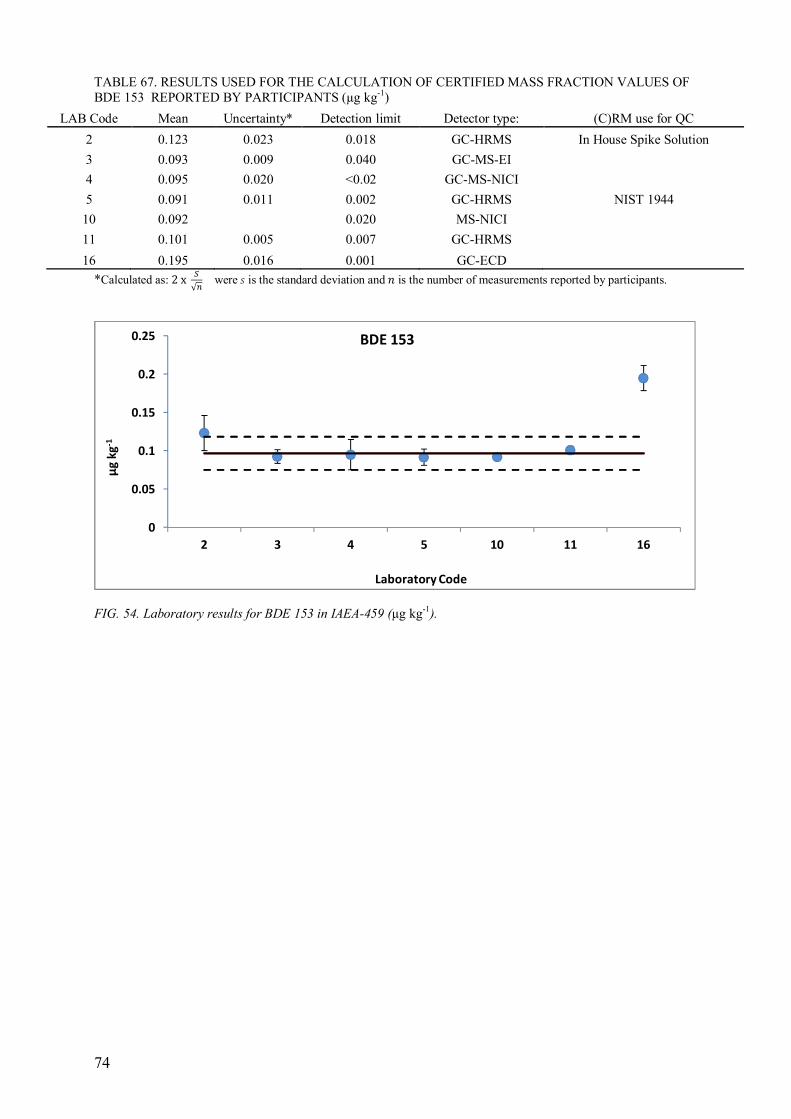
74
TABLE 67. RESULTS USED FOR THE CALCULATION OF CERTIFIED MASS FRACTION VALUES OF
BDE 153 REPORTED BY PARTICIPANTS (µg kg-1)
LAB Code Mean Uncertainty* Detection limit Detector type: (C)RM use for QC
2 0.123 0.023 0.018 GC-HRMS In House Spike Solution
3 0.093 0.009 0.040 GC-MS-EI
4 0.095 0.020 <0.02 GC-MS-NICI
5 0.091 0.011 0.002 GC-HRMS NIST 1944
10 0.092
0.020 MS-NICI
11 0.101 0.005 0.007 GC-HRMS
16 0.195 0.016 0.001 GC-ECD
*Calculated as: 2x =√> were ? is the standard deviation and @ is the number of measurements reported by participants.
FIG. 54. Laboratory results for BDE 153 in IAEA-459 (µg kg-1).
0
0.05
0.1
0.15
0.2
0.25
2 3 4 5 10 11 16
µg
kg
-1
Laboratory Code
BDE 153
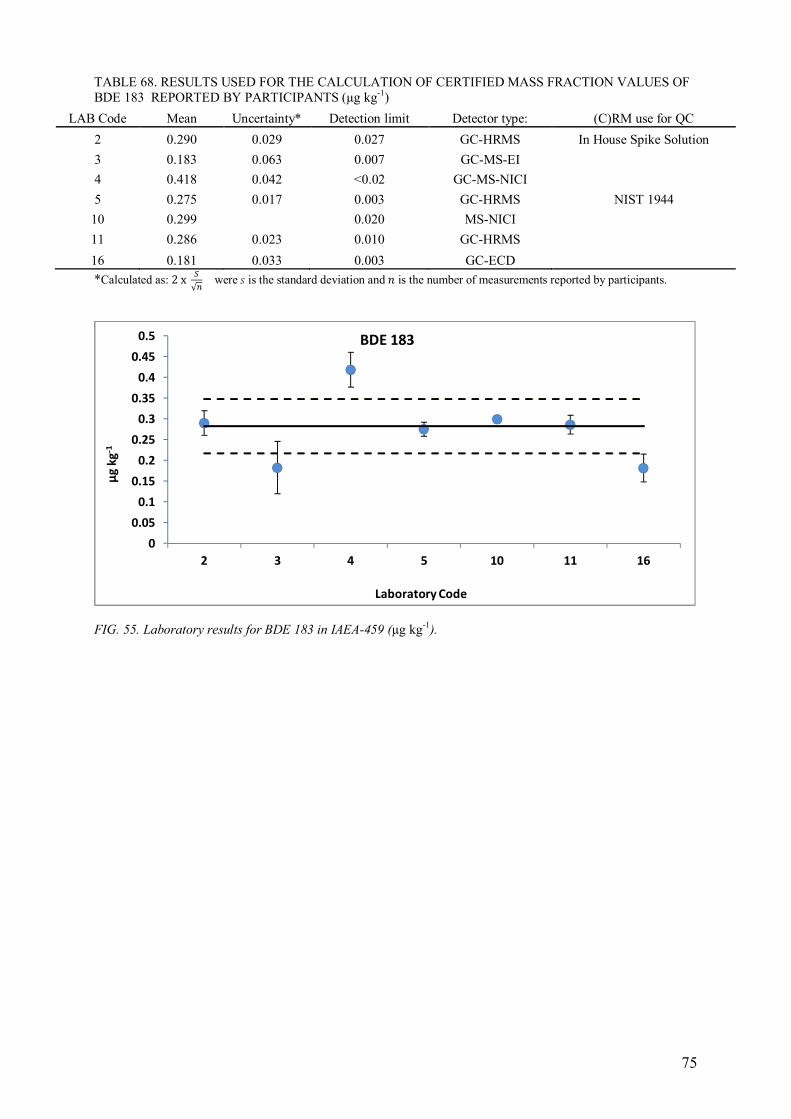
75
TABLE 68. RESULTS USED FOR THE CALCULATION OF CERTIFIED MASS FRACTION VALUES OF
BDE 183 REPORTED BY PARTICIPANTS (µg kg-1)
LAB Code Mean Uncertainty* Detection limit Detector type: (C)RM use for QC
2 0.290 0.029 0.027 GC-HRMS In House Spike Solution
3 0.183 0.063 0.007 GC-MS-EI
4 0.418 0.042 <0.02 GC-MS-NICI
5 0.275 0.017 0.003 GC-HRMS NIST 1944
10 0.299
0.020 MS-NICI
11 0.286 0.023 0.010 GC-HRMS
16 0.181 0.033 0.003 GC-ECD
*Calculated as: 2x =√> were ? is the standard deviation and @ is the number of measurements reported by participants.
FIG. 55. Laboratory results for BDE 183 in IAEA-459 (µg kg-1).
0
0.05
0.1
0.15
0.2
0.25
0.3
0.35
0.4
0.45
0.5
2 3 4 5 10 11 16
µg
kg
-1
Laboratory Code
BDE 183
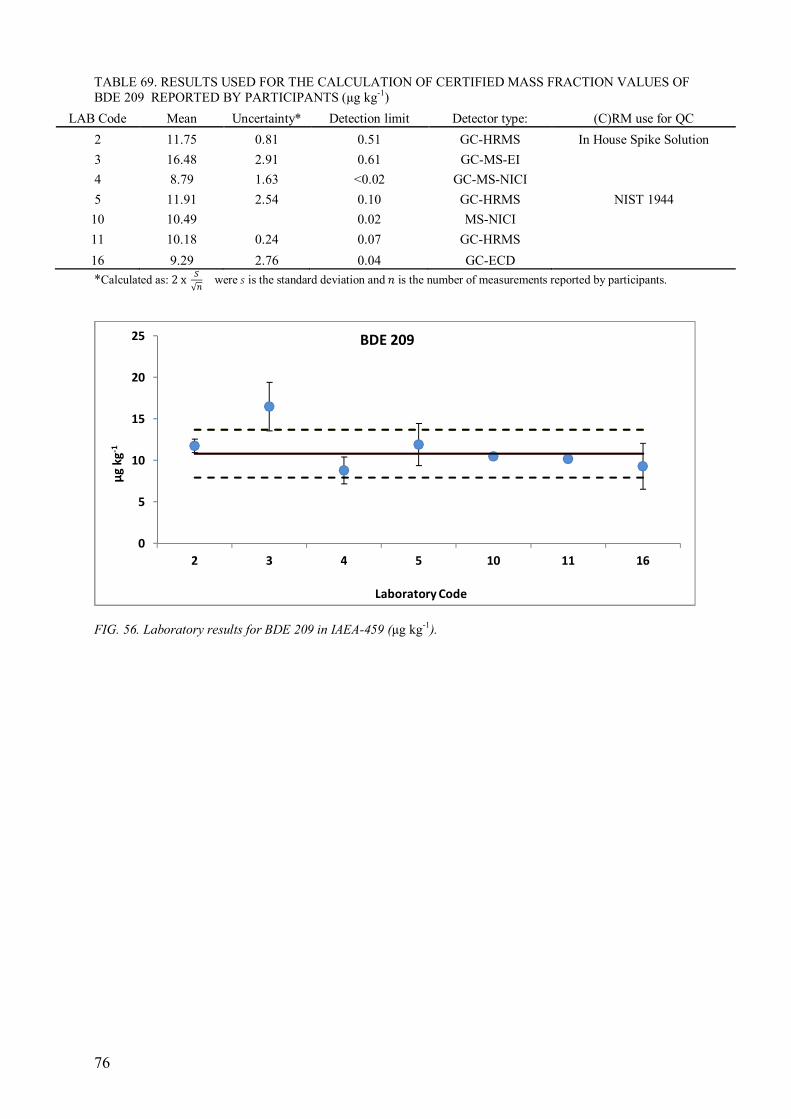
76
TABLE 69. RESULTS USED FOR THE CALCULATION OF CERTIFIED MASS FRACTION VALUES OF
BDE 209 REPORTED BY PARTICIPANTS (µg kg-1)
LAB Code Mean Uncertainty* Detection limit Detector type: (C)RM use for QC
2 11.75 0.81 0.51 GC-HRMS In House Spike Solution
3 16.48 2.91 0.61 GC-MS-EI
4 8.79 1.63 <0.02 GC-MS-NICI
5 11.91 2.54 0.10 GC-HRMS NIST 1944
10 10.49
0.02 MS-NICI
11 10.18 0.24 0.07 GC-HRMS
16 9.29 2.76 0.04 GC-ECD
*Calculated as: 2x =√> were ? is the standard deviation and @ is the number of measurements reported by participants.
FIG. 56. Laboratory results for BDE 209 in IAEA-459 (µg kg-1).
0
5
10
15
20
25
2 3 4 5 10 11 16
µg
kg
-1
Laboratory Code
BDE 209
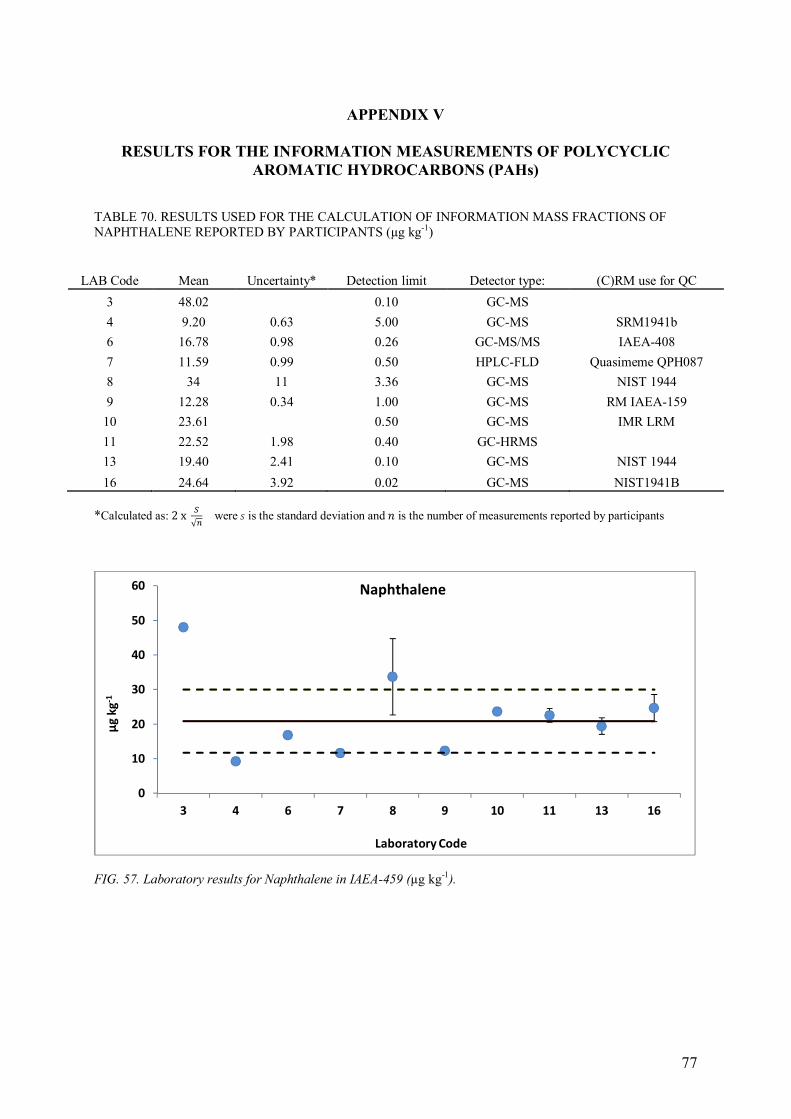
77
APPENDIX V
RESULTS FOR THE INFORMATION MEASUREMENTS OF POLYCYCLIC
AROMATIC HYDROCARBONS (PAHs)
TABLE 70. RESULTS USED FOR THE CALCULATION OF INFORMATION MASS FRACTIONS OF
NAPHTHALENE REPORTED BY PARTICIPANTS (µg kg-1)
*Calculated as: 2x =√> were ? is the standard deviation and @ is the number of measurements reported by participants
FIG. 57. Laboratory results for Naphthalene in IAEA-459 (µg kg-1).
0
10
20
30
40
50
60
3 4 6 7 8 9 10 11 13 16
µg
kg
-1
Laboratory Code
Naphthalene
LAB Code Mean Uncertainty* Detection limit Detector type: (C)RM use for QC
3 48.02
0.10 GC-MS
4 9.20 0.63 5.00 GC-MS SRM1941b
6 16.78 0.98 0.26 GC-MS/MS IAEA-408
7 11.59 0.99 0.50 HPLC-FLD Quasimeme QPH087
8 34 11 3.36 GC-MS NIST 1944
9 12.28 0.34 1.00 GC-MS RM IAEA-159
10 23.61
0.50 GC-MS IMR LRM
11 22.52 1.98 0.40 GC-HRMS 13 19.40 2.41 0.10 GC-MS NIST 1944
16 24.64 3.92 0.02 GC-MS NIST1941B
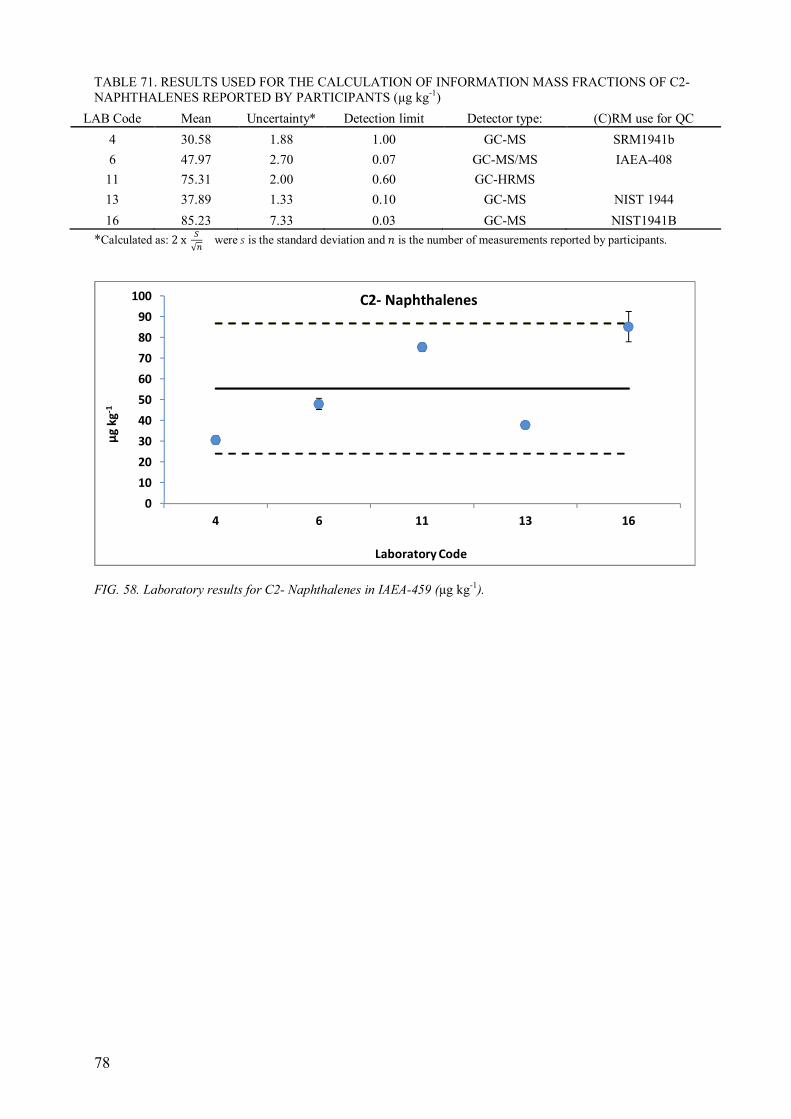
78
TABLE 71. RESULTS USED FOR THE CALCULATION OF INFORMATION MASS FRACTIONS OF C2-
NAPHTHALENES REPORTED BY PARTICIPANTS (µg kg-1)
LAB Code Mean Uncertainty* Detection limit Detector type: (C)RM use for QC
4 30.58 1.88 1.00 GC-MS SRM1941b
6 47.97 2.70 0.07 GC-MS/MS IAEA-408
11 75.31 2.00 0.60 GC-HRMS
13 37.89 1.33 0.10 GC-MS NIST 1944
16 85.23 7.33 0.03 GC-MS NIST1941B
*Calculated as: 2x =√> were ? is the standard deviation and @ is the number of measurements reported by participants.
FIG. 58. Laboratory results for C2- Naphthalenes in IAEA-459 (µg kg-1).
0
10
20
30
40
50
60
70
80
90
100
4 6 11 13 16
µg
kg
-1
Laboratory Code
C2- Naphthalenes
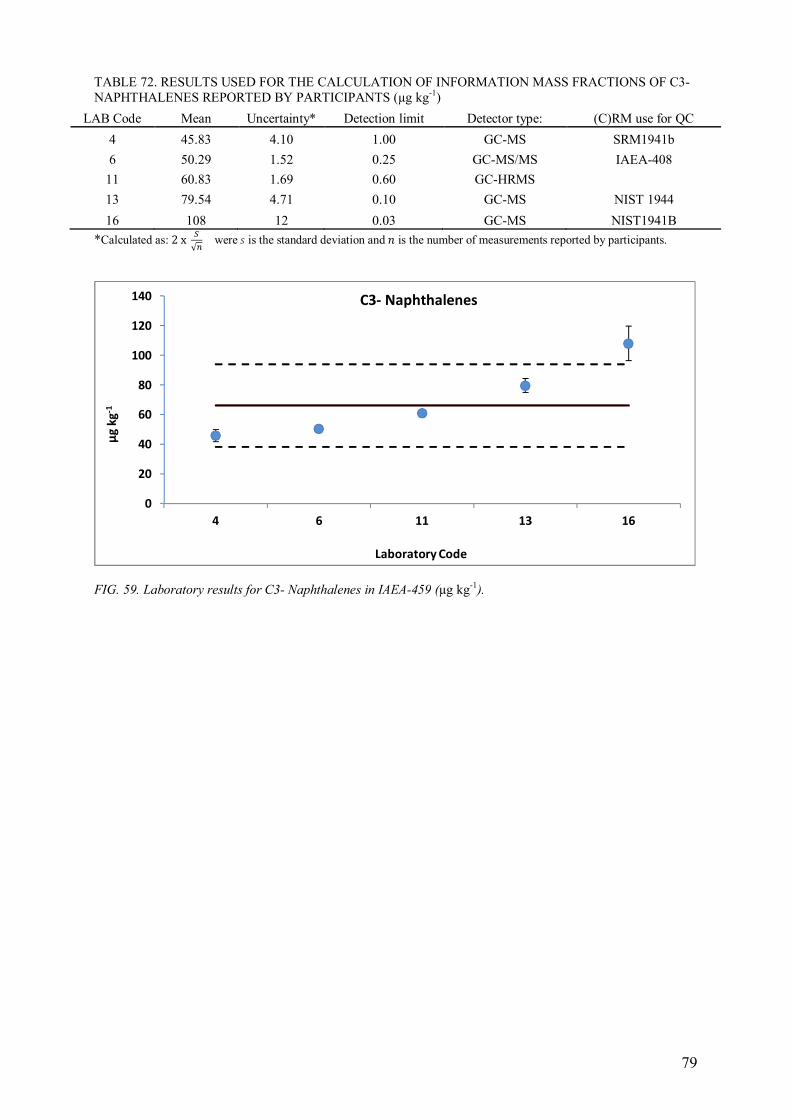
79
TABLE 72. RESULTS USED FOR THE CALCULATION OF INFORMATION MASS FRACTIONS OF C3-
NAPHTHALENES REPORTED BY PARTICIPANTS (µg kg-1)
LAB Code Mean Uncertainty* Detection limit Detector type: (C)RM use for QC
4 45.83 4.10 1.00 GC-MS SRM1941b
6 50.29 1.52 0.25 GC-MS/MS IAEA-408
11 60.83 1.69 0.60 GC-HRMS
13 79.54 4.71 0.10 GC-MS NIST 1944
16 108 12 0.03 GC-MS NIST1941B
*Calculated as: 2x =√> were ? is the standard deviation and @ is the number of measurements reported by participants.
FIG. 59. Laboratory results for C3- Naphthalenes in IAEA-459 (µg kg-1).
0
20
40
60
80
100
120
140
4 6 11 13 16
µg
kg
-1
Laboratory Code
C3- Naphthalenes
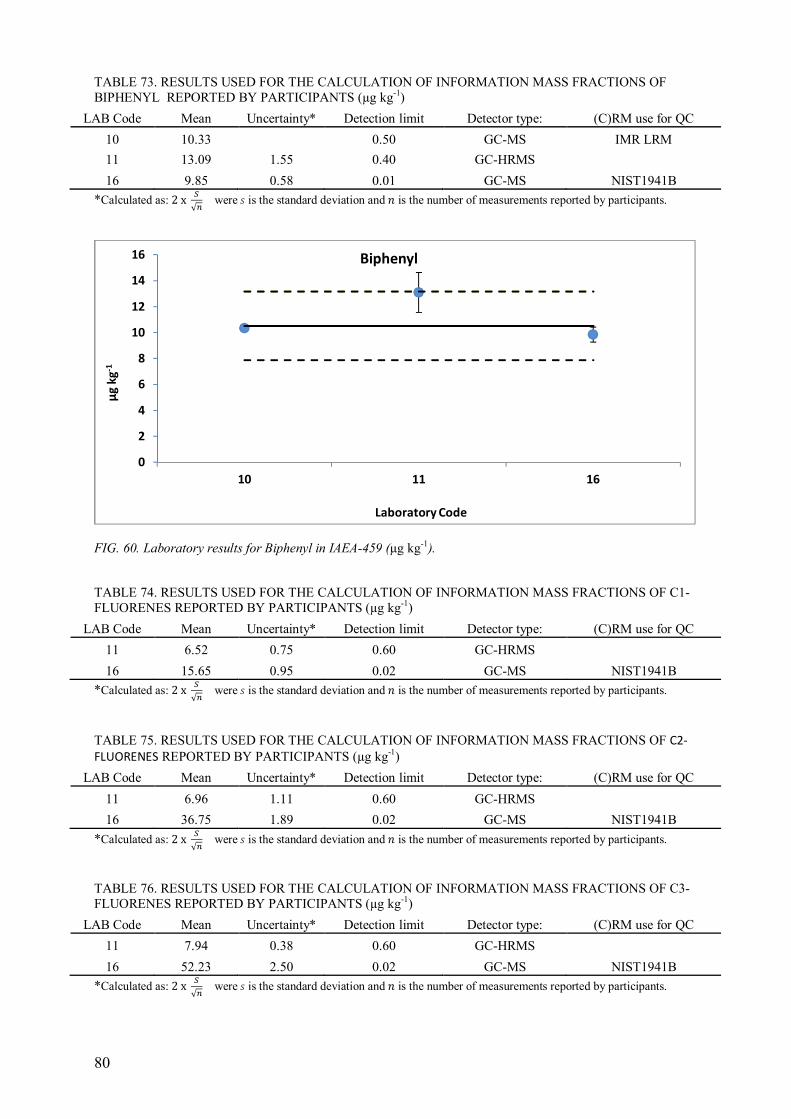
80
TABLE 73. RESULTS USED FOR THE CALCULATION OF INFORMATION MASS FRACTIONS OF
BIPHENYL REPORTED BY PARTICIPANTS (µg kg-1)
LAB Code Mean Uncertainty* Detection limit Detector type: (C)RM use for QC
10 10.33
0.50 GC-MS IMR LRM
11 13.09 1.55 0.40 GC-HRMS
16 9.85 0.58 0.01 GC-MS NIST1941B
*Calculated as: 2x =√> were ? is the standard deviation and @ is the number of measurements reported by participants.
FIG. 60. Laboratory results for Biphenyl in IAEA-459 (µg kg-1).
TABLE 74. RESULTS USED FOR THE CALCULATION OF INFORMATION MASS FRACTIONS OF C1-
FLUORENES REPORTED BY PARTICIPANTS (µg kg-1)
LAB Code Mean Uncertainty* Detection limit Detector type: (C)RM use for QC
11 6.52 0.75 0.60 GC-HRMS
16 15.65 0.95 0.02 GC-MS NIST1941B
*Calculated as: 2x =√> were ? is the standard deviation and @ is the number of measurements reported by participants.
TABLE 75. RESULTS USED FOR THE CALCULATION OF INFORMATION MASS FRACTIONS OF C2-
FLUORENES REPORTED BY PARTICIPANTS (µg kg-1)
LAB Code Mean Uncertainty* Detection limit Detector type: (C)RM use for QC
11 6.96 1.11 0.60 GC-HRMS
16 36.75 1.89 0.02 GC-MS NIST1941B
*Calculated as: 2x =√> were ? is the standard deviation and @ is the number of measurements reported by participants.
TABLE 76. RESULTS USED FOR THE CALCULATION OF INFORMATION MASS FRACTIONS OF C3-
FLUORENES REPORTED BY PARTICIPANTS (µg kg-1)
LAB Code Mean Uncertainty* Detection limit Detector type: (C)RM use for QC
11 7.94 0.38 0.60 GC-HRMS
16 52.23 2.50 0.02 GC-MS NIST1941B
*Calculated as: 2x =√> were ? is the standard deviation and @ is the number of measurements reported by participants.
0
2
4
6
8
10
12
14
16
10 11 16
µg
kg
-1
Laboratory Code
Biphenyl
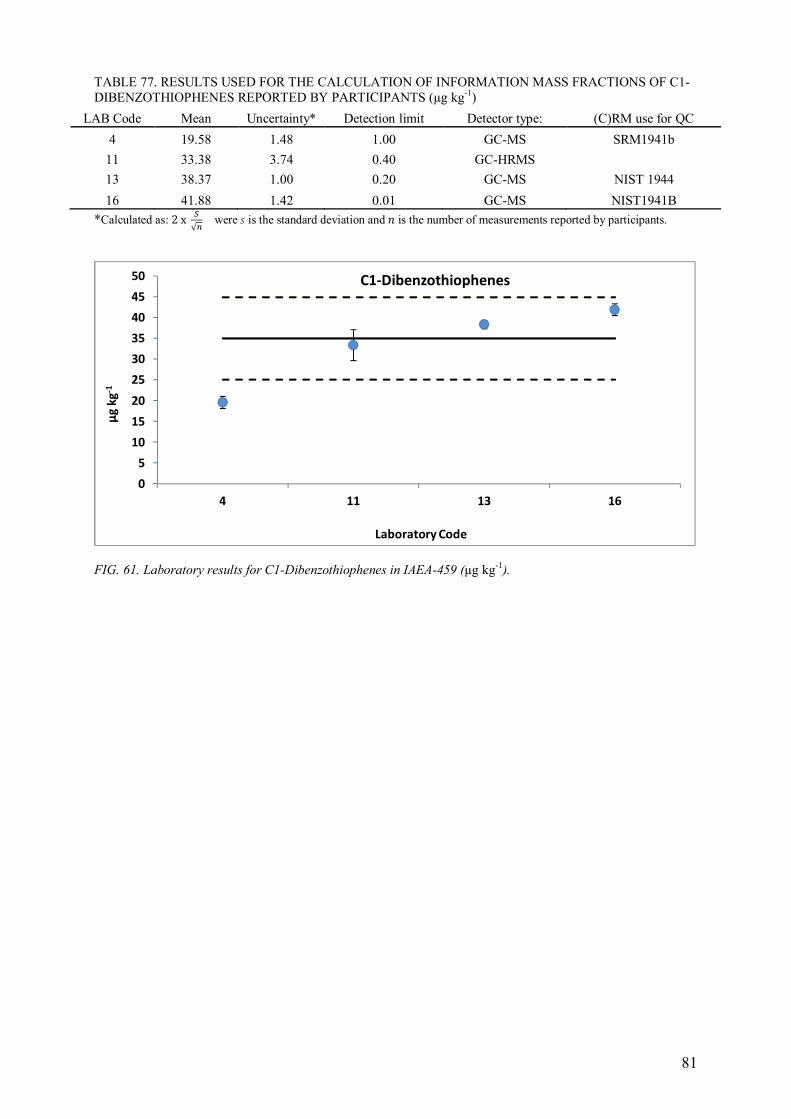
81
TABLE 77. RESULTS USED FOR THE CALCULATION OF INFORMATION MASS FRACTIONS OF C1-
DIBENZOTHIOPHENES REPORTED BY PARTICIPANTS (µg kg-1)
LAB Code Mean Uncertainty* Detection limit Detector type: (C)RM use for QC
4 19.58 1.48 1.00 GC-MS SRM1941b
11 33.38 3.74 0.40 GC-HRMS
13 38.37 1.00 0.20 GC-MS NIST 1944
16 41.88 1.42 0.01 GC-MS NIST1941B
*Calculated as: 2x =√> were ? is the standard deviation and @ is the number of measurements reported by participants.
FIG. 61. Laboratory results for C1-Dibenzothiophenes in IAEA-459 (µg kg-1).
0
5
10
15
20
25
30
35
40
45
50
4 11 13 16
µg
kg
-1
Laboratory Code
C1-Dibenzothiophenes
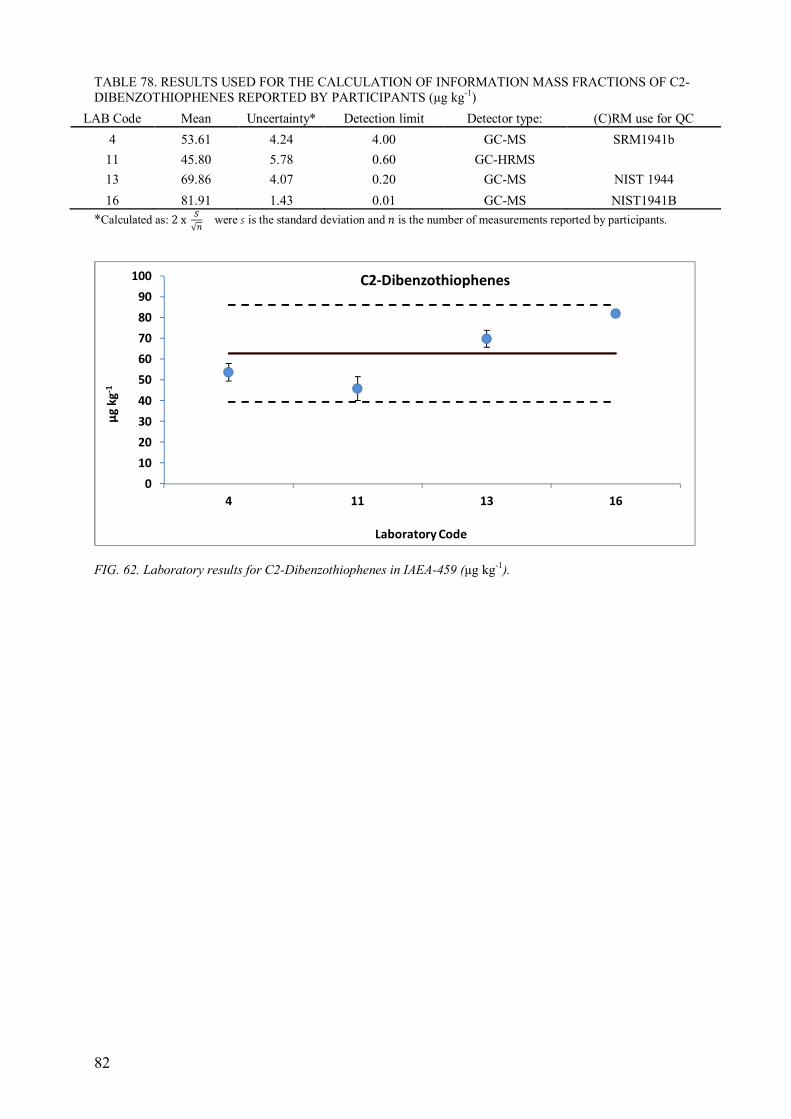
82
TABLE 78. RESULTS USED FOR THE CALCULATION OF INFORMATION MASS FRACTIONS OF C2-
DIBENZOTHIOPHENES REPORTED BY PARTICIPANTS (µg kg-1)
LAB Code Mean Uncertainty* Detection limit Detector type: (C)RM use for QC
4 53.61 4.24 4.00 GC-MS SRM1941b
11 45.80 5.78 0.60 GC-HRMS
13 69.86 4.07 0.20 GC-MS NIST 1944
16 81.91 1.43 0.01 GC-MS NIST1941B
*Calculated as: 2x =√> were ? is the standard deviation and @ is the number of measurements reported by participants.
FIG. 62. Laboratory results for C2-Dibenzothiophenes in IAEA-459 (µg kg-1).
0
10
20
30
40
50
60
70
80
90
100
4 11 13 16
µg
kg
-1
Laboratory Code
C2-Dibenzothiophenes
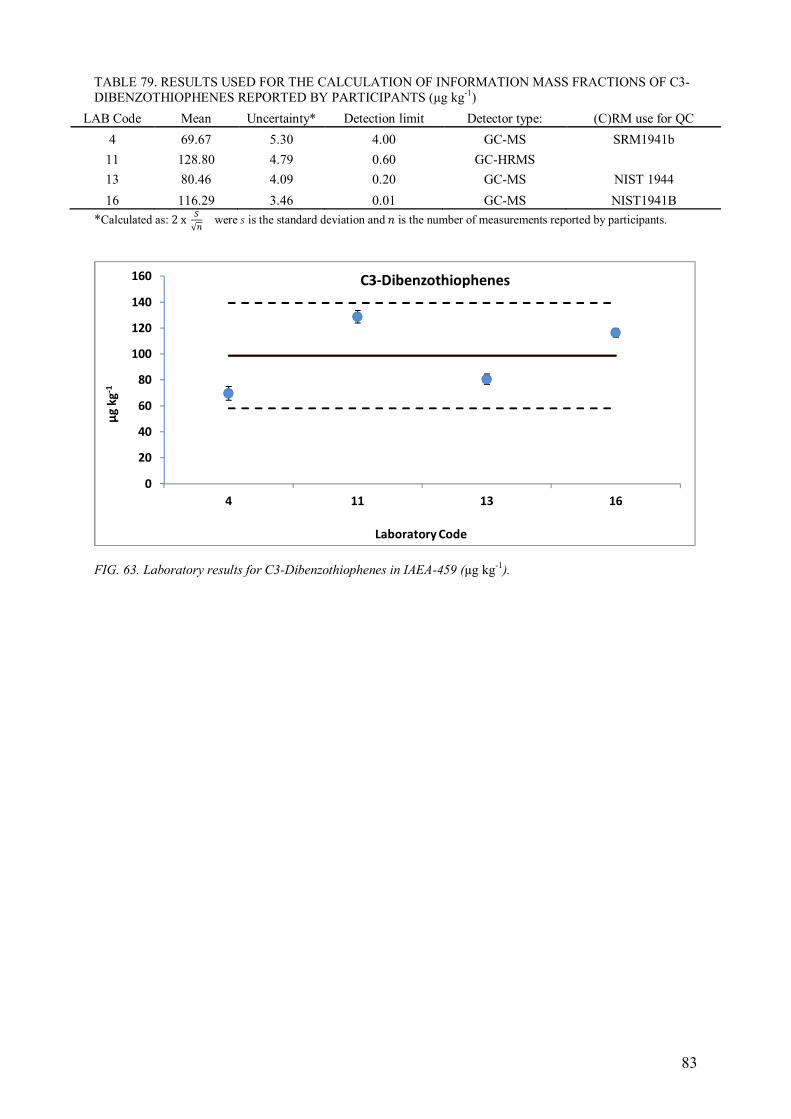
83
TABLE 79. RESULTS USED FOR THE CALCULATION OF INFORMATION MASS FRACTIONS OF C3-
DIBENZOTHIOPHENES REPORTED BY PARTICIPANTS (µg kg-1)
LAB Code Mean Uncertainty* Detection limit Detector type: (C)RM use for QC
4 69.67 5.30 4.00 GC-MS SRM1941b
11 128.80 4.79 0.60 GC-HRMS
13 80.46 4.09 0.20 GC-MS NIST 1944
16 116.29 3.46 0.01 GC-MS NIST1941B
*Calculated as: 2x =√> were ? is the standard deviation and @ is the number of measurements reported by participants.
FIG. 63. Laboratory results for C3-Dibenzothiophenes in IAEA-459 (µg kg-1).
0
20
40
60
80
100
120
140
160
4 11 13 16
µg
kg
-1
Laboratory Code
C3-Dibenzothiophenes
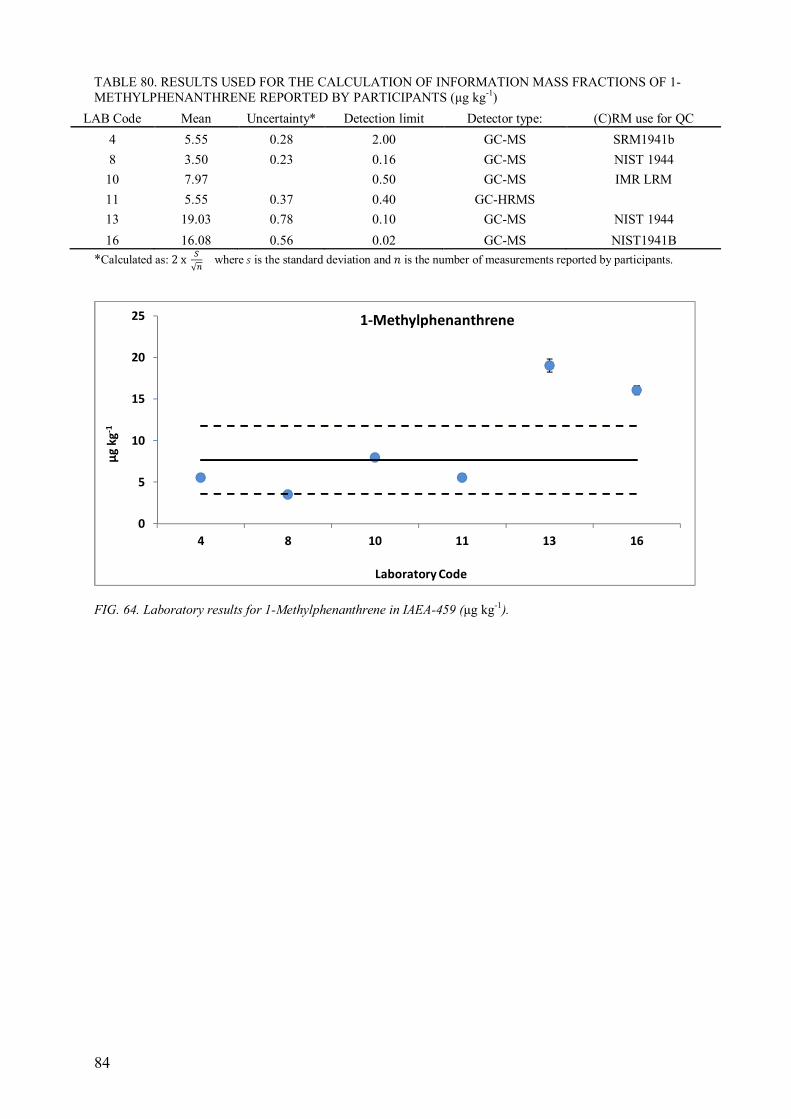
84
TABLE 80. RESULTS USED FOR THE CALCULATION OF INFORMATION MASS FRACTIONS OF 1-
METHYLPHENANTHRENE REPORTED BY PARTICIPANTS (µg kg-1)
LAB Code Mean Uncertainty* Detection limit Detector type: (C)RM use for QC
4 5.55 0.28 2.00 GC-MS SRM1941b
8 3.50 0.23 0.16 GC-MS NIST 1944
10 7.97
0.50 GC-MS IMR LRM
11 5.55 0.37 0.40 GC-HRMS
13 19.03 0.78 0.10 GC-MS NIST 1944
16 16.08 0.56 0.02 GC-MS NIST1941B
*Calculated as: 2x =√> where ? is the standard deviation and @ is the number of measurements reported by participants.
FIG. 64. Laboratory results for 1-Methylphenanthrene in IAEA-459 (µg kg-1).
0
5
10
15
20
25
4 8 10 11 13 16
µg
kg
-1
Laboratory Code
1-Methylphenanthrene
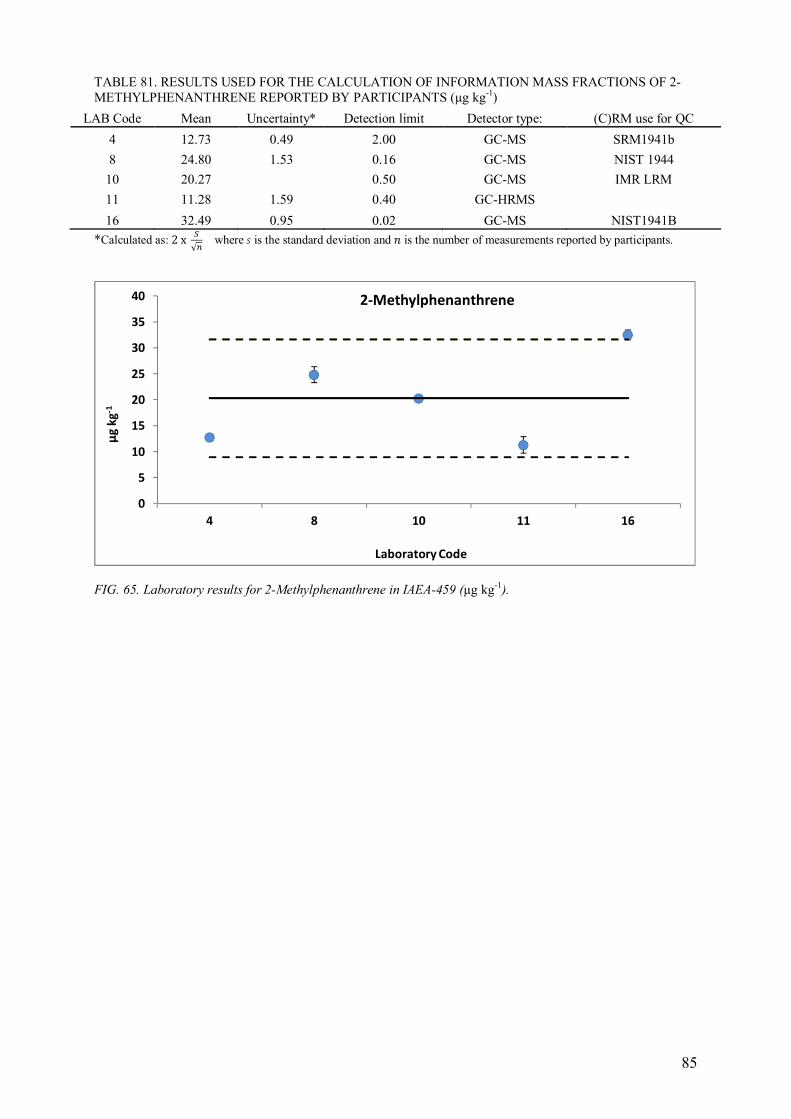
85
TABLE 81. RESULTS USED FOR THE CALCULATION OF INFORMATION MASS FRACTIONS OF 2-
METHYLPHENANTHRENE REPORTED BY PARTICIPANTS (µg kg-1)
LAB Code Mean Uncertainty* Detection limit Detector type: (C)RM use for QC
4 12.73 0.49 2.00 GC-MS SRM1941b
8 24.80 1.53 0.16 GC-MS NIST 1944
10 20.27
0.50 GC-MS IMR LRM
11 11.28 1.59 0.40 GC-HRMS
16 32.49 0.95 0.02 GC-MS NIST1941B
*Calculated as: 2x =√> where ? is the standard deviation and @ is the number of measurements reported by participants.
FIG. 65. Laboratory results for 2-Methylphenanthrene in IAEA-459 (µg kg-1).
0
5
10
15
20
25
30
35
40
4 8 10 11 16
µg
kg
-1
Laboratory Code
2-Methylphenanthrene
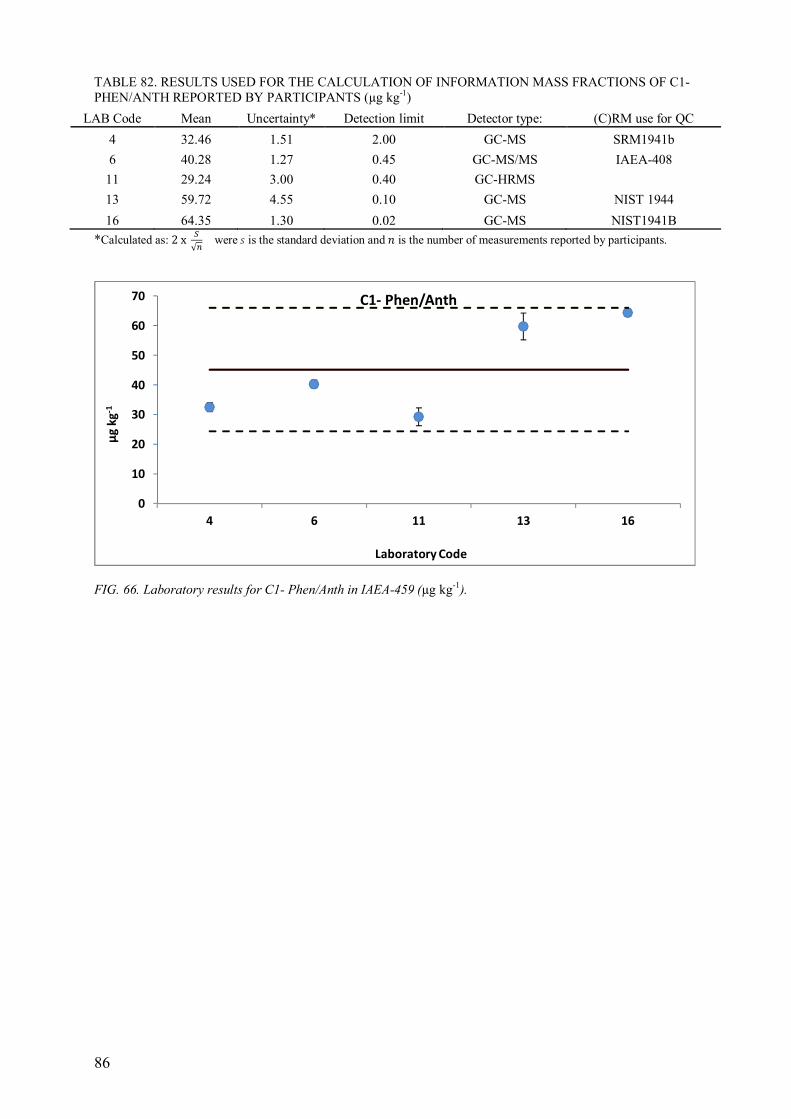
86
TABLE 82. RESULTS USED FOR THE CALCULATION OF INFORMATION MASS FRACTIONS OF C1-
PHEN/ANTH REPORTED BY PARTICIPANTS (µg kg-1)
LAB Code Mean Uncertainty* Detection limit Detector type: (C)RM use for QC
4 32.46 1.51 2.00 GC-MS SRM1941b
6 40.28 1.27 0.45 GC-MS/MS IAEA-408
11 29.24 3.00 0.40 GC-HRMS
13 59.72 4.55 0.10 GC-MS NIST 1944
16 64.35 1.30 0.02 GC-MS NIST1941B
*Calculated as: 2x =√> were ? is the standard deviation and @ is the number of measurements reported by participants.
FIG. 66. Laboratory results for C1- Phen/Anth in IAEA-459 (µg kg-1).
0
10
20
30
40
50
60
70
4 6 11 13 16
µg
kg
-1
Laboratory Code
C1- Phen/Anth
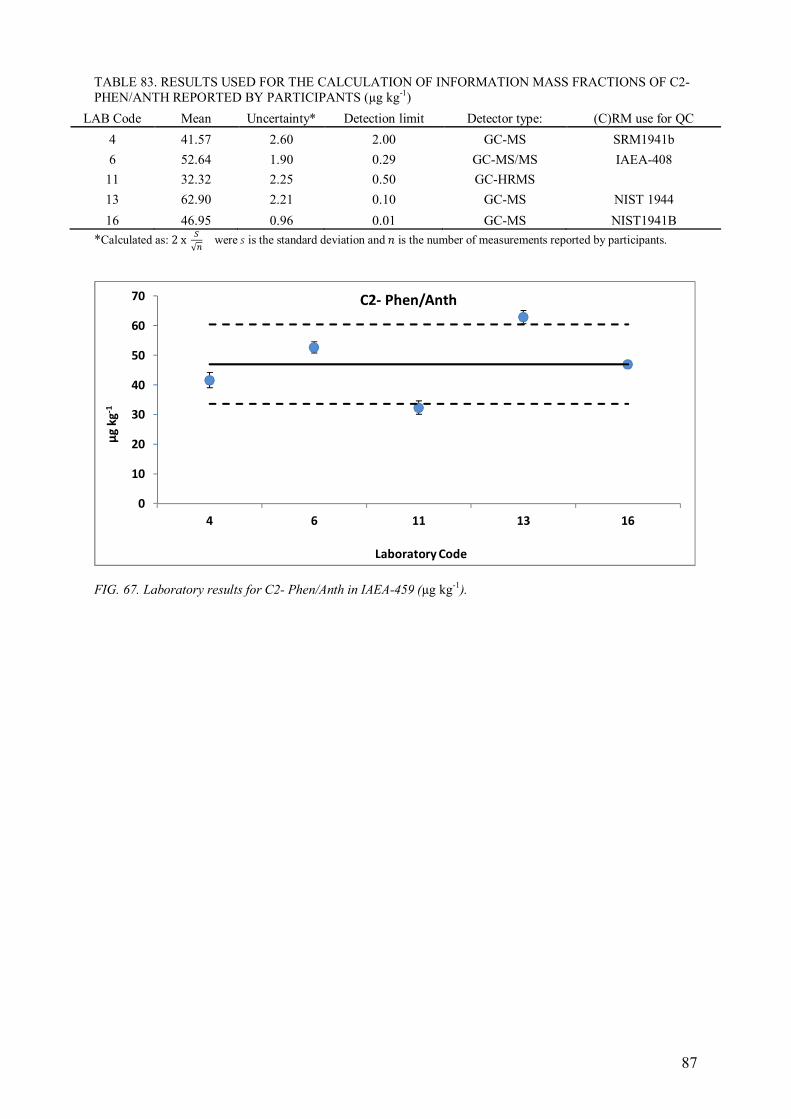
87
TABLE 83. RESULTS USED FOR THE CALCULATION OF INFORMATION MASS FRACTIONS OF C2-
PHEN/ANTH REPORTED BY PARTICIPANTS (µg kg-1)
LAB Code Mean Uncertainty* Detection limit Detector type: (C)RM use for QC
4 41.57 2.60 2.00 GC-MS SRM1941b
6 52.64 1.90 0.29 GC-MS/MS IAEA-408
11 32.32 2.25 0.50 GC-HRMS
13 62.90 2.21 0.10 GC-MS NIST 1944
16 46.95 0.96 0.01 GC-MS NIST1941B
*Calculated as: 2x =√> were ? is the standard deviation and @ is the number of measurements reported by participants.
FIG. 67. Laboratory results for C2- Phen/Anth in IAEA-459 (µg kg-1).
0
10
20
30
40
50
60
70
4 6 11 13 16
µg
kg
-1
Laboratory Code
C2- Phen/Anth
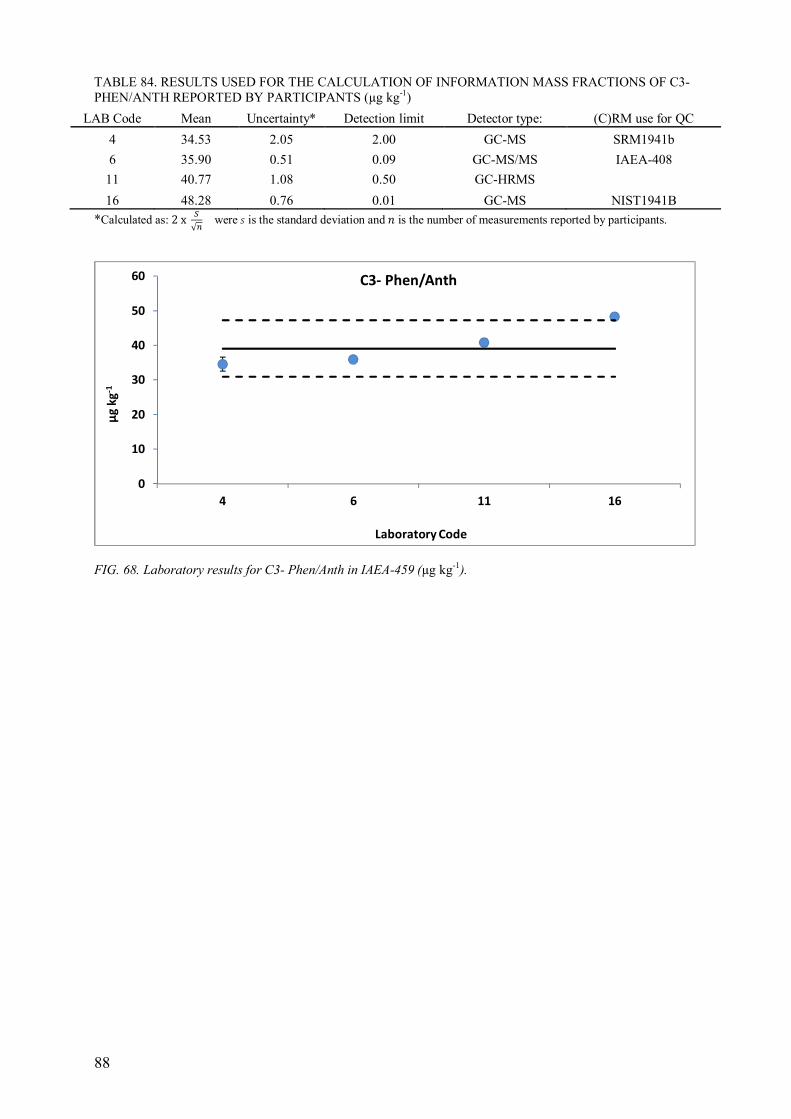
88
TABLE 84. RESULTS USED FOR THE CALCULATION OF INFORMATION MASS FRACTIONS OF C3-
PHEN/ANTH REPORTED BY PARTICIPANTS (µg kg-1)
LAB Code Mean Uncertainty* Detection limit Detector type: (C)RM use for QC
4 34.53 2.05 2.00 GC-MS SRM1941b
6 35.90 0.51 0.09 GC-MS/MS IAEA-408
11 40.77 1.08 0.50 GC-HRMS
16 48.28 0.76 0.01 GC-MS NIST1941B
*Calculated as: 2x =√> were ? is the standard deviation and @ is the number of measurements reported by participants.
FIG. 68. Laboratory results for C3- Phen/Anth in IAEA-459 (µg kg-1).
0
10
20
30
40
50
60
4 6 11 16
µg
kg
-1
Laboratory Code
C3- Phen/Anth
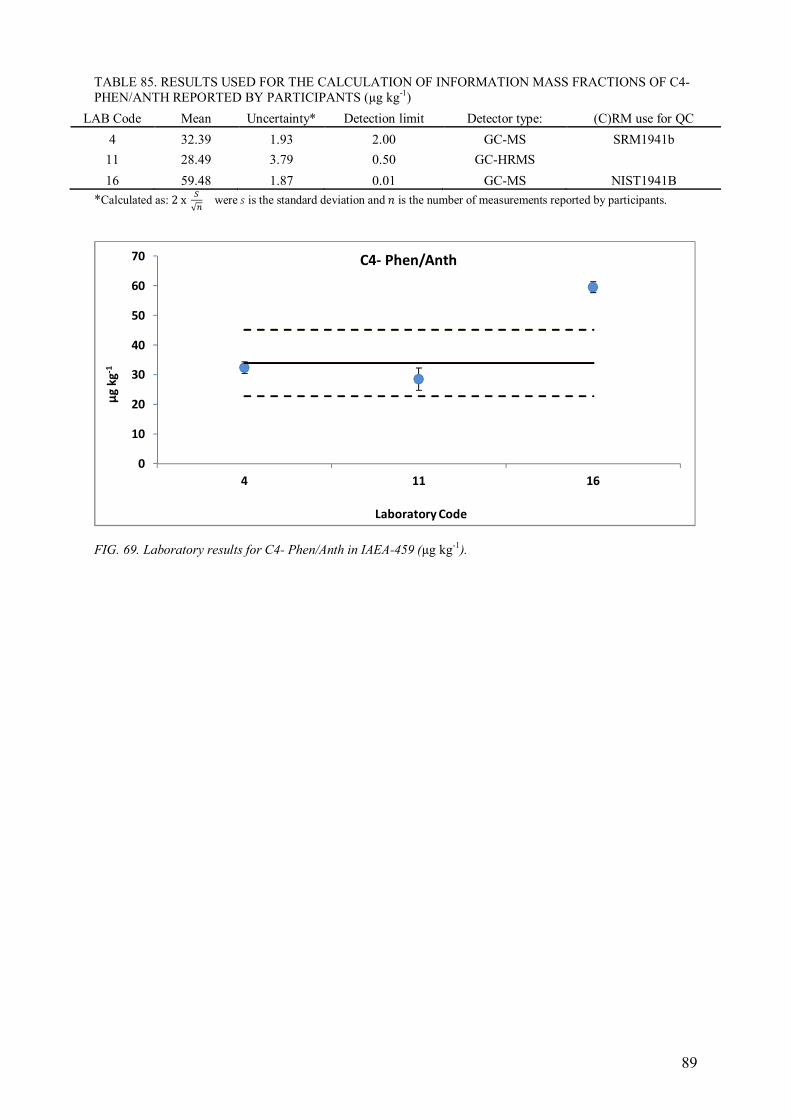
89
TABLE 85. RESULTS USED FOR THE CALCULATION OF INFORMATION MASS FRACTIONS OF C4-
PHEN/ANTH REPORTED BY PARTICIPANTS (µg kg-1)
LAB Code Mean Uncertainty* Detection limit Detector type: (C)RM use for QC
4 32.39 1.93 2.00 GC-MS SRM1941b
11 28.49 3.79 0.50 GC-HRMS
16 59.48 1.87 0.01 GC-MS NIST1941B
*Calculated as: 2x =√> were ? is the standard deviation and @ is the number of measurements reported by participants.
FIG. 69. Laboratory results for C4- Phen/Anth in IAEA-459 (µg kg-1).
0
10
20
30
40
50
60
70
4 11 16
µg
kg
-1
Laboratory Code
C4- Phen/Anth
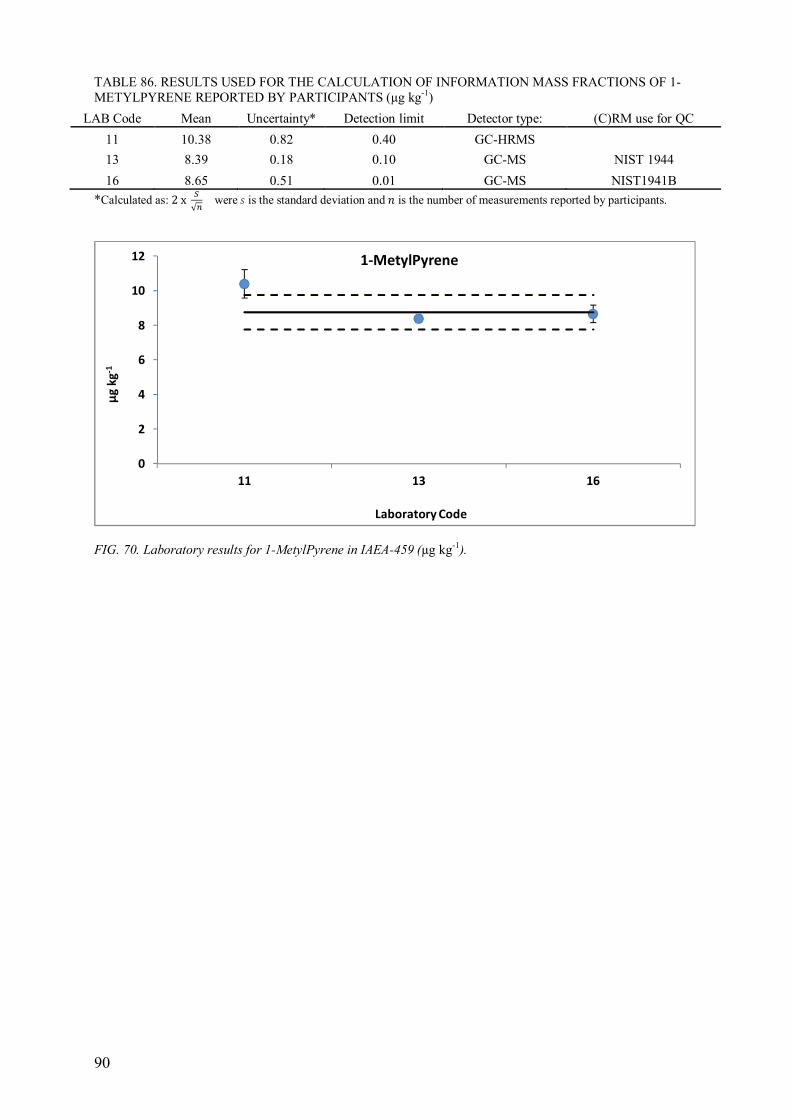
90
TABLE 86. RESULTS USED FOR THE CALCULATION OF INFORMATION MASS FRACTIONS OF 1-
METYLPYRENE REPORTED BY PARTICIPANTS (µg kg-1)
LAB Code Mean Uncertainty* Detection limit Detector type: (C)RM use for QC
11 10.38 0.82 0.40 GC-HRMS
13 8.39 0.18 0.10 GC-MS NIST 1944
16 8.65 0.51 0.01 GC-MS NIST1941B
*Calculated as: 2x =√> were ? is the standard deviation and @ is the number of measurements reported by participants.
FIG. 70. Laboratory results for 1-MetylPyrene in IAEA-459 (µg kg-1).
0
2
4
6
8
10
12
11 13 16
µg
kg
-1
Laboratory Code
1-MetylPyrene
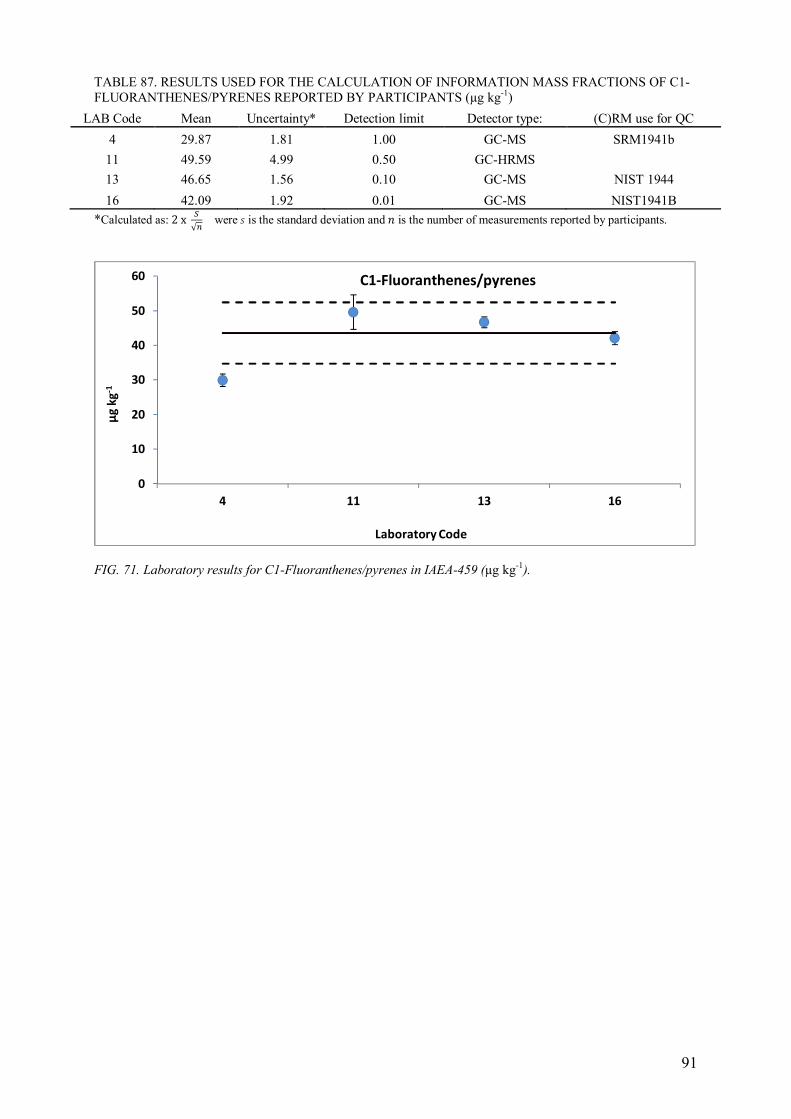
91
TABLE 87. RESULTS USED FOR THE CALCULATION OF INFORMATION MASS FRACTIONS OF C1-
FLUORANTHENES/PYRENES REPORTED BY PARTICIPANTS (µg kg-1)
LAB Code Mean Uncertainty* Detection limit Detector type: (C)RM use for QC
4 29.87 1.81 1.00 GC-MS SRM1941b
11 49.59 4.99 0.50 GC-HRMS
13 46.65 1.56 0.10 GC-MS NIST 1944
16 42.09 1.92 0.01 GC-MS NIST1941B
*Calculated as: 2x =√> were ? is the standard deviation and @ is the number of measurements reported by participants.
FIG. 71. Laboratory results for C1-Fluoranthenes/pyrenes in IAEA-459 (µg kg-1).
0
10
20
30
40
50
60
4 11 13 16
µg
kg
-1
Laboratory Code
C1-Fluoranthenes/pyrenes
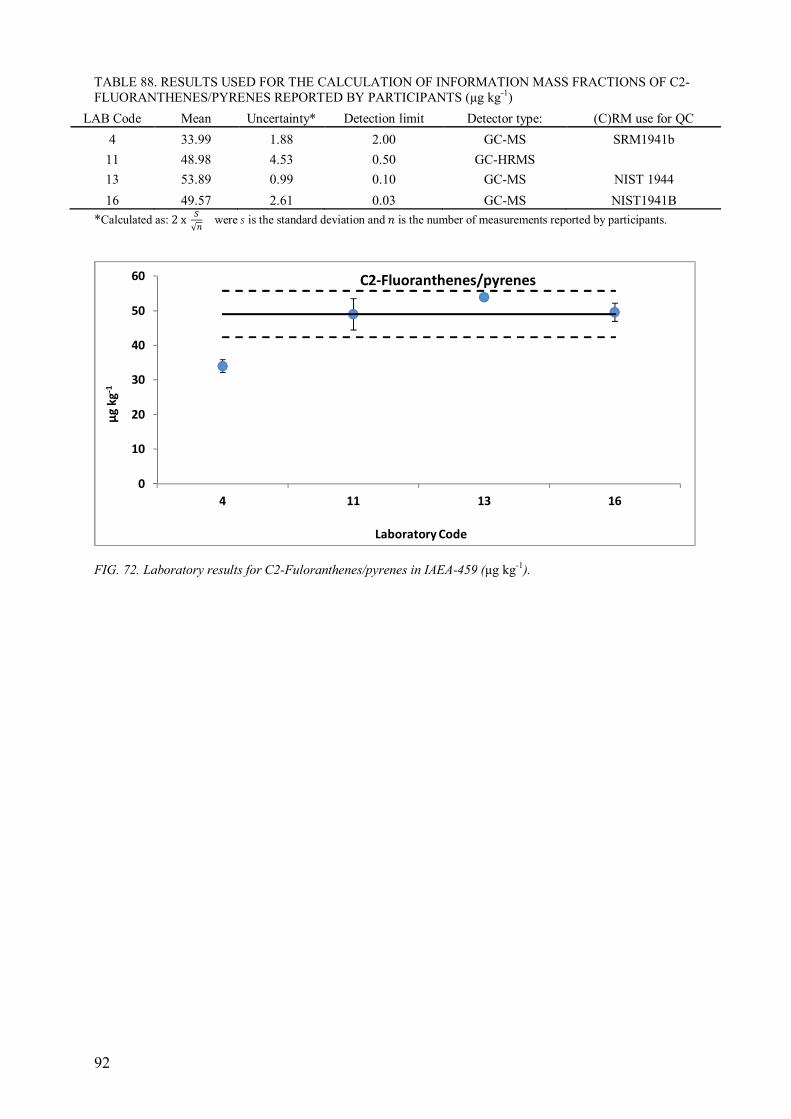
92
TABLE 88. RESULTS USED FOR THE CALCULATION OF INFORMATION MASS FRACTIONS OF C2-
FLUORANTHENES/PYRENES REPORTED BY PARTICIPANTS (µg kg-1)
LAB Code Mean Uncertainty* Detection limit Detector type: (C)RM use for QC
4 33.99 1.88 2.00 GC-MS SRM1941b
11 48.98 4.53 0.50 GC-HRMS
13 53.89 0.99 0.10 GC-MS NIST 1944
16 49.57 2.61 0.03 GC-MS NIST1941B
*Calculated as: 2x =√> were ? is the standard deviation and @ is the number of measurements reported by participants.
FIG. 72. Laboratory results for C2-Fuloranthenes/pyrenes in IAEA-459 (µg kg-1).
0
10
20
30
40
50
60
4 11 13 16
µg
kg
-1
Laboratory Code
C2-Fluoranthenes/pyrenes
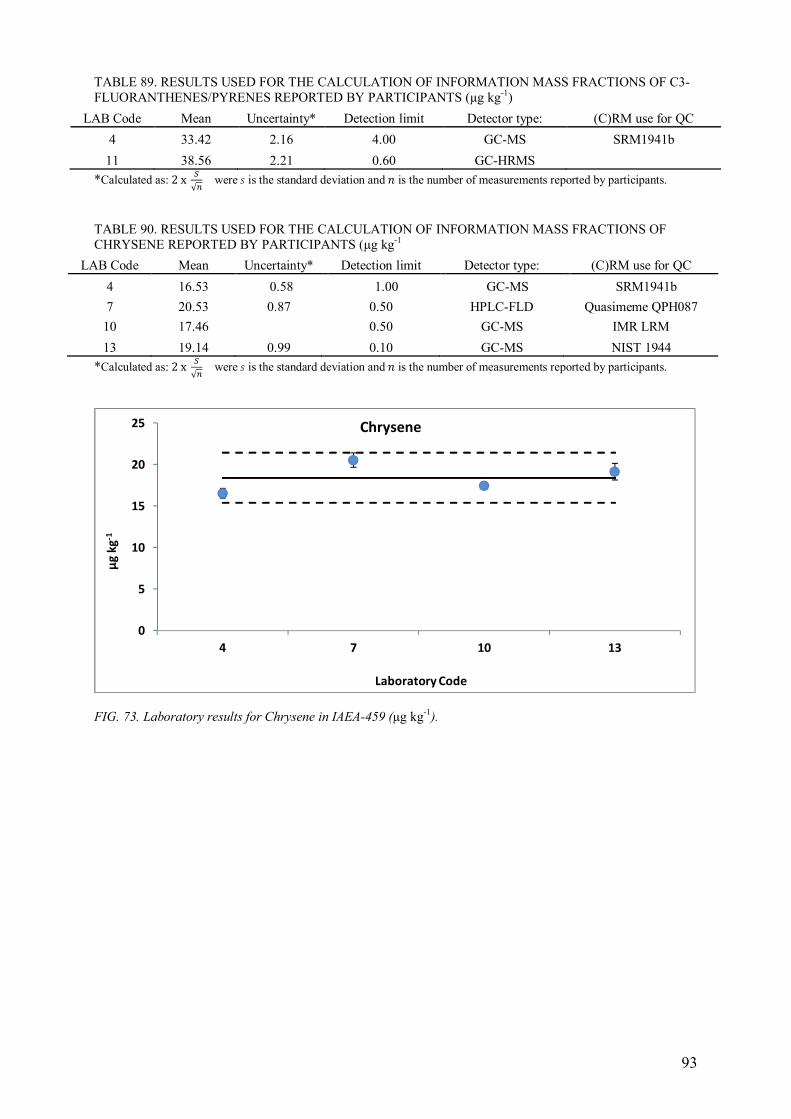
93
TABLE 89. RESULTS USED FOR THE CALCULATION OF INFORMATION MASS FRACTIONS OF C3-
FLUORANTHENES/PYRENES REPORTED BY PARTICIPANTS (µg kg-1)
LAB Code Mean Uncertainty* Detection limit Detector type: (C)RM use for QC
4 33.42 2.16 4.00 GC-MS SRM1941b
11 38.56 2.21 0.60 GC-HRMS
*Calculated as: 2x =√> were ? is the standard deviation and @ is the number of measurements reported by participants.
TABLE 90. RESULTS USED FOR THE CALCULATION OF INFORMATION MASS FRACTIONS OF
CHRYSENE REPORTED BY PARTICIPANTS (µg kg-1
LAB Code Mean Uncertainty* Detection limit Detector type: (C)RM use for QC
4 16.53 0.58 1.00 GC-MS SRM1941b
7 20.53 0.87 0.50 HPLC-FLD Quasimeme QPH087
10 17.46
0.50 GC-MS IMR LRM
13 19.14 0.99 0.10 GC-MS NIST 1944
*Calculated as: 2x =√> were ? is the standard deviation and @ is the number of measurements reported by participants.
FIG. 73. Laboratory results for Chrysene in IAEA-459 (µg kg-1).
0
5
10
15
20
25
4 7 10 13
µg
kg
-1
Laboratory Code
Chrysene
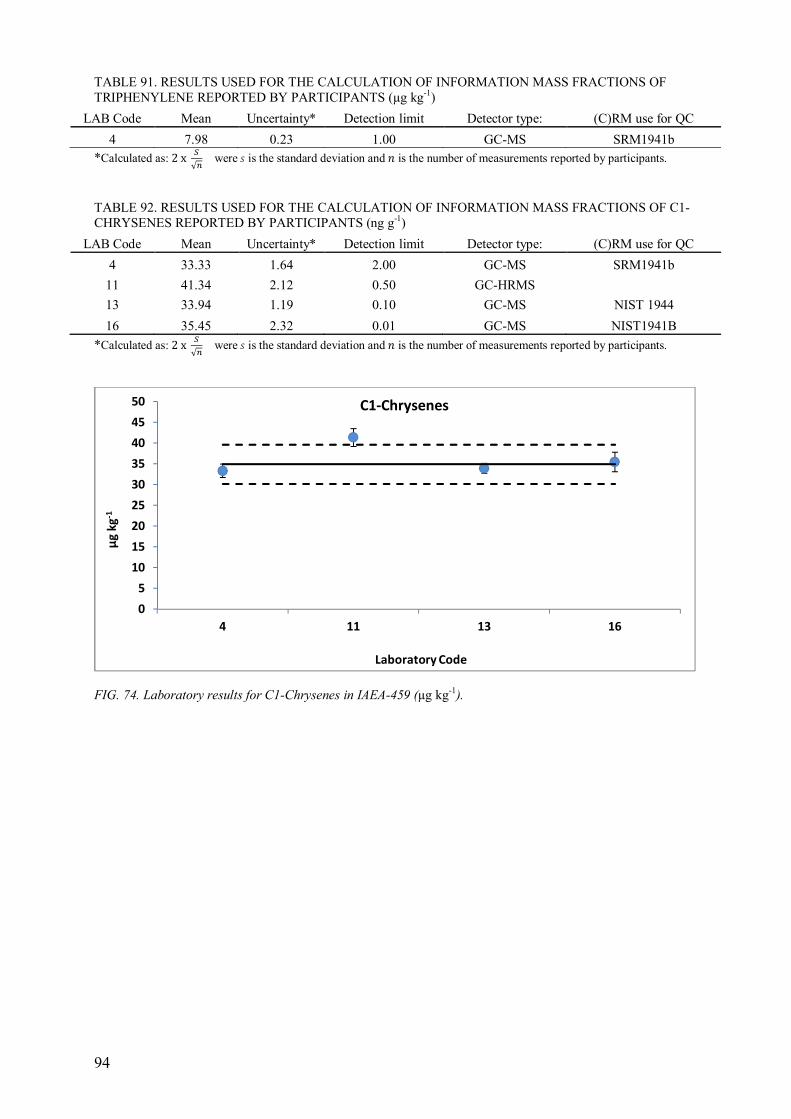
94
TABLE 91. RESULTS USED FOR THE CALCULATION OF INFORMATION MASS FRACTIONS OF
TRIPHENYLENE REPORTED BY PARTICIPANTS (µg kg-1)
LAB Code Mean Uncertainty* Detection limit Detector type: (C)RM use for QC
4 7.98 0.23 1.00 GC-MS SRM1941b
*Calculated as: 2x =√> were ? is the standard deviation and @ is the number of measurements reported by participants.
TABLE 92. RESULTS USED FOR THE CALCULATION OF INFORMATION MASS FRACTIONS OF C1-
CHRYSENES REPORTED BY PARTICIPANTS (ng g-1)
LAB Code Mean Uncertainty* Detection limit Detector type: (C)RM use for QC
4 33.33 1.64 2.00 GC-MS SRM1941b
11 41.34 2.12 0.50 GC-HRMS
13 33.94 1.19 0.10 GC-MS NIST 1944
16 35.45 2.32 0.01 GC-MS NIST1941B
*Calculated as: 2x =√> were ? is the standard deviation and @ is the number of measurements reported by participants.
FIG. 74. Laboratory results for C1-Chrysenes in IAEA-459 (µg kg-1).
0
5
10
15
20
25
30
35
40
45
50
4 11 13 16
µg
kg
-1
Laboratory Code
C1-Chrysenes
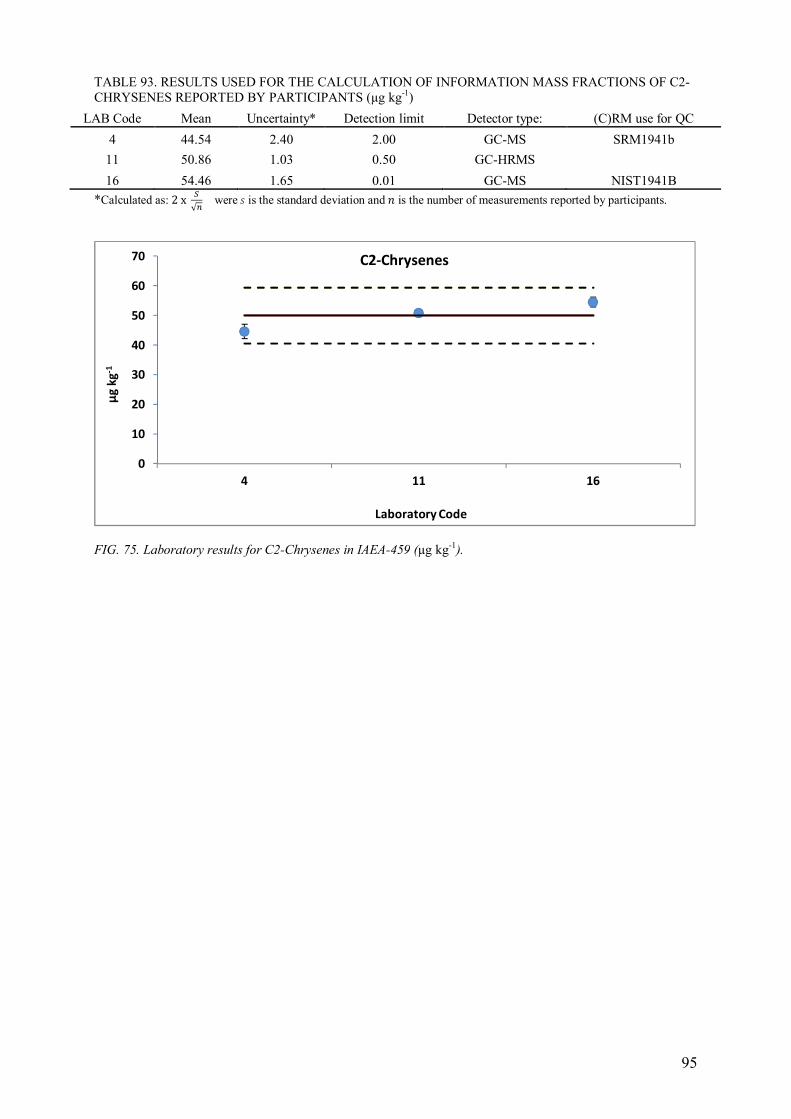
95
TABLE 93. RESULTS USED FOR THE CALCULATION OF INFORMATION MASS FRACTIONS OF C2-
CHRYSENES REPORTED BY PARTICIPANTS (µg kg-1)
LAB Code Mean Uncertainty* Detection limit Detector type: (C)RM use for QC
4 44.54 2.40 2.00 GC-MS SRM1941b
11 50.86 1.03 0.50 GC-HRMS
16 54.46 1.65 0.01 GC-MS NIST1941B
*Calculated as: 2x =√> were ? is the standard deviation and @ is the number of measurements reported by participants.
FIG. 75. Laboratory results for C2-Chrysenes in IAEA-459 (µg kg-1).
0
10
20
30
40
50
60
70
4 11 16
µg
kg
-1
Laboratory Code
C2-Chrysenes
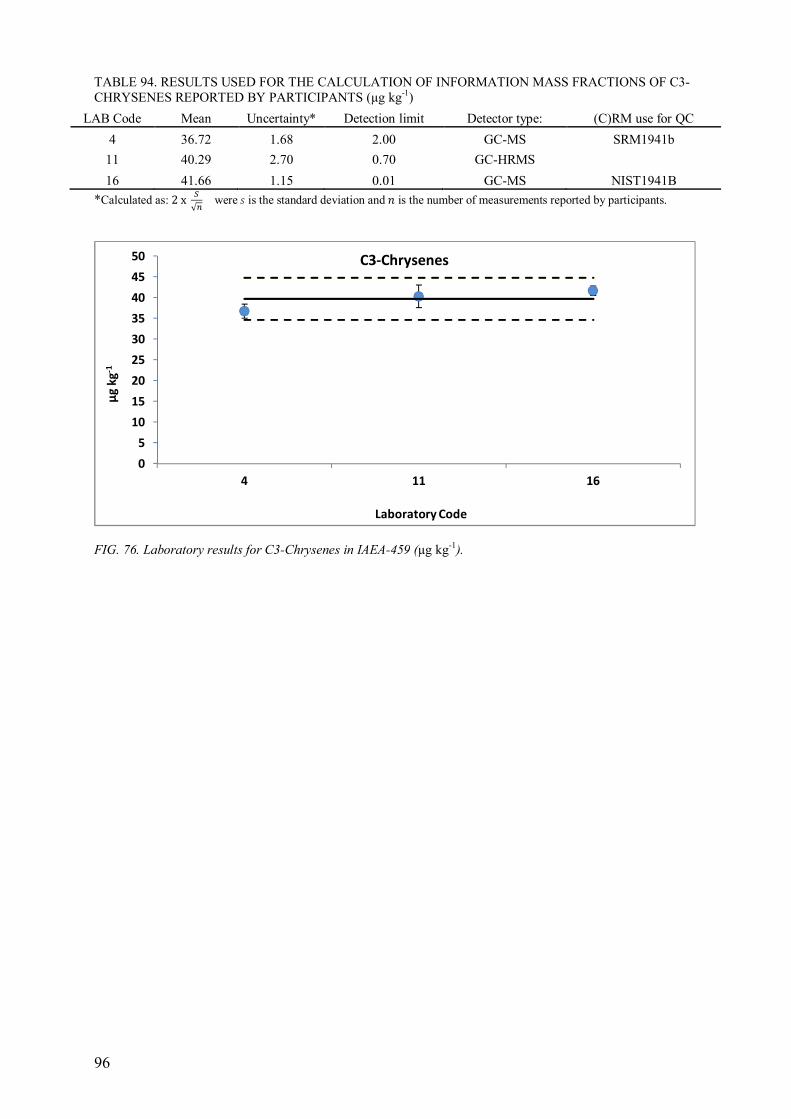
96
TABLE 94. RESULTS USED FOR THE CALCULATION OF INFORMATION MASS FRACTIONS OF C3-
CHRYSENES REPORTED BY PARTICIPANTS (µg kg-1)
LAB Code Mean Uncertainty* Detection limit Detector type: (C)RM use for QC
4 36.72 1.68 2.00 GC-MS SRM1941b
11 40.29 2.70 0.70 GC-HRMS
16 41.66 1.15 0.01 GC-MS NIST1941B
*Calculated as: 2x =√> were ? is the standard deviation and @ is the number of measurements reported by participants.
FIG. 76. Laboratory results for C3-Chrysenes in IAEA-459 (µg kg-1).
0
5
10
15
20
25
30
35
40
45
50
4 11 16
µg
kg
-1
Laboratory Code
C3-Chrysenes
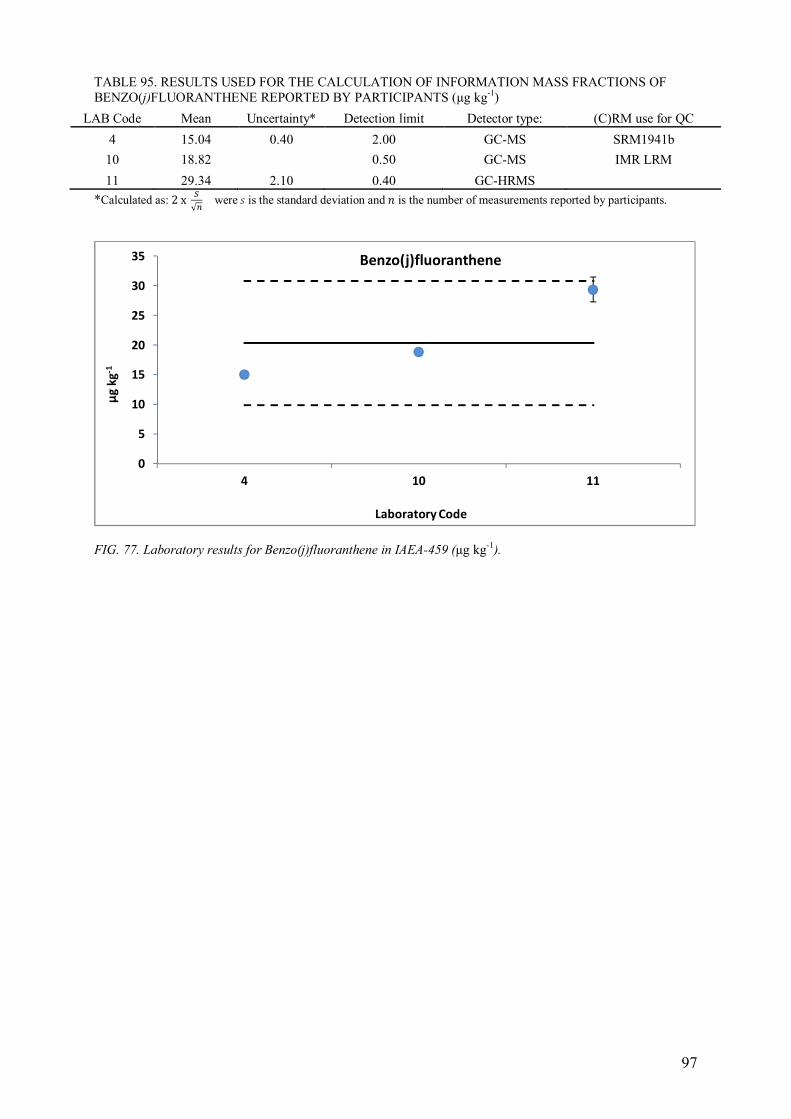
97
TABLE 95. RESULTS USED FOR THE CALCULATION OF INFORMATION MASS FRACTIONS OF
BENZO(j)FLUORANTHENE REPORTED BY PARTICIPANTS (µg kg-1)
LAB Code Mean Uncertainty* Detection limit Detector type: (C)RM use for QC
4 15.04 0.40 2.00 GC-MS SRM1941b
10 18.82
0.50 GC-MS IMR LRM
11 29.34 2.10 0.40 GC-HRMS
*Calculated as: 2x =√> were ? is the standard deviation and @ is the number of measurements reported by participants.
FIG. 77. Laboratory results for Benzo(j)fluoranthene in IAEA-459 (µg kg-1).
0
5
10
15
20
25
30
35
4 10 11
µg
kg
-1
Laboratory Code
Benzo(j)fluoranthene
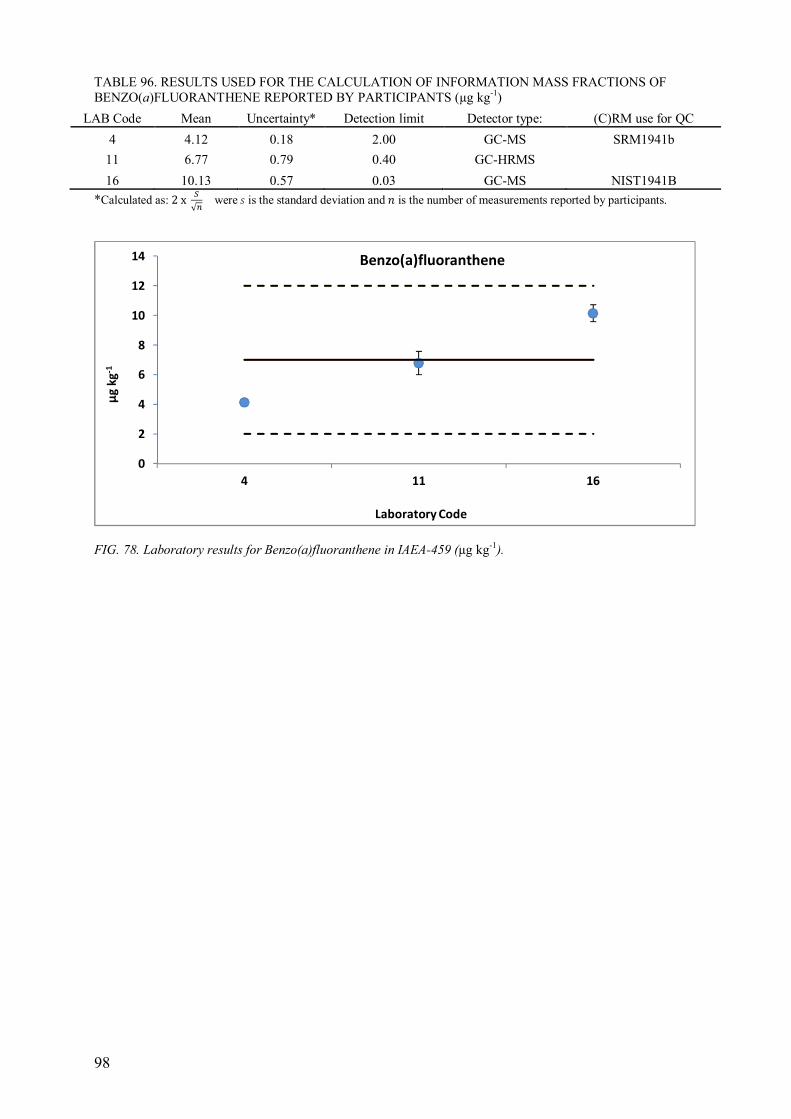
98
TABLE 96. RESULTS USED FOR THE CALCULATION OF INFORMATION MASS FRACTIONS OF
BENZO(a)FLUORANTHENE REPORTED BY PARTICIPANTS (µg kg-1)
LAB Code Mean Uncertainty* Detection limit Detector type: (C)RM use for QC
4 4.12 0.18 2.00 GC-MS SRM1941b
11 6.77 0.79 0.40 GC-HRMS
16 10.13 0.57 0.03 GC-MS NIST1941B
*Calculated as: 2x =√> were ? is the standard deviation and @ is the number of measurements reported by participants.
FIG. 78. Laboratory results for Benzo(a)fluoranthene in IAEA-459 (µg kg-1).
0
2
4
6
8
10
12
14
4 11 16
µg
kg
-1
Laboratory Code
Benzo(a)fluoranthene
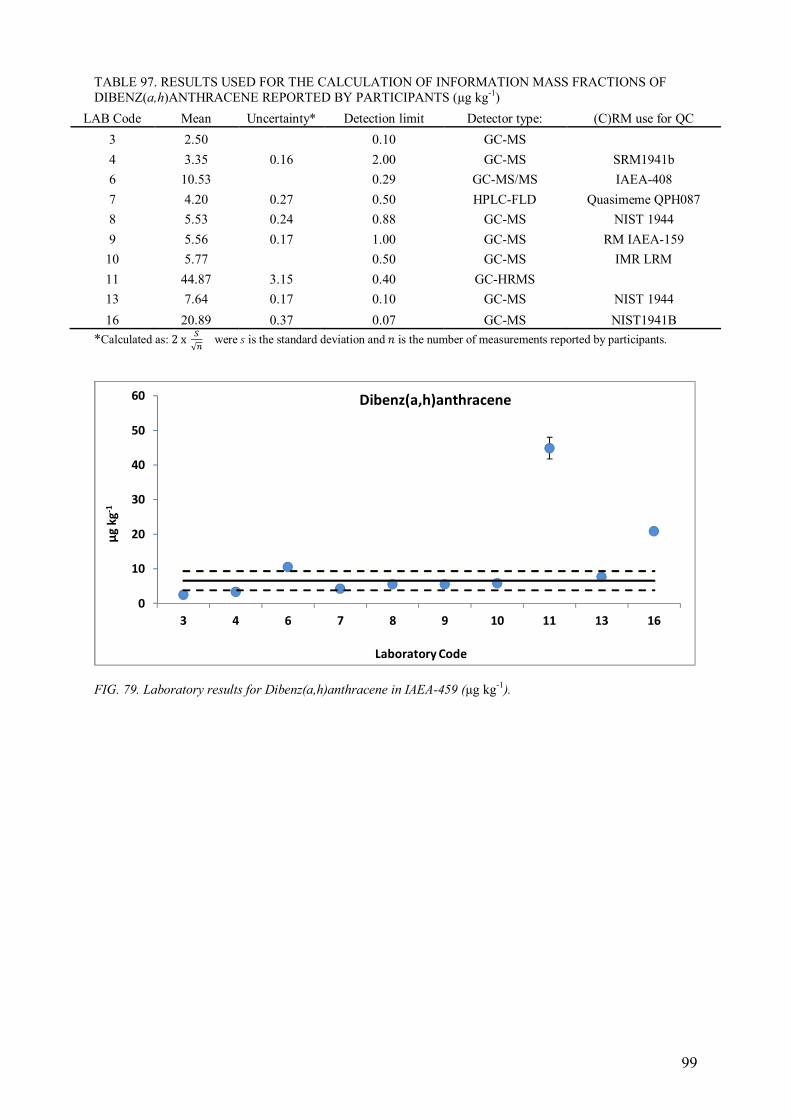
99
TABLE 97. RESULTS USED FOR THE CALCULATION OF INFORMATION MASS FRACTIONS OF
DIBENZ(a,h)ANTHRACENE REPORTED BY PARTICIPANTS (µg kg-1)
LAB Code Mean Uncertainty* Detection limit Detector type: (C)RM use for QC
3 2.50
0.10 GC-MS
4 3.35 0.16 2.00 GC-MS SRM1941b
6 10.53
0.29 GC-MS/MS IAEA-408
7 4.20 0.27 0.50 HPLC-FLD Quasimeme QPH087
8 5.53 0.24 0.88 GC-MS NIST 1944
9 5.56 0.17 1.00 GC-MS RM IAEA-159
10 5.77
0.50 GC-MS IMR LRM
11 44.87 3.15 0.40 GC-HRMS
13 7.64 0.17 0.10 GC-MS NIST 1944
16 20.89 0.37 0.07 GC-MS NIST1941B
*Calculated as: 2x =√> were ? is the standard deviation and @ is the number of measurements reported by participants.
FIG. 79. Laboratory results for Dibenz(a,h)anthracene in IAEA-459 (µg kg-1).
0
10
20
30
40
50
60
3 4 6 7 8 9 10 11 13 16
µg
kg
-1
Laboratory Code
Dibenz(a,h)anthracene
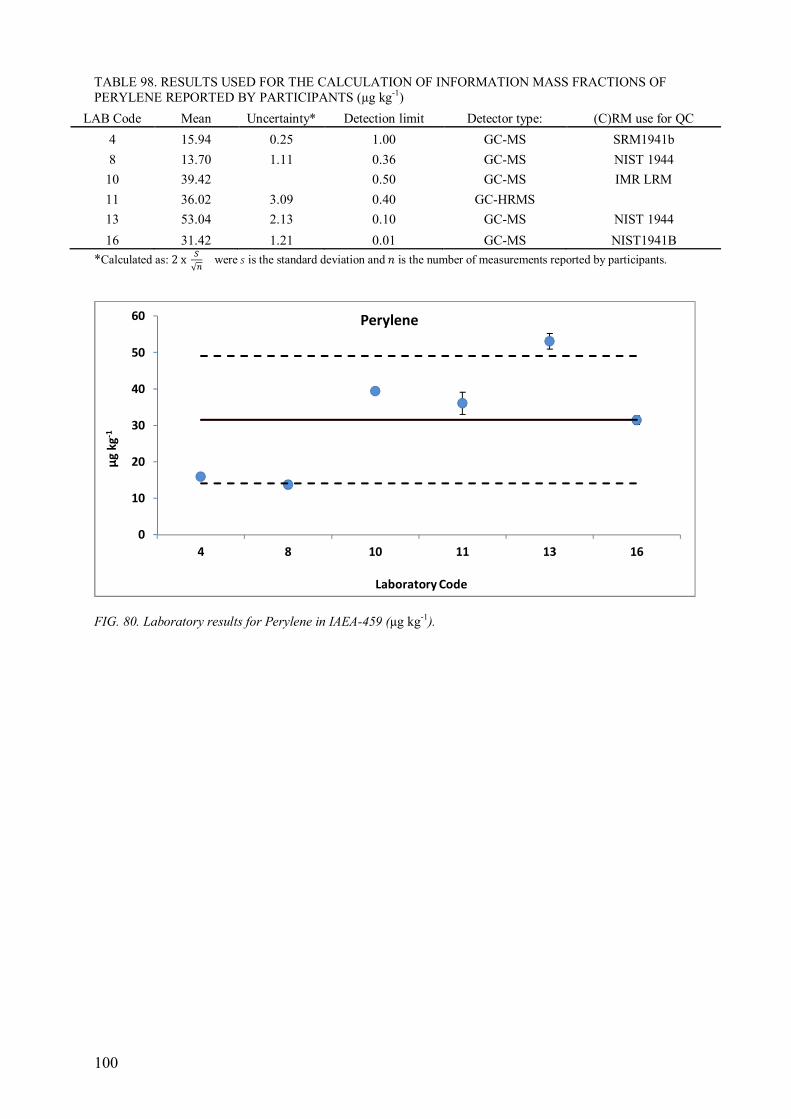
100
TABLE 98. RESULTS USED FOR THE CALCULATION OF INFORMATION MASS FRACTIONS OF
PERYLENE REPORTED BY PARTICIPANTS (µg kg-1)
LAB Code Mean Uncertainty* Detection limit Detector type: (C)RM use for QC
4 15.94 0.25 1.00 GC-MS SRM1941b
8 13.70 1.11 0.36 GC-MS NIST 1944
10 39.42
0.50 GC-MS IMR LRM
11 36.02 3.09 0.40 GC-HRMS
13 53.04 2.13 0.10 GC-MS NIST 1944
16 31.42 1.21 0.01 GC-MS NIST1941B
*Calculated as: 2x =√> were ? is the standard deviation and @ is the number of measurements reported by participants.
FIG. 80. Laboratory results for Perylene in IAEA-459 (µg kg-1).
0
10
20
30
40
50
60
4 8 10 11 13 16
µg
kg
-1
Laboratory Code
Perylene
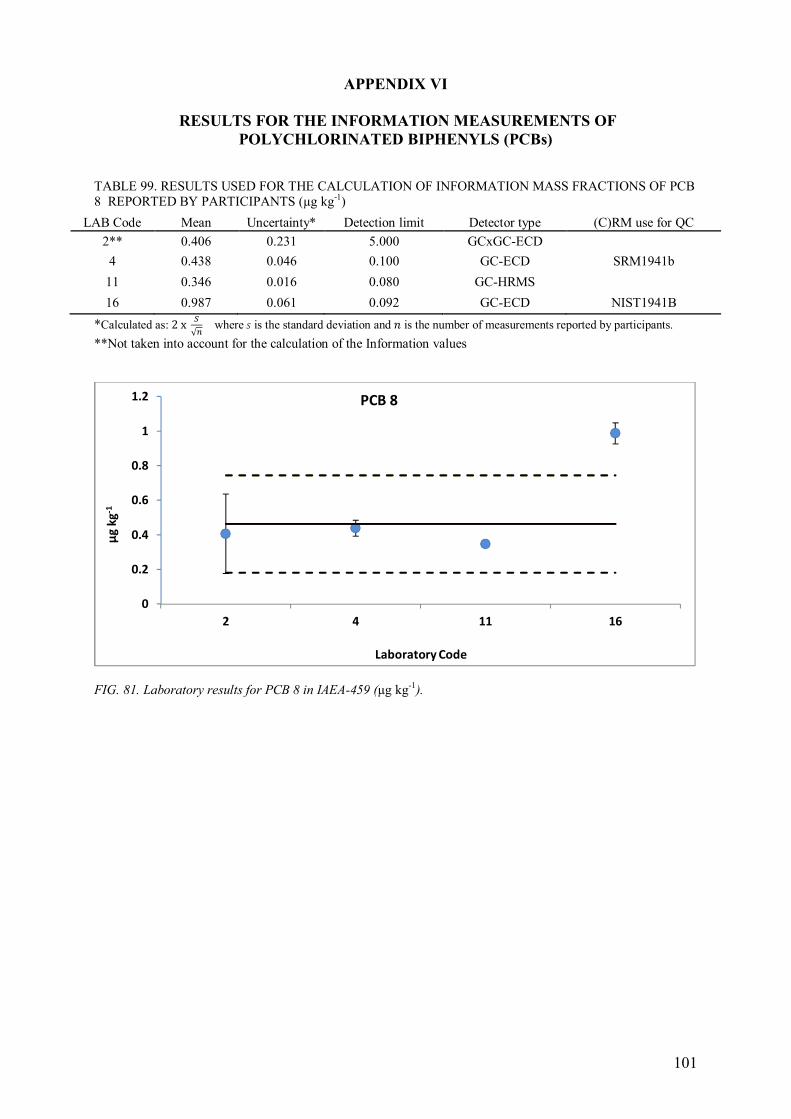
101
APPENDIX VI
RESULTS FOR THE INFORMATION MEASUREMENTS OF
POLYCHLORINATED BIPHENYLS (PCBs)
TABLE 99. RESULTS USED FOR THE CALCULATION OF INFORMATION MASS FRACTIONS OF PCB
8 REPORTED BY PARTICIPANTS (µg kg-1)
LAB Code Mean Uncertainty* Detection limit Detector type (C)RM use for QC
2** 0.406 0.231 5.000 GCxGC-ECD
4 0.438 0.046 0.100 GC-ECD SRM1941b
11 0.346 0.016 0.080 GC-HRMS
16 0.987 0.061 0.092 GC-ECD NIST1941B
*Calculated as: 2x =√> where ? is the standard deviation and @ is the number of measurements reported by participants.
**Not taken into account for the calculation of the Information values
FIG. 81. Laboratory results for PCB 8 in IAEA-459 (µg kg-1).
0
0.2
0.4
0.6
0.8
1
1.2
2 4 11 16
µg
kg
-1
Laboratory Code
PCB 8
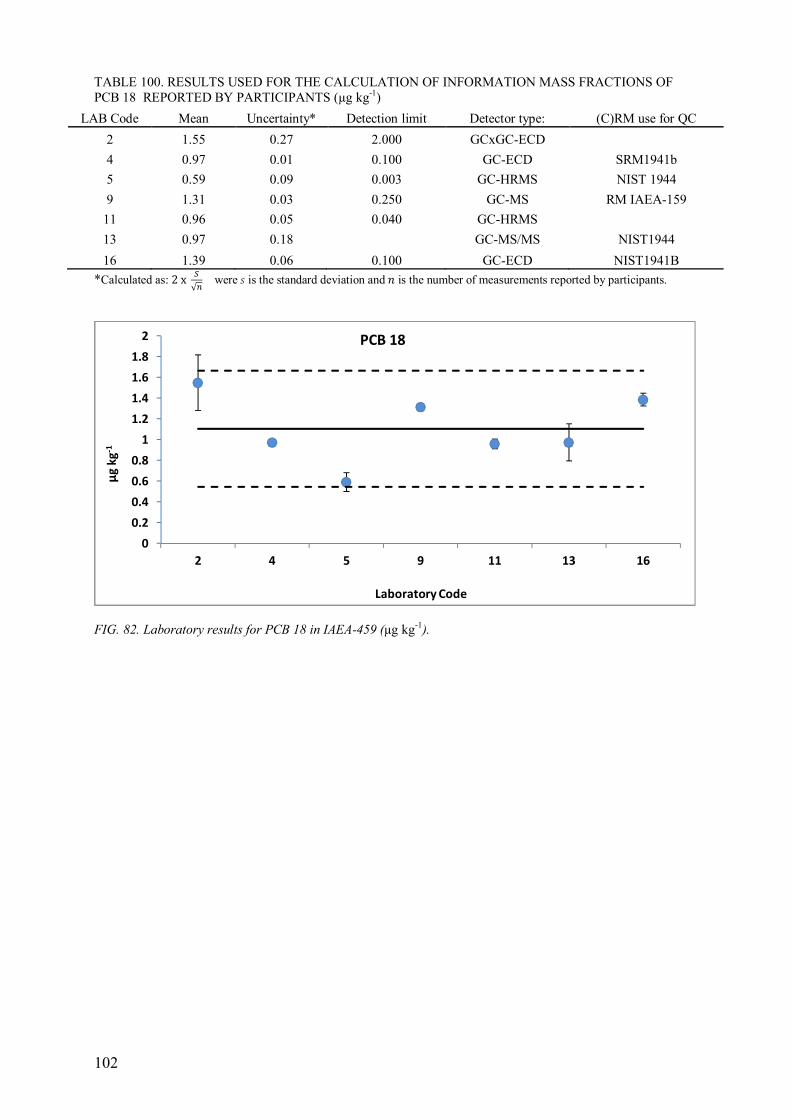
102
TABLE 100. RESULTS USED FOR THE CALCULATION OF INFORMATION MASS FRACTIONS OF
PCB 18 REPORTED BY PARTICIPANTS (µg kg-1)
LAB Code Mean Uncertainty* Detection limit Detector type: (C)RM use for QC
2 1.55 0.27 2.000 GCxGC-ECD
4 0.97 0.01 0.100 GC-ECD SRM1941b
5 0.59 0.09 0.003 GC-HRMS NIST 1944
9 1.31 0.03 0.250 GC-MS RM IAEA-159
11 0.96 0.05 0.040 GC-HRMS
13 0.97 0.18
GC-MS/MS NIST1944
16 1.39 0.06 0.100 GC-ECD NIST1941B
*Calculated as: 2x =√> were ? is the standard deviation and @ is the number of measurements reported by participants.
FIG. 82. Laboratory results for PCB 18 in IAEA-459 (µg kg-1).
0
0.2
0.4
0.6
0.8
1
1.2
1.4
1.6
1.8
2
2 4 5 9 11 13 16
µg
kg
-1
Laboratory Code
PCB 18
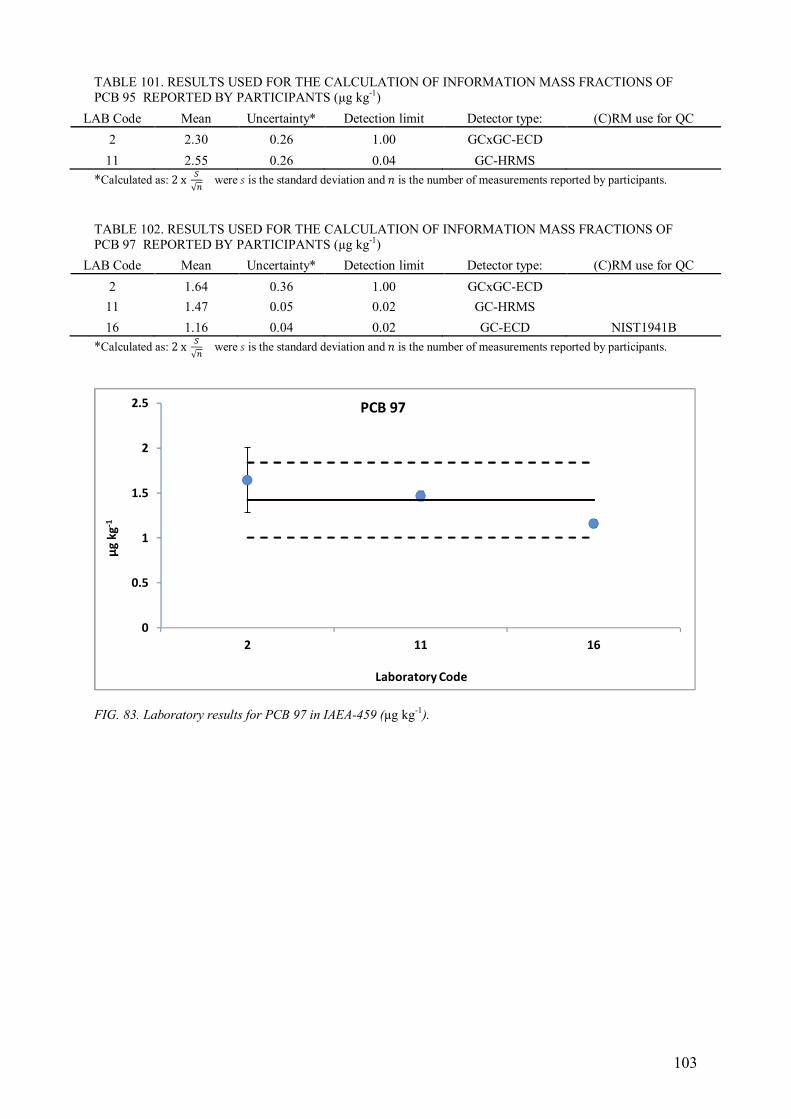
103
TABLE 101. RESULTS USED FOR THE CALCULATION OF INFORMATION MASS FRACTIONS OF
PCB 95 REPORTED BY PARTICIPANTS (µg kg-1)
LAB Code Mean Uncertainty* Detection limit Detector type: (C)RM use for QC
2 2.30 0.26 1.00 GCxGC-ECD
11 2.55 0.26 0.04 GC-HRMS
*Calculated as: 2x =√> were ? is the standard deviation and @ is the number of measurements reported by participants.
TABLE 102. RESULTS USED FOR THE CALCULATION OF INFORMATION MASS FRACTIONS OF
PCB 97 REPORTED BY PARTICIPANTS (µg kg-1)
LAB Code Mean Uncertainty* Detection limit Detector type: (C)RM use for QC
2 1.64 0.36 1.00 GCxGC-ECD
11 1.47 0.05 0.02 GC-HRMS 16 1.16 0.04 0.02 GC-ECD NIST1941B
*Calculated as: 2x =√> were ? is the standard deviation and @ is the number of measurements reported by participants.
FIG. 83. Laboratory results for PCB 97 in IAEA-459 (µg kg-1).
0
0.5
1
1.5
2
2.5
2 11 16
µg
kg
-1
Laboratory Code
PCB 97
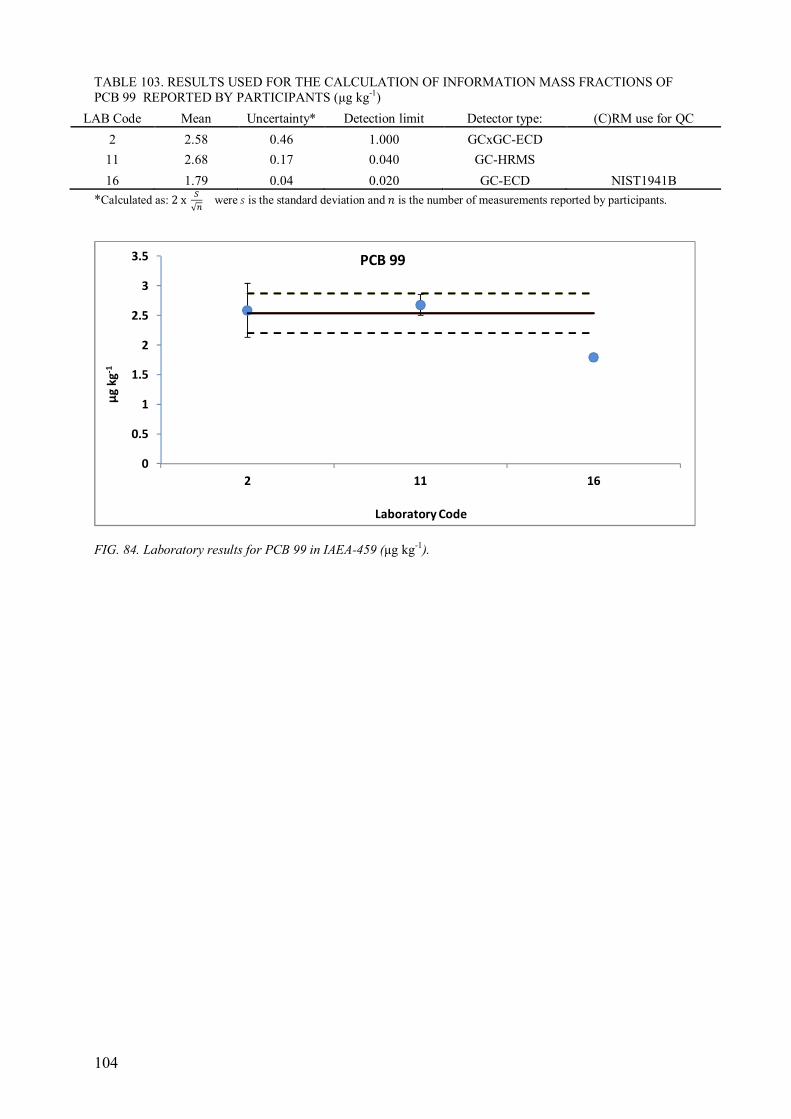
104
TABLE 103. RESULTS USED FOR THE CALCULATION OF INFORMATION MASS FRACTIONS OF
PCB 99 REPORTED BY PARTICIPANTS (µg kg-1)
LAB Code Mean Uncertainty* Detection limit Detector type: (C)RM use for QC
2 2.58 0.46 1.000 GCxGC-ECD
11 2.68 0.17 0.040 GC-HRMS
16 1.79 0.04 0.020 GC-ECD NIST1941B
*Calculated as: 2x =√> were ? is the standard deviation and @ is the number of measurements reported by participants.
FIG. 84. Laboratory results for PCB 99 in IAEA-459 (µg kg-1).
0
0.5
1
1.5
2
2.5
3
3.5
2 11 16
µg
kg
-1
Laboratory Code
PCB 99
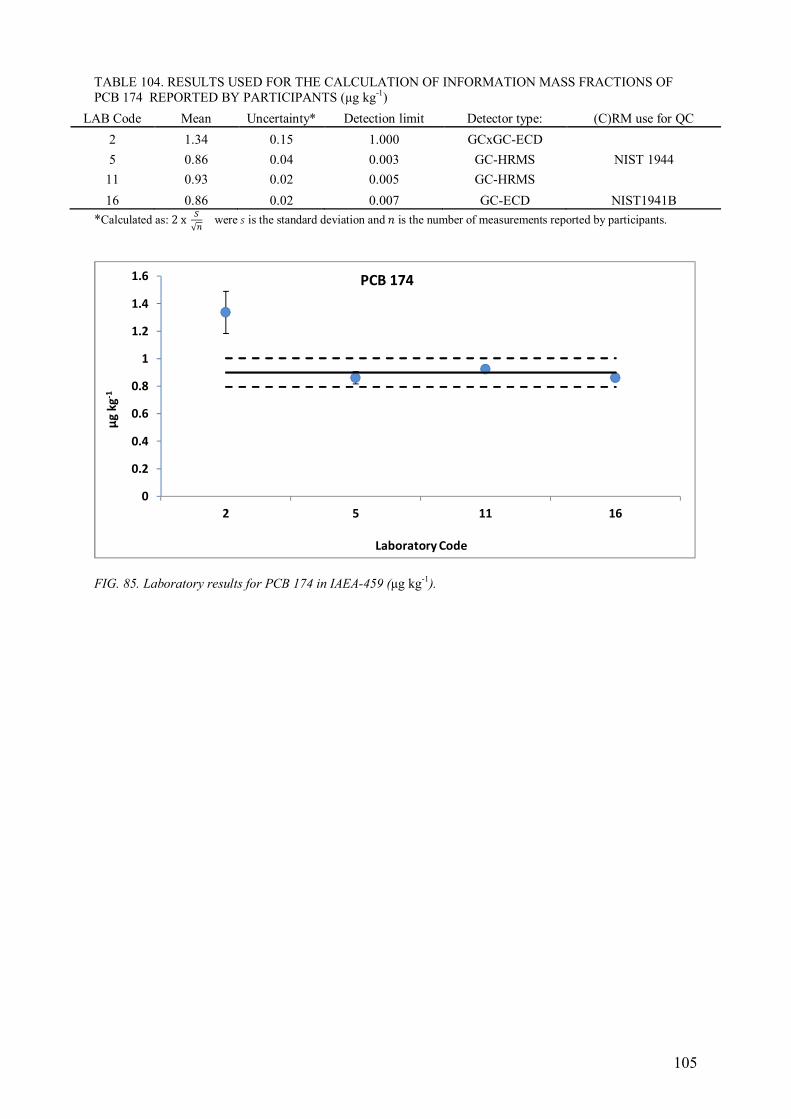
105
TABLE 104. RESULTS USED FOR THE CALCULATION OF INFORMATION MASS FRACTIONS OF
PCB 174 REPORTED BY PARTICIPANTS (µg kg-1)
LAB Code Mean Uncertainty* Detection limit Detector type: (C)RM use for QC
2 1.34 0.15 1.000 GCxGC-ECD
5 0.86 0.04 0.003 GC-HRMS NIST 1944
11 0.93 0.02 0.005 GC-HRMS
16 0.86 0.02 0.007 GC-ECD NIST1941B
*Calculated as: 2x =√> were ? is the standard deviation and @ is the number of measurements reported by participants.
FIG. 85. Laboratory results for PCB 174 in IAEA-459 (µg kg-1).
0
0.2
0.4
0.6
0.8
1
1.2
1.4
1.6
2 5 11 16
µg
kg
-1
Laboratory Code
PCB 174
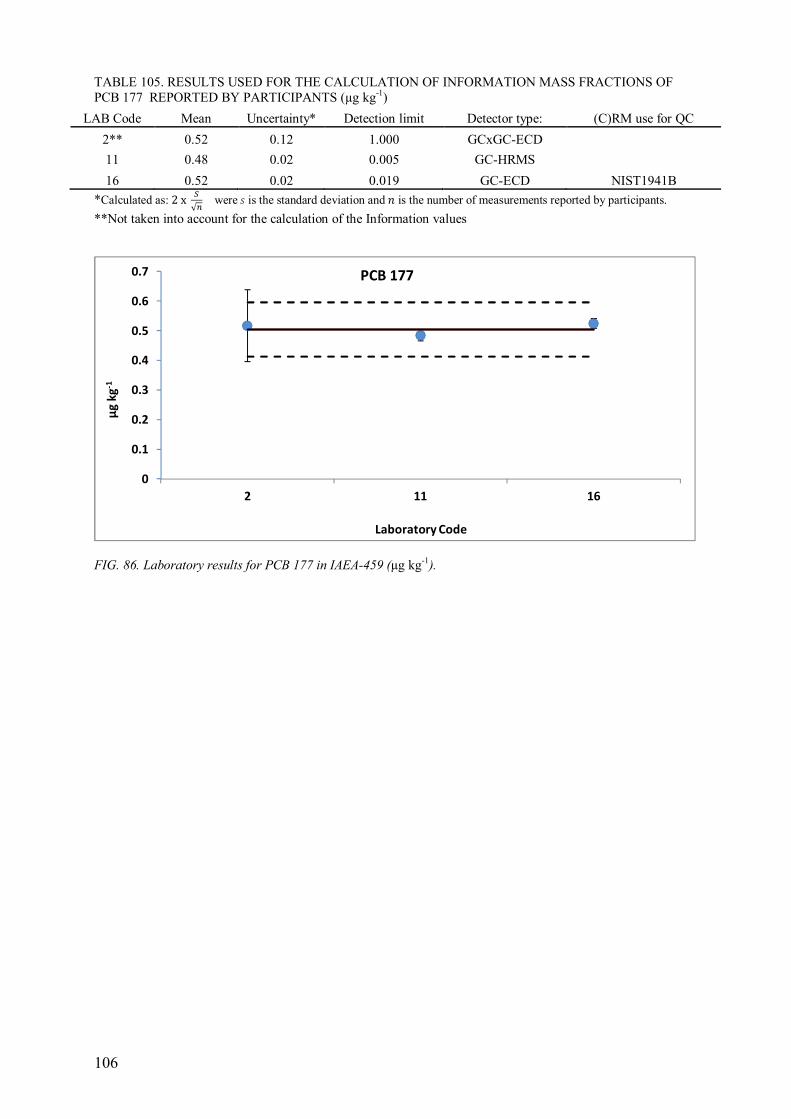
106
TABLE 105. RESULTS USED FOR THE CALCULATION OF INFORMATION MASS FRACTIONS OF
PCB 177 REPORTED BY PARTICIPANTS (µg kg-1)
LAB Code Mean Uncertainty* Detection limit Detector type: (C)RM use for QC
2** 0.52 0.12 1.000 GCxGC-ECD
11 0.48 0.02 0.005 GC-HRMS
16 0.52 0.02 0.019 GC-ECD NIST1941B
*Calculated as: 2x =√> were ? is the standard deviation and @ is the number of measurements reported by participants.
**Not taken into account for the calculation of the Information values
FIG. 86. Laboratory results for PCB 177 in IAEA-459 (µg kg-1).
0
0.1
0.2
0.3
0.4
0.5
0.6
0.7
2 11 16
µg
kg
-1
Laboratory Code
PCB 177
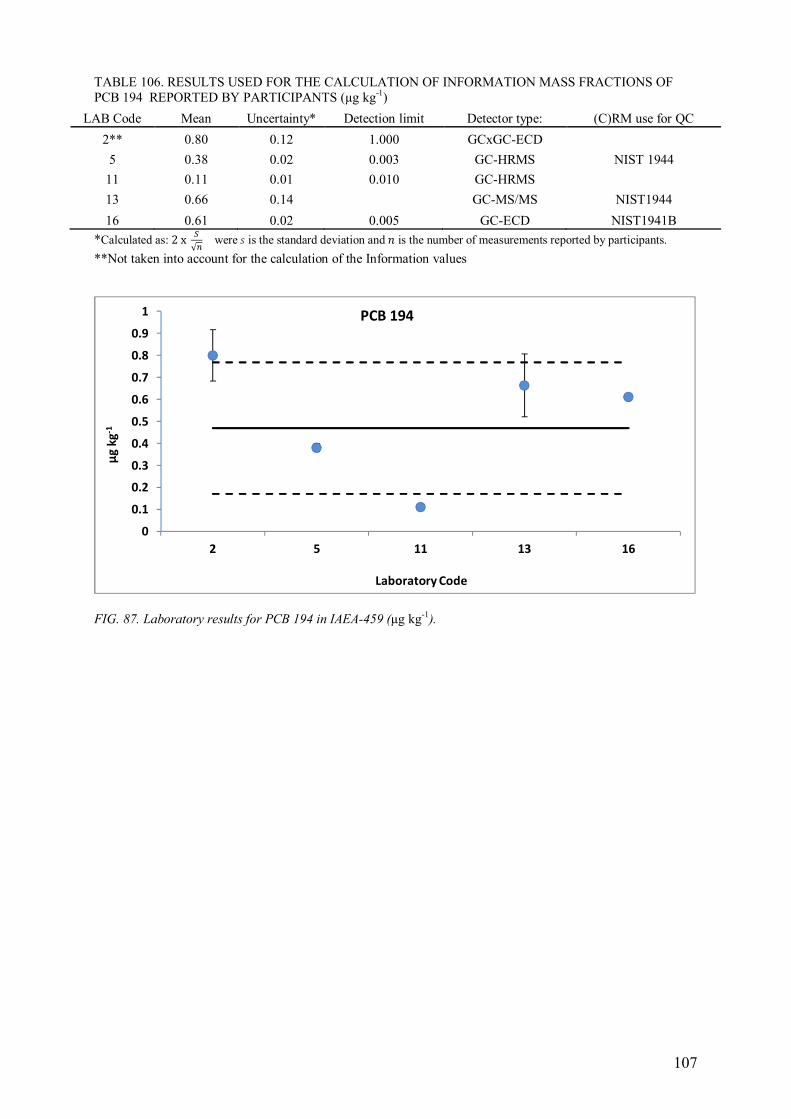
107
TABLE 106. RESULTS USED FOR THE CALCULATION OF INFORMATION MASS FRACTIONS OF
PCB 194 REPORTED BY PARTICIPANTS (µg kg-1)
LAB Code Mean Uncertainty* Detection limit Detector type: (C)RM use for QC
2** 0.80 0.12 1.000 GCxGC-ECD
5 0.38 0.02 0.003 GC-HRMS NIST 1944
11 0.11 0.01 0.010 GC-HRMS
13 0.66 0.14
GC-MS/MS NIST1944
16 0.61 0.02 0.005 GC-ECD NIST1941B
*Calculated as: 2x =√> were ? is the standard deviation and @ is the number of measurements reported by participants.
**Not taken into account for the calculation of the Information values
FIG. 87. Laboratory results for PCB 194 in IAEA-459 (µg kg-1).
0
0.1
0.2
0.3
0.4
0.5
0.6
0.7
0.8
0.9
1
2 5 11 13 16
µg
kg
-1
Laboratory Code
PCB 194
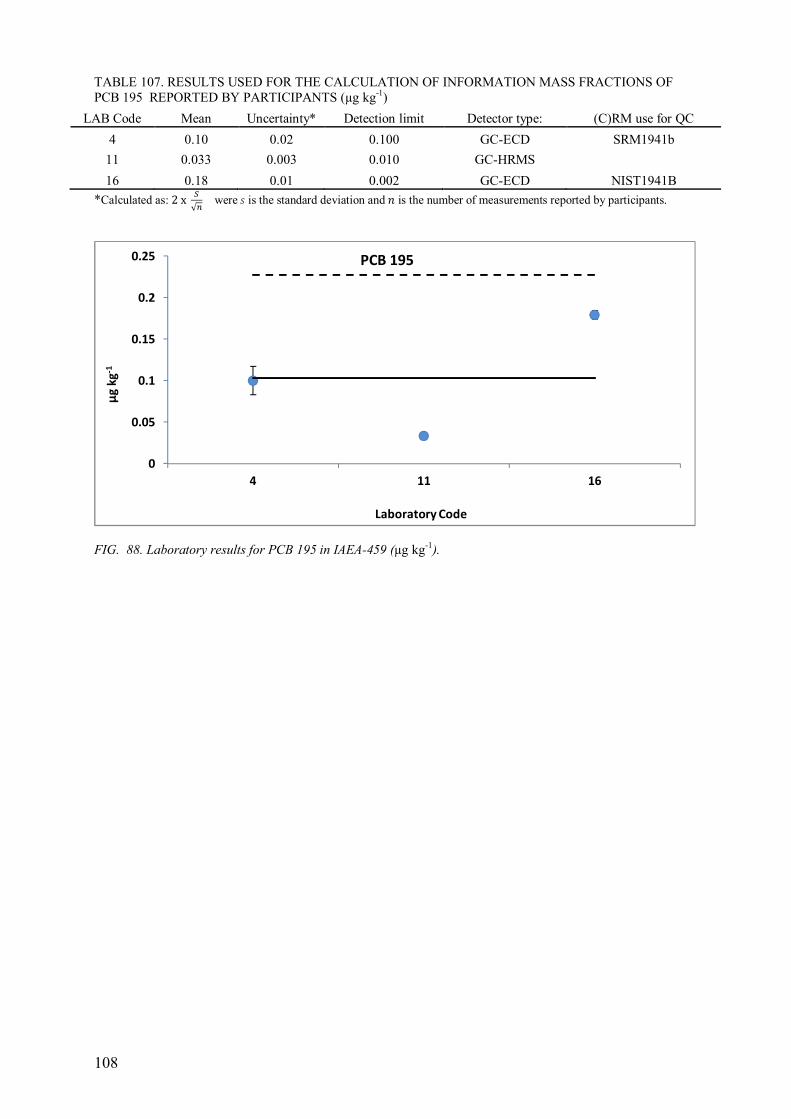
108
TABLE 107. RESULTS USED FOR THE CALCULATION OF INFORMATION MASS FRACTIONS OF
PCB 195 REPORTED BY PARTICIPANTS (µg kg-1)
LAB Code Mean Uncertainty* Detection limit Detector type: (C)RM use for QC
4 0.10 0.02 0.100 GC-ECD SRM1941b
11 0.033 0.003 0.010 GC-HRMS
16 0.18 0.01 0.002 GC-ECD NIST1941B
*Calculated as: 2x =√> were ? is the standard deviation and @ is the number of measurements reported by participants.
FIG. 88. Laboratory results for PCB 195 in IAEA-459 (µg kg-1).
0
0.05
0.1
0.15
0.2
0.25
4 11 16
µg
kg
-1
Laboratory Code
PCB 195
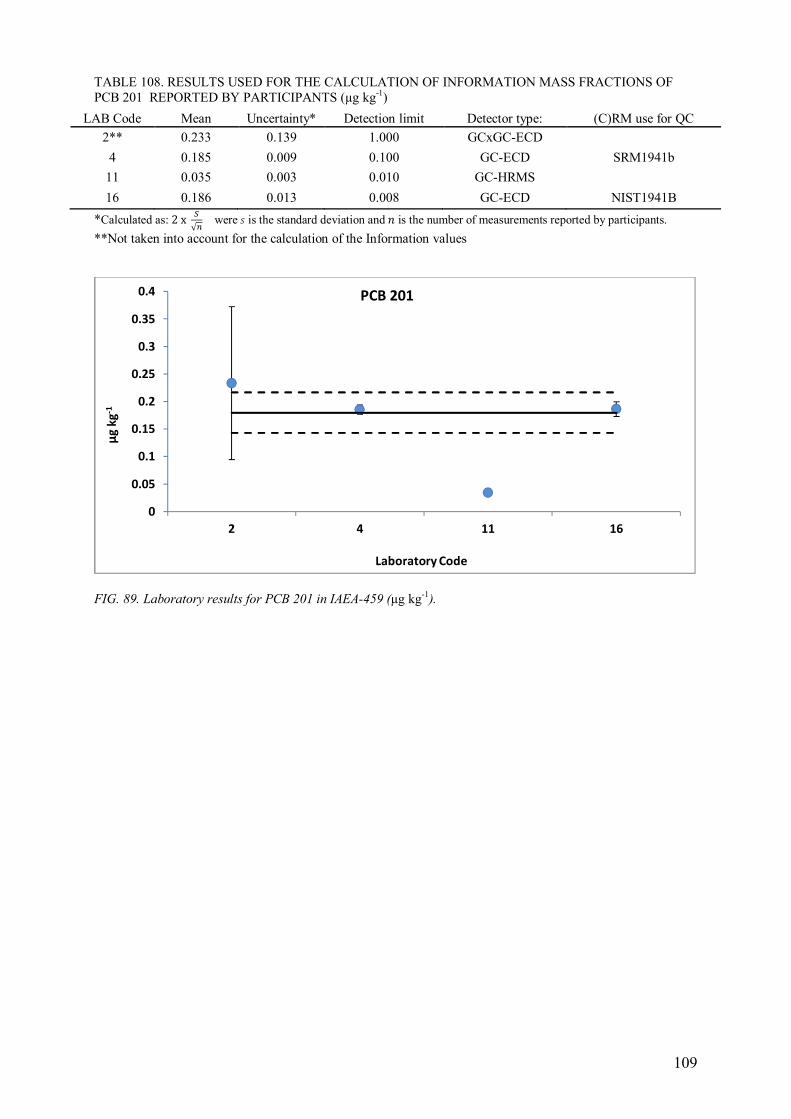
109
TABLE 108. RESULTS USED FOR THE CALCULATION OF INFORMATION MASS FRACTIONS OF
PCB 201 REPORTED BY PARTICIPANTS (µg kg-1)
LAB Code Mean Uncertainty* Detection limit Detector type: (C)RM use for QC
2** 0.233 0.139 1.000 GCxGC-ECD
4 0.185 0.009 0.100 GC-ECD SRM1941b
11 0.035 0.003 0.010 GC-HRMS
16 0.186 0.013 0.008 GC-ECD NIST1941B
*Calculated as: 2x =√> were ? is the standard deviation and @ is the number of measurements reported by participants.
**Not taken into account for the calculation of the Information values
FIG. 89. Laboratory results for PCB 201 in IAEA-459 (µg kg-1).
0
0.05
0.1
0.15
0.2
0.25
0.3
0.35
0.4
2 4 11 16
µg
kg
-1
Laboratory Code
PCB 201
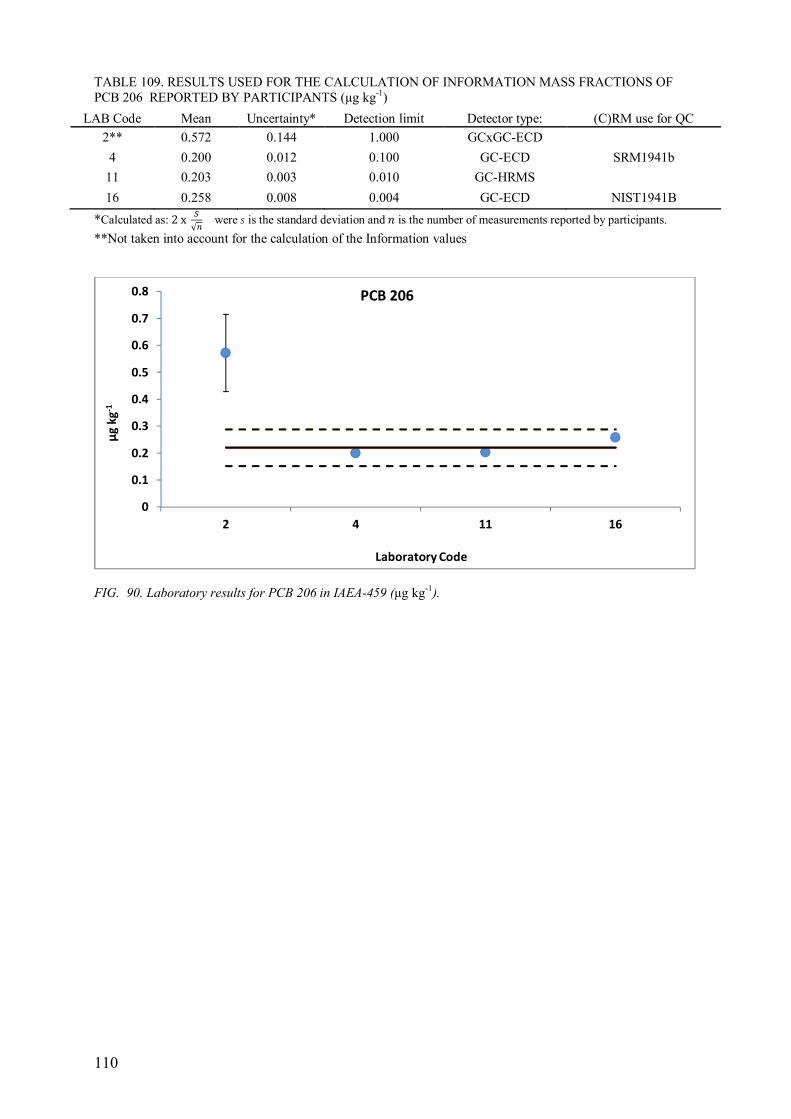
110
TABLE 109. RESULTS USED FOR THE CALCULATION OF INFORMATION MASS FRACTIONS OF
PCB 206 REPORTED BY PARTICIPANTS (µg kg-1)
LAB Code Mean Uncertainty* Detection limit Detector type: (C)RM use for QC
2** 0.572 0.144 1.000 GCxGC-ECD
4 0.200 0.012 0.100 GC-ECD SRM1941b
11 0.203 0.003 0.010 GC-HRMS
16 0.258 0.008 0.004 GC-ECD NIST1941B
*Calculated as: 2x =√> were ? is the standard deviation and @ is the number of measurements reported by participants.
**Not taken into account for the calculation of the Information values
FIG. 90. Laboratory results for PCB 206 in IAEA-459 (µg kg-1).
0
0.1
0.2
0.3
0.4
0.5
0.6
0.7
0.8
2 4 11 16
µg
kg
-1
Laboratory Code
PCB 206
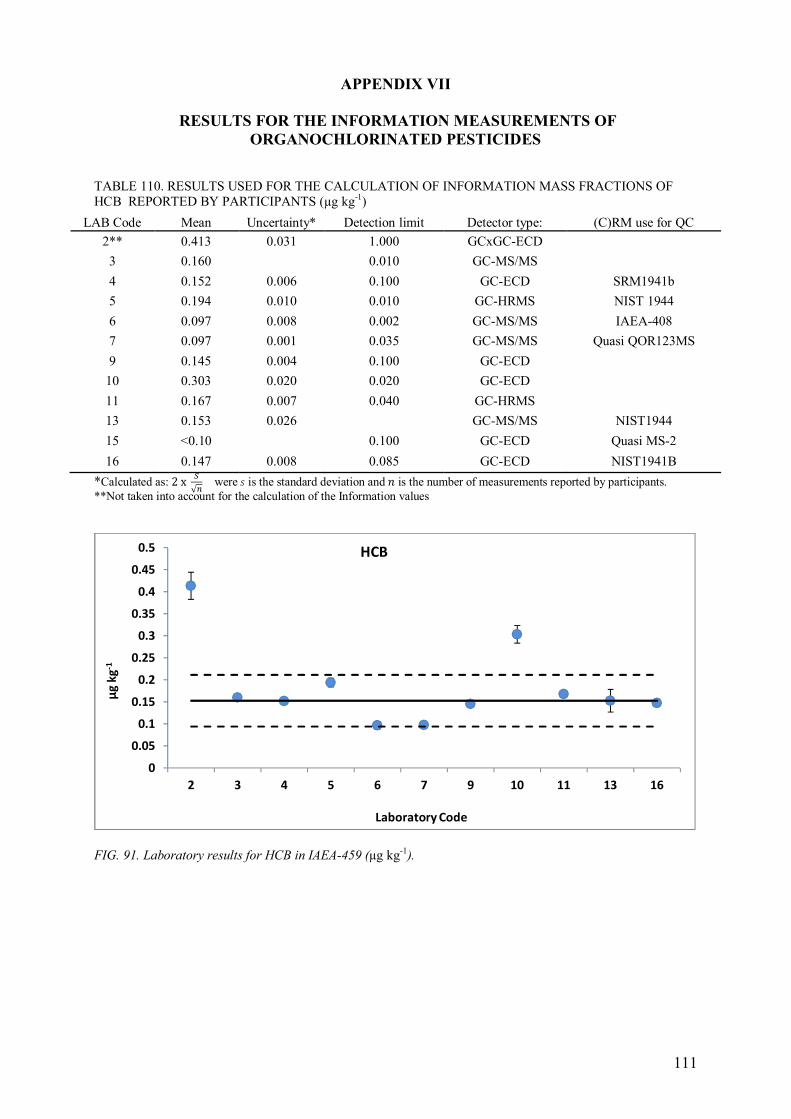
111
APPENDIX VII
RESULTS FOR THE INFORMATION MEASUREMENTS OF
ORGANOCHLORINATED PESTICIDES
TABLE 110. RESULTS USED FOR THE CALCULATION OF INFORMATION MASS FRACTIONS OF
HCB REPORTED BY PARTICIPANTS (µg kg-1)
LAB Code Mean Uncertainty* Detection limit Detector type: (C)RM use for QC
2** 0.413 0.031 1.000 GCxGC-ECD
3 0.160
0.010 GC-MS/MS
4 0.152 0.006 0.100 GC-ECD SRM1941b
5 0.194 0.010 0.010 GC-HRMS NIST 1944
6 0.097 0.008 0.002 GC-MS/MS IAEA-408
7 0.097 0.001 0.035 GC-MS/MS Quasi QOR123MS
9 0.145 0.004 0.100 GC-ECD
10 0.303 0.020 0.020 GC-ECD
11 0.167 0.007 0.040 GC-HRMS
13 0.153 0.026
GC-MS/MS NIST1944
15 <0.10 0.100 GC-ECD Quasi MS-2
16 0.147 0.008 0.085 GC-ECD NIST1941B
*Calculated as: 2x =√> were ? is the standard deviation and @ is the number of measurements reported by participants.
**Not taken into account for the calculation of the Information values
FIG. 91. Laboratory results for HCB in IAEA-459 (µg kg-1).
0
0.05
0.1
0.15
0.2
0.25
0.3
0.35
0.4
0.45
0.5
2 3 4 5 6 7 9 10 11 13 16
µg
kg
-1
Laboratory Code
HCB
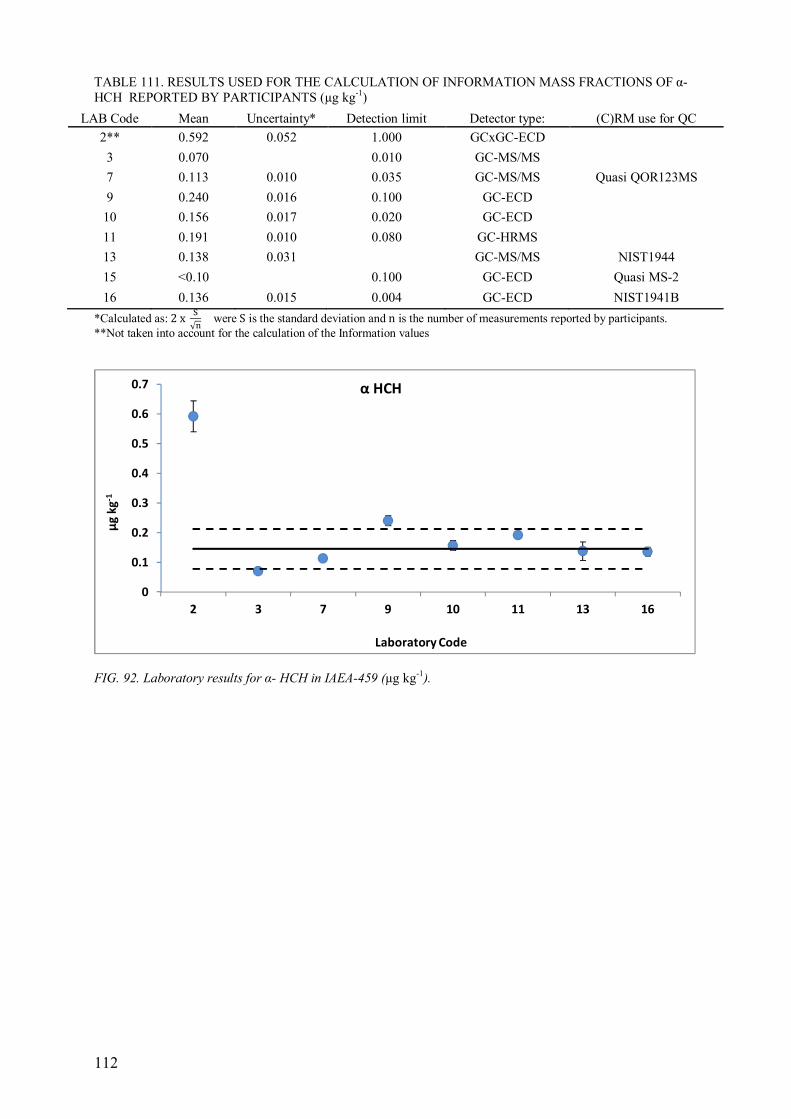
112
TABLE 111. RESULTS USED FOR THE CALCULATION OF INFORMATION MASS FRACTIONS OF α-
HCH REPORTED BY PARTICIPANTS (µg kg-1)
LAB Code Mean Uncertainty* Detection limit Detector type: (C)RM use for QC
2** 0.592 0.052 1.000 GCxGC-ECD
3 0.070
0.010 GC-MS/MS
7 0.113 0.010 0.035 GC-MS/MS Quasi QOR123MS
9 0.240 0.016 0.100 GC-ECD
10 0.156 0.017 0.020 GC-ECD
11 0.191 0.010 0.080 GC-HRMS
13 0.138 0.031
GC-MS/MS NIST1944
15 <0.10 0.100 GC-ECD Quasi MS-2
16 0.136 0.015 0.004 GC-ECD NIST1941B
*Calculated as: 2x A√B were S is the standard deviation and n is the number of measurements reported by participants.
**Not taken into account for the calculation of the Information values
FIG. 92. Laboratory results for α- HCH in IAEA-459 (µg kg-1).
0
0.1
0.2
0.3
0.4
0.5
0.6
0.7
2 3 7 9 10 11 13 16
µg
kg
-1
Laboratory Code
α HCH
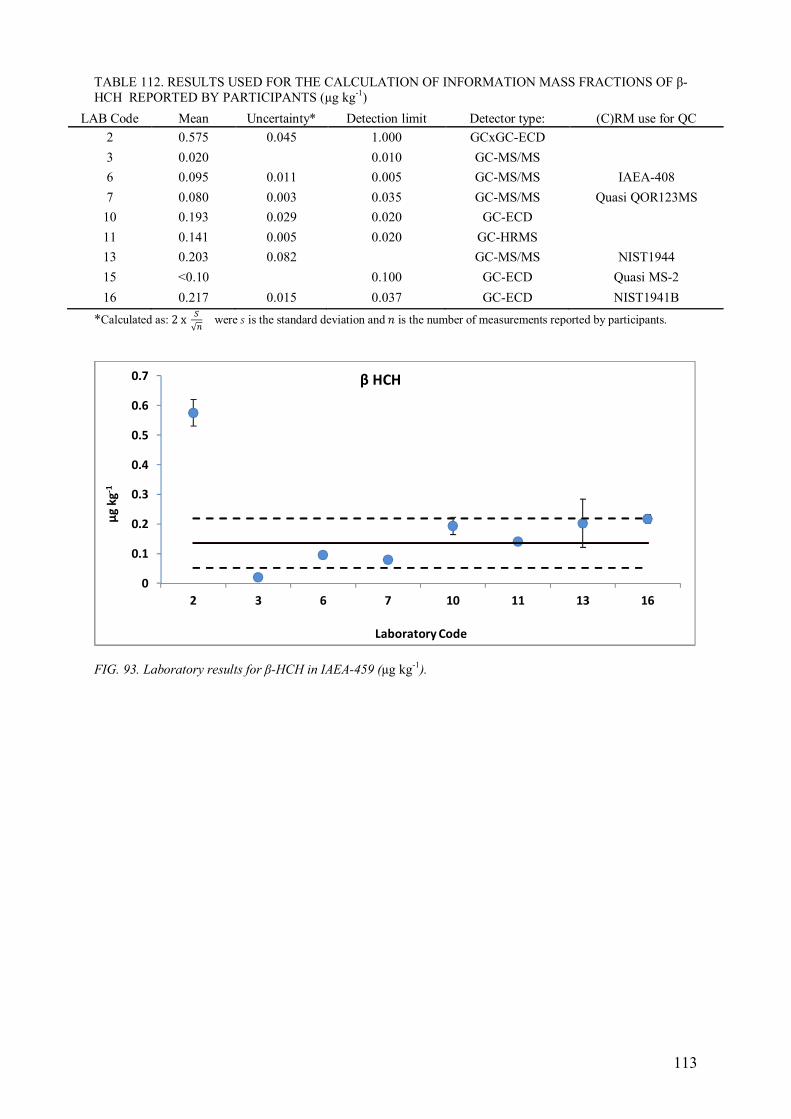
113
TABLE 112. RESULTS USED FOR THE CALCULATION OF INFORMATION MASS FRACTIONS OF β-
HCH REPORTED BY PARTICIPANTS (µg kg-1)
LAB Code Mean Uncertainty* Detection limit Detector type: (C)RM use for QC
2 0.575 0.045 1.000 GCxGC-ECD
3 0.020
0.010 GC-MS/MS
6 0.095 0.011 0.005 GC-MS/MS IAEA-408
7 0.080 0.003 0.035 GC-MS/MS Quasi QOR123MS
10 0.193 0.029 0.020 GC-ECD
11 0.141 0.005 0.020 GC-HRMS
13 0.203 0.082
GC-MS/MS NIST1944
15 <0.10 0.100 GC-ECD Quasi MS-2
16 0.217 0.015 0.037 GC-ECD NIST1941B
*Calculated as: 2x =√> were ? is the standard deviation and @ is the number of measurements reported by participants.
FIG. 93. Laboratory results for β-HCH in IAEA-459 (µg kg-1).
0
0.1
0.2
0.3
0.4
0.5
0.6
0.7
2 3 6 7 10 11 13 16
µg
kg
-1
Laboratory Code
β HCH
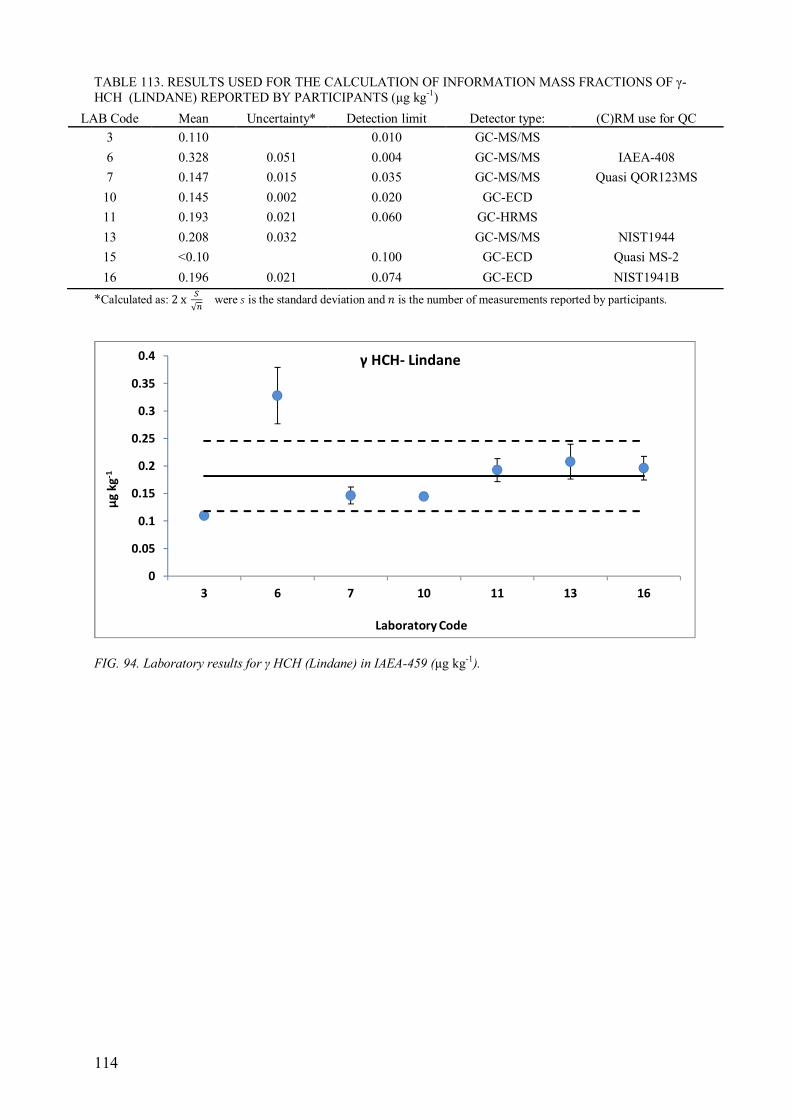
114
TABLE 113. RESULTS USED FOR THE CALCULATION OF INFORMATION MASS FRACTIONS OF γ-
HCH (LINDANE) REPORTED BY PARTICIPANTS (µg kg-1)
LAB Code Mean Uncertainty* Detection limit Detector type: (C)RM use for QC
3 0.110
0.010 GC-MS/MS
6 0.328 0.051 0.004 GC-MS/MS IAEA-408
7 0.147 0.015 0.035 GC-MS/MS Quasi QOR123MS
10 0.145 0.002 0.020 GC-ECD
11 0.193 0.021 0.060 GC-HRMS
13 0.208 0.032
GC-MS/MS NIST1944
15 <0.10 0.100 GC-ECD Quasi MS-2
16 0.196 0.021 0.074 GC-ECD NIST1941B
*Calculated as: 2x =√> were ? is the standard deviation and @ is the number of measurements reported by participants.
FIG. 94. Laboratory results for γ HCH (Lindane) in IAEA-459 (µg kg-1).
0
0.05
0.1
0.15
0.2
0.25
0.3
0.35
0.4
3 6 7 10 11 13 16
µg
kg
-1
Laboratory Code
γ HCH- Lindane
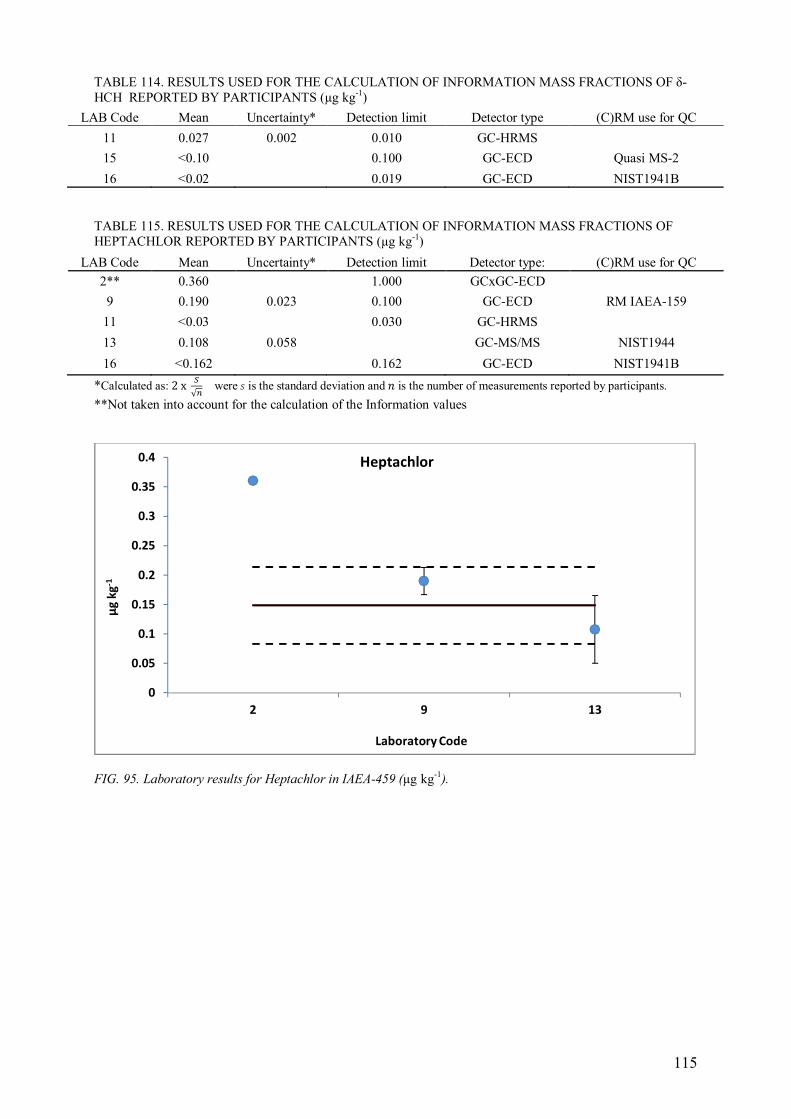
115
TABLE 114. RESULTS USED FOR THE CALCULATION OF INFORMATION MASS FRACTIONS OF δ-
HCH REPORTED BY PARTICIPANTS (µg kg-1)
LAB Code Mean Uncertainty* Detection limit Detector type (C)RM use for QC
11 0.027 0.002 0.010 GC-HRMS
15 <0.10
0.100 GC-ECD Quasi MS-2
16 <0.02 0.019 GC-ECD NIST1941B
TABLE 115. RESULTS USED FOR THE CALCULATION OF INFORMATION MASS FRACTIONS OF
HEPTACHLOR REPORTED BY PARTICIPANTS (µg kg-1)
LAB Code Mean Uncertainty* Detection limit Detector type: (C)RM use for QC
2** 0.360
1.000 GCxGC-ECD
9 0.190 0.023 0.100 GC-ECD RM IAEA-159
11 <0.03 0.030 GC-HRMS
13 0.108 0.058 GC-MS/MS NIST1944
16 <0.162 0.162 GC-ECD NIST1941B
*Calculated as: 2x =√> were ? is the standard deviation and @ is the number of measurements reported by participants.
**Not taken into account for the calculation of the Information values
FIG. 95. Laboratory results for Heptachlor in IAEA-459 (µg kg-1).
0
0.05
0.1
0.15
0.2
0.25
0.3
0.35
0.4
2 9 13
µg
kg
-1
Laboratory Code
Heptachlor
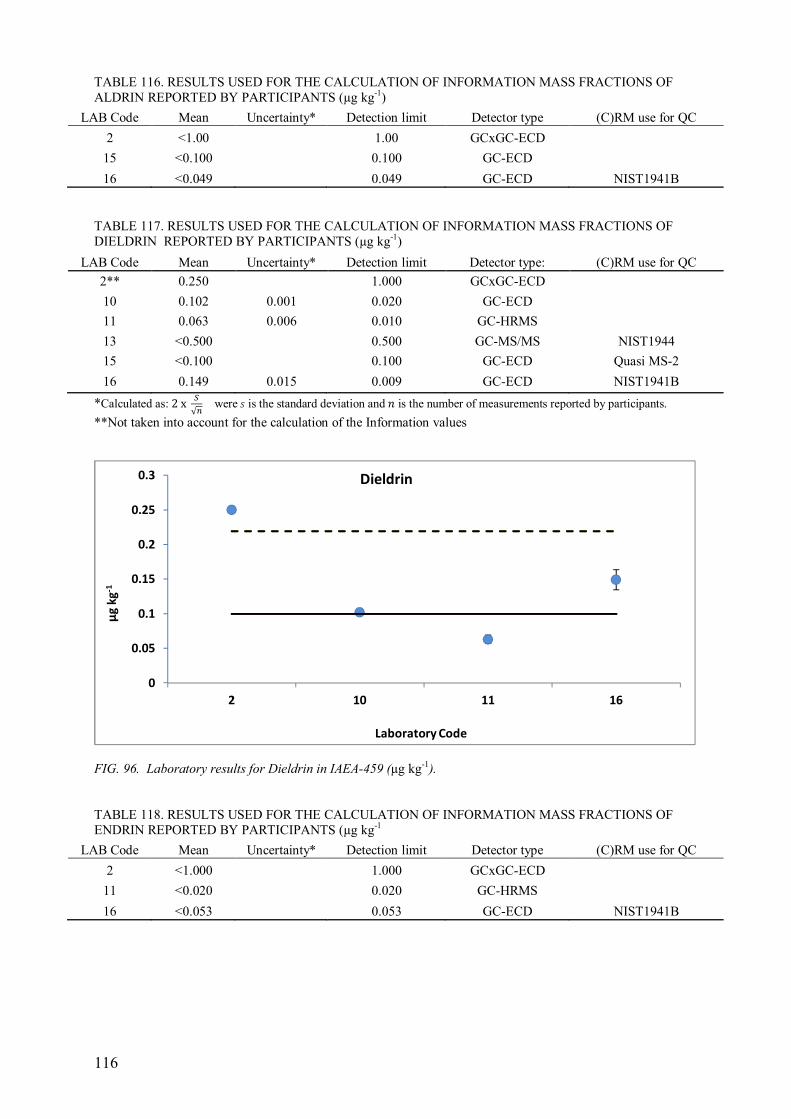
116
TABLE 116. RESULTS USED FOR THE CALCULATION OF INFORMATION MASS FRACTIONS OF
ALDRIN REPORTED BY PARTICIPANTS (µg kg-1)
LAB Code Mean Uncertainty* Detection limit Detector type (C)RM use for QC
2 <1.00 1.00 GCxGC-ECD
15 <0.100
0.100 GC-ECD
16 <0.049 0.049 GC-ECD NIST1941B
TABLE 117. RESULTS USED FOR THE CALCULATION OF INFORMATION MASS FRACTIONS OF
DIELDRIN REPORTED BY PARTICIPANTS (µg kg-1)
LAB Code Mean Uncertainty* Detection limit Detector type: (C)RM use for QC
2** 0.250
1.000 GCxGC-ECD
10 0.102 0.001 0.020 GC-ECD
11 0.063 0.006 0.010 GC-HRMS
13 <0.500
0.500 GC-MS/MS NIST1944
15 <0.100 0.100 GC-ECD Quasi MS-2
16 0.149 0.015 0.009 GC-ECD NIST1941B
*Calculated as: 2x =√> were ? is the standard deviation and @ is the number of measurements reported by participants.
**Not taken into account for the calculation of the Information values
FIG. 96. Laboratory results for Dieldrin in IAEA-459 (µg kg-1).
TABLE 118. RESULTS USED FOR THE CALCULATION OF INFORMATION MASS FRACTIONS OF
ENDRIN REPORTED BY PARTICIPANTS (µg kg-1
LAB Code Mean Uncertainty* Detection limit Detector type (C)RM use for QC
2 <1.000 1.000 GCxGC-ECD
11 <0.020
0.020 GC-HRMS
16 <0.053 0.053 GC-ECD NIST1941B
0
0.05
0.1
0.15
0.2
0.25
0.3
2 10 11 16
µg
kg
-1
Laboratory Code
Dieldrin
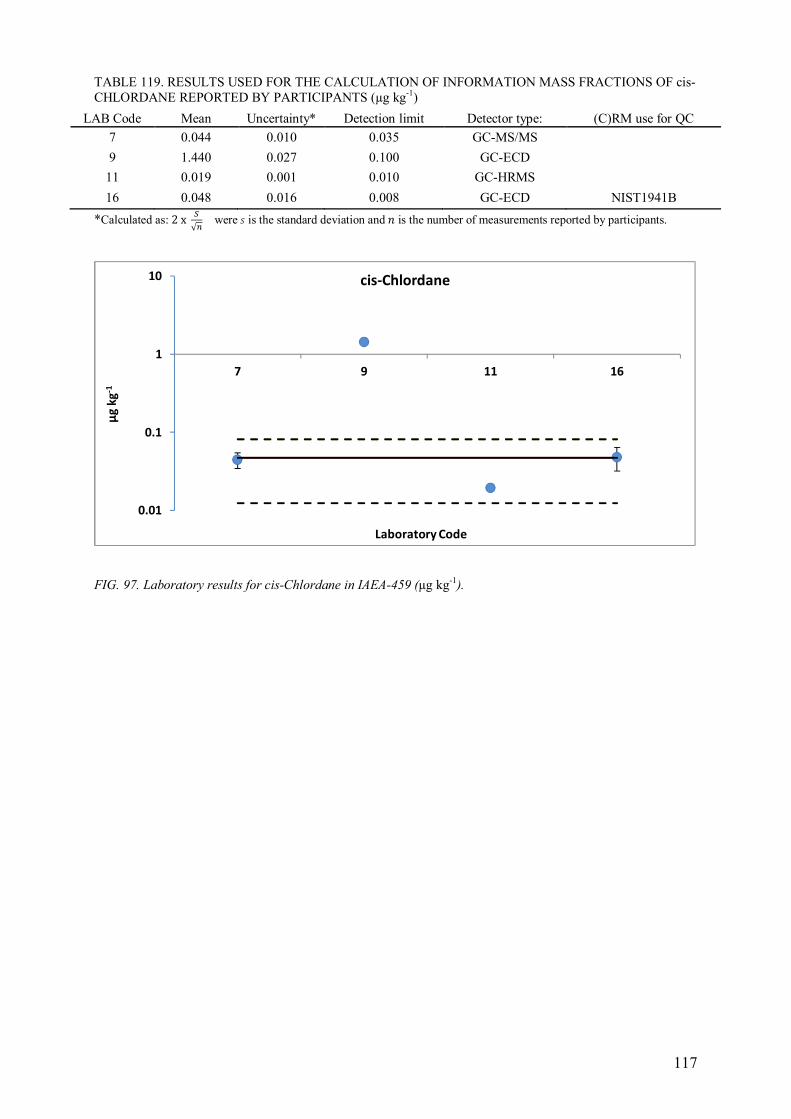
117
TABLE 119. RESULTS USED FOR THE CALCULATION OF INFORMATION MASS FRACTIONS OF cis-
CHLORDANE REPORTED BY PARTICIPANTS (µg kg-1)
LAB Code Mean Uncertainty* Detection limit Detector type: (C)RM use for QC
7 0.044 0.010 0.035 GC-MS/MS
9 1.440 0.027 0.100 GC-ECD
11 0.019 0.001 0.010 GC-HRMS
16 0.048 0.016 0.008 GC-ECD NIST1941B
*Calculated as: 2x =√> were ? is the standard deviation and @ is the number of measurements reported by participants.
FIG. 97. Laboratory results for cis-Chlordane in IAEA-459 (µg kg-1).
0.01
0.1
1
10
7 9 11 16
µg
kg
-1
Laboratory Code
cis-Chlordane
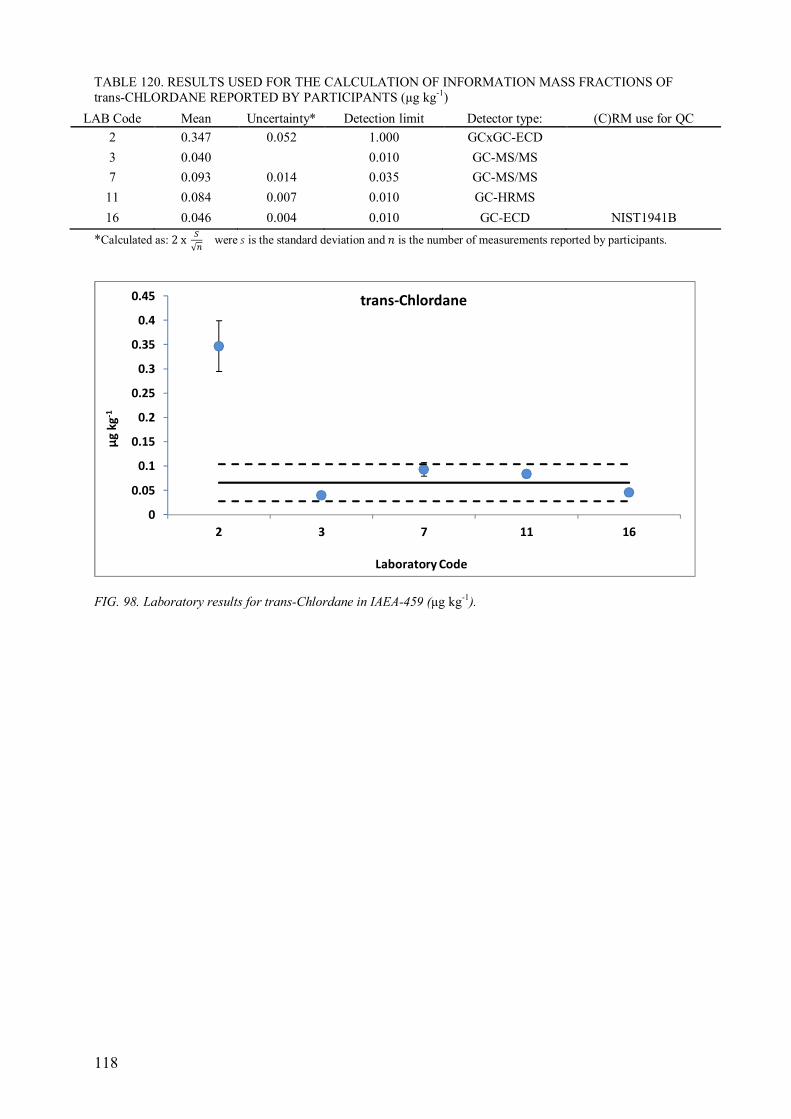
118
TABLE 120. RESULTS USED FOR THE CALCULATION OF INFORMATION MASS FRACTIONS OF
trans-CHLORDANE REPORTED BY PARTICIPANTS (µg kg-1)
LAB Code Mean Uncertainty* Detection limit Detector type: (C)RM use for QC
2 0.347 0.052 1.000 GCxGC-ECD
3 0.040
0.010 GC-MS/MS
7 0.093 0.014 0.035 GC-MS/MS
11 0.084 0.007 0.010 GC-HRMS
16 0.046 0.004 0.010 GC-ECD NIST1941B
*Calculated as: 2x =√> were ? is the standard deviation and @ is the number of measurements reported by participants.
FIG. 98. Laboratory results for trans-Chlordane in IAEA-459 (µg kg-1).
0
0.05
0.1
0.15
0.2
0.25
0.3
0.35
0.4
0.45
2 3 7 11 16
µg
kg
-1
Laboratory Code
trans-Chlordane
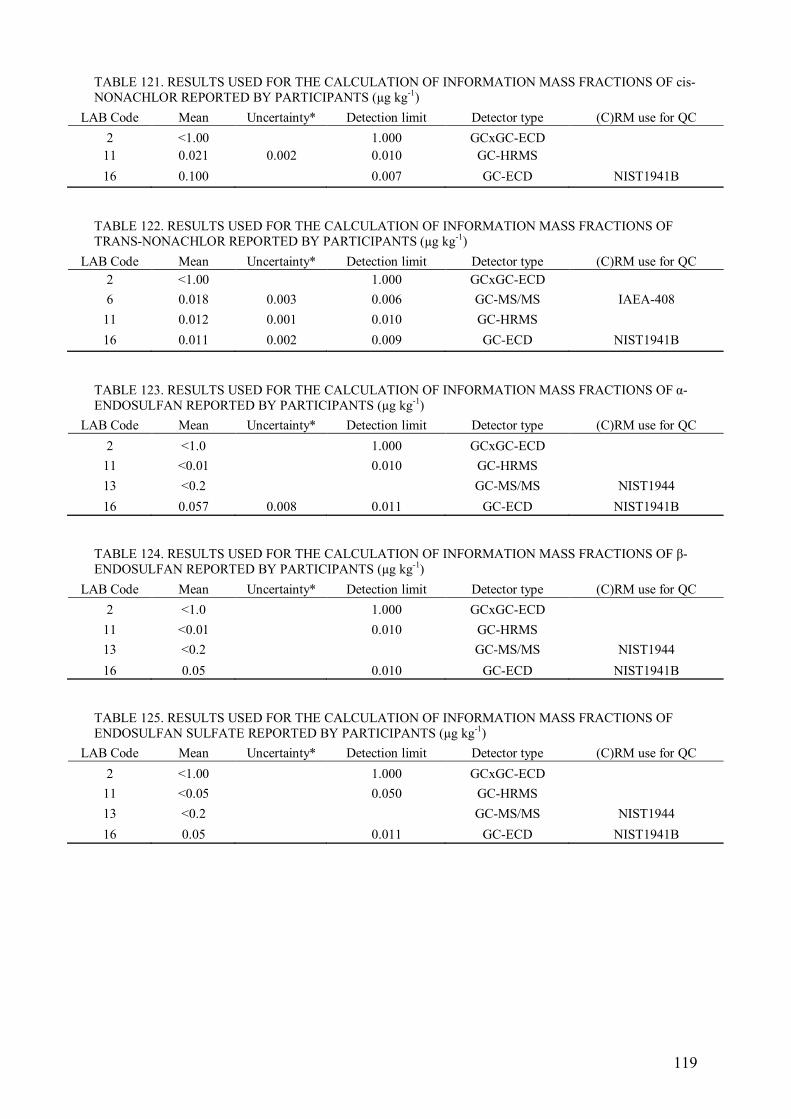
119
TABLE 121. RESULTS USED FOR THE CALCULATION OF INFORMATION MASS FRACTIONS OF cis-
NONACHLOR REPORTED BY PARTICIPANTS (µg kg-1)
LAB Code Mean Uncertainty* Detection limit Detector type (C)RM use for QC
2 <1.00
1.000 GCxGC-ECD
11 0.021 0.002 0.010 GC-HRMS
16 0.100
0.007 GC-ECD NIST1941B
TABLE 122. RESULTS USED FOR THE CALCULATION OF INFORMATION MASS FRACTIONS OF
TRANS-NONACHLOR REPORTED BY PARTICIPANTS (µg kg-1)
LAB Code Mean Uncertainty* Detection limit Detector type (C)RM use for QC
2 <1.00
1.000 GCxGC-ECD
6 0.018 0.003 0.006 GC-MS/MS IAEA-408
11 0.012 0.001 0.010 GC-HRMS
16 0.011 0.002 0.009 GC-ECD NIST1941B
TABLE 123. RESULTS USED FOR THE CALCULATION OF INFORMATION MASS FRACTIONS OF α-
ENDOSULFAN REPORTED BY PARTICIPANTS (µg kg-1)
LAB Code Mean Uncertainty* Detection limit Detector type (C)RM use for QC
2 <1.0
1.000 GCxGC-ECD
11 <0.01
0.010 GC-HRMS
13 <0.2
GC-MS/MS NIST1944
16 0.057 0.008 0.011 GC-ECD NIST1941B
TABLE 124. RESULTS USED FOR THE CALCULATION OF INFORMATION MASS FRACTIONS OF β-
ENDOSULFAN REPORTED BY PARTICIPANTS (µg kg-1)
LAB Code Mean Uncertainty* Detection limit Detector type (C)RM use for QC
2 <1.0
1.000 GCxGC-ECD
11 <0.01
0.010 GC-HRMS
13 <0.2
GC-MS/MS NIST1944
16 0.05 0.010 GC-ECD NIST1941B
TABLE 125. RESULTS USED FOR THE CALCULATION OF INFORMATION MASS FRACTIONS OF
ENDOSULFAN SULFATE REPORTED BY PARTICIPANTS (µg kg-1)
LAB Code Mean Uncertainty* Detection limit Detector type (C)RM use for QC
2 <1.00
1.000 GCxGC-ECD
11 <0.05
0.050 GC-HRMS
13 <0.2
GC-MS/MS NIST1944
16 0.05 0.011 GC-ECD NIST1941B
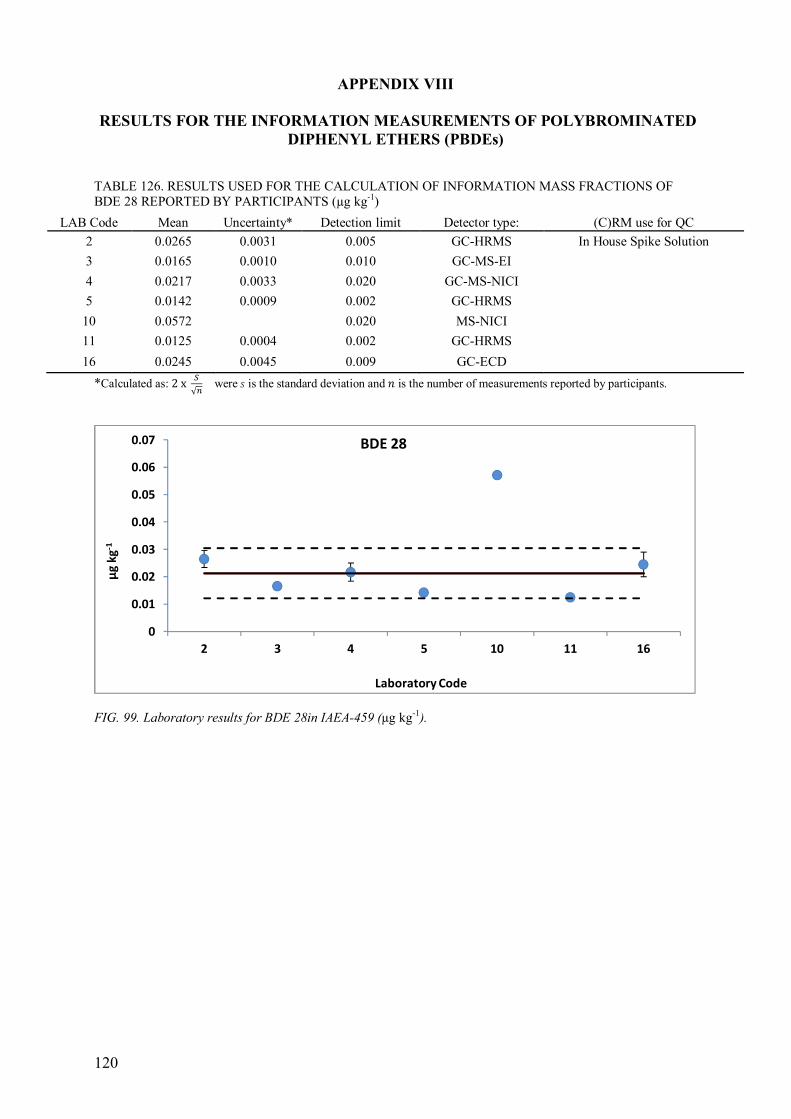
120
APPENDIX VIII
RESULTS FOR THE INFORMATION MEASUREMENTS OF POLYBROMINATED
DIPHENYL ETHERS (PBDEs)
TABLE 126. RESULTS USED FOR THE CALCULATION OF INFORMATION MASS FRACTIONS OF
BDE 28 REPORTED BY PARTICIPANTS (µg kg-1)
LAB Code Mean Uncertainty* Detection limit Detector type: (C)RM use for QC
2 0.0265 0.0031 0.005 GC-HRMS In House Spike Solution
3 0.0165 0.0010 0.010 GC-MS-EI
4 0.0217 0.0033 0.020 GC-MS-NICI
5 0.0142 0.0009 0.002 GC-HRMS
10 0.0572
0.020 MS-NICI
11 0.0125 0.0004 0.002 GC-HRMS
16 0.0245 0.0045 0.009 GC-ECD
*Calculated as: 2x =√> were ? is the standard deviation and @ is the number of measurements reported by participants.
FIG. 99. Laboratory results for BDE 28in IAEA-459 (µg kg-1).
0
0.01
0.02
0.03
0.04
0.05
0.06
0.07
2 3 4 5 10 11 16
µg
kg
-1
Laboratory Code
BDE 28
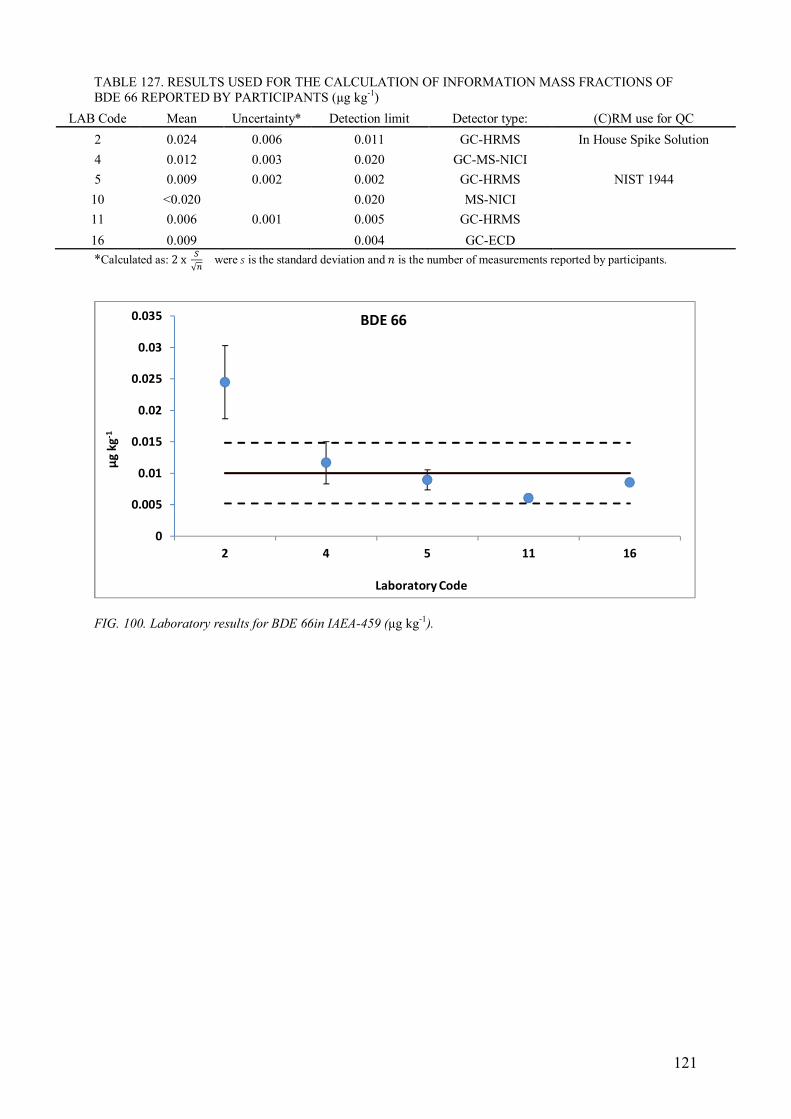
121
TABLE 127. RESULTS USED FOR THE CALCULATION OF INFORMATION MASS FRACTIONS OF
BDE 66 REPORTED BY PARTICIPANTS (µg kg-1)
LAB Code Mean Uncertainty* Detection limit Detector type: (C)RM use for QC
2 0.024 0.006 0.011 GC-HRMS In House Spike Solution
4 0.012 0.003 0.020 GC-MS-NICI
5 0.009 0.002 0.002 GC-HRMS NIST 1944
10 <0.020 0.020 MS-NICI
11 0.006 0.001 0.005 GC-HRMS
16 0.009 0.004 GC-ECD
*Calculated as: 2x =√> were ? is the standard deviation and @ is the number of measurements reported by participants.
FIG. 100. Laboratory results for BDE 66in IAEA-459 (µg kg-1).
0
0.005
0.01
0.015
0.02
0.025
0.03
0.035
2 4 5 11 16
µg
kg
-1
Laboratory Code
BDE 66
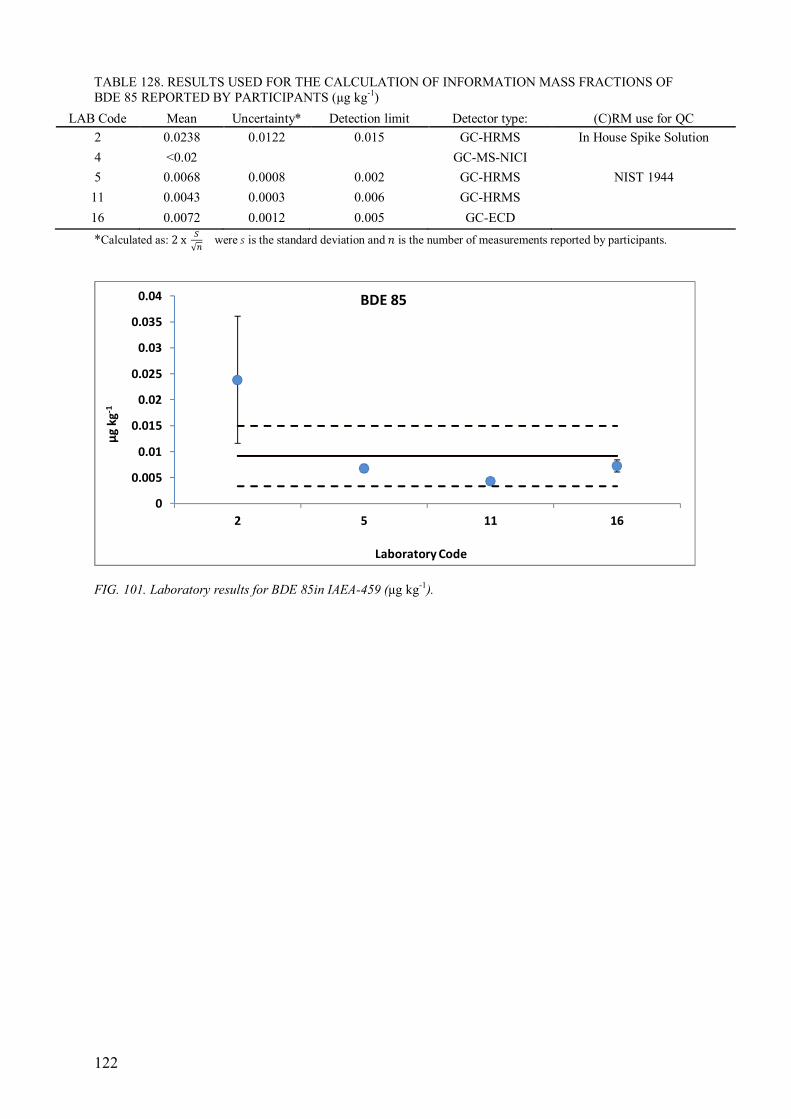
122
TABLE 128. RESULTS USED FOR THE CALCULATION OF INFORMATION MASS FRACTIONS OF
BDE 85 REPORTED BY PARTICIPANTS (µg kg-1)
LAB Code Mean Uncertainty* Detection limit Detector type: (C)RM use for QC
2 0.0238 0.0122 0.015 GC-HRMS In House Spike Solution
4 <0.02 GC-MS-NICI
5 0.0068 0.0008 0.002 GC-HRMS NIST 1944
11 0.0043 0.0003 0.006 GC-HRMS
16 0.0072 0.0012 0.005 GC-ECD
*Calculated as: 2x =√> were ? is the standard deviation and @ is the number of measurements reported by participants.
FIG. 101. Laboratory results for BDE 85in IAEA-459 (µg kg-1).
0
0.005
0.01
0.015
0.02
0.025
0.03
0.035
0.04
2 5 11 16
µg
kg
-1
Laboratory Code
BDE 85
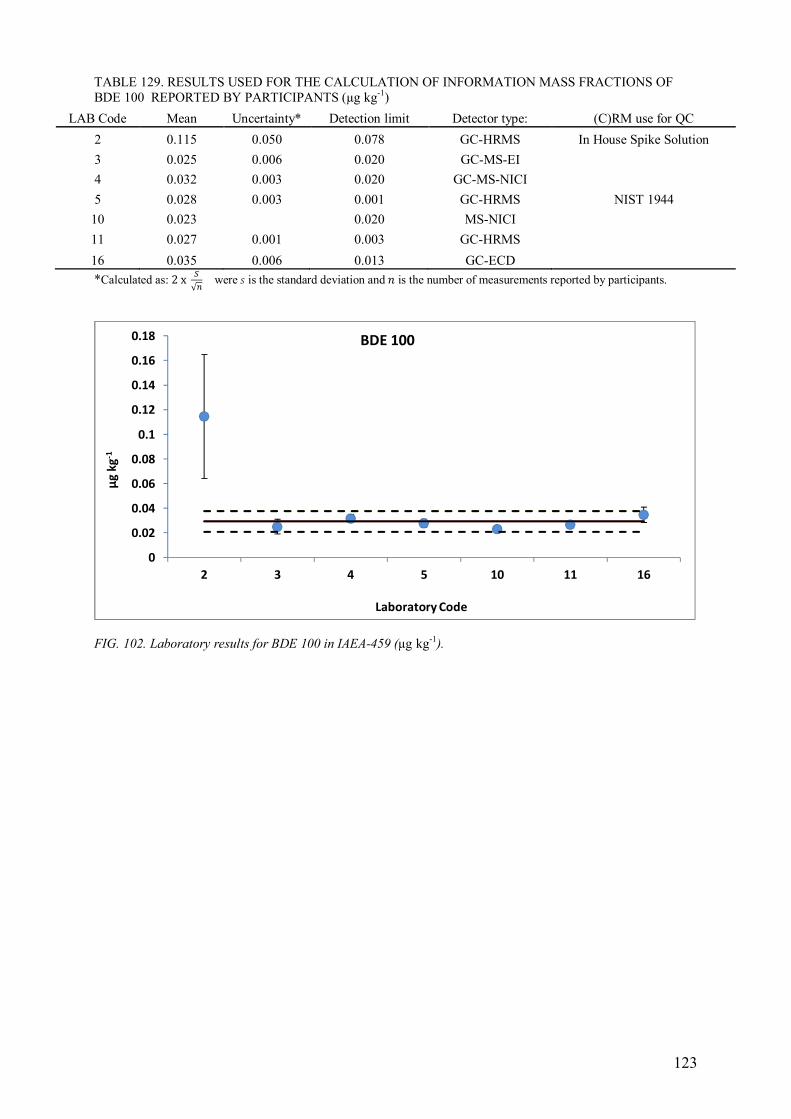
123
TABLE 129. RESULTS USED FOR THE CALCULATION OF INFORMATION MASS FRACTIONS OF
BDE 100 REPORTED BY PARTICIPANTS (µg kg-1)
LAB Code Mean Uncertainty* Detection limit Detector type: (C)RM use for QC
2 0.115 0.050 0.078 GC-HRMS In House Spike Solution
3 0.025 0.006 0.020 GC-MS-EI
4 0.032 0.003 0.020 GC-MS-NICI
5 0.028 0.003 0.001 GC-HRMS NIST 1944
10 0.023
0.020 MS-NICI
11 0.027 0.001 0.003 GC-HRMS
16 0.035 0.006 0.013 GC-ECD
*Calculated as: 2x =√> were ? is the standard deviation and @ is the number of measurements reported by participants.
FIG. 102. Laboratory results for BDE 100 in IAEA-459 (µg kg-1).
0
0.02
0.04
0.06
0.08
0.1
0.12
0.14
0.16
0.18
2 3 4 5 10 11 16
µg
kg
-1
Laboratory Code
BDE 100
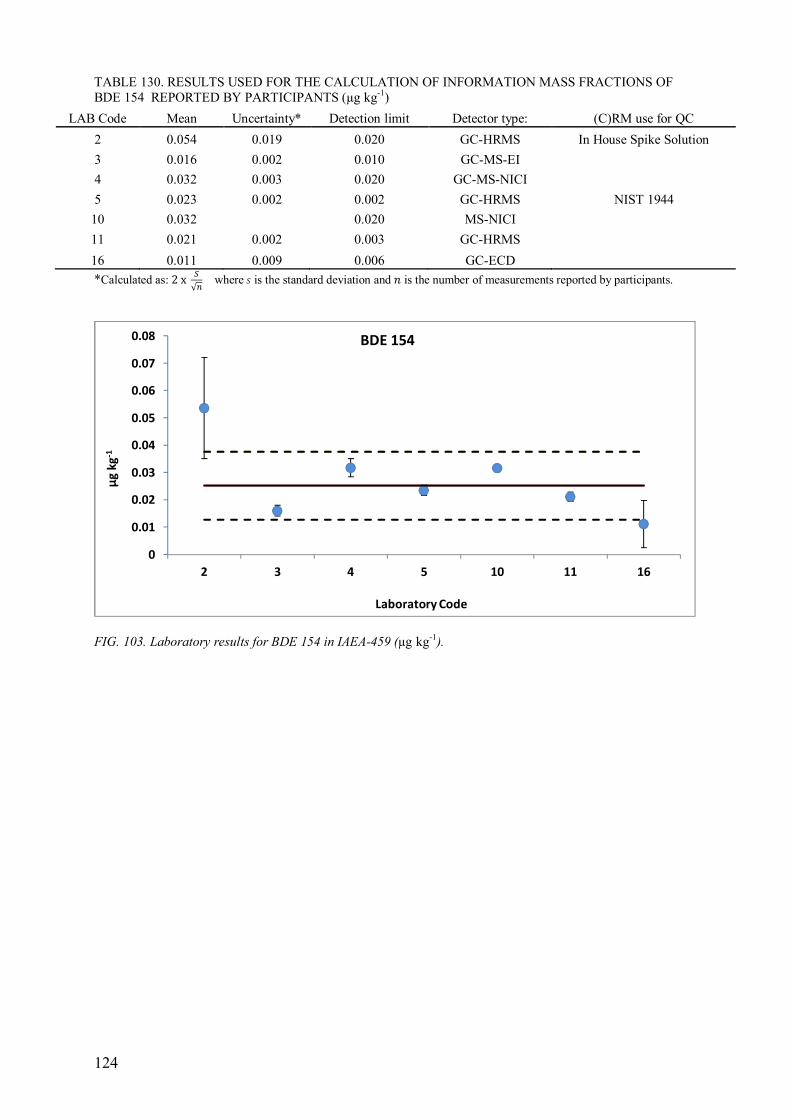
124
TABLE 130. RESULTS USED FOR THE CALCULATION OF INFORMATION MASS FRACTIONS OF
BDE 154 REPORTED BY PARTICIPANTS (µg kg-1)
LAB Code Mean Uncertainty* Detection limit Detector type: (C)RM use for QC
2 0.054 0.019 0.020 GC-HRMS In House Spike Solution
3 0.016 0.002 0.010 GC-MS-EI
4 0.032 0.003 0.020 GC-MS-NICI
5 0.023 0.002 0.002 GC-HRMS NIST 1944
10 0.032
0.020 MS-NICI
11 0.021 0.002 0.003 GC-HRMS
16 0.011 0.009 0.006 GC-ECD
*Calculated as: 2x =√> where ? is the standard deviation and @ is the number of measurements reported by participants.
FIG. 103. Laboratory results for BDE 154 in IAEA-459 (µg kg-1).
0
0.01
0.02
0.03
0.04
0.05
0.06
0.07
0.08
2 3 4 5 10 11 16
µg
kg
-1
Laboratory Code
BDE 154
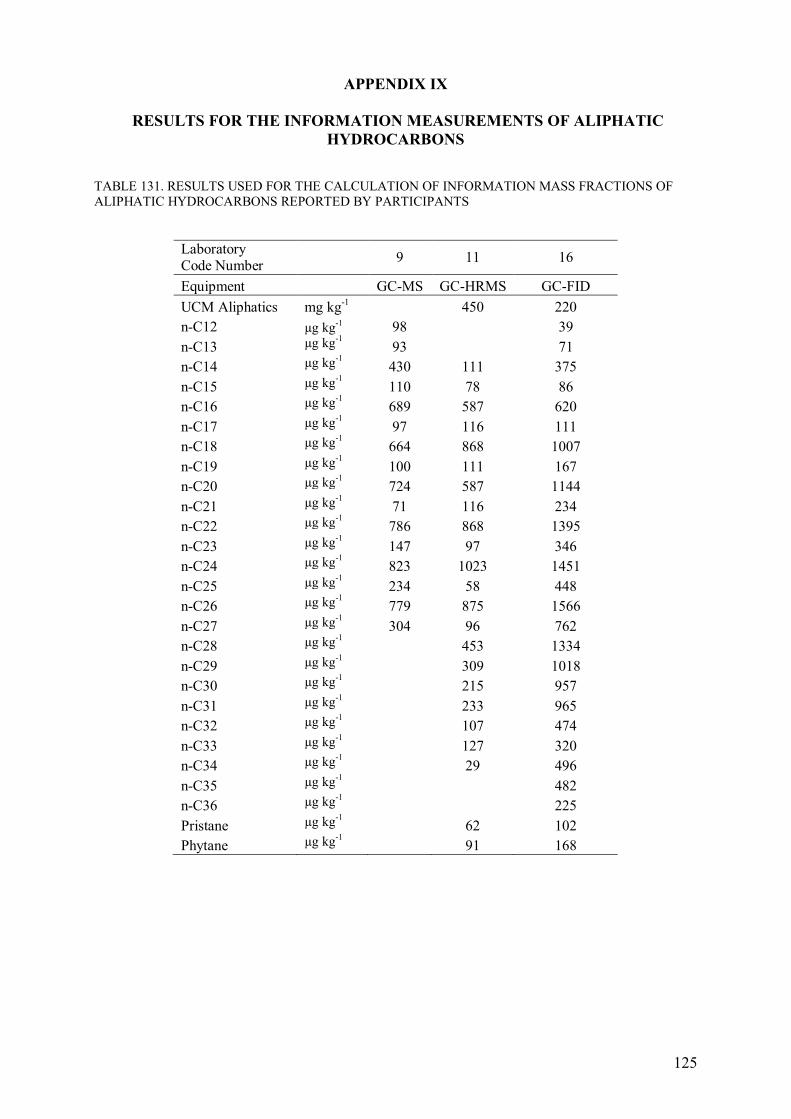
125
APPENDIX IX
RESULTS FOR THE INFORMATION MEASUREMENTS OF ALIPHATIC
HYDROCARBONS
TABLE 131. RESULTS USED FOR THE CALCULATION OF INFORMATION MASS FRACTIONS OF
ALIPHATIC HYDROCARBONS REPORTED BY PARTICIPANTS
Laboratory Code Number
9 11 16
Equipment
GC-MS GC-HRMS GC-FID
UCM Aliphatics mg kg-1
450 220
n-C12 µg kg-1 98
39
n-C13 µg kg-1 93
71
n-C14 µg kg-1 430 111 375
n-C15 µg kg-1 110 78 86
n-C16 µg kg-1 689 587 620
n-C17 µg kg-1 97 116 111
n-C18 µg kg-1 664 868 1007
n-C19 µg kg-1 100 111 167
n-C20 µg kg-1 724 587 1144
n-C21 µg kg-1 71 116 234
n-C22 µg kg-1 786 868 1395
n-C23 µg kg-1 147 97 346
n-C24 µg kg-1 823 1023 1451
n-C25 µg kg-1 234 58 448
n-C26 µg kg-1 779 875 1566
n-C27 µg kg-1 304 96 762
n-C28 µg kg-1
453 1334
n-C29 µg kg-1
309 1018
n-C30 µg kg-1
215 957
n-C31 µg kg-1
233 965
n-C32 µg kg-1
107 474
n-C33 µg kg-1
127 320
n-C34 µg kg-1
29 496
n-C35 µg kg-1
482
n-C36 µg kg-1
225
Pristane µg kg-1
62 102
Phytane µg kg-1
91 168
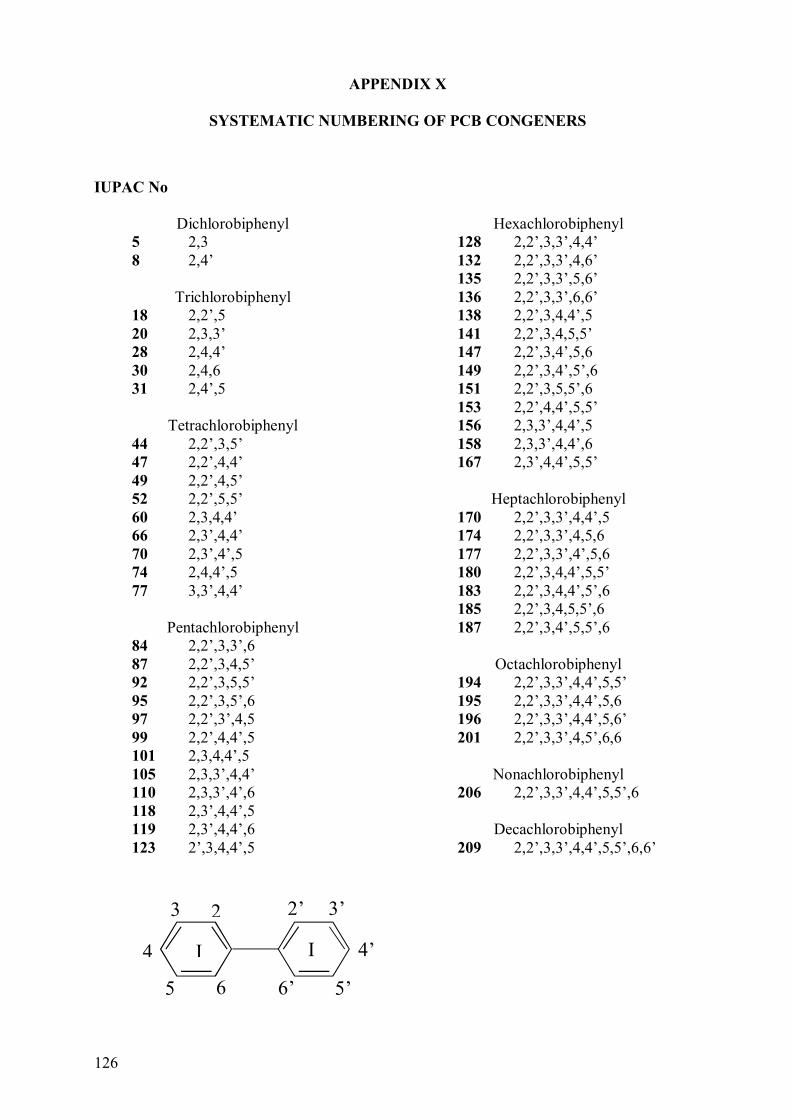
126
APPENDIX X
SYSTEMATIC NUMBERING OF PCB CONGENERS
IUPAC No
Dichlorobiphenyl
5 2,3
8 2,4’
Trichlorobiphenyl
18 2,2’,5
20 2,3,3’
28 2,4,4’
30 2,4,6
31 2,4’,5
Tetrachlorobiphenyl
44 2,2’,3,5’
47 2,2’,4,4’
49 2,2’,4,5’
52 2,2’,5,5’
60 2,3,4,4’
66 2,3’,4,4’
70 2,3’,4’,5
74 2,4,4’,5
77 3,3’,4,4’
Pentachlorobiphenyl
84 2,2’,3,3’,6
87 2,2’,3,4,5’
92 2,2’,3,5,5’
95 2,2’,3,5’,6
97 2,2’,3’,4,5
99 2,2’,4,4’,5
101 2,3,4,4’,5
105 2,3,3’,4,4’
110 2,3,3’,4’,6
118 2,3’,4,4’,5
119 2,3’,4,4’,6
123 2’,3,4,4’,5
Hexachlorobiphenyl
128 2,2’,3,3’,4,4’
132 2,2’,3,3’,4,6’
135 2,2’,3,3’,5,6’
136 2,2’,3,3’,6,6’
138 2,2’,3,4,4’,5
141 2,2’,3,4,5,5’
147 2,2’,3,4’,5,6
149 2,2’,3,4’,5’,6
151 2,2’,3,5,5’,6
153 2,2’,4,4’,5,5’
156 2,3,3’,4,4’,5
158 2,3,3’,4,4’,6
167 2,3’,4,4’,5,5’
Heptachlorobiphenyl
170 2,2’,3,3’,4,4’,5
174 2,2’,3,3’,4,5,6
177 2,2’,3,3’,4’,5,6
180 2,2’,3,4,4’,5,5’
183 2,2’,3,4,4’,5’,6
185 2,2’,3,4,5,5’,6
187 2,2’,3,4’,5,5’,6
Octachlorobiphenyl
194 2,2’,3,3’,4,4’,5,5’
195 2,2’,3,3’,4,4’,5,6
196 2,2’,3,3’,4,4’,5,6’
201 2,2’,3,3’,4,5’,6,6
Nonachlorobiphenyl
206 2,2’,3,3’,4,4’,5,5’,6
Decachlorobiphenyl
209 2,2’,3,3’,4,4’,5,5’,6,6’
2 3
4
5 6
2’ 3’
4’
5’ 6’
I I
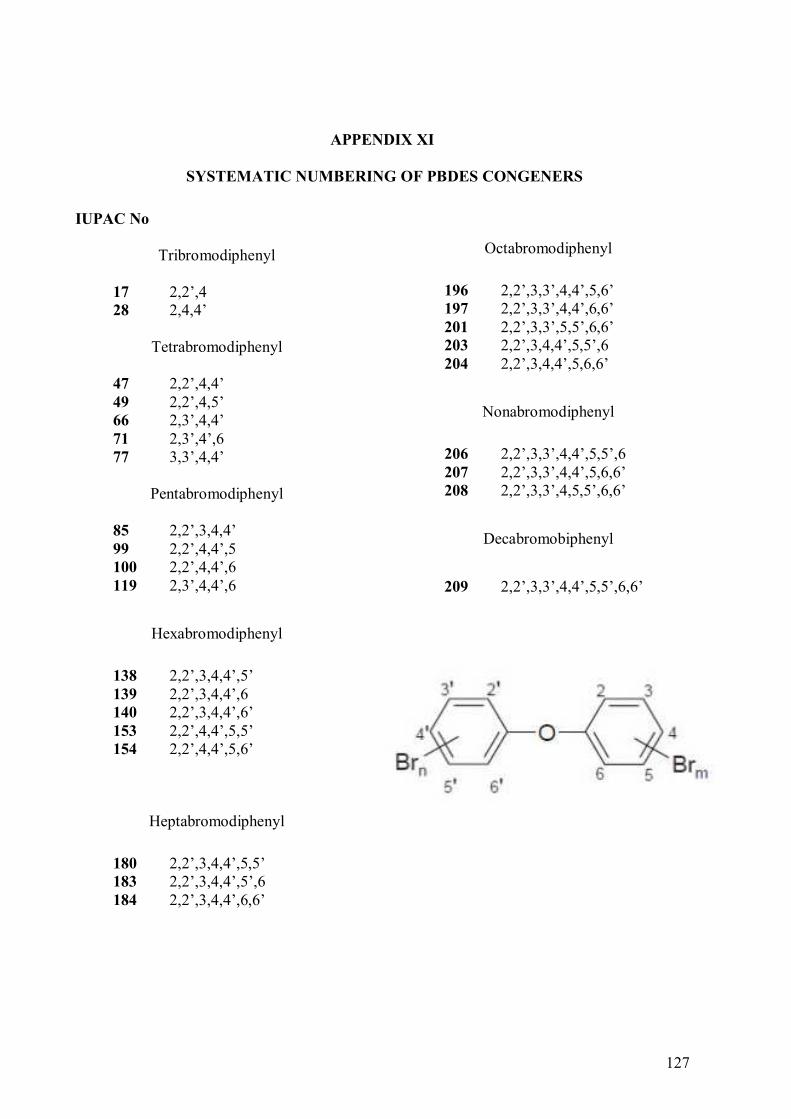
127
APPENDIX XI
SYSTEMATIC NUMBERING OF PBDES CONGENERS
IUPAC No
Tribromodiphenyl
17 2,2’,4
28 2,4,4’
Tetrabromodiphenyl
47 2,2’,4,4’
49 2,2’,4,5’
66 2,3’,4,4’
71 2,3’,4’,6
77 3,3’,4,4’
Pentabromodiphenyl
85 2,2’,3,4,4’
99 2,2’,4,4’,5
100 2,2’,4,4’,6
119 2,3’,4,4’,6
Hexabromodiphenyl
138 2,2’,3,4,4’,5’
139 2,2’,3,4,4’,6
140 2,2’,3,4,4’,6’
153 2,2’,4,4’,5,5’
154 2,2’,4,4’,5,6’
Heptabromodiphenyl
180 2,2’,3,4,4’,5,5’
183 2,2’,3,4,4’,5’,6
184 2,2’,3,4,4’,6,6’
Octabromodiphenyl
196 2,2’,3,3’,4,4’,5,6’
197 2,2’,3,3’,4,4’,6,6’
201 2,2’,3,3’,5,5’,6,6’
203 2,2’,3,4,4’,5,5’,6
204 2,2’,3,4,4’,5,6,6’
Nonabromodiphenyl
206 2,2’,3,3’,4,4’,5,5’,6
207 2,2’,3,3’,4,4’,5,6,6’
208 2,2’,3,3’,4,5,5’,6,6’
Decabromobiphenyl
209 2,2’,3,3’,4,4’,5,5’,6,6’
128
REFERENCES
[1] WORLDWIDE LABORATORY COMPARISON ON THE DETERMINATION OF
ORGANOCHLORINE COMPOUNDS, POLYBROMINATED DIPHENYL ETHERS
AND PETROLEUM HYDROCARBONS IN IAEA-459 SEDIMENT SAMPLE.
IAEA/AQ/xx, Vienna, in progress.
[2] INTERNATIONAL ORGANIZATION FOR STANDARDIZATION, ISO Guide
35:2006, Reference Materials – General and Statistical Principles for Certification, ISO,
Geneva (2006).
[3] LINSINGER T., PAUWELS J., VAN DER VEEN A., SCHIMMEL H., LAMBERTY A.,
Homogeneity and stability of reference materials, Accredit. Qual. Assur. 6 1 (2001) 20–
25.
[4] VAN DER VEEN A., LINSINGER T., PAUWELS J., Uncertainty calculations in the
certification of reference materials. 2 Homogeneity study, Accredit. Qual. Assur. 6 1
(2001) 26–30.
[5] INTERNATIONAL ORGANIZATION FOR STANDARDIZATION, ISO Guide 34:
2009, General requirements for the competence of reference material producers, , ISO,
Geneva (2009).
[6] JOINT COMMITTEE FOR GUIDES IN METROLOGY (JCGM), Evaluation of
measurement data – Guide to the expression of uncertainty in measurement, JCGM 100:
2008 (GUM 1995 with minor corrections), (2008).
http://www.bipm.org/utils/common/documents/jcgm/JCGM_100_2008_E.pdf
[7] SRM 1944. Certificate of Analysis. New York/New Jersey Waterway Sediment (NIST,
Gaithersburg, MD, 2011);
[8] SRM 1941b, Organics in Marine Sediment, (NIST, Gaithersburg, MD, 2015.
[9] INTERNATIONAL ORGANIZATION FOR STANDARDIZATION, Statistical methods
for use in proficiency testing by interlaboratory comparisons, ISO 13528:2005 (E), ISO,
Geneva (2005).
[10] ROYAL SOCIETY OF CHEMISTRY, Analytical Methods Committee (AMC),
Statistical Subcommittee, Representing data distributions with kernel density estimates,
AMC Technical Brief No. 4 (rev., 2006).
[11] ROYAL SOCIETY OF CHEMISTRY, Analytical Methods Committee (AMC),
Statistical Subcommittee, Robust statistics: a method of coping with outliers, AMC
Technical Brief No. 6 (2001).
129
LIST OF PARTICIPATING LABORATORIES
CANADA
Dawood, R. Ontario Ministry of the
Environment and Climate
Change
Laboratory Services Branch
125 Resources Road
ETOBICOKE, ON M9P 3V6
CHINA
Huang, Y.
CNEAC
No 1 Yuhui South Road
Chaoyang District
BEIJING 100029
FRANCE
Budzinski, H.
Molecular Science Institute
(ISM)
CNRS UMR 5255,Bat A12,
LTPC Group
351 cours de la Liberation
33405 TALENCE Cedex
Munschy, C.
IFREMER-
DCN/RBE/BE/LBCO
Departament Ressources
Biologiques et Environnement
Laboratoire de Biogeochimie des
Contaminants organiques
rue de l'Ile d'Yeu, B.P. 21105
44311 NANTES Cedex 3
GERMANY
Kraus, U. R.
Federal Maritime and
Hydrographic Agency
Bernhard-Nocht Strasse 78
20359 HAMBURG
130
ITALY
Sesta, G.
ISPRA – Istituto Superiore
per la Ricerca e la
Protezione Ambientale
Via di Castel Romano 100
00128 Roma
Romanelli, G.
ISPRA – Istituto Superiore
per la Ricerca e la
Protezione Ambientale
Laboratory of Organic
Pollutants
Via di Castel Romano 100
00128 Roma
KOREA
Shim, W. J./ Yim, U. H.
South Sea Institute, KIOST
Oil & POPs research group
391 Jangmok-ri, Jangmok-
myom
J-SHI 656-830,
GYEONGSANGNAM-DO
MONACO
Tolosa, I.
International Atomic
Energy Agency
IAEA Environment
Laboratories
(NAEL-MESL)
4 Quai Antoine 1er
98000 Monaco
MONTENEGRO
Sukovic, D.
PI Center for
ecotoxicological Research
Bulevar Sarla de Gola 2
81000 PODGORICA
131
NORWAY
Klungsoyr, J.
Institute of Marine
Research
(Havforskninginstituttet)
Marine Environmental
Center
Nordnesgaten 50, 5005
Bergen
P.O. Box 1870 Nordnes
N-5817 BERGEN
RUSSIAN FEDERATION
Shelepchikow, A.
A.N. Severtsov Inst.
Ecological & Evolution
Russian Academy of
Sciences
Leninsky Prospekt 33
119071 MOSCOW
UNITED KINGDOM
Bersuder, P.
Centre for Environment,
Fisheries and
Aquaculture Science
Cefas Burnham
Laboratory
Pakefield Road
LOWESTOFT,
SUFFOLK, NR33 0HT

133
CONTRIBUTORS TO DRAFTING AND REVIEW
The following IAEA staff contributed to the draft and review of this report: Tolosa, I., Cassi,
R., Vasileva-Veleva, E., Horsky, M., Fajgelj, A., Barilaro-Hamonic, L., Azemard, S. and
Angelidis, M.

ORDERING LOCALLYIn the following countries, IAEA priced publications may be purchased from the sources listed below or from major local booksellers.
Orders for unpriced publications should be made directly to the IAEA. The contact details are given at the end of this list.
CANADARenouf Publishing Co. Ltd22-1010 Polytek Street, Ottawa, ON K1J 9J1, CANADATelephone: +1 613 745 2665 Fax: +1 643 745 7660Email: [email protected] Web site: www.renoufbooks.com
Bernan / Rowman & Littlefield15200 NBN Way, Blue Ridge Summit, PA 17214, USATel: +1 800 462 6420 • Fax: +1 800 338 4550Email: [email protected] Web site: www.rowman.com/bernan
CZECH REPUBLICSuweco CZ, s.r.o.Sestupná 153/11, 162 00 Prague 6, CZECH REPUBLICTelephone: +420 242 459 205 Fax: +420 284 821 646Email: [email protected] Web site: www.suweco.cz
FRANCEForm-Edit5 rue Janssen, PO Box 25, 75921 Paris CEDEX, FRANCETelephone: +33 1 42 01 49 49 Fax: +33 1 42 01 90 90Email: [email protected] Web site: www.form-edit.com
GERMANYGoethe Buchhandlung Teubig GmbHSchweitzer FachinformationenWillstätterstrasse 15, 40549 Düsseldorf, GERMANYTelephone: +49 (0) 211 49 874 015 Fax: +49 (0) 211 49 874 28Email: [email protected] Web site: www.goethebuch.de
INDIAAllied Publishers1st Floor, Dubash House, 15, J.N. Heredi Marg, Ballard Estate, Mumbai 400001, INDIATelephone: +91 22 4212 6930/31/69 Fax: +91 22 2261 7928Email: [email protected] Web site: www.alliedpublishers.com
Bookwell3/79 Nirankari, Delhi 110009, INDIATelephone: +91 11 2760 1283/4536Email: [email protected] Web site: www.bookwellindia.com
@ No. 25
ITALYLibreria Scientifica “AEIOU”Via Vincenzo Maria Coronelli 6, 20146 Milan, ITALYTelephone: +39 02 48 95 45 52 Fax: +39 02 48 95 45 48Email: [email protected] Web site: www.libreriaaeiou.eu
JAPANMaruzen-Yushodo Co., Ltd10-10 Yotsuyasakamachi, Shinjuku-ku, Tokyo 160-0002, JAPANTelephone: +81 3 4335 9312 Fax: +81 3 4335 9364Email: [email protected] Web site: www.maruzen.co.jp
RUSSIAN FEDERATIONScientific and Engineering Centre for Nuclear and Radiation Safety107140, Moscow, Malaya Krasnoselskaya st. 2/8, bld. 5, RUSSIAN FEDERATIONTelephone: +7 499 264 00 03 Fax: +7 499 264 28 59Email: [email protected] Web site: www.secnrs.ru
UNITED STATES OF AMERICABernan / Rowman & Littlefield15200 NBN Way, Blue Ridge Summit, PA 17214, USATel: +1 800 462 6420 • Fax: +1 800 338 4550Email: [email protected] Web site: www.rowman.com/bernan
Renouf Publishing Co. Ltd812 Proctor Avenue, Ogdensburg, NY 13669-2205, USATelephone: +1 888 551 7470 Fax: +1 888 551 7471Email: [email protected] Web site: www.renoufbooks.com
Orders for both priced and unpriced publications may be addressed directly to:Marketing and Sales UnitInternational Atomic Energy AgencyVienna International Centre, PO Box 100, 1400 Vienna, AustriaTelephone: +43 1 2600 22529 or 22530 • Fax: +43 1 2600 29302 or +43 1 26007 22529Email: [email protected] • Web site: www.iaea.org/books 17
-38081

IAEA/AQ/52
IAEA Analytical Quality in Nuclear Applications Series No. 52
Certification of Mass Fractions of Polycyclic Aromatic Hydrocarbons, Organochlorines and Polybrominated Diphenyl Ethers in IAEA-459 Marine Sediment Sample
INTERNATIONAL ATOMIC ENERGY AGENCYVIENNA
ISSN 2074–7659
Template has: 20 mm spineplease reset it to the corrected spine/