Embed Size (px)
Citation preview
IAEA/AL/079NAHRES-33
REPORT ON THE
INTERCOMPARISON RUN FOR THE DETERMINATION
OF TRACE AND MINOR ELEMENTS
IN
LICHEN MATERIAL
IAEA-336
S. F. Heller-Zeisler, R. Zeisler, E. Zeiller, R. M. Parr,Z. Radecki, K. I. Burns, P. De Regge
Section for Nutritional and Health-related Environmental Studies, Division of Human Health
and
Analytical Quality Control Services, Agency’s Laboratories, Seibersdorf
International Atomic Energy AgencyP.O. Box 100
A-1400 Vienna, Austria
June 1999
CONTENTS
1. Introduction.......................................................................................................................1
2. Scope of the Intercomparison ...........................................................................................1
3. Description of the Material ...............................................................................................2
4. Analyses and Reporting ....................................................................................................2
5. Evaluation of the Results ..................................................................................................3
6. Criteria for Establishing Recommended and Information Values ....................................3
7. Results and Discussion .....................................................................................................4
7.1 General..............................................................................................................................4
7.2. Discussion of results for Elemental analyses....................................................................5
7.2.1. Elements with Recommended Values ..............................................................................5
7.2.2. Elements with Assigned Information Values..................................................................10
7.2.3. Elements which failed both Recommended and Information ValueAcceptance Criteria.........................................................................................................13
7.3. General Remarks.............................................................................................................15
8. Recommendations on Individual Data Review...............................................................16
9. Conclusions.....................................................................................................................16
10. Acknowledgments...........................................................................................................16
References.......................................................................................................................17
Method Codes for the Intercomparison, IAEA-336, Lichen...........................................18
Appendices
Appendix I Summary Table of Results for the Intercomparison.
Appendix II Data Table of the Individual Laboratory Results Sorted by Analyte
Appendix III Graphical Presentation (S-plots) of Results Sorted by Analyte.
Appendix IV List of Participating Laboratories
Appendix V Reference Sheet for IAEA-336 Lichen
Page 1
1. INTRODUCTION
In the last few years, a variety of biological materials have been proposed and used asbiomonitors of environmental pollution. For example, lichens have been used in air pollutionstudies to monitor the levels of trace metals and organic compounds [1-3]. During analyses of thesebiomonitors, it is desirable to have included the analysis of a quality control or certified referencematerial that matches the sample as closely as possible with respect to its matrix and theconcentrations of the constituents of interest to demonstrate the reproducibility and/or accuracy ofthe method. In the case of biomonitors, the number and type of control or reference materials is verylimited. The present intercomparison exercise was organized to characterize a lichen material(identified as IAEA-336) which could then be used as a quality control material for the analysis oflichen biomonitors. The material was characterized for its contents of major and minor elementsusing both nuclear and non-nuclear analytical techniques. The recommended and information valuesfor this lichen were established using standard statistical techniques that had been used by theAgency in many of its intercomparison evaluations.
The lichen material described in this report was produced for the International AtomicEnergy Agency (IAEA) by the Instituto de Ciencias e Engenharia Nucleares (ITN) in Sacavém,Portugal [4]. This report presents the analytical results that were submitted for this lichen by theparticipants of the intercomparison exercise together with a summary of the statistical evaluation ofthe results. Individual participants should be able to use the results to assess their performancerelative to the other participants of the exercise and modify their laboratory’s analytical procedureswhere necessary.
2. SCOPE OF THE INTERCOMPARISON
The intercomparison was publicized both by letters sent out to individuals and laboratoriesthat had previously participated in such intercomparisons and through advertisement in the IAEA’sAnalytical Quality Control Services Catalogue.
Each participant received one bottle of the lichen material, along with an information sheetand a reporting form. Participants were asked to determine as many elements as possible from thefollowing list: Al, As, Br, Cd, Cl, Co, Cu, Hg, I, K, Mg, Mn, Mo, Na, Ni, P, Pb, Sb, Si, Sm, Th, U,and Zn. Participants were also invited to submit results for any additional analytes which they haddetermined.
In addition, each participant received a sample of IAEA-359, cabbage, to be analyzed in thesame analytical run as the lichen material. The intent was to use the IAEA-359 as a quality controlmaterial to be used in the evaluation of each laboratory’s results for the lichen. Unfortunately theintercomparison exercise to characterize IAEA-359 was not completed in time for thisintercomparison and therefore it could not be used as a quality control material. For this reasonresults submitted for IAEA-359 have not been included in this evaluation but will be combined andevaluated together with the results from the original IAEA-359 characterization exercise todetermine overall recommended and information values for the analytes reported.
In total, 42 laboratories from 26 countries submitted results for this intercomparison. Theparticipants reported data for up to 47 major, minor and trace elements. The cut-off date for
Page 2
inclusion of results to be considered for this evaluation was December 1994.
3. DESCRIPTION OF THE MATERIAL
The epiphytic lichen Evernia prunastri (L.) Ach. was collected by hand. The lichen wastaken from the Cistus ladanifer and Quercus species of tree. The collection areas in Portugal wereGavião (centre of Portugal), Ourique and Serra do Cladeirão (south of Portugal) which wereexpected to yield lichen with low levels of metal contamination. Approximately 25 kg of raw lichenmaterial were collected. After removal of debris and other epiphytic lichen species, the remaininglichen was washed in deionized water and oven-dried at 40 oC for 24 hours. The lichen was groundusing a Teflon “mikro-dismembrator” mill. The material which passed through a 125 µm sieve wasmixed in a rotating plastic drum and yielded sufficient material for approximately 800 bottles eachcontaining 20g. In order to confer long-term stability by inhibiting microbial growth, the materialwas sterilized by irradiation to a dose of 12 kGy using a 60Co radiation source.
To evaluate the homogeneity of this material, a number of bottles were selected at randomfor analysis using non-destructive techniques. A total of 20 bottles were sampled for analysis usingINAA and 12 for X-ray fluorescence with two sub-samples, each weighing approximately 100 mg,taken from each bottle to evaluate in-bottle homogeneity. The results, obtained by a one-wayvariance analysis of the INAA measurements (two sub-samples per bottle), indicated good in-bottleand between bottle homogeneity for K, Na, Mn, Br, As, La and Sm [4]. The overall relativestandard deviation of the 40 results averaged approximately 6% with a range of 3-10%. Of this 6%total standard deviation, approximately 4% on average was attributed to the inhomogeneity of thesample, with a maximum of 6% for As. Additional measurements using X-ray fluorescence for Br,Ca, Fe, Sr, and Zn indicated that the relative standard deviation arising from inhomogeneity(shom
2 = stotal2 - smeas
2) ranged from 1.1% for Ca up to 4.4 % for Sr [5]. Although the relative standarddeviation due to the heterogeneity of the sample will vary from element to element, it was deemedprudent to include an extra component of relative uncertainty of 5% in the calculation of theconfidence intervals of all the information and recommended values.
4. ANALYSES AND REPORTING
The participants were requested to determine the total element content in suitably sizedportions (greater than or equal to 100 mg) of the sample by their usual analytical techniques. Theywere requested to make at least three, but preferably six, separate determinations of each elementand to report the results together with a short description of the analytical method used. A reportingform, attached to the information sheet, was provided for this purpose. For each element, theparticipants were requested to report:
1. the average weight of the sample taken for analysis;2. the limit of detection of the analytical method used, defined as the concentration
equivalent to 3 times the standard deviation of the analytical blank signal;3. the method code corresponding to the analytical method. (This was to be selected from a
list supplied with the reporting form, which is given on page 18);4. the water content of the material. (Participants were requested to determine the moisture
content of an independent sub-sample by drying it for two hours at 100 °C and to report
Page 3
all analytical results on a dry weight basis).
5. EVALUATION OF THE RESULTS
The reported results were first evaluated by a computer program, used by the IAEA forintercomparisons [6, 7]. For each analyte, all laboratory means were subjected to four statisticaltests applied consecutively (Dixon’s, Grubb’s, coefficient of skewness, and coefficient of kurtosis).Any result failing one, or more, test was rejected as an outlier and the remaining data were re-testeduntil no further outliers were detected. These tests were applied at a significance level of 95%. Theremaining laboratory means were used to calculate an overall mean, standard deviation, standarderror and 95% confidence interval of the mean for each analyte.
After the overall means were calculated, a number of additional criteria were used toestablish a mean as a recommended, information value. These criteria included: concentration of theanalyte, number of results submitted, number of different analytical methods applied, standarddeviation of the accepted laboratories’ means and percentage of laboratories eliminated as outliers.In addition, any biases between the analytical methods were considered and, if they were significant(t- test), no recommended or information value was given.
6. CRITERIA FOR ESTABLISHING RECOMMENDED AND INFORMATION VALUES
Recommended values for individual elements were assigned if the results for the analyte inquestion met all the following criteria;
1) the overall mean was based on at least 10 accepted laboratory means;2) two or more independent analytical methods were used to provide the overall mean;3) the percentage of laboratory means rejected as outliers was less than or equal to 20% of
the entire set of means;4) the relative uncertainty of the overall mean (relative standard deviation) did not exceed
20% for trace elements (defined here as < 500 mg/kg) and 10% for major elements(> 500 mg/kg);
5) No statistically significant bias could be detected between the different methods.
Information values for individual elements were assigned if the results for the analyte inquestion failed to meet any of the above criteria but met all the following criteria;
1) the relative uncertainty of the mean was less than 30%;2) the percentage of total outlying results did not exceed 30%;3) the overall mean was based on a minimum of 5 laboratories means;4) two or more analytical methods were used to provide the overall mean.5) No statistically significant bias could be detected between the different methods.
Page 4
7. RESULTS AND DISCUSSION
7.1 General
The results of this intercomparison are presented in three ways: Ö as a summary table Ö as tables of results for each analyte sorted alphabetically Ö as graphical representations of results (S-plots) for each analyte sorted alphabetically.
The summary table (Appendix I) provides details concerning the total number of laboratories
that submitted results for each element, the range of laboratory means reported, the number ofoutliers rejected together with the mean, range of the accepted laboratories’ means, their standarddeviation [%] and the corresponding confidence intervals. It should be noted that data presented inthis appendix has not been rounded up (as is the case for data presented in this report and on thereference sheet).
Appendix II lists all the results reported by all the laboratories. The terms used in the tablesare defined as follows:
Mean: This is the overall mean value calculated from the accepted laboratories’means. It is only reported when an information or a recommended value isassigned.
Upper Limit: This is the upper limit of the 95% confidence interval of the recommended orinformation value. It should be noted that the confidence interval wascalculated from the combination of the standard deviation of the mean valueand an additional 5% to account for any variation due to sampleinhomogeneity.
Lower Limit: This is the lower limit of the 95% confidence interval of the recommended orinformation value. It should be noted that the confidence interval wascalculated from the combination of the standard deviation of the mean valueand an additional 5% to account for any variation due to sampleinhomogeneity.
Type: This refers to the status assigned to the mean value for each elementdetermined according to the intercomparison evaluation criteria (see above).The letter “R” corresponds to “recommended” value, the letter “I” correspondsto “information” value and the letter “N” indicates that the final set of resultsfailed both set of criteria.
Lab. ID (#): For anonymity, each laboratory was assigned a unique code number where thecode sequence was randomized to ensure that it did not correspond to the list ofparticipants given in Appendix IV of this report. A sub-code (A, B, C, etc.) wasadded when a laboratory reported two or more sets of results for the sameelement using different methods.
Value 1 - Value 6: This corresponds to the number of results that a participant submitted for aparticular element in the intercomparison.
Det. limit: This value is the detection limit reported by the individual participant for eachelement. Participants were requested to report it based on 3 times the standarddeviation of the analytical blank.
Method: This is a method code used to identify the method employed in the individuallaboratories. A detailed description of each method code is given on page 18.Note: The assignment of a method code is based on the information provided
Page 5
by the participant.Lab mean: The arithmetic mean calculated from all individual results supplied by a
laboratory for a given element.Stdev: This is the standard deviation of a laboratory’s result.Z-score: This is a parameter whose value indicates the level of agreement that a
laboratory mean has with the overall mean. It is defined as the differencebetween the individual laboratory mean and the accepted recommended valuedivided by the standard deviation of the population (IUPAC recommendation[8]).
Outlying values are indicated with gray shading in Appendix II and denoted by a solidsymbol graphically in Appendix III. The graphical presentation (S-plots) of all the laboratory meansreported for a particular element are presented in Appendix III. The laboratory means are plotted inascending concentration on the y-axis with their corresponding laboratory code noted along thex-axis. The error bars represent the standard deviation of the calculated laboratory mean. The codeabove the error bar represents the method code used by the particular laboratory (see page 18). Theoverall mean of all accepted laboratories’ means is given and the expanded confidence interval (toinclude the 5% assigned to inhomogeneity) is shaded. S-plots are presented for all elements where 5or more accepted laboratory means exist. In the case of elements for which no recommended orinformation values are assigned, no confidence interval is given.
7.2 Discussion of results for Elemental analyses
Although only 42 laboratories took part in this intercomparison, it was only possible toestablish recommend values for 19 elements and information values for 14 elements following thecriteria stated in section 6.
7.2.1 Elements with Recommended Values
ArsenicOf the twenty laboratories that reported results for As, three laboratories were excluded as
outliers. The following techniques were used by the laboratories that provided the accepted results:Graphite furnace AAS with and without Zeeman background correction (2), AAS using the hydridegeneration technique (2), RNAA (2), INAA (9) and ICP-MS (2). No bias between the variousmethods was found and all method means were within 10% of the overall mean. The recommendedvalue for As is 0.63 mg/kg with a confidence interval of 0.55 - 0.71 mg/kg.
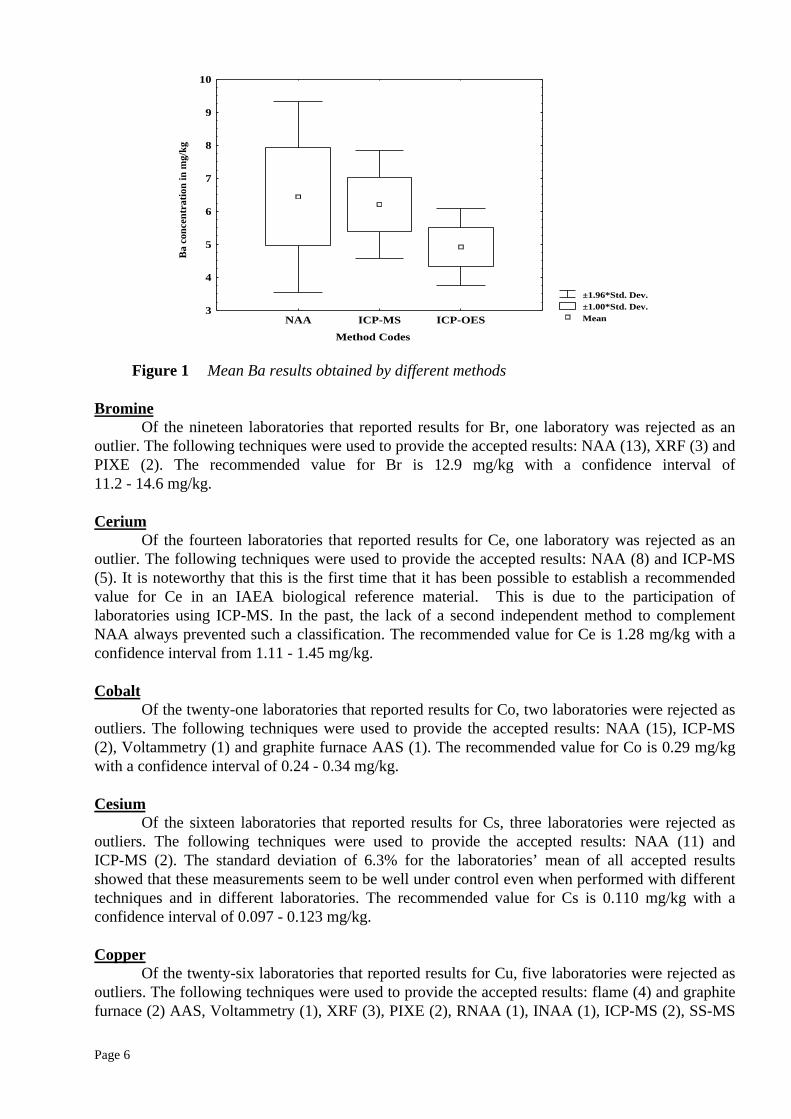
BariumOf the twelve laboratories that reported results for Ba, one laboratory was rejected as an
outlier. The following techniques were used to provide the accepted results: ICP-OES (3), ICP-MS(2) and INAA (6). Although the mean value of the ICP-OES results appears different from the meanvalues obtained by INAA and ICP-MS (Figure 1), statistical evaluation showed no significantdifference between the methods. The recommended value for Ba is 6.4 mg/kg with a confidenceinterval of 5.3 - 7.5 mg/kg.
Page 6
±1.96*Std. Dev.±1.00*Std. Dev.Mean
Method Codes
Ba
conc
entr
atio
n in
mg/
kg
3
4
5
6
7
8
9
10
NAA ICP-MS ICP-OES
Figure 1 Mean Ba results obtained by different methods
BromineOf the nineteen laboratories that reported results for Br, one laboratory was rejected as an
outlier. The following techniques were used to provide the accepted results: NAA (13), XRF (3) andPIXE (2). The recommended value for Br is 12.9 mg/kg with a confidence interval of11.2 - 14.6 mg/kg.
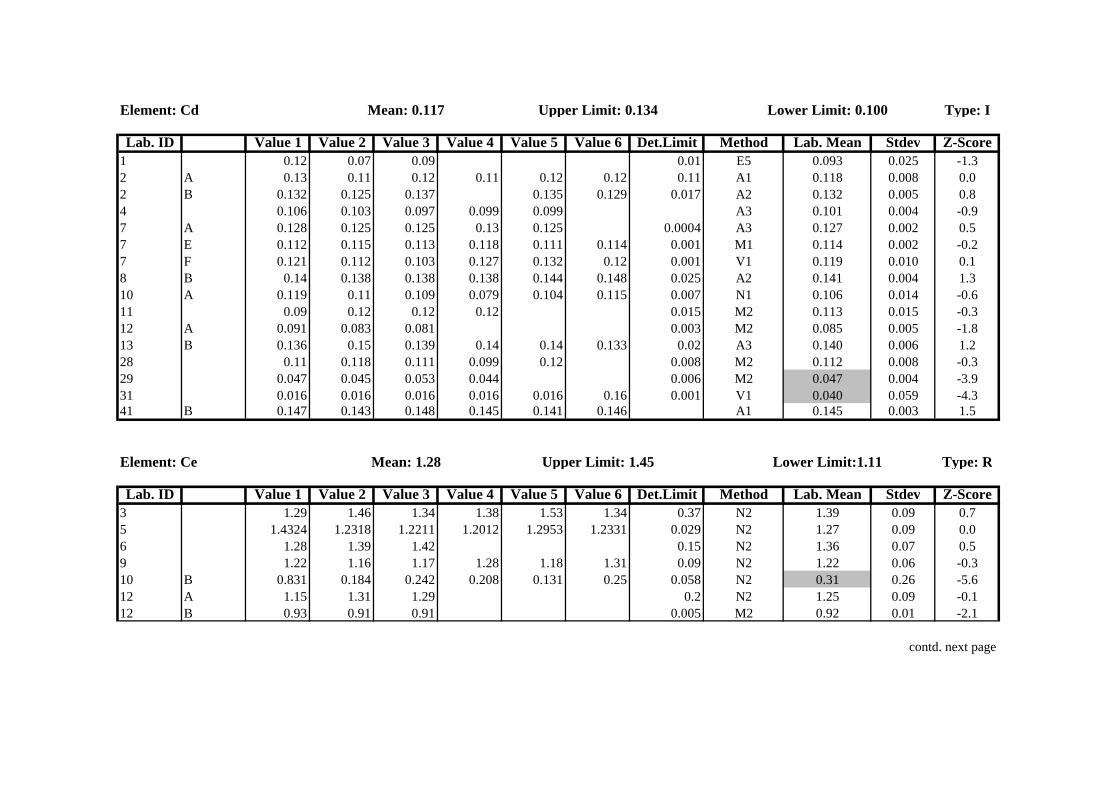
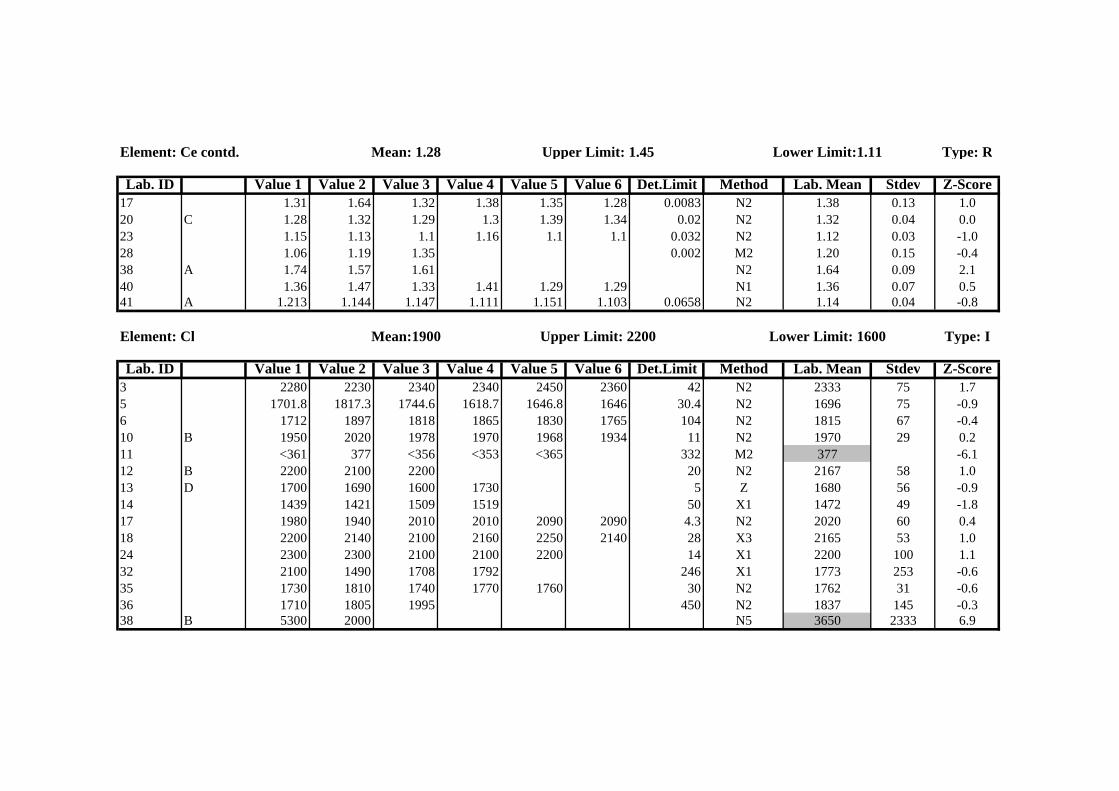
CeriumOf the fourteen laboratories that reported results for Ce, one laboratory was rejected as an
outlier. The following techniques were used to provide the accepted results: NAA (8) and ICP-MS(5). It is noteworthy that this is the first time that it has been possible to establish a recommendedvalue for Ce in an IAEA biological reference material. This is due to the participation oflaboratories using ICP-MS. In the past, the lack of a second independent method to complementNAA always prevented such a classification. The recommended value for Ce is 1.28 mg/kg with aconfidence interval from 1.11 - 1.45 mg/kg.
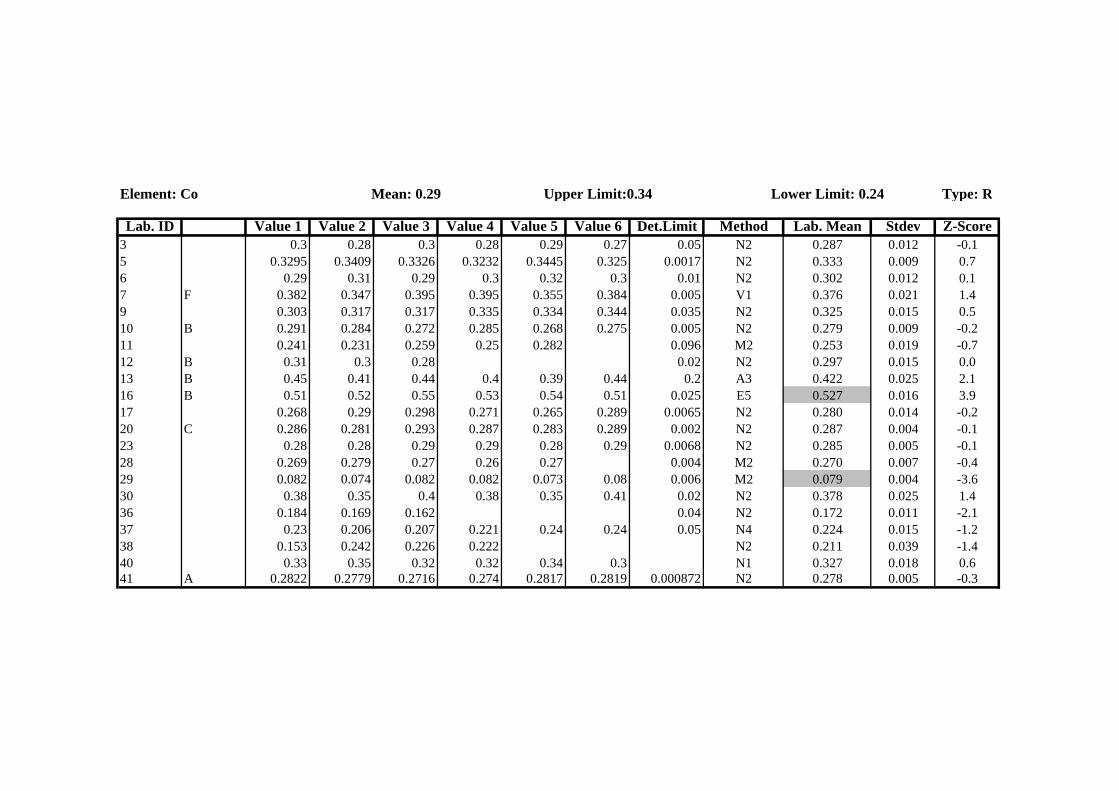
CobaltOf the twenty-one laboratories that reported results for Co, two laboratories were rejected as
outliers. The following techniques were used to provide the accepted results: NAA (15), ICP-MS(2), Voltammetry (1) and graphite furnace AAS (1). The recommended value for Co is 0.29 mg/kgwith a confidence interval of 0.24 - 0.34 mg/kg.
CesiumOf the sixteen laboratories that reported results for Cs, three laboratories were rejected as
outliers. The following techniques were used to provide the accepted results: NAA (11) andICP-MS (2). The standard deviation of 6.3% for the laboratories’ mean of all accepted resultsshowed that these measurements seem to be well under control even when performed with differenttechniques and in different laboratories. The recommended value for Cs is 0.110 mg/kg with aconfidence interval of 0.097 - 0.123 mg/kg.
CopperOf the twenty-six laboratories that reported results for Cu, five laboratories were rejected as
outliers. The following techniques were used to provide the accepted results: flame (4) and graphitefurnace (2) AAS, Voltammetry (1), XRF (3), PIXE (2), RNAA (1), INAA (1), ICP-MS (2), SS-MS
Page 7
(1) and ICP-OES (4). The recommended value for Cu is 3.6 mg/kg with a confidence interval of3.1 - 4.1 mg/kg.
IronOf the thirty-nine laboratories that reported results for Fe, four laboratories were rejected as
outliers. The following techniques were used to provide the accepted results: flame AAS (5), XRF(2), PIXE (4), NAA (15), ICP-MS (2), and ICP-OES (7). No significant difference betweendestructive and non-destructive techniques was observed which is an indication that completedissolution of this matrix could be achieved with the usual digestion techniques. The recommendedvalue for Fe is 430 mg/kg with a confidence interval of 380 - 480 mg/kg.
MercuryOf the fifteen laboratories that reported results for Hg, no laboratory was rejected as an
outlier. The following techniques were used to provide the accepted results: cold vapour AAS (5),RNAA (3) and INAA (7). The recommended value for Hg is 0.20 mg/kg with a confidence intervalof 0.16 - 0.24 mg/kg.
PotassiumOf the twenty-eight laboratories that reported results for K, four laboratories (all of which
used X-ray techniques) were rejected as outliers. The following techniques were used to provide theaccepted results: flame AAS (7), XRF (2), PIXE (1), NAA (13), and ICP-OES (1). Therecommended value for K is 1840 mg/kg with a confidence interval of 1640 - 2040 mg/kg.
LanthanumOf the thirteen laboratories that reported results for La, one laboratory was rejected as an
outlier. The following techniques were used to provide the accepted results: INAA (10) and ICP-MS(2). The recommended value for La is 0.66 mg/kg with a confidence interval of 0.56 - 0.76 mg/kg.
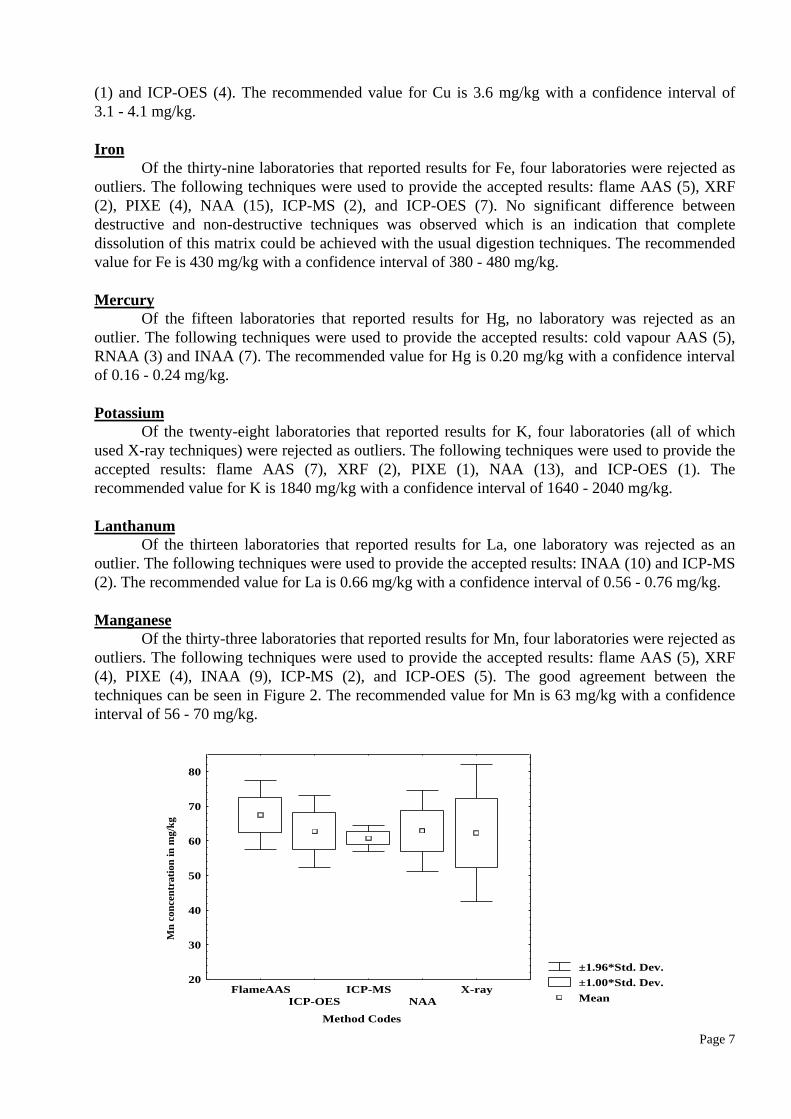
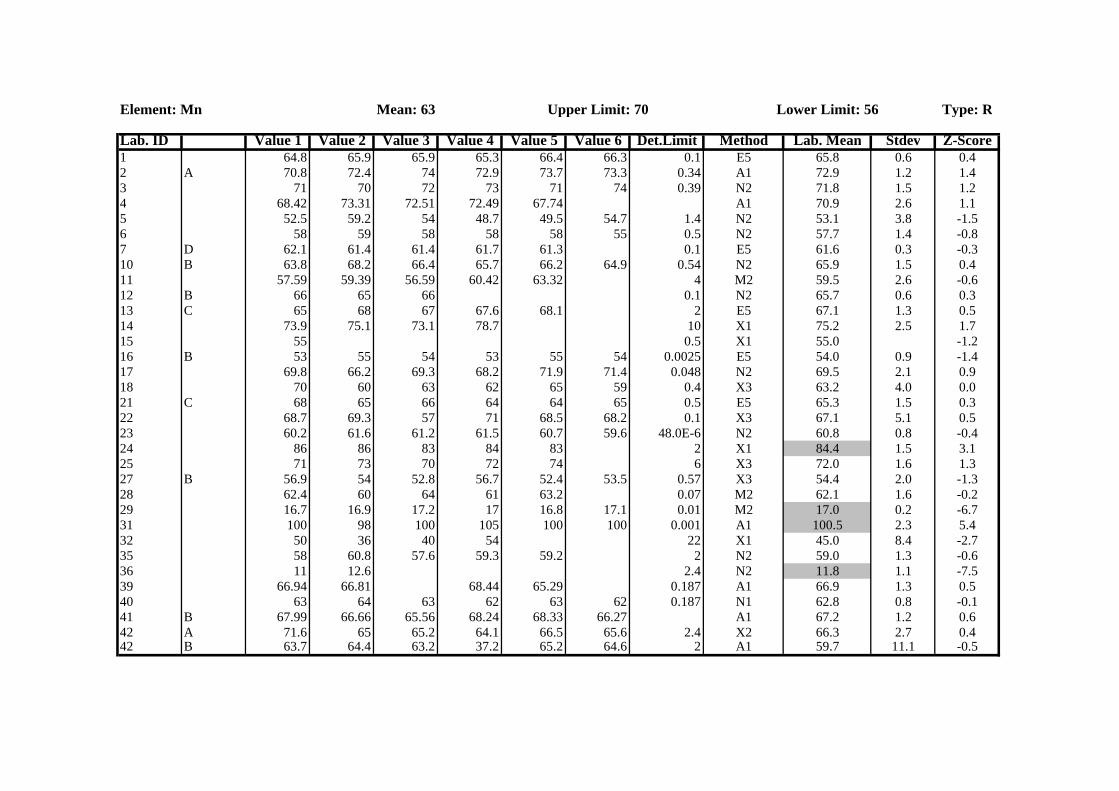
ManganeseOf the thirty-three laboratories that reported results for Mn, four laboratories were rejected as
outliers. The following techniques were used to provide the accepted results: flame AAS (5), XRF(4), PIXE (4), INAA (9), ICP-MS (2), and ICP-OES (5). The good agreement between thetechniques can be seen in Figure 2. The recommended value for Mn is 63 mg/kg with a confidenceinterval of 56 - 70 mg/kg.
±1.96*Std. Dev.±1.00*Std. Dev.Mean
Method Codes
Mn
conc
entr
atio
n in
mg/
kg
20
30
40
50
60
70
80
FlameAASICP-OES
ICP-MSNAA
X-ray
Page 8
Figure 2 Mean Mn results from all analytical techniques used
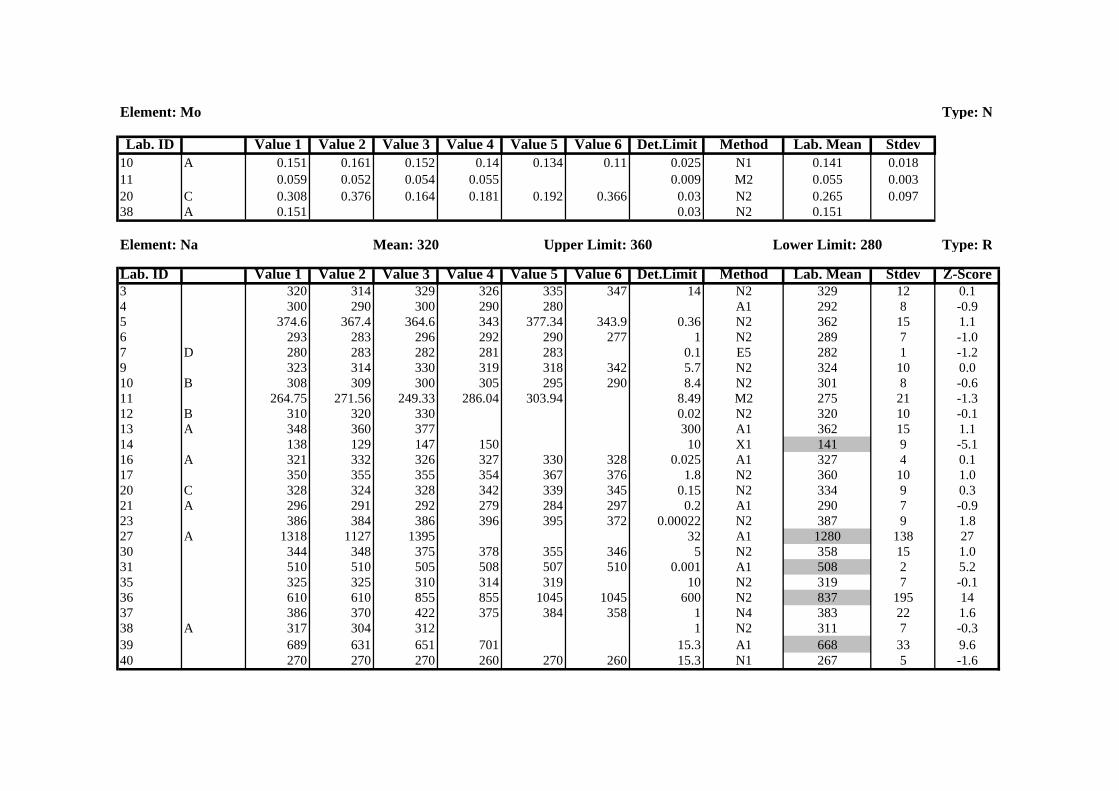
SodiumOf the twenty-five laboratories that reported results for Na, five laboratories were rejected as
outliers. The following techniques were used to provide the accepted results: flame AAS (4), NAA(14), ICP-MS (1) and ICP-OES (1). The high number of outlying results (3 from 7) for flame AASwas surprising and might be an indication that contamination problems are not under control. Therecommended value for Na is 320 mg/kg with a confidence interval of 280 - 360 mg/kg.
AntimonyOf the thirteen laboratories that reported results for Sb, one laboratory was rejected as an
outlier. The following techniques were used to provide the accepted results: RNAA (2), INAA (9),and ICP-OES (1). The recommended value for Sb is 0.073 mg/kg with a confidence interval of0.063 - 0.083 mg/kg.
SeleniumOf the fifteen laboratories that reported results for Se, three laboratories were rejected as
outliers. The following techniques were used to provide the accepted results: hydride generationAAS (1), RNAA (1), INAA (9) and ICP-MS (1). The recommended value for Se is 0.22 mg/kg witha confidence interval of 0.18 - 0.26 mg/kg.
SamariumOf the fifteen laboratories that reported results for Sm, no laboratory was rejected as an
outlier. The following techniques were used to provide the accepted results: NAA (13) and ICP-MS(2). The recommended value for Sm is 0.106 mg/kg with a confidence interval of0.092 - 0.120 mg/kg.
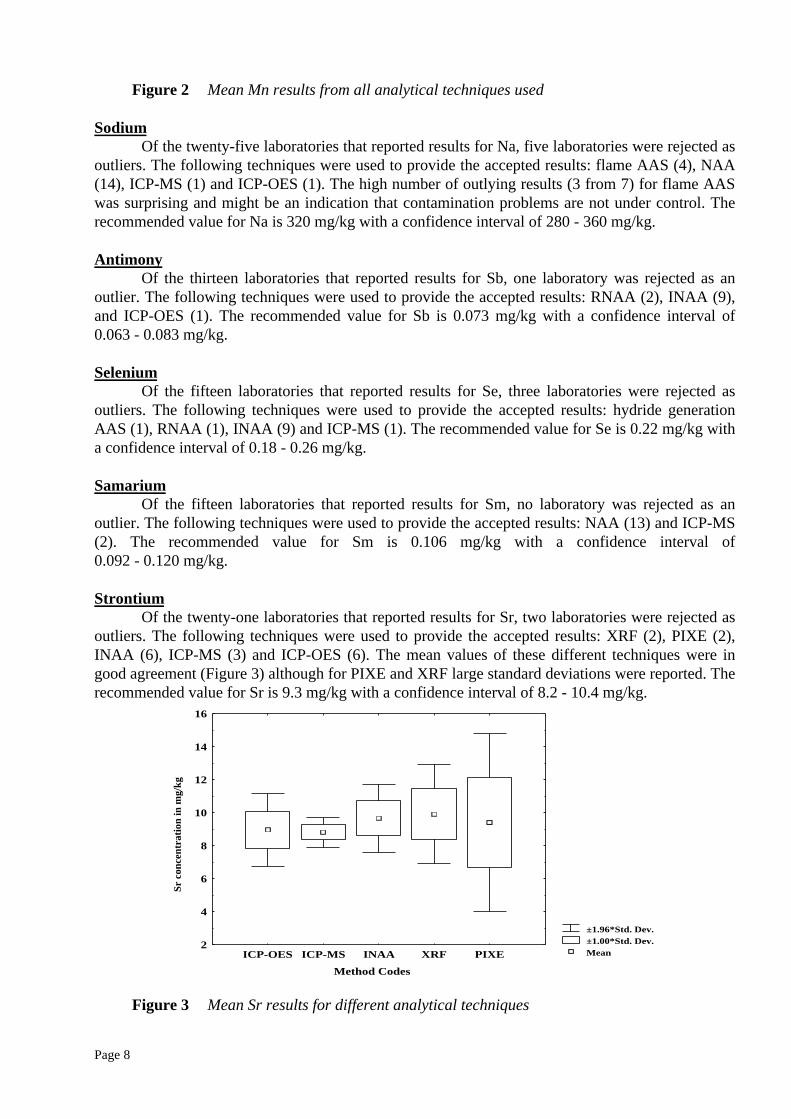
StrontiumOf the twenty-one laboratories that reported results for Sr, two laboratories were rejected as
outliers. The following techniques were used to provide the accepted results: XRF (2), PIXE (2),INAA (6), ICP-MS (3) and ICP-OES (6). The mean values of these different techniques were ingood agreement (Figure 3) although for PIXE and XRF large standard deviations were reported. Therecommended value for Sr is 9.3 mg/kg with a confidence interval of 8.2 - 10.4 mg/kg.
±1.96*Std. Dev.±1.00*Std. Dev.Mean
Method Codes
Sr c
once
ntra
tion
in m
g/kg
2
4
6
8
10
12
14
16
ICP-OES ICP-MS INAA XRF PIXE
Figure 3 Mean Sr results for different analytical techniques
Page 9
ThoriumOf the seventeen laboratories that reported results for Th, one laboratory was rejected as an
outlier. The following techniques were used to provide the accepted results: INAA (14) and ICP-MS(2). The recommended value for Th is 0.14 mg/kg with a confidence interval of 0.12 - 0.16 mg/kg.
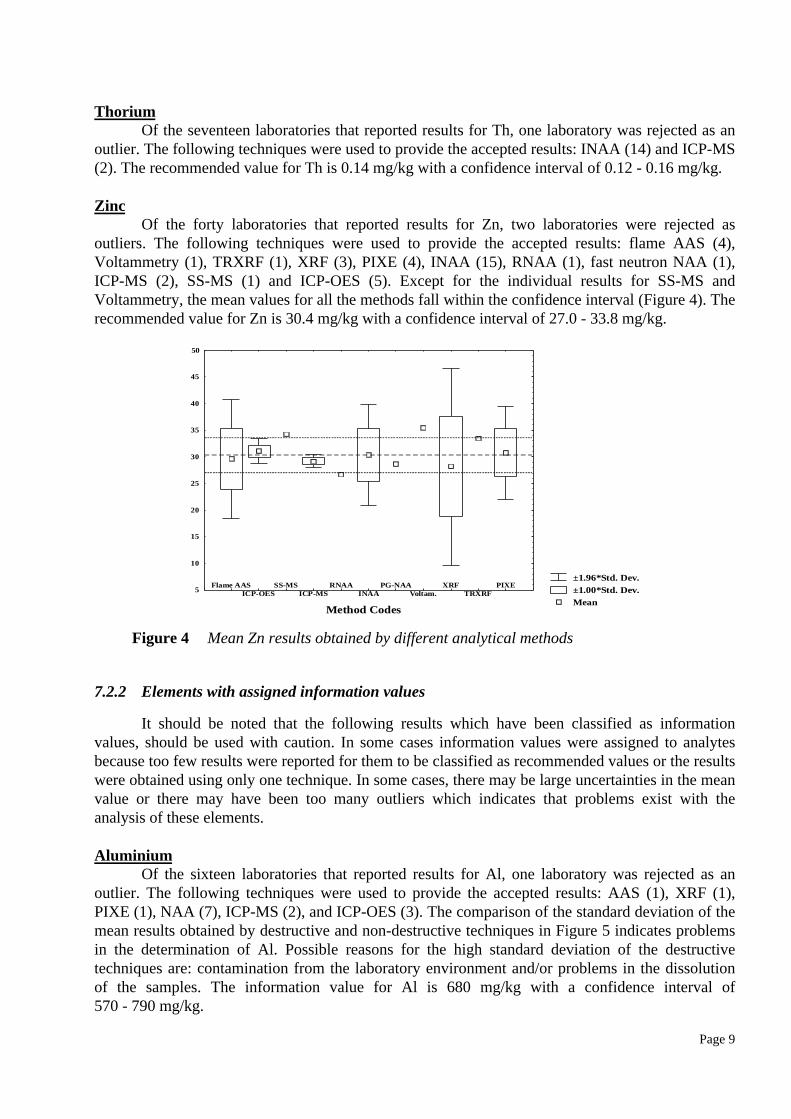
ZincOf the forty laboratories that reported results for Zn, two laboratories were rejected as
outliers. The following techniques were used to provide the accepted results: flame AAS (4),Voltammetry (1), TRXRF (1), XRF (3), PIXE (4), INAA (15), RNAA (1), fast neutron NAA (1),ICP-MS (2), SS-MS (1) and ICP-OES (5). Except for the individual results for SS-MS andVoltammetry, the mean values for all the methods fall within the confidence interval (Figure 4). Therecommended value for Zn is 30.4 mg/kg with a confidence interval of 27.0 - 33.8 mg/kg.
±1.96*Std. Dev.±1.00*Std. Dev.Mean
Method Codes
5
10
15
20
25
30
35
4
5
0
0
45
Flame AASICP-OES
SS-MSICP-MS
RNAAINAA
PG-NAAVoltam.
XRFTRXRF
PIXE
Figure 4 Mean Zn results obtained by different analytical methods
7.2.2 Elements with assigned information values
It should be noted that the following results which have been classified as informationvalues, should be used with caution. In some cases information values were assigned to analytesbecause too few results were reported for them to be classified as recommended values or the resultswere obtained using only one technique. In some cases, there may be large uncertainties in the meanvalue or there may have been too many outliers which indicates that problems exist with theanalysis of these elements.
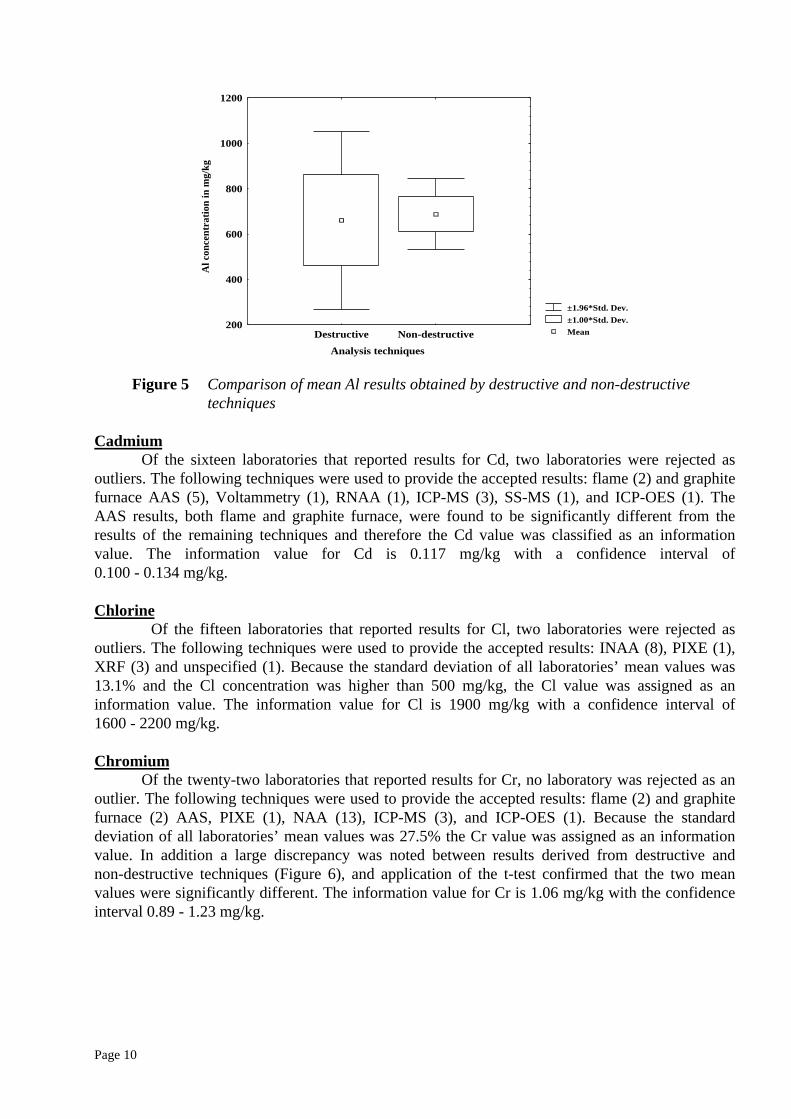
AluminiumOf the sixteen laboratories that reported results for Al, one laboratory was rejected as an
outlier. The following techniques were used to provide the accepted results: AAS (1), XRF (1),PIXE (1), NAA (7), ICP-MS (2), and ICP-OES (3). The comparison of the standard deviation of themean results obtained by destructive and non-destructive techniques in Figure 5 indicates problemsin the determination of Al. Possible reasons for the high standard deviation of the destructivetechniques are: contamination from the laboratory environment and/or problems in the dissolutionof the samples. The information value for Al is 680 mg/kg with a confidence interval of570 - 790 mg/kg.
Page 10
±1.96*Std. Dev.±1.00*Std. Dev.Mean
Analysis techniques
Al c
once
ntra
tion
in m
g/kg
200
400
600
800
1000
1200
Destructive Non-destructive
Figure 5 Comparison of mean Al results obtained by destructive and non-destructivetechniques
CadmiumOf the sixteen laboratories that reported results for Cd, two laboratories were rejected as
outliers. The following techniques were used to provide the accepted results: flame (2) and graphitefurnace AAS (5), Voltammetry (1), RNAA (1), ICP-MS (3), SS-MS (1), and ICP-OES (1). TheAAS results, both flame and graphite furnace, were found to be significantly different from theresults of the remaining techniques and therefore the Cd value was classified as an informationvalue. The information value for Cd is 0.117 mg/kg with a confidence interval of0.100 - 0.134 mg/kg.
ChlorineOf the fifteen laboratories that reported results for Cl, two laboratories were rejected as
outliers. The following techniques were used to provide the accepted results: INAA (8), PIXE (1),XRF (3) and unspecified (1). Because the standard deviation of all laboratories’ mean values was13.1% and the Cl concentration was higher than 500 mg/kg, the Cl value was assigned as aninformation value. The information value for Cl is 1900 mg/kg with a confidence interval of1600 - 2200 mg/kg.
ChromiumOf the twenty-two laboratories that reported results for Cr, no laboratory was rejected as an
outlier. The following techniques were used to provide the accepted results: flame (2) and graphitefurnace (2) AAS, PIXE (1), NAA (13), ICP-MS (3), and ICP-OES (1). Because the standarddeviation of all laboratories’ mean values was 27.5% the Cr value was assigned as an informationvalue. In addition a large discrepancy was noted between results derived from destructive andnon-destructive techniques (Figure 6), and application of the t-test confirmed that the two meanvalues were significantly different. The information value for Cr is 1.06 mg/kg with the confidenceinterval 0.89 - 1.23 mg/kg.

Page 11
±1.96*Std. Dev.±1.00*Std. Dev.Mean
Analysis Technique
Cr
conc
entr
atio
n in
mg/
kg
0.2
0.4
0.6
0.8
1.0
1.2
1.4
1.6
1.8
Destructive Non-destructive
Figure 6 Comparison of Cr results derived from destructive and non-destructive analysistechniques
EuropiumOf the ten laboratories that reported results for Eu, one laboratory was rejected as an outlier.
The following techniques were used to provide the accepted results: INAA (8) and RNAA (1). Theinformation value for Eu is calculated to be 0.023 mg/kg. The confidence interval ranges from0.019 - 0.027 mg/kg.
LutetiumOf the five laboratories that reported results for Lu, no laboratory was rejected as an outlier.
The following techniques were used to provide the accepted results: NAA (4) and ICP-MS (1).Although the standard deviation was 26%, Lu meets the criteria for an information value. Theinformation value for Lu is 0.0066 mg/kg with a confidence interval of 0.0042 - 0.0090 mg/kg.
NeodymiumOf the five laboratories that reported results for Nd, no laboratory was rejected as an outlier.
The following techniques were used to provide the accepted results: NAA (4) and ICP-MS (1).Because fewer than ten laboratories reported results for Nd, it was classified as an informationvalue. The information value for Nd is 0.60 mg/kg with a confidence interval of 0.42 - 0.78 mg/kg.Phosphorus
Of the thirteen laboratories that reported results for P, one laboratory was rejected as anoutlier. The following techniques were used to provide the accepted results: Colourimetry (2),ICP-OES (5), ICP-MS (1), PIXE (1), XRF (2) and INAA (1). Because the standard deviation of themean exceeded 20%, the P value was classified as an information value. The information value forP is 610 mg/kg with a confidence interval of 490 - 730 mg/kg.
LeadPb failed the IAEA’s rigid classification criteria to be considered as an information value for
this intercomparison exercise because the number of rejected laboratory means exceeded 30% (8 outof 22). But since Pb is an important toxic element it was decided to incorporate the results obtainedfrom a Co-ordinated Research Project on “Validation and application of plants as biomonitors oftrace element atmospheric pollution, analyzed by nuclear and related techniques” for the finalevaluation (these participants are listed in Appendix IV). Of the 29 laboratories that reported results,
Page 12
6 laboratories were rejected as outliers, most of them using X-ray related techniques. The followingtechniques were used to provide the accepted results: flame (2) and graphite furnace (6) AAS,ICP-OES (5), ICP-MS (4), SS-MS (1), PIXE (3), TRXRF (1) and Voltammetry (1). The informationvalue for Pb is 4.9 mg/kg with a confidence interval of 4.3 - 5.5 mg/kg.
RubidiumOf the seventeen laboratories that reported results for Rb, one laboratory was rejected as an
outlier. The following techniques were used to provide the accepted results: X-ray relatedtechniques (4), NAA (10) and ICP-MS (2). Because there was a significant difference between themean of the X-ray related techniques (1.99 ± 0.15 mg/kg) and the means of NAA(1.69 ± 0.15 mg/kg) and ICP-MS (1.66 ± 0.04 mg/kg), the Rb value was classified as an informationvalue. The information value for Rb is 1.76 mg/kg with a confidence interval of 1.54 - 1.98 mg/kg.
ScandiumOf the fourteen laboratories that reported results for Sc, one laboratory was rejected as an
outlier. The following techniques were used to provide the accepted results: RNAA (1), INAA (11)and fast neutron NAA (1). Because all the techniques were NAA related it was decided to classifySc as an information value. The information value for Sc is 0.17 mg/kg with a confidence intervalof 0.15 - 0.19 mg/kg.
TerbiumOf the seven laboratories that reported results for Tb, no laboratory was rejected as outlier.
The following techniques were used to provide the accepted results: INAA (6) and ICP-MS (1).Because less than ten laboratories reported results for Tb, the mean was assigned as an informationvalue. The information value for Tb is 0.014 mg/kg with a confidence interval of0.012 - 0.016 mg/kg.
VanadiumOf the ten laboratories that reported results for V, two laboratories were rejected as outliers.
The following techniques were used to provide the accepted results: ICP-MS (2), ICP-OES (1) andINAA (4) and RNAA (1). Because there was a statistically significant difference between the meanof the INAA results and those of the destructive techniques (RNAA, ICP-MS and ICP-OES) andonly 8 laboratories’ means were accepted, the value for V was classified as an information value.The information value for V is 1.47 mg/kg with a confidence interval of 1.25 - 1.69 mg/kg.
YtterbiumOf the five laboratories that reported results for Yb, no laboratory was rejected as an outlier.
The following techniques were used to provide accepted results: NAA (4) and ICP-MS (1). Becausefewer than ten laboratories reported results for Yb, the value for Yb was classified as an informationvalue. The information value for Yb is 0.037 mg/kg with the confidence interval of0.025 - 0.049 mg/kg.
7.2.3 Elements which failed both Recommended and Information Value Acceptance Criteria
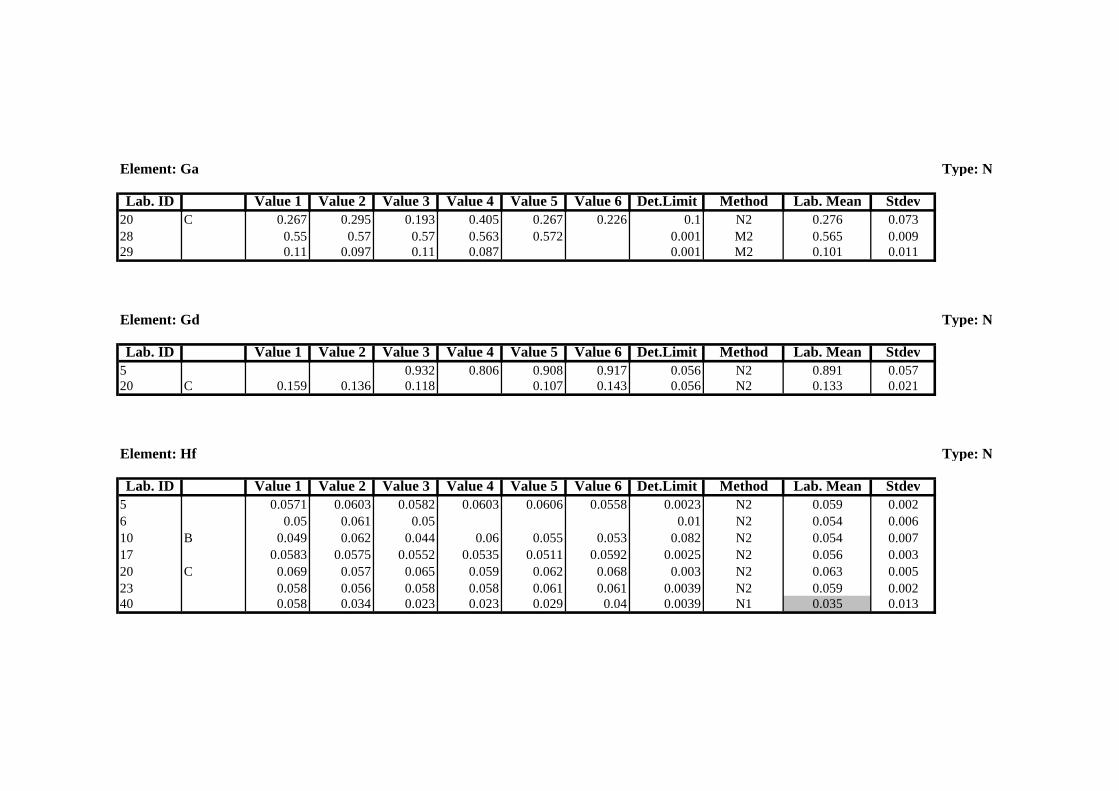
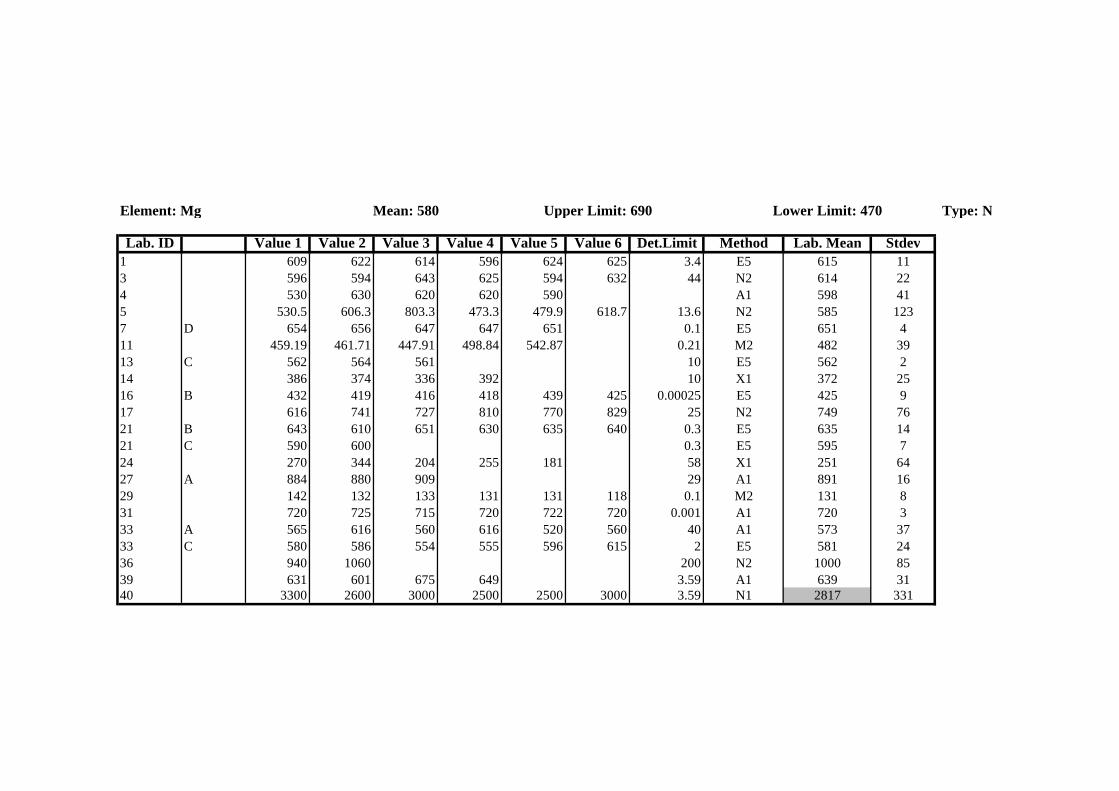
A total of 27 elements failed to meet the minimum criteria to be assigned as a recommendedor an information value. Of these 27, a total of 18 failed because too few (less than 5) laboratoriesreported results (Au, Be, Bi, Er, Ga, Gd, Ho, I, Li, Mo, Pr, S, Sn, Tl, Tm, W, Y, Zr), a total of 7failed because the standard deviation of the means was too high (Ag, Ca, Mg, Ni, Si, Ti, U) while 2failed (Hf and Ta) because results from only one method (NAA) were accepted after outlier tests.
Of all the elements which failed to even the minimum criteria for acceptance as an

Page 13
information value the results for four important and frequently measured elements merit furtheranalysis to find a possible explanation for their unexpected failure.
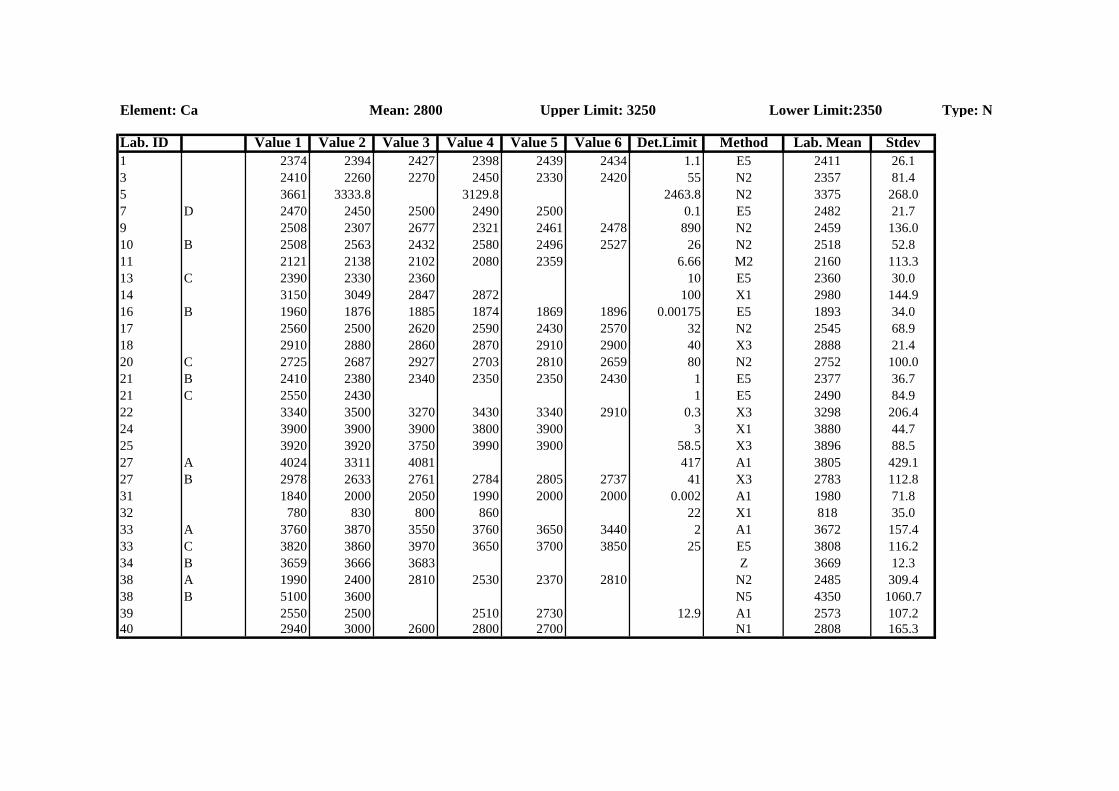
CalciumResults for calcium was produced by twenty-nine laboratories none of which was rejected as
an outlier. The range of the results was large (standard deviation of 26.8% at a concentration ofabout 2800 mg/kg) and exceeded the limit for the overall mean to be assigned as an informationvalue. The mean values of all methods are presented in Figure 7 which clearly demonstrates thelarge variation reported by various laboratories using different analytical techniques. This largevariation could not be ascribed to inhomogeneity as this was evaluated using samples from theoriginal bulk material and found to contribute less than 2% to the overall uncertainty of themeasurements. An additional problem with the calcium data is that it is not normally distributed ascan be seen in Figure 8 where a fitted normal distribution is superimposed on the calcium histogramdata. Without detailed information on the methods applied (e.g. details on calibration standards,reference materials, reagents, blanks) it is not possible to identify and exclude biased values fromthis population.
+-1.96*Std. Dev.+-1.00*Std.Dev.Mean
Methods
Ca
conc
entr
atio
n in
mg/
kg
-2000
-1000
0
1000
2000
3000
4000
5000
6000
7000
ICP-OESINAA
ICP-MSXRF
PIXEFlame AAS
OtherPGNAA
RNAA
Figure 7 Mean Ca results obtained with different methods
Ca concentration [mg/kg]
No.
of o
bser
vatio
ns
0
1
2
3
4
5
6
7
8
9
10
<500 750 1250 1750 2250 2750 3250 3750 4250 > 4500
Figure 8 Histogram showing the distribution of the Ca values
Page 14
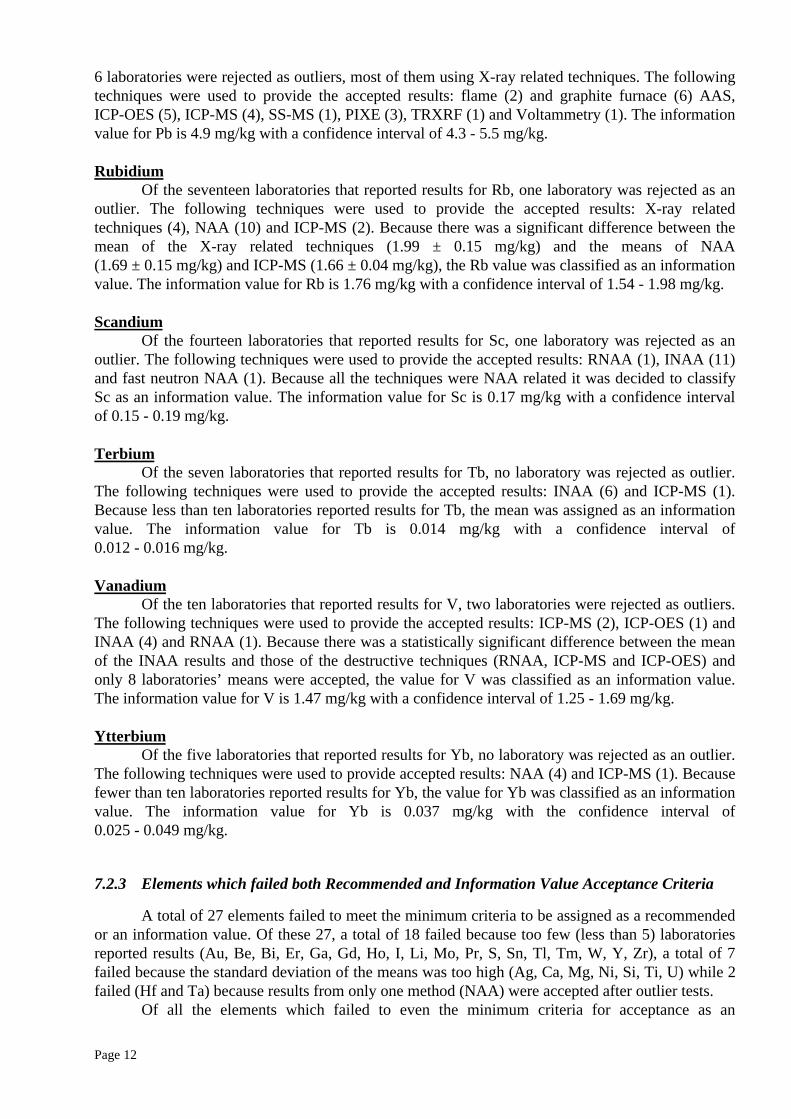
MagnesiumMagnesium is another element where surprisingly poor agreement was observed among the
laboratories. Of the twenty-one laboratories that submitted results, only one mean was excluded asan outlier. The set of accepted results was normally distributed and yielded an overall standarddeviation of the consensus mean of 33.4% which exceeded the limit to be assigned as aninformation value. The evaluation of the standard deviation of means associated with variousanalytical methods yielded a range from 13% for ICP-OES to 80% for ICP-MS. INAA, XRF andflame AAS also showed high variances (Figure 9).
±1.96*Std. Dev.±1.00*Std. Dev.Mean
Method Codes
Mg
con
cent
rati
on in
mg/
kg
-400
-200
0
200
400
600
800
1000
1200
Flame AASICP-OES
ICP-MSNAA
XRF
Figure 9 Mean Mg results obtained by different Methods
NickelOf the eighteen laboratories that submitted results for nickel, one result was rejected as an
outlier. Further analysis of the data indicated that the results from the nine methods used for analysiscould be sorted into three distinct groups each with a different mean of means. PIXE, TRXRF andVoltammetry yielded a group mean of 3.1 ± 0.2 mg/kg. INAA and XRF yielded a mean of 1.52 ±0.46 mg/kg while the remaining destructive techniques (flame and graphite furnace AAS, ICP-MSand ICP-OES) yielded a group mean of 1.07 ± 0.27 mg/kg. While these two latter means are notsignificantly different, the first group was excluded on the basis of a t-test. An additional problem isthat the relative standard deviation for the all the accepted laboratory means for Ni exceeded 50 %.Under these circumstances it was not possible to give an informational value for Ni.
UraniumTen laboratories reported results for U and none was rejected as an outlier. The relative
standard deviation of the mean was 36% which exceeds the criterion for it to be classified as aninformation value. If a t-test had been performed in addition to the four standard outlier tests, onelaboratory mean which was very low would have been rejected which would have reduced therelative standard deviation of the nine remaining laboratories to 26.2 %. This would have led touranium qualifying as an information value of 0.04 mg/kg with a confidence interval of0.03 - 0.05 mg/kg for U.
7.3 General Remarks
Page 15
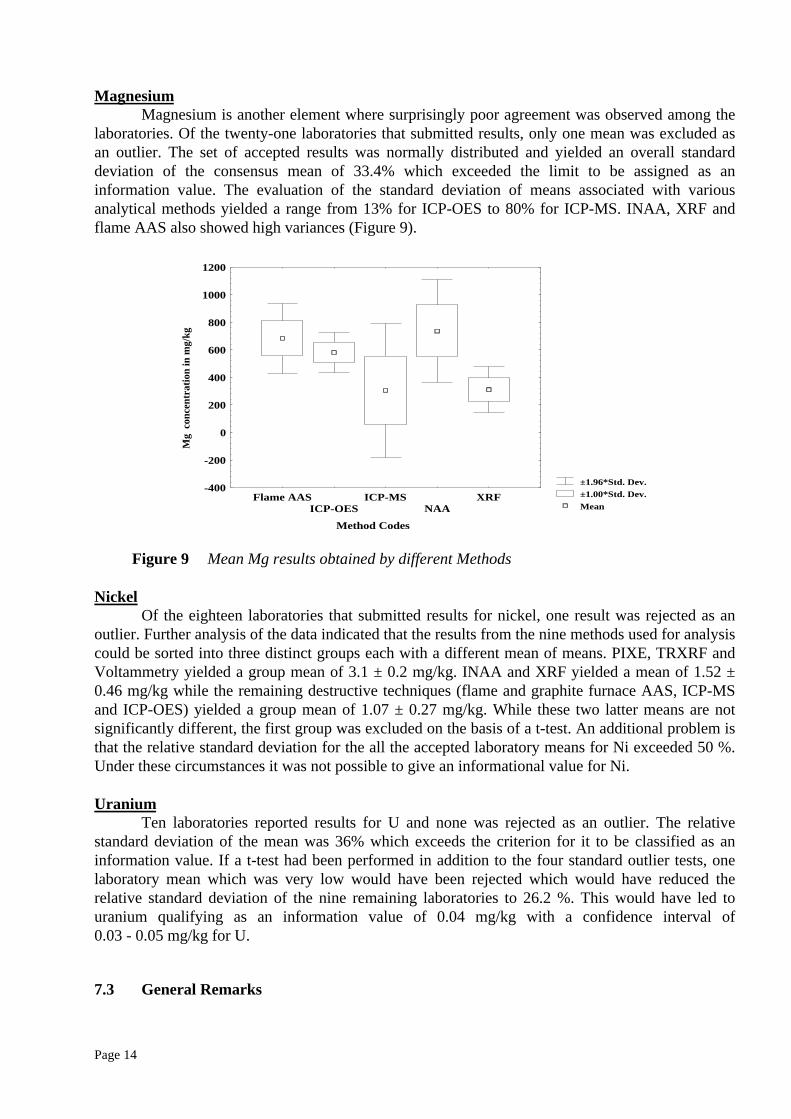
As is often the case with intercomparisons organized by the IAEA, this intercomparisonexercise had a high percentage of the results (78%) produced by nuclear (NAA 50.4%) and nuclearrelated techniques (X-ray techniques 13.6%, ICP-MS 13.9%). The percentage of results produced byAAS and AES techniques accounted for only 19.9% while the remaining 2% were obtained by anumber of different techniques. Overall there was good agreement between the laboratories asevidenced by only 9% of the results being rejected by the outlier tests. However the percentage ofoutliers attributable to a particular method varied considerably (Figure 10). From the large numberof outliers, it would appear that the X-ray related techniques continue to have difficulties whenanalyzing biological matrices. In the case of ICP-MS, the results reported by one laboratory wereconsistently rejected and therefore accounted for almost all the outliers for this method. For thisintercomparison it was possible to assign recommended and information values for some elements(mainly the rare earth elements) for the first time, due to the submission of results by ICP-MSlaboratories. In previous intercomparisons this was not possible due to the fact that only one method(NAA) was capable of measuring these elements at such low levels.
Figure 10 Percentage of the methods used and their outliers
8. RECOMMENDATIONS ON INDIVIDUAL DATA REVIEW
To provide feedback to each participant, a report format has been developed that lists theresults of the laboratory together with the recommended value and its confidence interval. For easeof comparison we have calculated a Z-score based on the recommended value. Although the Z-scoreis routinely used in proficiency tests to evaluate the performance of laboratories, we wish toemphasize that because this was an intercomparison exercise, the Z-score can only be used as arelative indicator of how a laboratory’s result compares to the mean of accepted laboratory means.For example, a Z-score of “0” means that there is little or no difference between the laboratory valueand the recommended value. A Z-score of +1 or -1 would indicate a laboratory mean that washigher or lower than the recommended value respectively. Results that have a Z-score of 3 or greaterwere always rejected by the outlier tests and would indicate that a problem exists with the analysisand that the laboratory should look into possible causes for the poor result and initiate correctiveactions.
It should be noted here that the results for the IAEA-359 cabbage reference material, whichwas distributed together with the IAEA-336 lichen, are not summarized in this report. The results
MS
NAA
X-rayAES
AASOthers
11.6%
48.0% 2.3%
0.1%
0.5%
2.4%
3.0% 0.7%
10.7%
1.5%
10.0%
9.2%
Page 16
for IAEA-359 will be compiled together with two additional sets of intercomparison results for thesame material in a separate IAEA report to be issued at a later date.
9. CONCLUSIONS
A lichen material, IAEA-336, prepared from the species Evernia prunastri, has beencharacterized through an international intercomparison exercise. Results for the lichen indicate thatit has very low levels of most elements which is consistent with the low level of pollution found inthe environment from where it originated. Recommended and information values have beenassigned for 19 and 14 elements respectively. Under the current IAEA procedures for assigningrecommended or information values, it was not possible to define the metrological traceability ofthe trace element concentrations specified in IAEA-336. Therefore, IAEA-336 can not be used forthe purposes of establishing a chain of traceability or for the purposes of calibration (as is the casewith most natural matrix reference materials). However, the material is suitable to be used as aquality control material to monitor the performance of an instrument or for method developmentpurposes.
10. ACKNOWLEDGMENTS
The efforts of the participating laboratories listed in Appendix IV of this report, whichcontributed their time and facilities to the present work, are gratefully acknowledged, as are theefforts of the following individuals: Shirley Clements (IAEA-NAHU) for her invaluable help in thedata preparation, Edith Wehrstein and Norbert Haselberger (IAEA-NAAL) for their work on thehomogeneity studies and Andreas Bleise (IAEA-NAHU) for his assistance with the final formattingof this report. The authors also wish to acknowledge the work of M. Carmo Freitas in the collectionand preparation of the material and for the collection of the preliminary data from the participatinglaboratories.
Page 17
REFERENCES
[1] SLOOF, J.E., WOLTERBEEK, H.T., Inter-species comparison of lichens as biomonitors oftrace-element air pollution, Environ. Monit. Assess. 25 (1993) 149-157.
[2] GARTY, J., Plants as biomonitors-indicators of heavy metals in the terrestrial environment,VCH, Weinheim, New York (1993).
[3] MUIR, D.C.G. et al., Patterns of accumulation of airborne organochlorine contaminants inlichens from the upper great lake region of Ontario, Environ. Sci. Technol. 27 (1993)1201-1210.
[4] FREITAS, M.C., CATARINO, F.M., BRANQUINHO, C., MAGUAS, C., Preparation of alichen reference material, J. Radioanal. Nucl. Chem. 169 (1993) 47-55.
[5] STONE, S.F., FREITAS, M.C., PARR, R.M., ZEISLER, R., Elemental characterization of acandidate lichen research material-IAEA-336, Fresenius J. Anal. Chem. 352 (1995) 227-231.
[6] PARR, R.M., On the role of neutron activation analysis in the certification of a new referencematerial for trace element studies, mixed human diet, H-9, J. Radioanal. Nucl. Chem. 123(1988) 259-271.
[7] DYBCZYNSKI, R., TUGSAVUL, A., SUSCHNY, O., Problems of accuracy and precision inthe determination of trace elements in water as shown by recent International Atomic EnergyAgency intercomparison tests, Analyst, 103 (1978) 733-744.
[8] THOMPSON, M., WOOD, R., The international harmonized protocol for the proficiencytesting of (chemical) analytical laboratories, Pure & Appl. Chem., Vol 65, No.9 (1993)2123-2144.
Page 18
Method Codes for the Intercomparison, IAEA-336, Lichen
A1: atomic absorption spectroscopy (AAS), flameA2: AAS, electrothermalA3: AAS, electrothermal + Zeeman background correctionA4: AAS, cold vapourA5: AAS, hydride generation
C1: colourimetryC2: gas/liquid chromatography with electron capture detectionC3: catalytic method for iodine
E1: atomic emission spectroscopy (AES), flameE2: ES, Flame photometryE3: ES, ES, DC arcE4: ES, direct current plasma (DCP-OES)E5: ES, inductively coupled plasma (ICP-OES)E6: ICP-OES, hydride generation
F1: fluorimetry
G1: gamma-spectroscopy (prompt) following proton activation (PIGME)
I1: ion-specific electrode
M1: mass spectrometry (MS), spark source (SS-MS)M2: MS, inductively coupled plasma source (ICP-MS)
N1: thermal neutron activation analysis (NAA), radiochemicalN2: thermal NAA, instrumental (INAA)N3: fast NAA, radiochemical (RNAA)N4: fast NAA, instrumental (INAA)N5: NAA, prompt gamma (PGNAA)
P1: photon activation analysis (PAA), radiochemicalP2: PAA, instrumental
V1: voltammetry / polarography
X1: X-ray fluorescence analysis (XRF)X2: total reflection XRF (TRXRF)X3: particle induced X-ray emission analysis (PIXE)X4: other X-ray methods
Z: other methods
APPENDIX I
SUMMARY TABLE OF THE RESULTS
FOR THE INTERCOMPARISON
(For explanation of the terms used in the tables, please refer to Section 7)
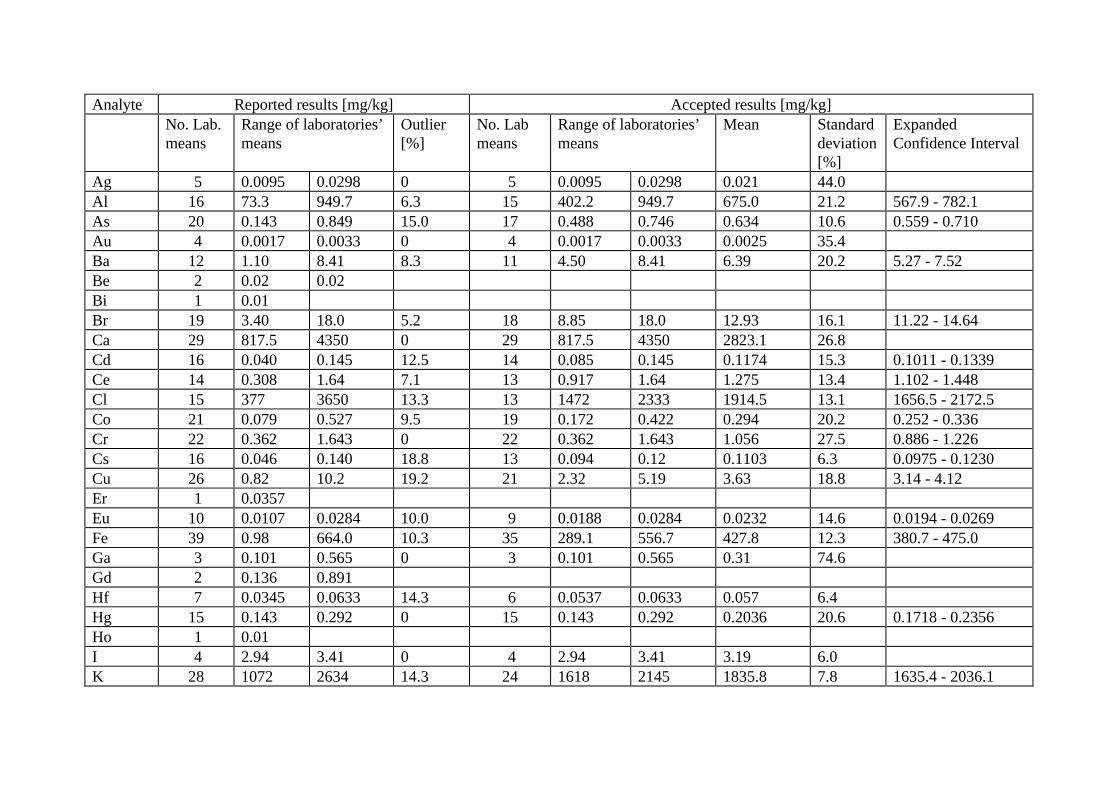
Analyte Reported results [mg/kg] Accepted results [mg/kg]No. Lab.means
Range of laboratories’means
Outlier[%]
No. Labmeans
Range of laboratories’means
Mean Standarddeviation[%]
ExpandedConfidence Interval
Ag 5 0.0095 0.0298 0 5 0.0095 0.0298 0.021 44.0Al 16 73.3 949.7 6.3 15 402.2 949.7 675.0 21.2 567.9 - 782.1As 20 0.143 0.849 15.0 17 0.488 0.746 0.634 10.6 0.559 - 0.710Au 4 0.0017 0.0033 0 4 0.0017 0.0033 0.0025 35.4Ba 12 1.10 8.41 8.3 11 4.50 8.41 6.39 20.2 5.27 - 7.52Be 2 0.02 0.02Bi 1 0.01Br 19 3.40 18.0 5.2 18 8.85 18.0 12.93 16.1 11.22 - 14.64Ca 29 817.5 4350 0 29 817.5 4350 2823.1 26.8Cd 16 0.040 0.145 12.5 14 0.085 0.145 0.1174 15.3 0.1011 - 0.1339Ce 14 0.308 1.64 7.1 13 0.917 1.64 1.275 13.4 1.102 - 1.448Cl 15 377 3650 13.3 13 1472 2333 1914.5 13.1 1656.5 - 2172.5Co 21 0.079 0.527 9.5 19 0.172 0.422 0.294 20.2 0.252 - 0.336Cr 22 0.362 1.643 0 22 0.362 1.643 1.056 27.5 0.886 - 1.226Cs 16 0.046 0.140 18.8 13 0.094 0.12 0.1103 6.3 0.0975 - 0.1230Cu 26 0.82 10.2 19.2 21 2.32 5.19 3.63 18.8 3.14 - 4.12Er 1 0.0357Eu 10 0.0107 0.0284 10.0 9 0.0188 0.0284 0.0232 14.6 0.0194 - 0.0269Fe 39 0.98 664.0 10.3 35 289.1 556.7 427.8 12.3 380.7 - 475.0Ga 3 0.101 0.565 0 3 0.101 0.565 0.31 74.6Gd 2 0.136 0.891Hf 7 0.0345 0.0633 14.3 6 0.0537 0.0633 0.057 6.4Hg 15 0.143 0.292 0 15 0.143 0.292 0.2036 20.6 0.1718 - 0.2356Ho 1 0.01I 4 2.94 3.41 0 4 2.94 3.41 3.19 6.0K 28 1072 2634 14.3 24 1618 2145 1835.8 7.8 1635.4 - 2036.1
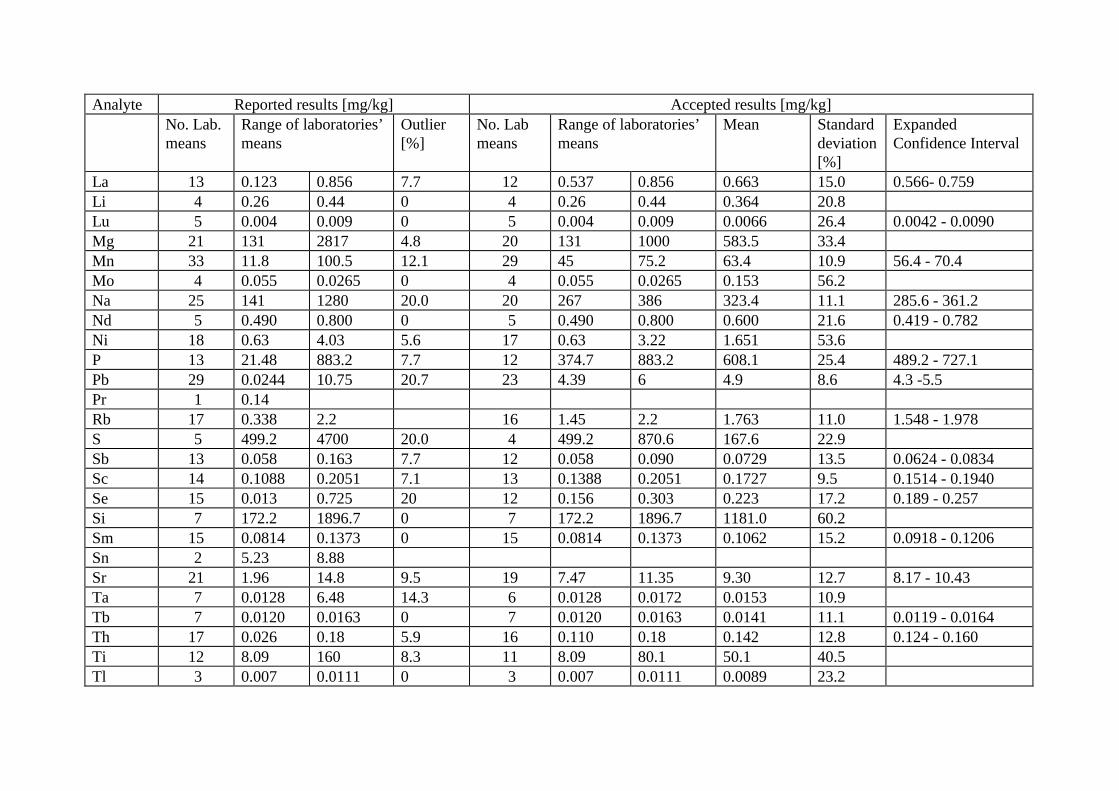
Analyte Reported results [mg/kg] Accepted results [mg/kg]No. Lab.means
Range of laboratories’means
Outlier[%]
No. Labmeans
Range of laboratories’means
Mean Standarddeviation[%]
ExpandedConfidence Interval
La 13 0.123 0.856 7.7 12 0.537 0.856 0.663 15.0 0.566- 0.759Li 4 0.26 0.44 0 4 0.26 0.44 0.364 20.8Lu 5 0.004 0.009 0 5 0.004 0.009 0.0066 26.4 0.0042 - 0.0090Mg 21 131 2817 4.8 20 131 1000 583.5 33.4Mn 33 11.8 100.5 12.1 29 45 75.2 63.4 10.9 56.4 - 70.4Mo 4 0.055 0.0265 0 4 0.055 0.0265 0.153 56.2Na 25 141 1280 20.0 20 267 386 323.4 11.1 285.6 - 361.2Nd 5 0.490 0.800 0 5 0.490 0.800 0.600 21.6 0.419 - 0.782Ni 18 0.63 4.03 5.6 17 0.63 3.22 1.651 53.6P 13 21.48 883.2 7.7 12 374.7 883.2 608.1 25.4 489.2 - 727.1Pb 29 0.0244 10.75 20.7 23 4.39 6 4.9 8.6 4.3 -5.5Pr 1 0.14Rb 17 0.338 2.2 16 1.45 2.2 1.763 11.0 1.548 - 1.978S 5 499.2 4700 20.0 4 499.2 870.6 167.6 22.9Sb 13 0.058 0.163 7.7 12 0.058 0.090 0.0729 13.5 0.0624 - 0.0834Sc 14 0.1088 0.2051 7.1 13 0.1388 0.2051 0.1727 9.5 0.1514 - 0.1940Se 15 0.013 0.725 20 12 0.156 0.303 0.223 17.2 0.189 - 0.257Si 7 172.2 1896.7 0 7 172.2 1896.7 1181.0 60.2Sm 15 0.0814 0.1373 0 15 0.0814 0.1373 0.1062 15.2 0.0918 - 0.1206Sn 2 5.23 8.88Sr 21 1.96 14.8 9.5 19 7.47 11.35 9.30 12.7 8.17 - 10.43Ta 7 0.0128 6.48 14.3 6 0.0128 0.0172 0.0153 10.9Tb 7 0.0120 0.0163 0 7 0.0120 0.0163 0.0141 11.1 0.0119 - 0.0164Th 17 0.026 0.18 5.9 16 0.110 0.18 0.142 12.8 0.124 - 0.160Ti 12 8.09 160 8.3 11 8.09 80.1 50.1 40.5Tl 3 0.007 0.0111 0 3 0.007 0.0111 0.0089 23.2
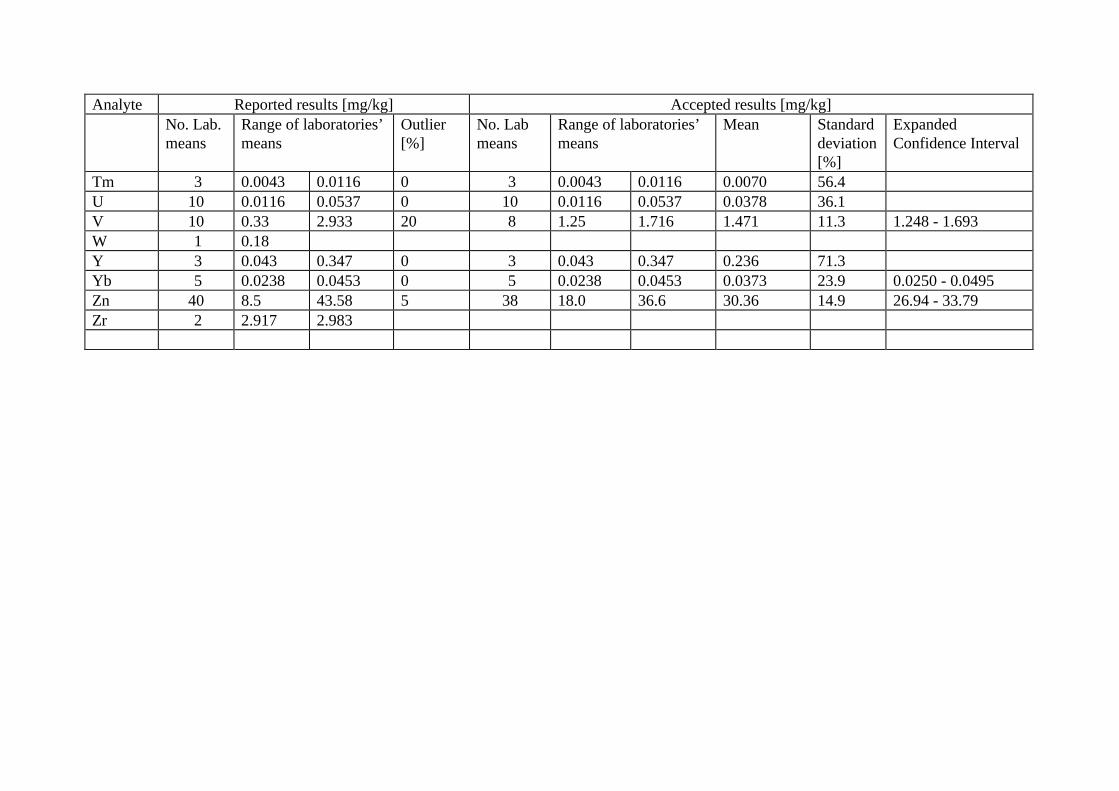
Analyte Reported results [mg/kg] Accepted results [mg/kg]No. Lab.means
Range of laboratories’means
Outlier[%]
No. Labmeans
Range of laboratories’means
Mean Standarddeviation[%]
ExpandedConfidence Interval
Tm 3 0.0043 0.0116 0 3 0.0043 0.0116 0.0070 56.4U 10 0.0116 0.0537 0 10 0.0116 0.0537 0.0378 36.1V 10 0.33 2.933 20 8 1.25 1.716 1.471 11.3 1.248 - 1.693W 1 0.18Y 3 0.043 0.347 0 3 0.043 0.347 0.236 71.3Yb 5 0.0238 0.0453 0 5 0.0238 0.0453 0.0373 23.9 0.0250 - 0.0495Zn 40 8.5 43.58 5 38 18.0 36.6 30.36 14.9 26.94 - 33.79Zr 2 2.917 2.983
APPENDIX II
DATA TABLE OF THE
INDIVIDUAL LABORATORY RESULTS
SORTED BY ANALYTE
(For explanation of the terms used in the tables, please refer to Section 7)
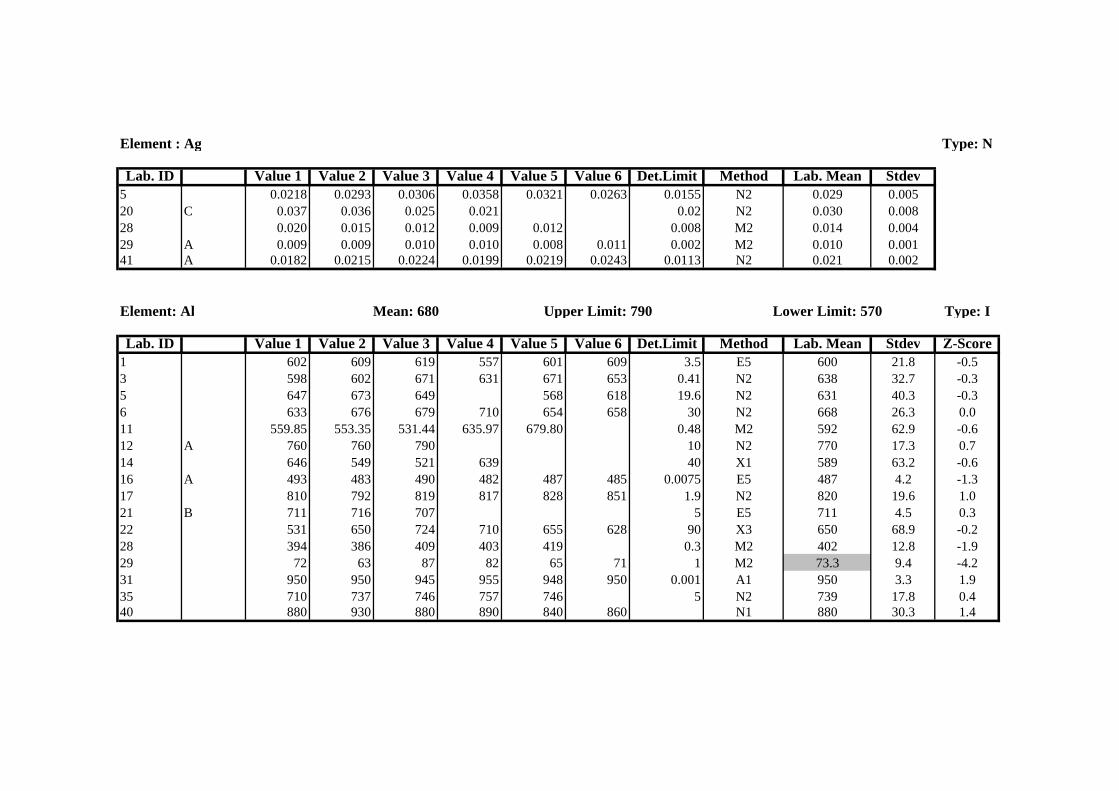
Element : Ag Type: N
Lab. ID Value 1 Value 2 Value 3 Value 4 Value 5 Value 6 Det.Limit Method Lab. Mean Stdev5 0.0218 0.0293 0.0306 0.0358 0.0321 0.0263 0.0155 N2 0.029 0.00520 C 0.037 0.036 0.025 0.021 0.02 N2 0.030 0.00828 0.020 0.015 0.012 0.009 0.012 0.008 M2 0.014 0.00429 A 0.009 0.009 0.010 0.010 0.008 0.011 0.002 M2 0.010 0.00141 A 0.0182 0.0215 0.0224 0.0199 0.0219 0.0243 0.0113 N2 0.021 0.002
Element: Al Mean: 680 Upper Limit: 790 Lower Limit: 570 Type: I
Lab. ID Value 1 Value 2 Value 3 Value 4 Value 5 Value 6 Det.Limit Method Lab. Mean Stdev Z-Score1 602 609 619 557 601 609 3.5 E5 600 21.8 -0.53 598 602 671 631 671 653 0.41 N2 638 32.7 -0.35 647 673 649 568 618 19.6 N2 631 40.3 -0.36 633 676 679 710 654 658 30 N2 668 26.3 0.011 559.85 553.35 531.44 635.97 679.80 0.48 M2 592 62.9 -0.612 A 760 760 790 10 N2 770 17.3 0.714 646 549 521 639 40 X1 589 63.2 -0.616 A 493 483 490 482 487 485 0.0075 E5 487 4.2 -1.317 810 792 819 817 828 851 1.9 N2 820 19.6 1.021 B 711 716 707 5 E5 711 4.5 0.322 531 650 724 710 655 628 90 X3 650 68.9 -0.228 394 386 409 403 419 0.3 M2 402 12.8 -1.929 72 63 87 82 65 71 1 M2 73.3 9.4 -4.231 950 950 945 955 948 950 0.001 A1 950 3.3 1.935 710 737 746 757 746 5 N2 739 17.8 0.440 880 930 880 890 840 860 N1 880 30.3 1.4
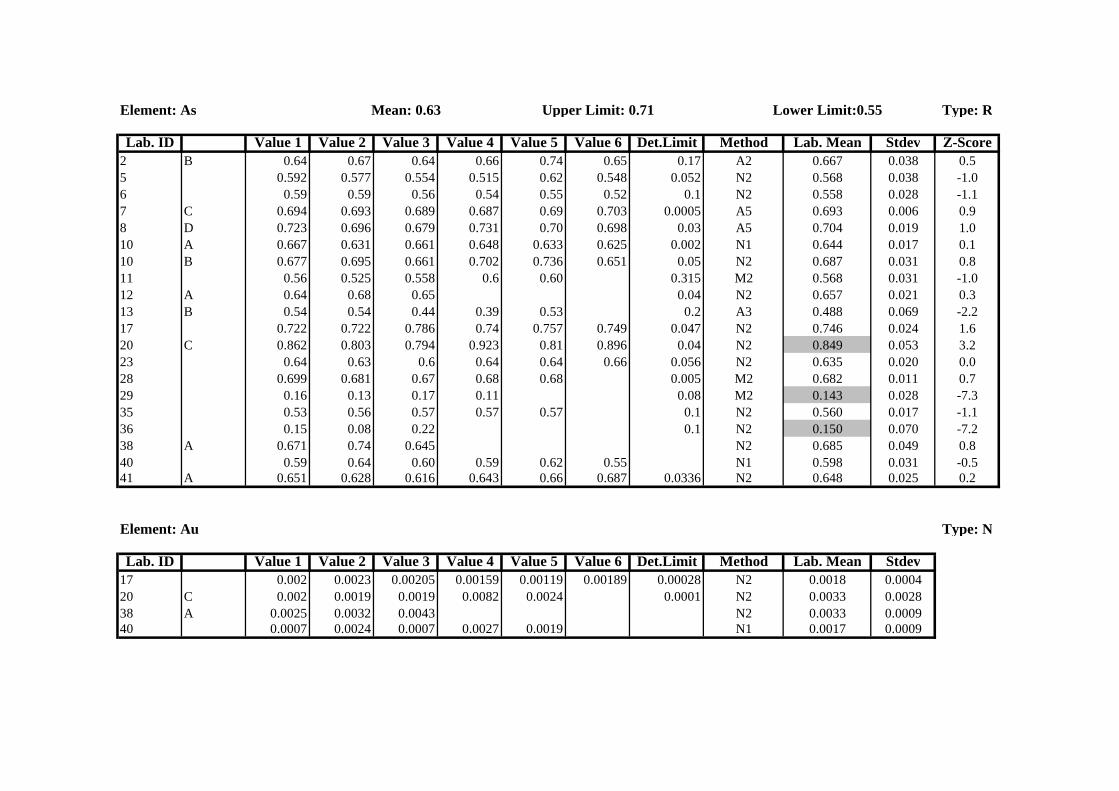
Element: As Mean: 0.63 Upper Limit: 0.71 Lower Limit:0.55 Type: R
Lab. ID Value 1 Value 2 Value 3 Value 4 Value 5 Value 6 Det.Limit Method Lab. Mean Stdev Z-Score2 B 0.64 0.67 0.64 0.66 0.74 0.65 0.17 A2 0.667 0.038 0.55 0.592 0.577 0.554 0.515 0.62 0.548 0.052 N2 0.568 0.038 -1.06 0.59 0.59 0.56 0.54 0.55 0.52 0.1 N2 0.558 0.028 -1.17 C 0.694 0.693 0.689 0.687 0.69 0.703 0.0005 A5 0.693 0.006 0.98 D 0.723 0.696 0.679 0.731 0.70 0.698 0.03 A5 0.704 0.019 1.010 A 0.667 0.631 0.661 0.648 0.633 0.625 0.002 N1 0.644 0.017 0.110 B 0.677 0.695 0.661 0.702 0.736 0.651 0.05 N2 0.687 0.031 0.811 0.56 0.525 0.558 0.6 0.60 0.315 M2 0.568 0.031 -1.012 A 0.64 0.68 0.65 0.04 N2 0.657 0.021 0.313 B 0.54 0.54 0.44 0.39 0.53 0.2 A3 0.488 0.069 -2.217 0.722 0.722 0.786 0.74 0.757 0.749 0.047 N2 0.746 0.024 1.620 C 0.862 0.803 0.794 0.923 0.81 0.896 0.04 N2 0.849 0.053 3.223 0.64 0.63 0.6 0.64 0.64 0.66 0.056 N2 0.635 0.020 0.028 0.699 0.681 0.67 0.68 0.68 0.005 M2 0.682 0.011 0.729 0.16 0.13 0.17 0.11 0.08 M2 0.143 0.028 -7.335 0.53 0.56 0.57 0.57 0.57 0.1 N2 0.560 0.017 -1.136 0.15 0.08 0.22 0.1 N2 0.150 0.070 -7.238 A 0.671 0.74 0.645 N2 0.685 0.049 0.840 0.59 0.64 0.60 0.59 0.62 0.55 N1 0.598 0.031 -0.541 A 0.651 0.628 0.616 0.643 0.66 0.687 0.0336 N2 0.648 0.025 0.2
Element: Au Type: N
Lab. ID Value 1 Value 2 Value 3 Value 4 Value 5 Value 6 Det.Limit Method Lab. Mean Stdev17 0.002 0.0023 0.00205 0.00159 0.00119 0.00189 0.00028 N2 0.0018 0.000420 C 0.002 0.0019 0.0019 0.0082 0.0024 0.0001 N2 0.0033 0.002838 A 0.0025 0.0032 0.0043 N2 0.0033 0.000940 0.0007 0.0024 0.0007 0.0027 0.0019 N1 0.0017 0.0009
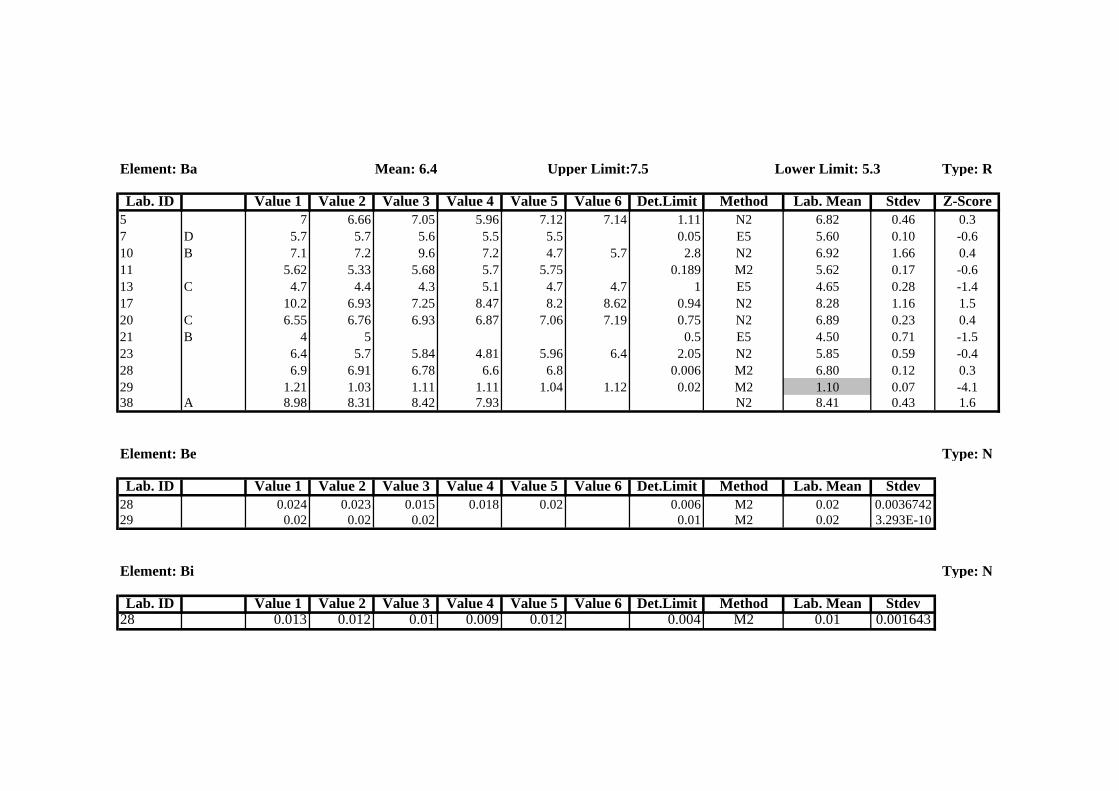
Element: Ba Mean: 6.4 Upper Limit:7.5 Lower Limit: 5.3 Type: R
Lab. ID Value 1 Value 2 Value 3 Value 4 Value 5 Value 6 Det.Limit Method Lab. Mean Stdev Z-Score5 7 6.66 7.05 5.96 7.12 7.14 1.11 N2 6.82 0.46 0.37 D 5.7 5.7 5.6 5.5 5.5 0.05 E5 5.60 0.10 -0.610 B 7.1 7.2 9.6 7.2 4.7 5.7 2.8 N2 6.92 1.66 0.411 5.62 5.33 5.68 5.7 5.75 0.189 M2 5.62 0.17 -0.613 C 4.7 4.4 4.3 5.1 4.7 4.7 1 E5 4.65 0.28 -1.417 10.2 6.93 7.25 8.47 8.2 8.62 0.94 N2 8.28 1.16 1.520 C 6.55 6.76 6.93 6.87 7.06 7.19 0.75 N2 6.89 0.23 0.421 B 4 5 0.5 E5 4.50 0.71 -1.523 6.4 5.7 5.84 4.81 5.96 6.4 2.05 N2 5.85 0.59 -0.428 6.9 6.91 6.78 6.6 6.8 0.006 M2 6.80 0.12 0.329 1.21 1.03 1.11 1.11 1.04 1.12 0.02 M2 1.10 0.07 -4.138 A 8.98 8.31 8.42 7.93 N2 8.41 0.43 1.6
Element: Be Type: N
Lab. ID Value 1 Value 2 Value 3 Value 4 Value 5 Value 6 Det.Limit Method Lab. Mean Stdev28 0.024 0.023 0.015 0.018 0.02 0.006 M2 0.02 0.003674229 0.02 0.02 0.02 0.01 M2 0.02 3.293E-10
Element: Bi Type: N
Lab. ID Value 1 Value 2 Value 3 Value 4 Value 5 Value 6 Det.Limit Method Lab. Mean Stdev28 0.013 0.012 0.01 0.009 0.012 0.004 M2 0.01 0.001643
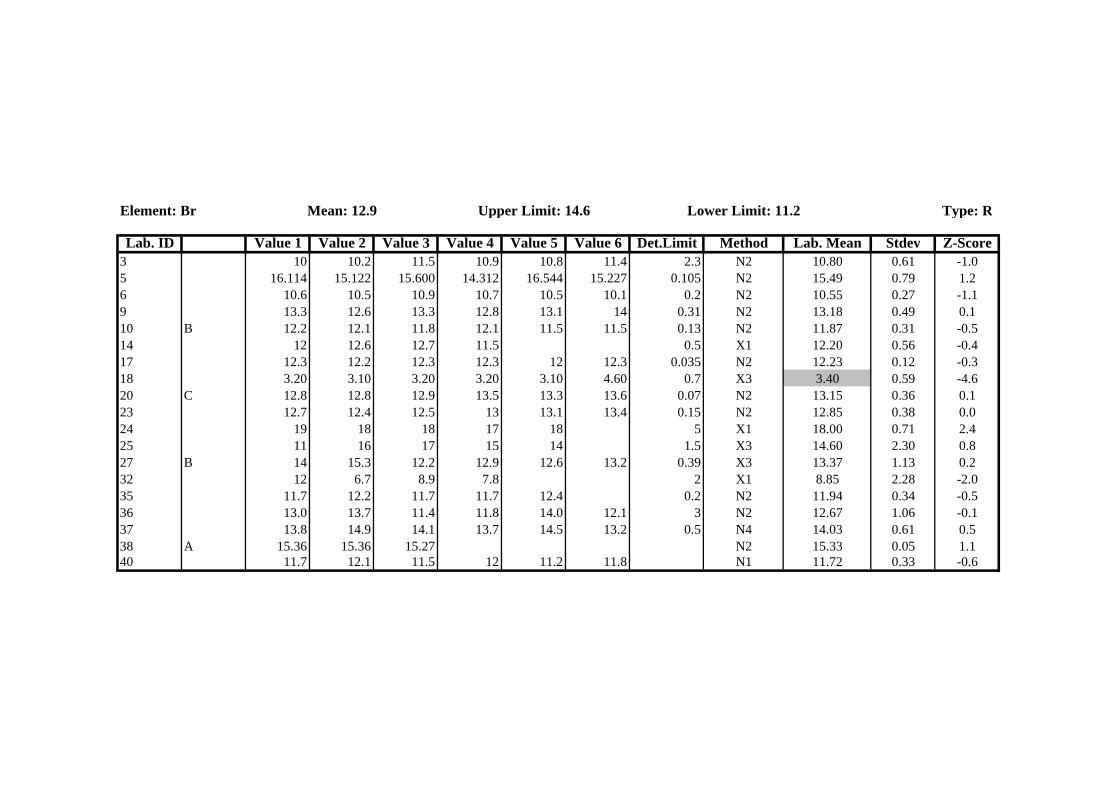
Element: Br Mean: 12.9 Upper Limit: 14.6 Lower Limit: 11.2 Type: R
Lab. ID Value 1 Value 2 Value 3 Value 4 Value 5 Value 6 Det.Limit Method Lab. Mean Stdev Z-Score3 10 10.2 11.5 10.9 10.8 11.4 2.3 N2 10.80 0.61 -1.05 16.114 15.122 15.600 14.312 16.544 15.227 0.105 N2 15.49 0.79 1.26 10.6 10.5 10.9 10.7 10.5 10.1 0.2 N2 10.55 0.27 -1.19 13.3 12.6 13.3 12.8 13.1 14 0.31 N2 13.18 0.49 0.110 B 12.2 12.1 11.8 12.1 11.5 11.5 0.13 N2 11.87 0.31 -0.514 12 12.6 12.7 11.5 0.5 X1 12.20 0.56 -0.417 12.3 12.2 12.3 12.3 12 12.3 0.035 N2 12.23 0.12 -0.318 3.20 3.10 3.20 3.20 3.10 4.60 0.7 X3 3.40 0.59 -4.620 C 12.8 12.8 12.9 13.5 13.3 13.6 0.07 N2 13.15 0.36 0.123 12.7 12.4 12.5 13 13.1 13.4 0.15 N2 12.85 0.38 0.024 19 18 18 17 18 5 X1 18.00 0.71 2.425 11 16 17 15 14 1.5 X3 14.60 2.30 0.827 B 14 15.3 12.2 12.9 12.6 13.2 0.39 X3 13.37 1.13 0.232 12 6.7 8.9 7.8 2 X1 8.85 2.28 -2.035 11.7 12.2 11.7 11.7 12.4 0.2 N2 11.94 0.34 -0.536 13.0 13.7 11.4 11.8 14.0 12.1 3 N2 12.67 1.06 -0.137 13.8 14.9 14.1 13.7 14.5 13.2 0.5 N4 14.03 0.61 0.538 A 15.36 15.36 15.27 N2 15.33 0.05 1.140 11.7 12.1 11.5 12 11.2 11.8 N1 11.72 0.33 -0.6
Element: Ca Mean: 2800 Upper Limit: 3250 Lower Limit:2350 Type: N
Lab. ID Value 1 Value 2 Value 3 Value 4 Value 5 Value 6 Det.Limit Method Lab. Mean Stdev1 2374 2394 2427 2398 2439 2434 1.1 E5 2411 26.13 2410 2260 2270 2450 2330 2420 55 N2 2357 81.45 3661 3333.8 3129.8 2463.8 N2 3375 268.07 D 2470 2450 2500 2490 2500 0.1 E5 2482 21.79 2508 2307 2677 2321 2461 2478 890 N2 2459 136.010 B 2508 2563 2432 2580 2496 2527 26 N2 2518 52.811 2121 2138 2102 2080 2359 6.66 M2 2160 113.313 C 2390 2330 2360 10 E5 2360 30.014 3150 3049 2847 2872 100 X1 2980 144.916 B 1960 1876 1885 1874 1869 1896 0.00175 E5 1893 34.017 2560 2500 2620 2590 2430 2570 32 N2 2545 68.918 2910 2880 2860 2870 2910 2900 40 X3 2888 21.420 C 2725 2687 2927 2703 2810 2659 80 N2 2752 100.021 B 2410 2380 2340 2350 2350 2430 1 E5 2377 36.721 C 2550 2430 1 E5 2490 84.922 3340 3500 3270 3430 3340 2910 0.3 X3 3298 206.424 3900 3900 3900 3800 3900 3 X1 3880 44.725 3920 3920 3750 3990 3900 58.5 X3 3896 88.527 A 4024 3311 4081 417 A1 3805 429.127 B 2978 2633 2761 2784 2805 2737 41 X3 2783 112.831 1840 2000 2050 1990 2000 2000 0.002 A1 1980 71.832 780 830 800 860 22 X1 818 35.033 A 3760 3870 3550 3760 3650 3440 2 A1 3672 157.433 C 3820 3860 3970 3650 3700 3850 25 E5 3808 116.234 B 3659 3666 3683 Z 3669 12.338 A 1990 2400 2810 2530 2370 2810 N2 2485 309.438 B 5100 3600 N5 4350 1060.739 2550 2500 2510 2730 12.9 A1 2573 107.240 2940 3000 2600 2800 2700 N1 2808 165.3
Element: Cd Mean: 0.117 Upper Limit: 0.134 Lower Limit: 0.100 Type: I
Lab. ID Value 1 Value 2 Value 3 Value 4 Value 5 Value 6 Det.Limit Method Lab. Mean Stdev Z-Score1 0.12 0.07 0.09 0.01 E5 0.093 0.025 -1.32 A 0.13 0.11 0.12 0.11 0.12 0.12 0.11 A1 0.118 0.008 0.02 B 0.132 0.125 0.137 0.135 0.129 0.017 A2 0.132 0.005 0.84 0.106 0.103 0.097 0.099 0.099 A3 0.101 0.004 -0.97 A 0.128 0.125 0.125 0.13 0.125 0.0004 A3 0.127 0.002 0.57 E 0.112 0.115 0.113 0.118 0.111 0.114 0.001 M1 0.114 0.002 -0.27 F 0.121 0.112 0.103 0.127 0.132 0.12 0.001 V1 0.119 0.010 0.18 B 0.14 0.138 0.138 0.138 0.144 0.148 0.025 A2 0.141 0.004 1.310 A 0.119 0.11 0.109 0.079 0.104 0.115 0.007 N1 0.106 0.014 -0.611 0.09 0.12 0.12 0.12 0.015 M2 0.113 0.015 -0.312 A 0.091 0.083 0.081 0.003 M2 0.085 0.005 -1.813 B 0.136 0.15 0.139 0.14 0.14 0.133 0.02 A3 0.140 0.006 1.228 0.11 0.118 0.111 0.099 0.12 0.008 M2 0.112 0.008 -0.329 0.047 0.045 0.053 0.044 0.006 M2 0.047 0.004 -3.931 0.016 0.016 0.016 0.016 0.016 0.16 0.001 V1 0.040 0.059 -4.341 B 0.147 0.143 0.148 0.145 0.141 0.146 A1 0.145 0.003 1.5
Element: Ce Mean: 1.28 Upper Limit: 1.45 Lower Limit:1.11 Type: R
Lab. ID Value 1 Value 2 Value 3 Value 4 Value 5 Value 6 Det.Limit Method Lab. Mean Stdev Z-Score3 1.29 1.46 1.34 1.38 1.53 1.34 0.37 N2 1.39 0.09 0.75 1.4324 1.2318 1.2211 1.2012 1.2953 1.2331 0.029 N2 1.27 0.09 0.06 1.28 1.39 1.42 0.15 N2 1.36 0.07 0.59 1.22 1.16 1.17 1.28 1.18 1.31 0.09 N2 1.22 0.06 -0.310 B 0.831 0.184 0.242 0.208 0.131 0.25 0.058 N2 0.31 0.26 -5.612 A 1.15 1.31 1.29 0.2 N2 1.25 0.09 -0.112 B 0.93 0.91 0.91 0.005 M2 0.92 0.01 -2.1
contd. next page
Element: Ce contd. Mean: 1.28 Upper Limit: 1.45 Lower Limit:1.11 Type: R
Lab. ID Value 1 Value 2 Value 3 Value 4 Value 5 Value 6 Det.Limit Method Lab. Mean Stdev Z-Score17 1.31 1.64 1.32 1.38 1.35 1.28 0.0083 N2 1.38 0.13 1.020 C 1.28 1.32 1.29 1.3 1.39 1.34 0.02 N2 1.32 0.04 0.023 1.15 1.13 1.1 1.16 1.1 1.1 0.032 N2 1.12 0.03 -1.028 1.06 1.19 1.35 0.002 M2 1.20 0.15 -0.438 A 1.74 1.57 1.61 N2 1.64 0.09 2.140 1.36 1.47 1.33 1.41 1.29 1.29 N1 1.36 0.07 0.541 A 1.213 1.144 1.147 1.111 1.151 1.103 0.0658 N2 1.14 0.04 -0.8
Element: Cl Mean:1900 Upper Limit: 2200 Lower Limit: 1600 Type: I
Lab. ID Value 1 Value 2 Value 3 Value 4 Value 5 Value 6 Det.Limit Method Lab. Mean Stdev Z-Score3 2280 2230 2340 2340 2450 2360 42 N2 2333 75 1.75 1701.8 1817.3 1744.6 1618.7 1646.8 1646 30.4 N2 1696 75 -0.96 1712 1897 1818 1865 1830 1765 104 N2 1815 67 -0.410 B 1950 2020 1978 1970 1968 1934 11 N2 1970 29 0.211 <361 377 <356 <353 <365 332 M2 377 -6.112 B 2200 2100 2200 20 N2 2167 58 1.013 D 1700 1690 1600 1730 5 Z 1680 56 -0.914 1439 1421 1509 1519 50 X1 1472 49 -1.817 1980 1940 2010 2010 2090 2090 4.3 N2 2020 60 0.418 2200 2140 2100 2160 2250 2140 28 X3 2165 53 1.024 2300 2300 2100 2100 2200 14 X1 2200 100 1.132 2100 1490 1708 1792 246 X1 1773 253 -0.635 1730 1810 1740 1770 1760 30 N2 1762 31 -0.636 1710 1805 1995 450 N2 1837 145 -0.338 B 5300 2000 N5 3650 2333 6.9
Element: Co Mean: 0.29 Upper Limit:0.34 Lower Limit: 0.24 Type: R
Lab. ID Value 1 Value 2 Value 3 Value 4 Value 5 Value 6 Det.Limit Method Lab. Mean Stdev Z-Score3 0.3 0.28 0.3 0.28 0.29 0.27 0.05 N2 0.287 0.012 -0.15 0.3295 0.3409 0.3326 0.3232 0.3445 0.325 0.0017 N2 0.333 0.009 0.76 0.29 0.31 0.29 0.3 0.32 0.3 0.01 N2 0.302 0.012 0.17 F 0.382 0.347 0.395 0.395 0.355 0.384 0.005 V1 0.376 0.021 1.49 0.303 0.317 0.317 0.335 0.334 0.344 0.035 N2 0.325 0.015 0.510 B 0.291 0.284 0.272 0.285 0.268 0.275 0.005 N2 0.279 0.009 -0.211 0.241 0.231 0.259 0.25 0.282 0.096 M2 0.253 0.019 -0.712 B 0.31 0.3 0.28 0.02 N2 0.297 0.015 0.013 B 0.45 0.41 0.44 0.4 0.39 0.44 0.2 A3 0.422 0.025 2.116 B 0.51 0.52 0.55 0.53 0.54 0.51 0.025 E5 0.527 0.016 3.917 0.268 0.29 0.298 0.271 0.265 0.289 0.0065 N2 0.280 0.014 -0.220 C 0.286 0.281 0.293 0.287 0.283 0.289 0.002 N2 0.287 0.004 -0.123 0.28 0.28 0.29 0.29 0.28 0.29 0.0068 N2 0.285 0.005 -0.128 0.269 0.279 0.27 0.26 0.27 0.004 M2 0.270 0.007 -0.429 0.082 0.074 0.082 0.082 0.073 0.08 0.006 M2 0.079 0.004 -3.630 0.38 0.35 0.4 0.38 0.35 0.41 0.02 N2 0.378 0.025 1.436 0.184 0.169 0.162 0.04 N2 0.172 0.011 -2.137 0.23 0.206 0.207 0.221 0.24 0.24 0.05 N4 0.224 0.015 -1.238 0.153 0.242 0.226 0.222 N2 0.211 0.039 -1.440 0.33 0.35 0.32 0.32 0.34 0.3 N1 0.327 0.018 0.641 A 0.2822 0.2779 0.2716 0.274 0.2817 0.2819 0.000872 N2 0.278 0.005 -0.3
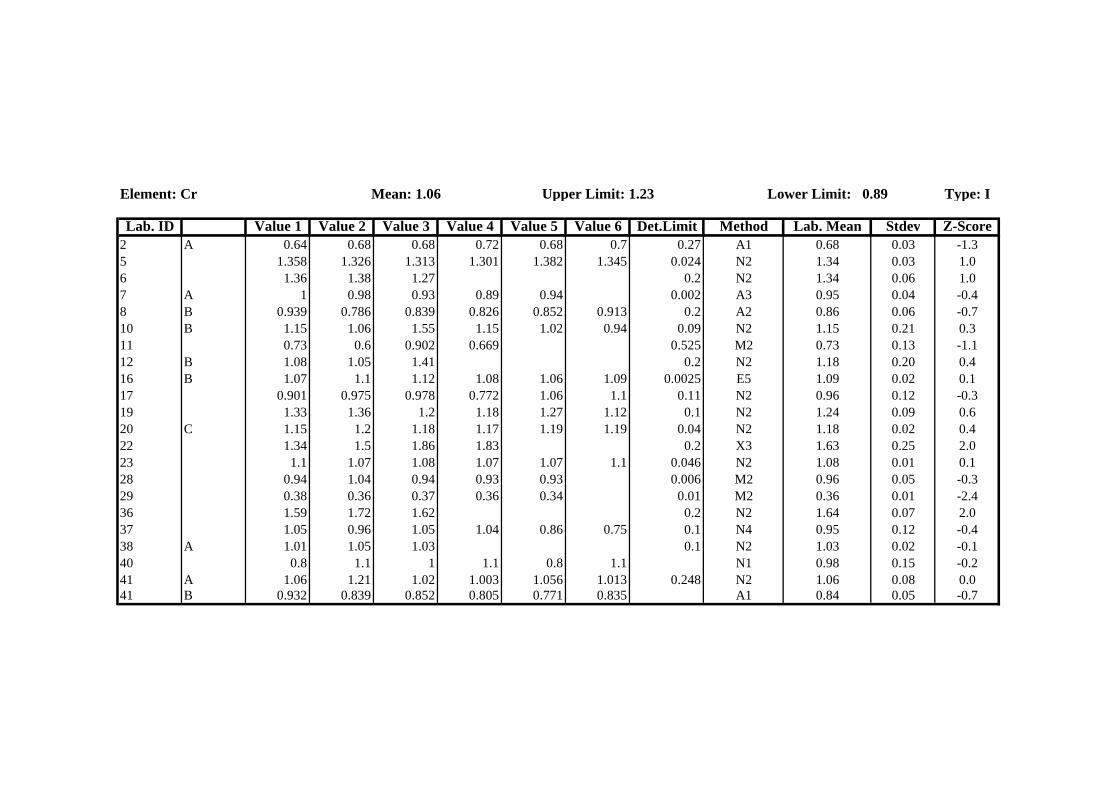
Element: Cr Mean: 1.06 Upper Limit: 1.23 Lower Limit: 0.89 Type: I
Lab. ID Value 1 Value 2 Value 3 Value 4 Value 5 Value 6 Det.Limit Method Lab. Mean Stdev Z-Score2 A 0.64 0.68 0.68 0.72 0.68 0.7 0.27 A1 0.68 0.03 -1.35 1.358 1.326 1.313 1.301 1.382 1.345 0.024 N2 1.34 0.03 1.06 1.36 1.38 1.27 0.2 N2 1.34 0.06 1.07 A 1 0.98 0.93 0.89 0.94 0.002 A3 0.95 0.04 -0.48 B 0.939 0.786 0.839 0.826 0.852 0.913 0.2 A2 0.86 0.06 -0.710 B 1.15 1.06 1.55 1.15 1.02 0.94 0.09 N2 1.15 0.21 0.311 0.73 0.6 0.902 0.669 0.525 M2 0.73 0.13 -1.112 B 1.08 1.05 1.41 0.2 N2 1.18 0.20 0.416 B 1.07 1.1 1.12 1.08 1.06 1.09 0.0025 E5 1.09 0.02 0.117 0.901 0.975 0.978 0.772 1.06 1.1 0.11 N2 0.96 0.12 -0.319 1.33 1.36 1.2 1.18 1.27 1.12 0.1 N2 1.24 0.09 0.620 C 1.15 1.2 1.18 1.17 1.19 1.19 0.04 N2 1.18 0.02 0.422 1.34 1.5 1.86 1.83 0.2 X3 1.63 0.25 2.023 1.1 1.07 1.08 1.07 1.07 1.1 0.046 N2 1.08 0.01 0.128 0.94 1.04 0.94 0.93 0.93 0.006 M2 0.96 0.05 -0.329 0.38 0.36 0.37 0.36 0.34 0.01 M2 0.36 0.01 -2.436 1.59 1.72 1.62 0.2 N2 1.64 0.07 2.037 1.05 0.96 1.05 1.04 0.86 0.75 0.1 N4 0.95 0.12 -0.438 A 1.01 1.05 1.03 0.1 N2 1.03 0.02 -0.140 0.8 1.1 1 1.1 0.8 1.1 N1 0.98 0.15 -0.241 A 1.06 1.21 1.02 1.003 1.056 1.013 0.248 N2 1.06 0.08 0.041 B 0.932 0.839 0.852 0.805 0.771 0.835 A1 0.84 0.05 -0.7
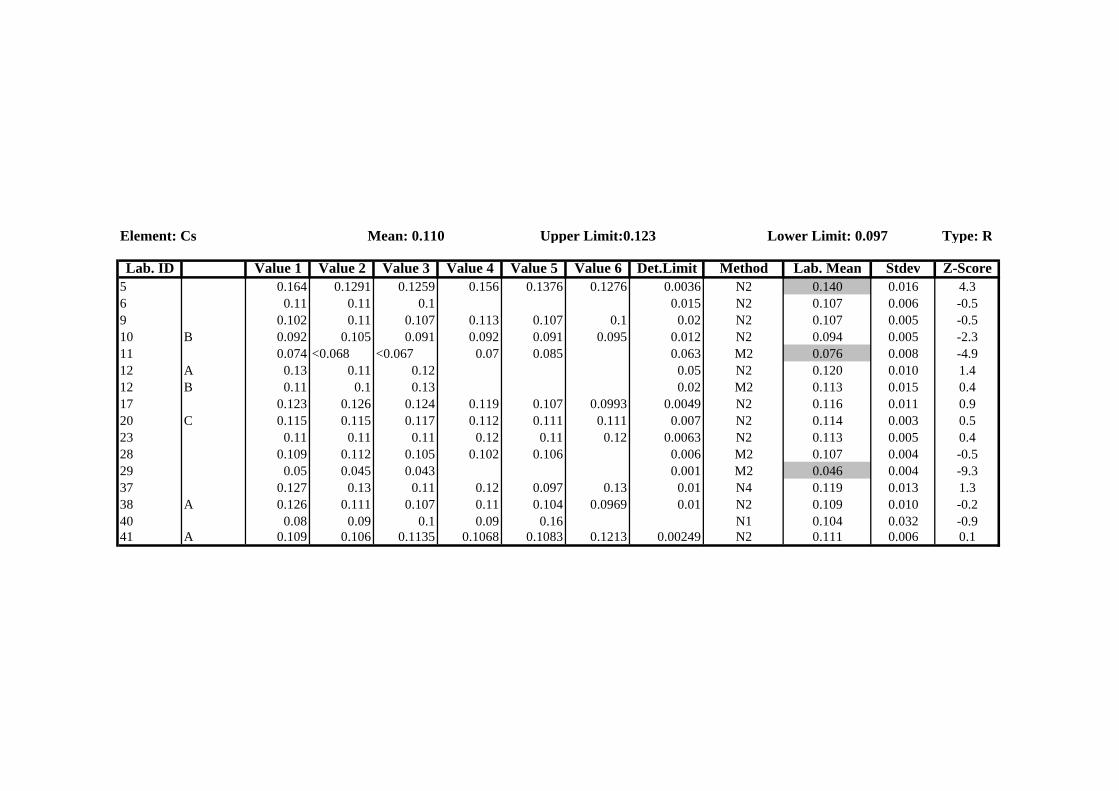
Element: Cs Mean: 0.110 Upper Limit:0.123 Lower Limit: 0.097 Type: R
Lab. ID Value 1 Value 2 Value 3 Value 4 Value 5 Value 6 Det.Limit Method Lab. Mean Stdev Z-Score5 0.164 0.1291 0.1259 0.156 0.1376 0.1276 0.0036 N2 0.140 0.016 4.36 0.11 0.11 0.1 0.015 N2 0.107 0.006 -0.59 0.102 0.11 0.107 0.113 0.107 0.1 0.02 N2 0.107 0.005 -0.510 B 0.092 0.105 0.091 0.092 0.091 0.095 0.012 N2 0.094 0.005 -2.311 0.074 <0.068 <0.067 0.07 0.085 0.063 M2 0.076 0.008 -4.912 A 0.13 0.11 0.12 0.05 N2 0.120 0.010 1.412 B 0.11 0.1 0.13 0.02 M2 0.113 0.015 0.417 0.123 0.126 0.124 0.119 0.107 0.0993 0.0049 N2 0.116 0.011 0.920 C 0.115 0.115 0.117 0.112 0.111 0.111 0.007 N2 0.114 0.003 0.523 0.11 0.11 0.11 0.12 0.11 0.12 0.0063 N2 0.113 0.005 0.428 0.109 0.112 0.105 0.102 0.106 0.006 M2 0.107 0.004 -0.529 0.05 0.045 0.043 0.001 M2 0.046 0.004 -9.337 0.127 0.13 0.11 0.12 0.097 0.13 0.01 N4 0.119 0.013 1.338 A 0.126 0.111 0.107 0.11 0.104 0.0969 0.01 N2 0.109 0.010 -0.240 0.08 0.09 0.1 0.09 0.16 N1 0.104 0.032 -0.941 A 0.109 0.106 0.1135 0.1068 0.1083 0.1213 0.00249 N2 0.111 0.006 0.1

Element: Cu Mean: 3.6 Upper Limit: 4.1 Lower Limit: 3.1 Type: R
Lab. ID Value 1 Value 2 Value 3 Value 4 Value 5 Value 6 Det.Limit Method Lab. Mean Stdev Z-Score1 3.7 4.7 4.4 0.01 E5 4.27 0.51 0.92 A 3.52 3.57 3.65 3.68 3.65 3.59 0.34 A1 3.61 0.06 0.04 2.84 2.54 3.07 3.06 3.27 A1 2.96 0.28 -1.07 A 3.29 3.21 3.22 3.44 3.52 0.002 A3 3.34 0.14 -0.47 E 3.48 3.51 3.49 3.43 3.38 3.5 0.002 M1 3.47 0.05 -0.27 F 3.36 3.56 3.12 3.46 3.35 3.21 0.005 V1 3.34 0.16 -0.48 B 4.1 3.69 3.3 3.67 3.49 3.41 0.1 A2 3.61 0.28 0.010 A 3.42 3.18 3.14 3.19 3.08 3.14 0.055 N1 3.19 0.12 -0.611 3.01 3.06 3.05 3.15 3.08 0.08 M2 3.07 0.05 -0.813 C 3.56 3.01 2.94 3.32 3.25 3.03 1 E5 3.19 0.24 -0.614 4.7 3.8 4.7 4.8 0.3 X1 4.50 0.47 1.315 3.8 0.1 X1 3.80 0.316 B 3.48 3.53 3.64 3.48 3.49 3.48 0.0005 E5 3.52 0.06 -0.218 3.5 2.8 5.2 5.3 3.1 3.1 0.3 X3 3.83 1.12 0.321 B 6 4 7 6 4 4 0.2 E5 5.17 1.33 2.322 6.08 8.47 6.77 5.73 3.95 5.07 0.2 X3 6.01 1.54 3.524 8 7 6 7 6 0.5 X1 6.80 0.84 4.625 11 14 8 10 8 1.5 X3 10.20 2.49 9.627 A 3.29 3.3 1.15 A1 3.30 0.01 -0.527 B 2.36 2.37 2.63 2.33 2.11 2.1 0.21 X3 2.32 0.20 -1.928 3.35 3.23 3.37 3.4 3.33 0.01 M2 3.34 0.06 -0.429 1.13 1.06 1.13 1.04 1.02 1.04 0.06 M2 1.07 0.05 -3.731 0.783 0.817 0.833 0.800 0.850 0.817 0.001 V1 0.82 0.02 -4.136 4.16 6.21 3 N2 5.19 1.45 2.339 3.59 3.38 3.68 3.43 0.305 A1 3.52 0.14 -0.242 A 3.9 3.7 3.7 3.6 3.5 3.7 0.8 X2 3.68 0.13 0.1
Element: Er Type: N
Lab. ID Value 1 Value 2 Value 3 Value 4 Value 5 Value 6 Det.Limit Method Lab. Mean Stdev28 0.036 0.037 0.034 0.0004 M2 0.0357 0.0015
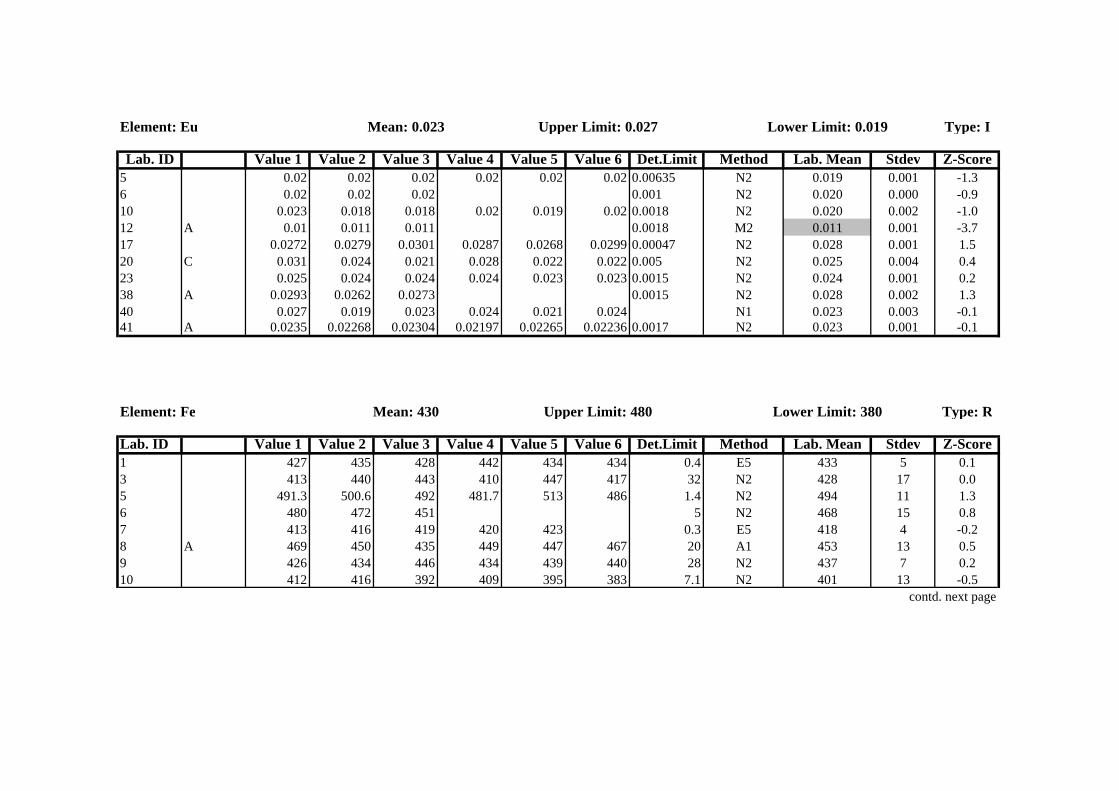
Element: Eu Mean: 0.023 Upper Limit: 0.027 Lower Limit: 0.019 Type: I
Lab. ID Value 1 Value 2 Value 3 Value 4 Value 5 Value 6 Det.Limit Method Lab. Mean Stdev Z-Score5 0.02 0.02 0.02 0.02 0.02 0.02 0.00635 N2 0.019 0.001 -1.36 0.02 0.02 0.02 0.001 N2 0.020 0.000 -0.910 0.023 0.018 0.018 0.02 0.019 0.02 0.0018 N2 0.020 0.002 -1.012 A 0.01 0.011 0.011 0.0018 M2 0.011 0.001 -3.717 0.0272 0.0279 0.0301 0.0287 0.0268 0.0299 0.00047 N2 0.028 0.001 1.520 C 0.031 0.024 0.021 0.028 0.022 0.022 0.005 N2 0.025 0.004 0.423 0.025 0.024 0.024 0.024 0.023 0.023 0.0015 N2 0.024 0.001 0.238 A 0.0293 0.0262 0.0273 0.0015 N2 0.028 0.002 1.340 0.027 0.019 0.023 0.024 0.021 0.024 N1 0.023 0.003 -0.141 A 0.0235 0.02268 0.02304 0.02197 0.02265 0.02236 0.0017 N2 0.023 0.001 -0.1
Element: Fe Mean: 430 Upper Limit: 480 Lower Limit: 380 Type: R
Lab. ID Value 1 Value 2 Value 3 Value 4 Value 5 Value 6 Det.Limit Method Lab. Mean Stdev Z-Score1 427 435 428 442 434 434 0.4 E5 433 5 0.13 413 440 443 410 447 417 32 N2 428 17 0.05 491.3 500.6 492 481.7 513 486 1.4 N2 494 11 1.36 480 472 451 5 N2 468 15 0.87 413 416 419 420 423 0.3 E5 418 4 -0.28 A 469 450 435 449 447 467 20 A1 453 13 0.59 426 434 446 434 439 440 28 N2 437 7 0.210 412 416 392 409 395 383 7.1 N2 401 13 -0.5
contd. next page
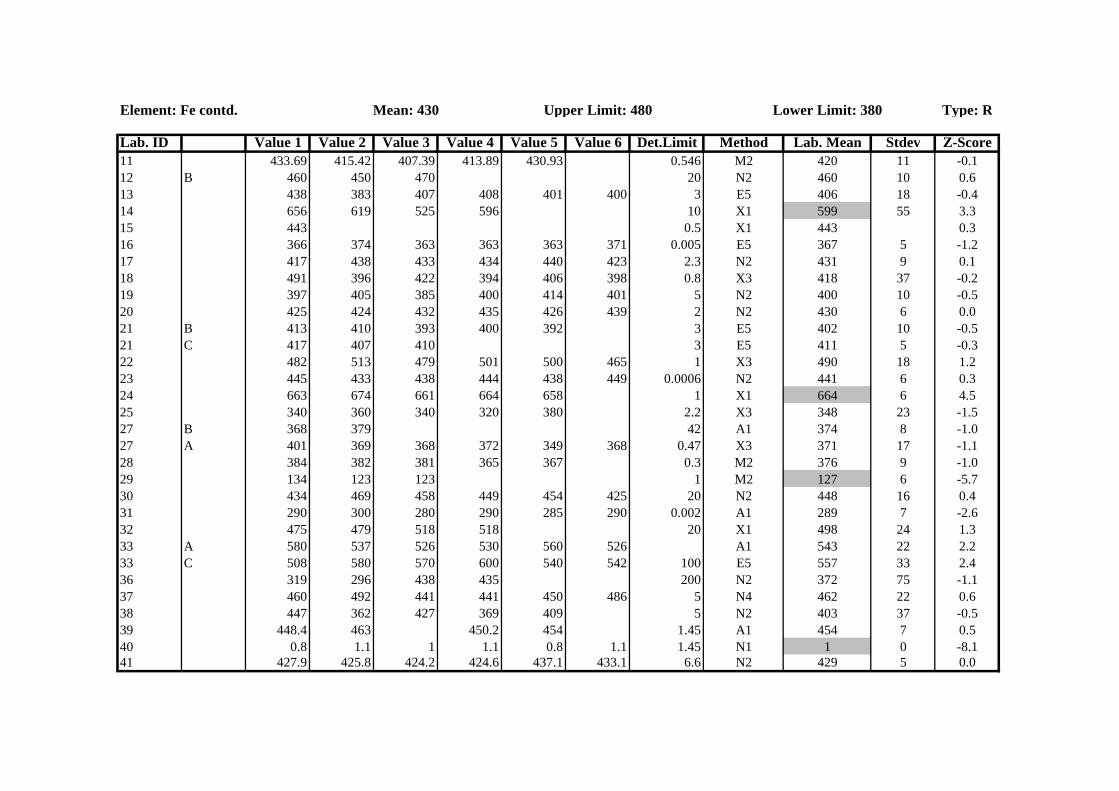
Element: Fe contd. Mean: 430 Upper Limit: 480 Lower Limit: 380 Type: R
Lab. ID Value 1 Value 2 Value 3 Value 4 Value 5 Value 6 Det.Limit Method Lab. Mean Stdev Z-Score11 433.69 415.42 407.39 413.89 430.93 0.546 M2 420 11 -0.112 B 460 450 470 20 N2 460 10 0.613 438 383 407 408 401 400 3 E5 406 18 -0.414 656 619 525 596 10 X1 599 55 3.315 443 0.5 X1 443 0.316 366 374 363 363 363 371 0.005 E5 367 5 -1.217 417 438 433 434 440 423 2.3 N2 431 9 0.118 491 396 422 394 406 398 0.8 X3 418 37 -0.219 397 405 385 400 414 401 5 N2 400 10 -0.520 425 424 432 435 426 439 2 N2 430 6 0.021 B 413 410 393 400 392 3 E5 402 10 -0.521 C 417 407 410 3 E5 411 5 -0.322 482 513 479 501 500 465 1 X3 490 18 1.223 445 433 438 444 438 449 0.0006 N2 441 6 0.324 663 674 661 664 658 1 X1 664 6 4.525 340 360 340 320 380 2.2 X3 348 23 -1.527 B 368 379 42 A1 374 8 -1.027 A 401 369 368 372 349 368 0.47 X3 371 17 -1.128 384 382 381 365 367 0.3 M2 376 9 -1.029 134 123 123 1 M2 127 6 -5.730 434 469 458 449 454 425 20 N2 448 16 0.431 290 300 280 290 285 290 0.002 A1 289 7 -2.632 475 479 518 518 20 X1 498 24 1.333 A 580 537 526 530 560 526 A1 543 22 2.233 C 508 580 570 600 540 542 100 E5 557 33 2.436 319 296 438 435 200 N2 372 75 -1.137 460 492 441 441 450 486 5 N4 462 22 0.638 447 362 427 369 409 5 N2 403 37 -0.539 448.4 463 450.2 454 1.45 A1 454 7 0.540 0.8 1.1 1 1.1 0.8 1.1 1.45 N1 1 0 -8.141 427.9 425.8 424.2 424.6 437.1 433.1 6.6 N2 429 5 0.0
Element: Ga Type: N
Lab. ID Value 1 Value 2 Value 3 Value 4 Value 5 Value 6 Det.Limit Method Lab. Mean Stdev20 C 0.267 0.295 0.193 0.405 0.267 0.226 0.1 N2 0.276 0.07328 0.55 0.57 0.57 0.563 0.572 0.001 M2 0.565 0.00929 0.11 0.097 0.11 0.087 0.001 M2 0.101 0.011
Element: Gd Type: N
Lab. ID Value 1 Value 2 Value 3 Value 4 Value 5 Value 6 Det.Limit Method Lab. Mean Stdev5 0.932 0.806 0.908 0.917 0.056 N2 0.891 0.05720 C 0.159 0.136 0.118 0.107 0.143 0.056 N2 0.133 0.021
Element: Hf Type: N
Lab. ID Value 1 Value 2 Value 3 Value 4 Value 5 Value 6 Det.Limit Method Lab. Mean Stdev5 0.0571 0.0603 0.0582 0.0603 0.0606 0.0558 0.0023 N2 0.059 0.0026 0.05 0.061 0.05 0.01 N2 0.054 0.00610 B 0.049 0.062 0.044 0.06 0.055 0.053 0.082 N2 0.054 0.00717 0.0583 0.0575 0.0552 0.0535 0.0511 0.0592 0.0025 N2 0.056 0.00320 C 0.069 0.057 0.065 0.059 0.062 0.068 0.003 N2 0.063 0.00523 0.058 0.056 0.058 0.058 0.061 0.061 0.0039 N2 0.059 0.00240 0.058 0.034 0.023 0.023 0.029 0.04 0.0039 N1 0.035 0.013
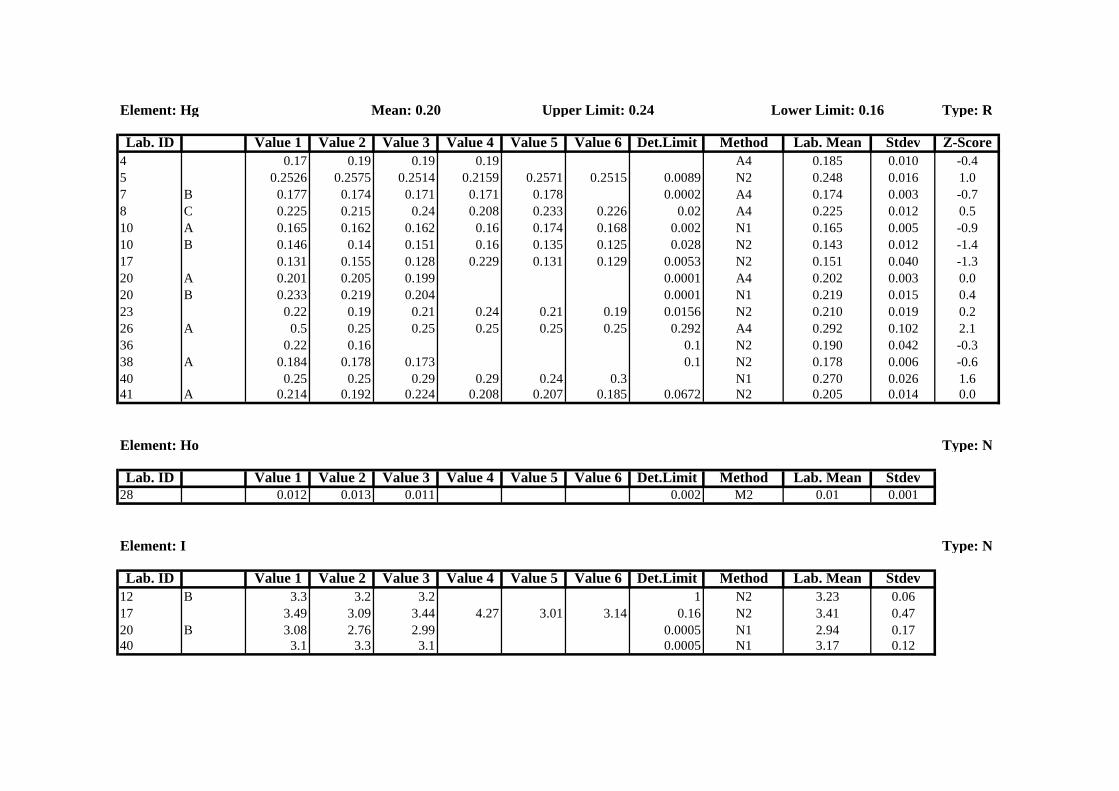
Element: Hg Mean: 0.20 Upper Limit: 0.24 Lower Limit: 0.16 Type: R
Lab. ID Value 1 Value 2 Value 3 Value 4 Value 5 Value 6 Det.Limit Method Lab. Mean Stdev Z-Score4 0.17 0.19 0.19 0.19 A4 0.185 0.010 -0.45 0.2526 0.2575 0.2514 0.2159 0.2571 0.2515 0.0089 N2 0.248 0.016 1.07 B 0.177 0.174 0.171 0.171 0.178 0.0002 A4 0.174 0.003 -0.78 C 0.225 0.215 0.24 0.208 0.233 0.226 0.02 A4 0.225 0.012 0.510 A 0.165 0.162 0.162 0.16 0.174 0.168 0.002 N1 0.165 0.005 -0.910 B 0.146 0.14 0.151 0.16 0.135 0.125 0.028 N2 0.143 0.012 -1.417 0.131 0.155 0.128 0.229 0.131 0.129 0.0053 N2 0.151 0.040 -1.320 A 0.201 0.205 0.199 0.0001 A4 0.202 0.003 0.020 B 0.233 0.219 0.204 0.0001 N1 0.219 0.015 0.423 0.22 0.19 0.21 0.24 0.21 0.19 0.0156 N2 0.210 0.019 0.226 A 0.5 0.25 0.25 0.25 0.25 0.25 0.292 A4 0.292 0.102 2.136 0.22 0.16 0.1 N2 0.190 0.042 -0.338 A 0.184 0.178 0.173 0.1 N2 0.178 0.006 -0.640 0.25 0.25 0.29 0.29 0.24 0.3 N1 0.270 0.026 1.641 A 0.214 0.192 0.224 0.208 0.207 0.185 0.0672 N2 0.205 0.014 0.0
Element: Ho Type: N
Lab. ID Value 1 Value 2 Value 3 Value 4 Value 5 Value 6 Det.Limit Method Lab. Mean Stdev28 0.012 0.013 0.011 0.002 M2 0.01 0.001
Element: I Type: N
Lab. ID Value 1 Value 2 Value 3 Value 4 Value 5 Value 6 Det.Limit Method Lab. Mean Stdev12 B 3.3 3.2 3.2 1 N2 3.23 0.0617 3.49 3.09 3.44 4.27 3.01 3.14 0.16 N2 3.41 0.4720 B 3.08 2.76 2.99 0.0005 N1 2.94 0.1740 3.1 3.3 3.1 0.0005 N1 3.17 0.12
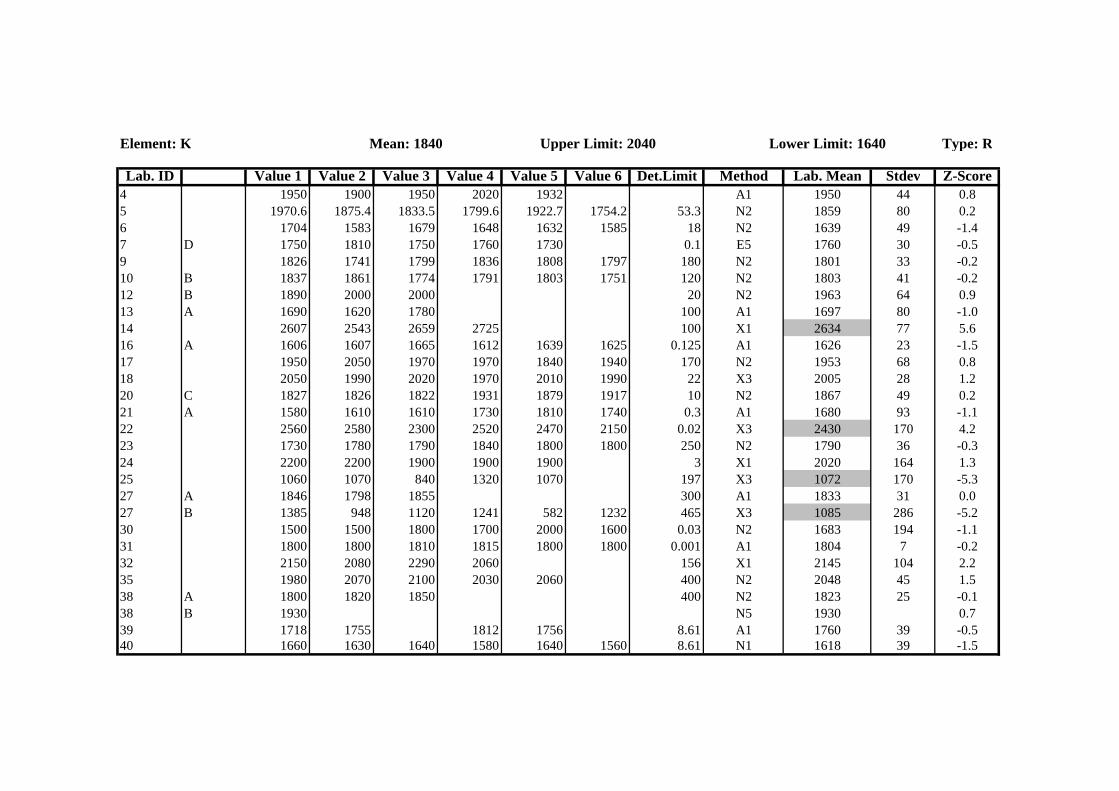
Element: K Mean: 1840 Upper Limit: 2040 Lower Limit: 1640 Type: R
Lab. ID Value 1 Value 2 Value 3 Value 4 Value 5 Value 6 Det.Limit Method Lab. Mean Stdev Z-Score4 1950 1900 1950 2020 1932 A1 1950 44 0.85 1970.6 1875.4 1833.5 1799.6 1922.7 1754.2 53.3 N2 1859 80 0.26 1704 1583 1679 1648 1632 1585 18 N2 1639 49 -1.47 D 1750 1810 1750 1760 1730 0.1 E5 1760 30 -0.59 1826 1741 1799 1836 1808 1797 180 N2 1801 33 -0.210 B 1837 1861 1774 1791 1803 1751 120 N2 1803 41 -0.212 B 1890 2000 2000 20 N2 1963 64 0.913 A 1690 1620 1780 100 A1 1697 80 -1.014 2607 2543 2659 2725 100 X1 2634 77 5.616 A 1606 1607 1665 1612 1639 1625 0.125 A1 1626 23 -1.517 1950 2050 1970 1970 1840 1940 170 N2 1953 68 0.818 2050 1990 2020 1970 2010 1990 22 X3 2005 28 1.220 C 1827 1826 1822 1931 1879 1917 10 N2 1867 49 0.221 A 1580 1610 1610 1730 1810 1740 0.3 A1 1680 93 -1.122 2560 2580 2300 2520 2470 2150 0.02 X3 2430 170 4.223 1730 1780 1790 1840 1800 1800 250 N2 1790 36 -0.324 2200 2200 1900 1900 1900 3 X1 2020 164 1.325 1060 1070 840 1320 1070 197 X3 1072 170 -5.327 A 1846 1798 1855 300 A1 1833 31 0.027 B 1385 948 1120 1241 582 1232 465 X3 1085 286 -5.230 1500 1500 1800 1700 2000 1600 0.03 N2 1683 194 -1.131 1800 1800 1810 1815 1800 1800 0.001 A1 1804 7 -0.232 2150 2080 2290 2060 156 X1 2145 104 2.235 1980 2070 2100 2030 2060 400 N2 2048 45 1.538 A 1800 1820 1850 400 N2 1823 25 -0.138 B 1930 N5 1930 0.739 1718 1755 1812 1756 8.61 A1 1760 39 -0.540 1660 1630 1640 1580 1640 1560 8.61 N1 1618 39 -1.5
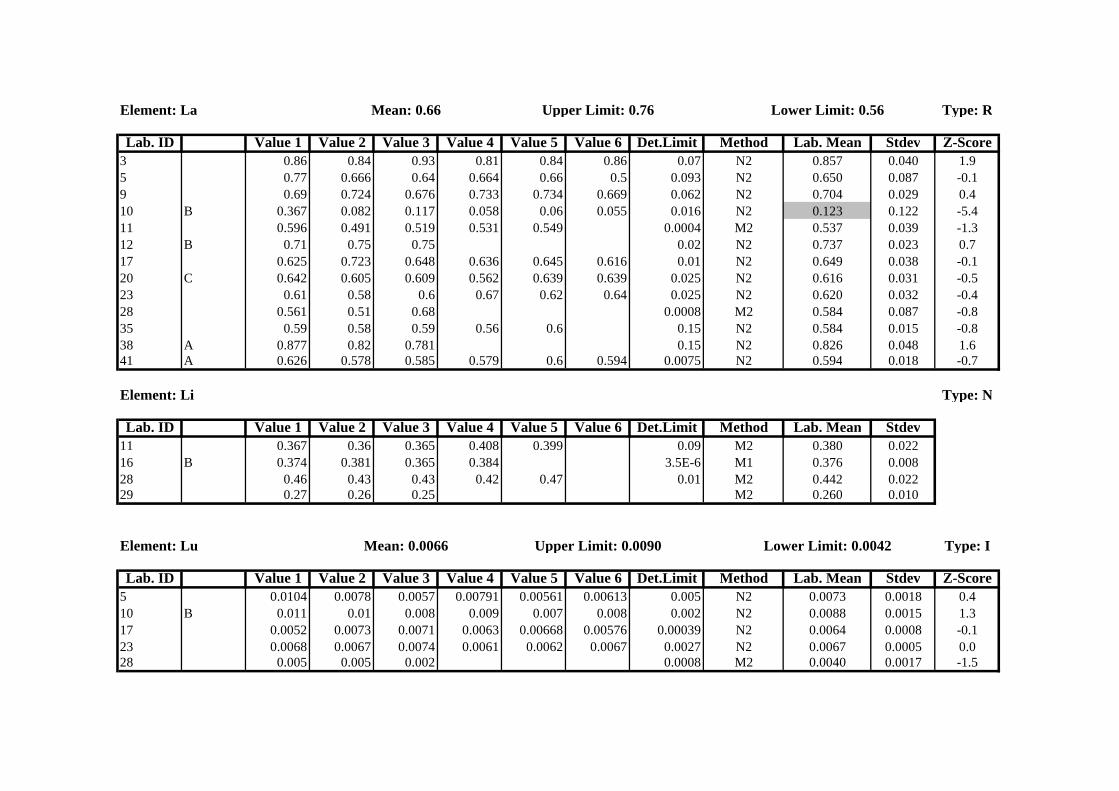
Element: La Mean: 0.66 Upper Limit: 0.76 Lower Limit: 0.56 Type: R
Lab. ID Value 1 Value 2 Value 3 Value 4 Value 5 Value 6 Det.Limit Method Lab. Mean Stdev Z-Score3 0.86 0.84 0.93 0.81 0.84 0.86 0.07 N2 0.857 0.040 1.95 0.77 0.666 0.64 0.664 0.66 0.5 0.093 N2 0.650 0.087 -0.19 0.69 0.724 0.676 0.733 0.734 0.669 0.062 N2 0.704 0.029 0.410 B 0.367 0.082 0.117 0.058 0.06 0.055 0.016 N2 0.123 0.122 -5.411 0.596 0.491 0.519 0.531 0.549 0.0004 M2 0.537 0.039 -1.312 B 0.71 0.75 0.75 0.02 N2 0.737 0.023 0.717 0.625 0.723 0.648 0.636 0.645 0.616 0.01 N2 0.649 0.038 -0.120 C 0.642 0.605 0.609 0.562 0.639 0.639 0.025 N2 0.616 0.031 -0.523 0.61 0.58 0.6 0.67 0.62 0.64 0.025 N2 0.620 0.032 -0.428 0.561 0.51 0.68 0.0008 M2 0.584 0.087 -0.835 0.59 0.58 0.59 0.56 0.6 0.15 N2 0.584 0.015 -0.838 A 0.877 0.82 0.781 0.15 N2 0.826 0.048 1.641 A 0.626 0.578 0.585 0.579 0.6 0.594 0.0075 N2 0.594 0.018 -0.7
Element: Li Type: N
Lab. ID Value 1 Value 2 Value 3 Value 4 Value 5 Value 6 Det.Limit Method Lab. Mean Stdev11 0.367 0.36 0.365 0.408 0.399 0.09 M2 0.380 0.02216 B 0.374 0.381 0.365 0.384 3.5E-6 M1 0.376 0.00828 0.46 0.43 0.43 0.42 0.47 0.01 M2 0.442 0.02229 0.27 0.26 0.25 M2 0.260 0.010
Element: Lu Mean: 0.0066 Upper Limit: 0.0090 Lower Limit: 0.0042 Type: I
Lab. ID Value 1 Value 2 Value 3 Value 4 Value 5 Value 6 Det.Limit Method Lab. Mean Stdev Z-Score5 0.0104 0.0078 0.0057 0.00791 0.00561 0.00613 0.005 N2 0.0073 0.0018 0.410 B 0.011 0.01 0.008 0.009 0.007 0.008 0.002 N2 0.0088 0.0015 1.317 0.0052 0.0073 0.0071 0.0063 0.00668 0.00576 0.00039 N2 0.0064 0.0008 -0.123 0.0068 0.0067 0.0074 0.0061 0.0062 0.0067 0.0027 N2 0.0067 0.0005 0.028 0.005 0.005 0.002 0.0008 M2 0.0040 0.0017 -1.5
Element: Mg Mean: 580 Upper Limit: 690 Lower Limit: 470 Type: N
Lab. ID Value 1 Value 2 Value 3 Value 4 Value 5 Value 6 Det.Limit Method Lab. Mean Stdev1 609 622 614 596 624 625 3.4 E5 615 113 596 594 643 625 594 632 44 N2 614 224 530 630 620 620 590 A1 598 415 530.5 606.3 803.3 473.3 479.9 618.7 13.6 N2 585 1237 D 654 656 647 647 651 0.1 E5 651 411 459.19 461.71 447.91 498.84 542.87 0.21 M2 482 3913 C 562 564 561 10 E5 562 214 386 374 336 392 10 X1 372 2516 B 432 419 416 418 439 425 0.00025 E5 425 917 616 741 727 810 770 829 25 N2 749 7621 B 643 610 651 630 635 640 0.3 E5 635 1421 C 590 600 0.3 E5 595 724 270 344 204 255 181 58 X1 251 6427 A 884 880 909 29 A1 891 1629 142 132 133 131 131 118 0.1 M2 131 831 720 725 715 720 722 720 0.001 A1 720 333 A 565 616 560 616 520 560 40 A1 573 3733 C 580 586 554 555 596 615 2 E5 581 2436 940 1060 200 N2 1000 8539 631 601 675 649 3.59 A1 639 3140 3300 2600 3000 2500 2500 3000 3.59 N1 2817 331
Element: Mn Mean: 63 Upper Limit: 70 Lower Limit: 56 Type: R
Lab. ID Value 1 Value 2 Value 3 Value 4 Value 5 Value 6 Det.Limit Method Lab. Mean Stdev Z-Score1 64.8 65.9 65.9 65.3 66.4 66.3 0.1 E5 65.8 0.6 0.42 A 70.8 72.4 74 72.9 73.7 73.3 0.34 A1 72.9 1.2 1.43 71 70 72 73 71 74 0.39 N2 71.8 1.5 1.24 68.42 73.31 72.51 72.49 67.74 A1 70.9 2.6 1.15 52.5 59.2 54 48.7 49.5 54.7 1.4 N2 53.1 3.8 -1.56 58 59 58 58 58 55 0.5 N2 57.7 1.4 -0.87 D 62.1 61.4 61.4 61.7 61.3 0.1 E5 61.6 0.3 -0.310 B 63.8 68.2 66.4 65.7 66.2 64.9 0.54 N2 65.9 1.5 0.411 57.59 59.39 56.59 60.42 63.32 4 M2 59.5 2.6 -0.612 B 66 65 66 0.1 N2 65.7 0.6 0.313 C 65 68 67 67.6 68.1 2 E5 67.1 1.3 0.514 73.9 75.1 73.1 78.7 10 X1 75.2 2.5 1.715 55 0.5 X1 55.0 -1.216 B 53 55 54 53 55 54 0.0025 E5 54.0 0.9 -1.417 69.8 66.2 69.3 68.2 71.9 71.4 0.048 N2 69.5 2.1 0.918 70 60 63 62 65 59 0.4 X3 63.2 4.0 0.021 C 68 65 66 64 64 65 0.5 E5 65.3 1.5 0.322 68.7 69.3 57 71 68.5 68.2 0.1 X3 67.1 5.1 0.523 60.2 61.6 61.2 61.5 60.7 59.6 48.0E-6 N2 60.8 0.8 -0.424 86 86 83 84 83 2 X1 84.4 1.5 3.125 71 73 70 72 74 6 X3 72.0 1.6 1.327 B 56.9 54 52.8 56.7 52.4 53.5 0.57 X3 54.4 2.0 -1.328 62.4 60 64 61 63.2 0.07 M2 62.1 1.6 -0.229 16.7 16.9 17.2 17 16.8 17.1 0.01 M2 17.0 0.2 -6.731 100 98 100 105 100 100 0.001 A1 100.5 2.3 5.432 50 36 40 54 22 X1 45.0 8.4 -2.735 58 60.8 57.6 59.3 59.2 2 N2 59.0 1.3 -0.636 11 12.6 2.4 N2 11.8 1.1 -7.539 66.94 66.81 68.44 65.29 0.187 A1 66.9 1.3 0.540 63 64 63 62 63 62 0.187 N1 62.8 0.8 -0.141 B 67.99 66.66 65.56 68.24 68.33 66.27 A1 67.2 1.2 0.642 A 71.6 65 65.2 64.1 66.5 65.6 2.4 X2 66.3 2.7 0.442 B 63.7 64.4 63.2 37.2 65.2 64.6 2 A1 59.7 11.1 -0.5
Element: Mo Type: N
Lab. ID Value 1 Value 2 Value 3 Value 4 Value 5 Value 6 Det.Limit Method Lab. Mean Stdev10 A 0.151 0.161 0.152 0.14 0.134 0.11 0.025 N1 0.141 0.01811 0.059 0.052 0.054 0.055 0.009 M2 0.055 0.00320 C 0.308 0.376 0.164 0.181 0.192 0.366 0.03 N2 0.265 0.09738 A 0.151 0.03 N2 0.151
Element: Na Mean: 320 Upper Limit: 360 Lower Limit: 280 Type: R
Lab. ID Value 1 Value 2 Value 3 Value 4 Value 5 Value 6 Det.Limit Method Lab. Mean Stdev Z-Score3 320 314 329 326 335 347 14 N2 329 12 0.14 300 290 300 290 280 A1 292 8 -0.95 374.6 367.4 364.6 343 377.34 343.9 0.36 N2 362 15 1.16 293 283 296 292 290 277 1 N2 289 7 -1.07 D 280 283 282 281 283 0.1 E5 282 1 -1.29 323 314 330 319 318 342 5.7 N2 324 10 0.010 B 308 309 300 305 295 290 8.4 N2 301 8 -0.611 264.75 271.56 249.33 286.04 303.94 8.49 M2 275 21 -1.312 B 310 320 330 0.02 N2 320 10 -0.113 A 348 360 377 300 A1 362 15 1.114 138 129 147 150 10 X1 141 9 -5.116 A 321 332 326 327 330 328 0.025 A1 327 4 0.117 350 355 355 354 367 376 1.8 N2 360 10 1.020 C 328 324 328 342 339 345 0.15 N2 334 9 0.321 A 296 291 292 279 284 297 0.2 A1 290 7 -0.923 386 384 386 396 395 372 0.00022 N2 387 9 1.827 A 1318 1127 1395 32 A1 1280 138 2730 344 348 375 378 355 346 5 N2 358 15 1.031 510 510 505 508 507 510 0.001 A1 508 2 5.235 325 325 310 314 319 10 N2 319 7 -0.136 610 610 855 855 1045 1045 600 N2 837 195 1437 386 370 422 375 384 358 1 N4 383 22 1.638 A 317 304 312 1 N2 311 7 -0.339 689 631 651 701 15.3 A1 668 33 9.640 270 270 270 260 270 260 15.3 N1 267 5 -1.6
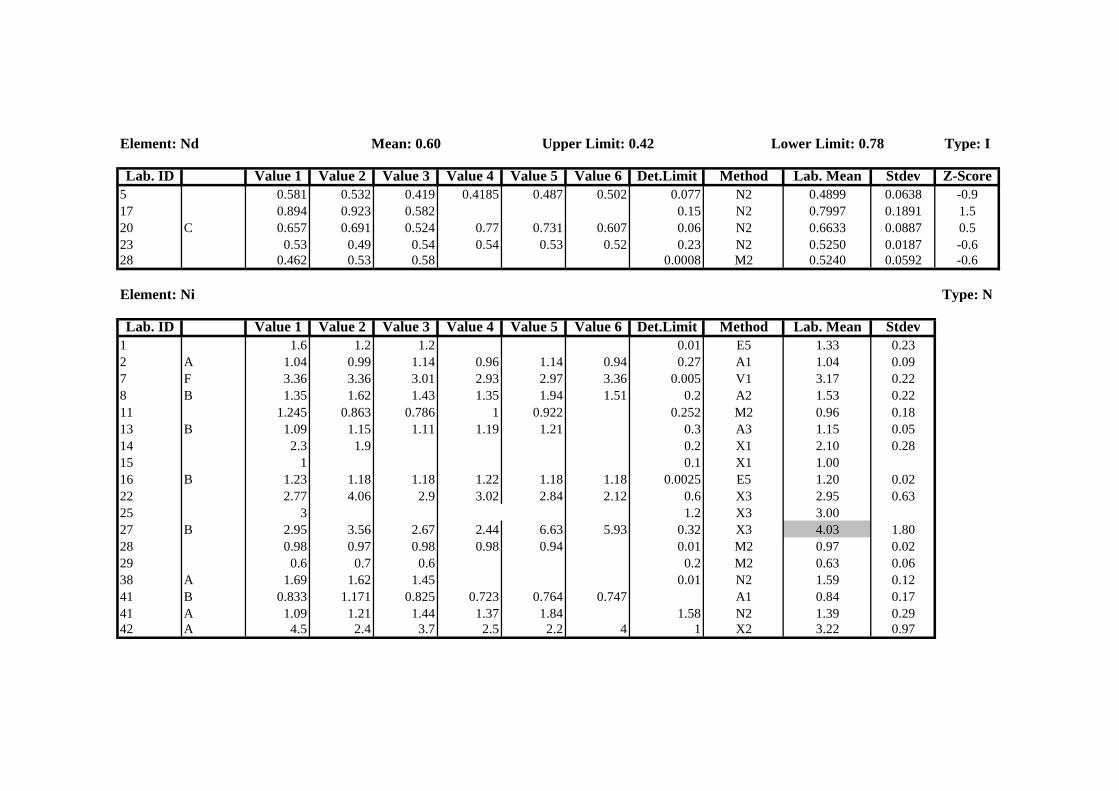
Element: Nd Mean: 0.60 Upper Limit: 0.42 Lower Limit: 0.78 Type: I
Lab. ID Value 1 Value 2 Value 3 Value 4 Value 5 Value 6 Det.Limit Method Lab. Mean Stdev Z-Score5 0.581 0.532 0.419 0.4185 0.487 0.502 0.077 N2 0.4899 0.0638 -0.917 0.894 0.923 0.582 0.15 N2 0.7997 0.1891 1.520 C 0.657 0.691 0.524 0.77 0.731 0.607 0.06 N2 0.6633 0.0887 0.523 0.53 0.49 0.54 0.54 0.53 0.52 0.23 N2 0.5250 0.0187 -0.628 0.462 0.53 0.58 0.0008 M2 0.5240 0.0592 -0.6
Element: Ni Type: N
Lab. ID Value 1 Value 2 Value 3 Value 4 Value 5 Value 6 Det.Limit Method Lab. Mean Stdev1 1.6 1.2 1.2 0.01 E5 1.33 0.232 A 1.04 0.99 1.14 0.96 1.14 0.94 0.27 A1 1.04 0.097 F 3.36 3.36 3.01 2.93 2.97 3.36 0.005 V1 3.17 0.228 B 1.35 1.62 1.43 1.35 1.94 1.51 0.2 A2 1.53 0.2211 1.245 0.863 0.786 1 0.922 0.252 M2 0.96 0.1813 B 1.09 1.15 1.11 1.19 1.21 0.3 A3 1.15 0.0514 2.3 1.9 0.2 X1 2.10 0.2815 1 0.1 X1 1.0016 B 1.23 1.18 1.18 1.22 1.18 1.18 0.0025 E5 1.20 0.0222 2.77 4.06 2.9 3.02 2.84 2.12 0.6 X3 2.95 0.6325 3 1.2 X3 3.0027 B 2.95 3.56 2.67 2.44 6.63 5.93 0.32 X3 4.03 1.8028 0.98 0.97 0.98 0.98 0.94 0.01 M2 0.97 0.0229 0.6 0.7 0.6 0.2 M2 0.63 0.0638 A 1.69 1.62 1.45 0.01 N2 1.59 0.1241 B 0.833 1.171 0.825 0.723 0.764 0.747 A1 0.84 0.1741 A 1.09 1.21 1.44 1.37 1.84 1.58 N2 1.39 0.2942 A 4.5 2.4 3.7 2.5 2.2 4 1 X2 3.22 0.97
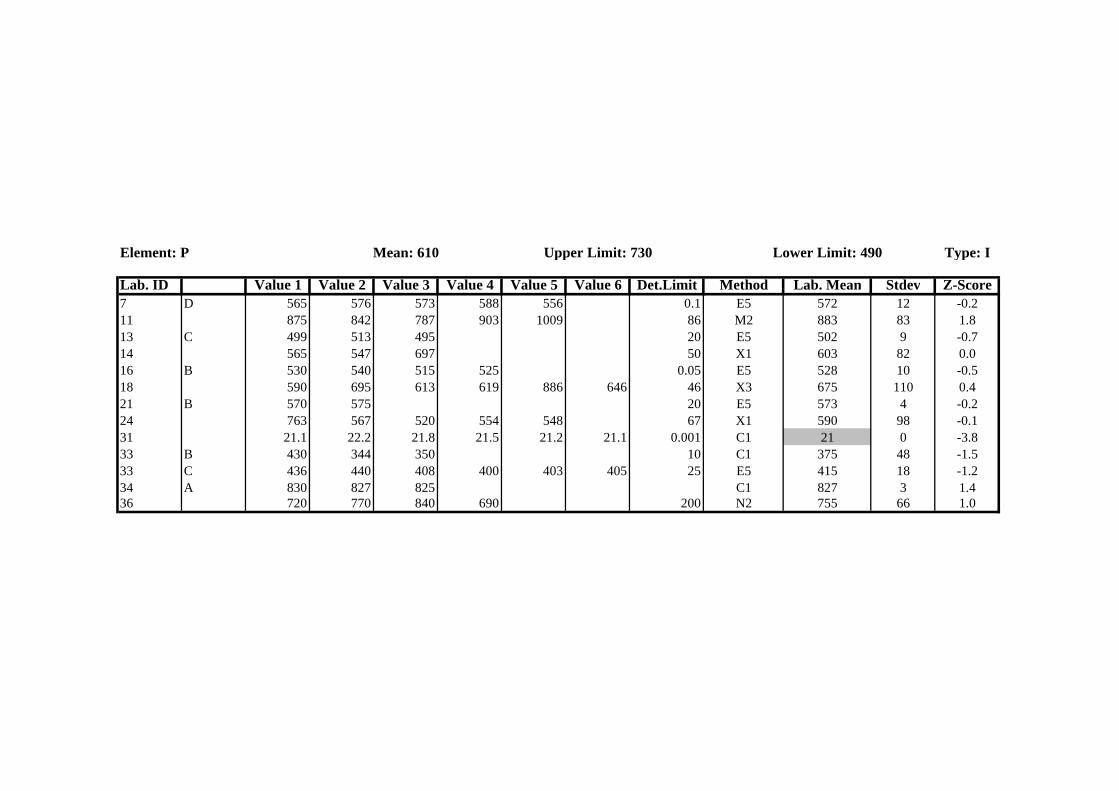
Element: P Mean: 610 Upper Limit: 730 Lower Limit: 490 Type: I
Lab. ID Value 1 Value 2 Value 3 Value 4 Value 5 Value 6 Det.Limit Method Lab. Mean Stdev Z-Score7 D 565 576 573 588 556 0.1 E5 572 12 -0.211 875 842 787 903 1009 86 M2 883 83 1.813 C 499 513 495 20 E5 502 9 -0.714 565 547 697 50 X1 603 82 0.016 B 530 540 515 525 0.05 E5 528 10 -0.518 590 695 613 619 886 646 46 X3 675 110 0.421 B 570 575 20 E5 573 4 -0.224 763 567 520 554 548 67 X1 590 98 -0.131 21.1 22.2 21.8 21.5 21.2 21.1 0.001 C1 21 0 -3.833 B 430 344 350 10 C1 375 48 -1.533 C 436 440 408 400 403 405 25 E5 415 18 -1.234 A 830 827 825 C1 827 3 1.436 720 770 840 690 200 N2 755 66 1.0
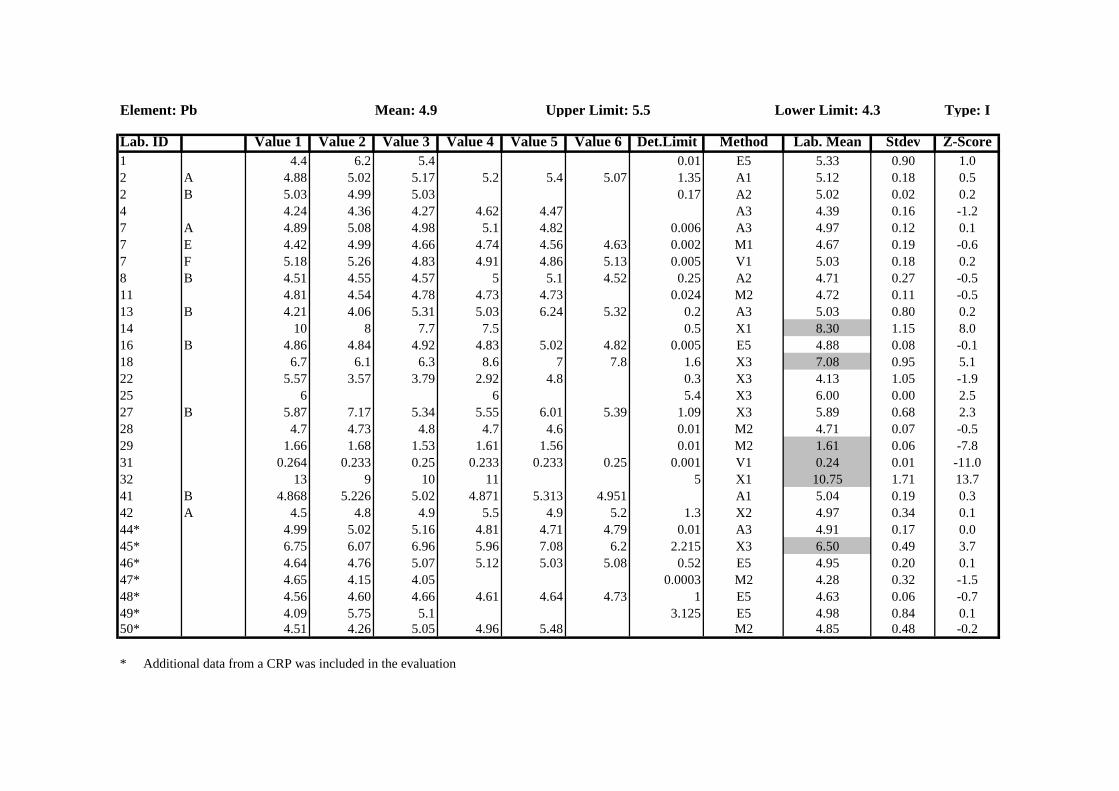
Element: Pb Mean: 4.9 Upper Limit: 5.5 Lower Limit: 4.3 Type: I
Lab. ID Value 1 Value 2 Value 3 Value 4 Value 5 Value 6 Det.Limit Method Lab. Mean Stdev Z-Score1 4.4 6.2 5.4 0.01 E5 5.33 0.90 1.02 A 4.88 5.02 5.17 5.2 5.4 5.07 1.35 A1 5.12 0.18 0.52 B 5.03 4.99 5.03 0.17 A2 5.02 0.02 0.24 4.24 4.36 4.27 4.62 4.47 A3 4.39 0.16 -1.27 A 4.89 5.08 4.98 5.1 4.82 0.006 A3 4.97 0.12 0.17 E 4.42 4.99 4.66 4.74 4.56 4.63 0.002 M1 4.67 0.19 -0.67 F 5.18 5.26 4.83 4.91 4.86 5.13 0.005 V1 5.03 0.18 0.28 B 4.51 4.55 4.57 5 5.1 4.52 0.25 A2 4.71 0.27 -0.511 4.81 4.54 4.78 4.73 4.73 0.024 M2 4.72 0.11 -0.513 B 4.21 4.06 5.31 5.03 6.24 5.32 0.2 A3 5.03 0.80 0.214 10 8 7.7 7.5 0.5 X1 8.30 1.15 8.016 B 4.86 4.84 4.92 4.83 5.02 4.82 0.005 E5 4.88 0.08 -0.118 6.7 6.1 6.3 8.6 7 7.8 1.6 X3 7.08 0.95 5.122 5.57 3.57 3.79 2.92 4.8 0.3 X3 4.13 1.05 -1.925 6 6 5.4 X3 6.00 0.00 2.527 B 5.87 7.17 5.34 5.55 6.01 5.39 1.09 X3 5.89 0.68 2.328 4.7 4.73 4.8 4.7 4.6 0.01 M2 4.71 0.07 -0.529 1.66 1.68 1.53 1.61 1.56 0.01 M2 1.61 0.06 -7.831 0.264 0.233 0.25 0.233 0.233 0.25 0.001 V1 0.24 0.01 -11.032 13 9 10 11 5 X1 10.75 1.71 13.741 B 4.868 5.226 5.02 4.871 5.313 4.951 A1 5.04 0.19 0.342 A 4.5 4.8 4.9 5.5 4.9 5.2 1.3 X2 4.97 0.34 0.144* 4.99 5.02 5.16 4.81 4.71 4.79 0.01 A3 4.91 0.17 0.045* 6.75 6.07 6.96 5.96 7.08 6.2 2.215 X3 6.50 0.49 3.746* 4.64 4.76 5.07 5.12 5.03 5.08 0.52 E5 4.95 0.20 0.147* 4.65 4.15 4.05 0.0003 M2 4.28 0.32 -1.548* 4.56 4.60 4.66 4.61 4.64 4.73 1 E5 4.63 0.06 -0.749* 4.09 5.75 5.1 3.125 E5 4.98 0.84 0.150* 4.51 4.26 5.05 4.96 5.48 M2 4.85 0.48 -0.2
* Additional data from a CRP was included in the evaluation
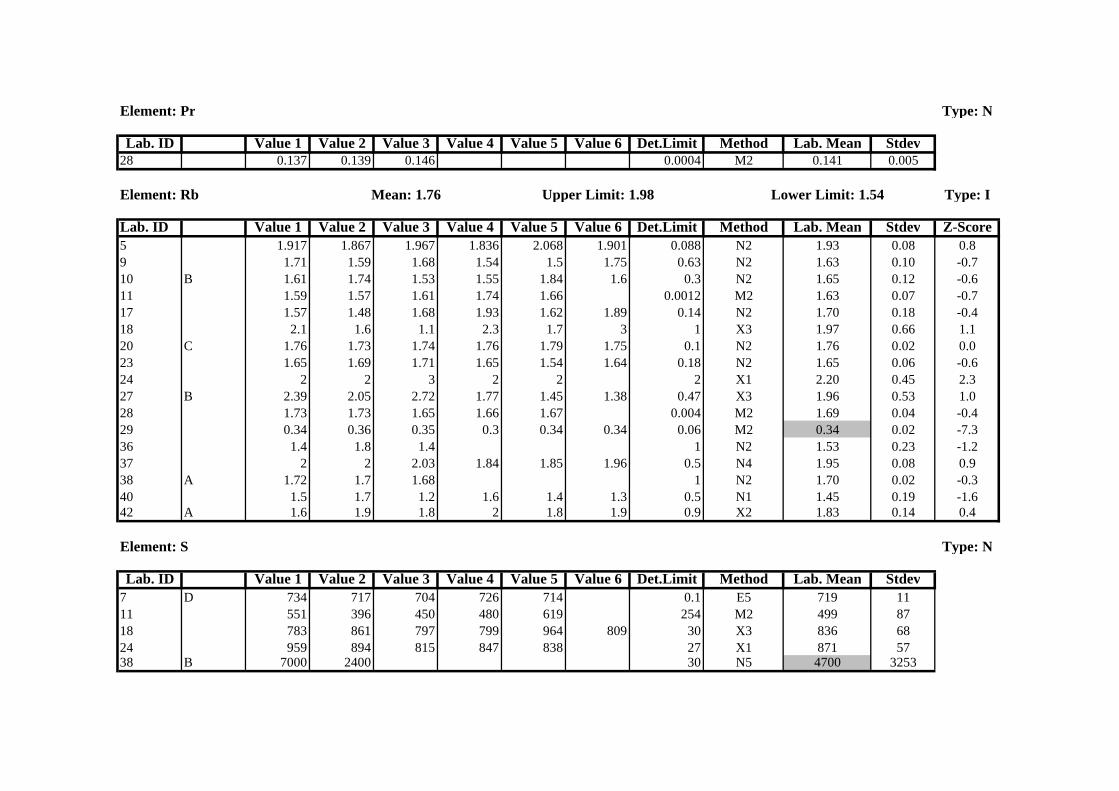
Element: Pr Type: N
Lab. ID Value 1 Value 2 Value 3 Value 4 Value 5 Value 6 Det.Limit Method Lab. Mean Stdev28 0.137 0.139 0.146 0.0004 M2 0.141 0.005
Element: Rb Mean: 1.76 Upper Limit: 1.98 Lower Limit: 1.54 Type: I
Lab. ID Value 1 Value 2 Value 3 Value 4 Value 5 Value 6 Det.Limit Method Lab. Mean Stdev Z-Score5 1.917 1.867 1.967 1.836 2.068 1.901 0.088 N2 1.93 0.08 0.89 1.71 1.59 1.68 1.54 1.5 1.75 0.63 N2 1.63 0.10 -0.710 B 1.61 1.74 1.53 1.55 1.84 1.6 0.3 N2 1.65 0.12 -0.611 1.59 1.57 1.61 1.74 1.66 0.0012 M2 1.63 0.07 -0.717 1.57 1.48 1.68 1.93 1.62 1.89 0.14 N2 1.70 0.18 -0.418 2.1 1.6 1.1 2.3 1.7 3 1 X3 1.97 0.66 1.120 C 1.76 1.73 1.74 1.76 1.79 1.75 0.1 N2 1.76 0.02 0.023 1.65 1.69 1.71 1.65 1.54 1.64 0.18 N2 1.65 0.06 -0.624 2 2 3 2 2 2 X1 2.20 0.45 2.327 B 2.39 2.05 2.72 1.77 1.45 1.38 0.47 X3 1.96 0.53 1.028 1.73 1.73 1.65 1.66 1.67 0.004 M2 1.69 0.04 -0.429 0.34 0.36 0.35 0.3 0.34 0.34 0.06 M2 0.34 0.02 -7.336 1.4 1.8 1.4 1 N2 1.53 0.23 -1.237 2 2 2.03 1.84 1.85 1.96 0.5 N4 1.95 0.08 0.938 A 1.72 1.7 1.68 1 N2 1.70 0.02 -0.340 1.5 1.7 1.2 1.6 1.4 1.3 0.5 N1 1.45 0.19 -1.642 A 1.6 1.9 1.8 2 1.8 1.9 0.9 X2 1.83 0.14 0.4
Element: S Type: N
Lab. ID Value 1 Value 2 Value 3 Value 4 Value 5 Value 6 Det.Limit Method Lab. Mean Stdev7 D 734 717 704 726 714 0.1 E5 719 1111 551 396 450 480 619 254 M2 499 8718 783 861 797 799 964 809 30 X3 836 6824 959 894 815 847 838 27 X1 871 5738 B 7000 2400 30 N5 4700 3253
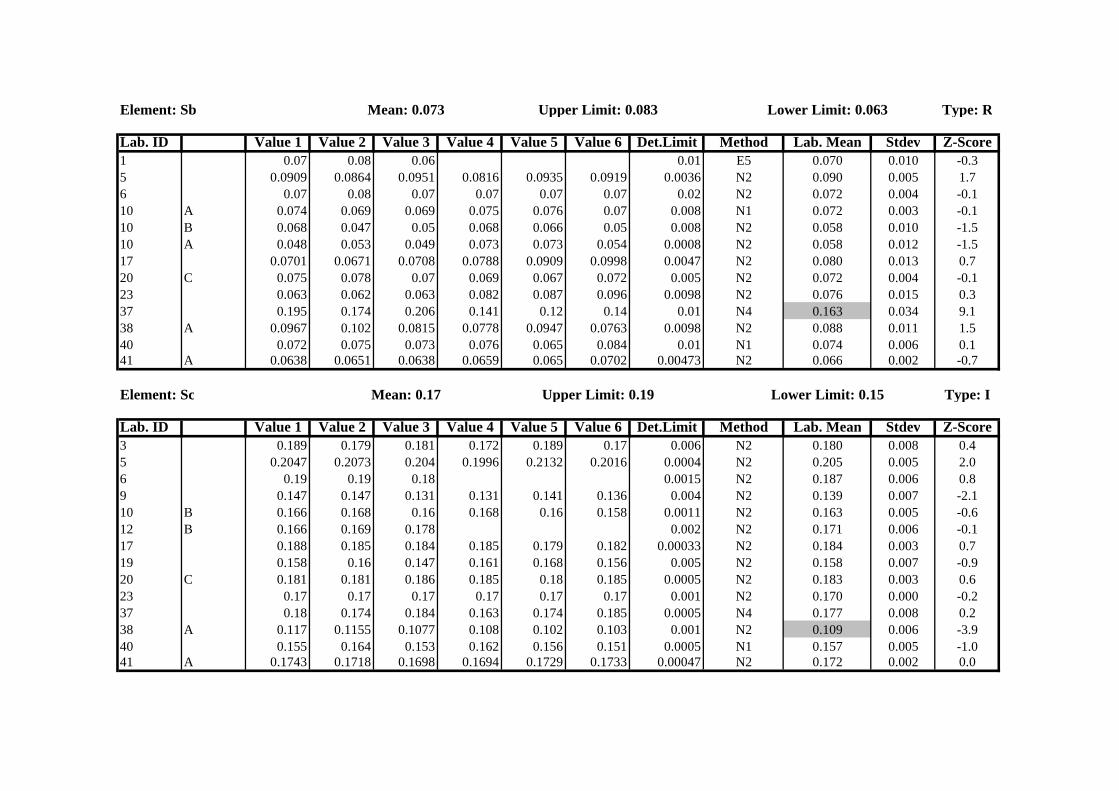
Element: Sb Mean: 0.073 Upper Limit: 0.083 Lower Limit: 0.063 Type: R
Lab. ID Value 1 Value 2 Value 3 Value 4 Value 5 Value 6 Det.Limit Method Lab. Mean Stdev Z-Score1 0.07 0.08 0.06 0.01 E5 0.070 0.010 -0.35 0.0909 0.0864 0.0951 0.0816 0.0935 0.0919 0.0036 N2 0.090 0.005 1.76 0.07 0.08 0.07 0.07 0.07 0.07 0.02 N2 0.072 0.004 -0.110 A 0.074 0.069 0.069 0.075 0.076 0.07 0.008 N1 0.072 0.003 -0.110 B 0.068 0.047 0.05 0.068 0.066 0.05 0.008 N2 0.058 0.010 -1.510 A 0.048 0.053 0.049 0.073 0.073 0.054 0.0008 N2 0.058 0.012 -1.517 0.0701 0.0671 0.0708 0.0788 0.0909 0.0998 0.0047 N2 0.080 0.013 0.720 C 0.075 0.078 0.07 0.069 0.067 0.072 0.005 N2 0.072 0.004 -0.123 0.063 0.062 0.063 0.082 0.087 0.096 0.0098 N2 0.076 0.015 0.337 0.195 0.174 0.206 0.141 0.12 0.14 0.01 N4 0.163 0.034 9.138 A 0.0967 0.102 0.0815 0.0778 0.0947 0.0763 0.0098 N2 0.088 0.011 1.540 0.072 0.075 0.073 0.076 0.065 0.084 0.01 N1 0.074 0.006 0.141 A 0.0638 0.0651 0.0638 0.0659 0.065 0.0702 0.00473 N2 0.066 0.002 -0.7
Element: Sc Mean: 0.17 Upper Limit: 0.19 Lower Limit: 0.15 Type: I
Lab. ID Value 1 Value 2 Value 3 Value 4 Value 5 Value 6 Det.Limit Method Lab. Mean Stdev Z-Score3 0.189 0.179 0.181 0.172 0.189 0.17 0.006 N2 0.180 0.008 0.45 0.2047 0.2073 0.204 0.1996 0.2132 0.2016 0.0004 N2 0.205 0.005 2.06 0.19 0.19 0.18 0.0015 N2 0.187 0.006 0.89 0.147 0.147 0.131 0.131 0.141 0.136 0.004 N2 0.139 0.007 -2.110 B 0.166 0.168 0.16 0.168 0.16 0.158 0.0011 N2 0.163 0.005 -0.612 B 0.166 0.169 0.178 0.002 N2 0.171 0.006 -0.117 0.188 0.185 0.184 0.185 0.179 0.182 0.00033 N2 0.184 0.003 0.719 0.158 0.16 0.147 0.161 0.168 0.156 0.005 N2 0.158 0.007 -0.920 C 0.181 0.181 0.186 0.185 0.18 0.185 0.0005 N2 0.183 0.003 0.623 0.17 0.17 0.17 0.17 0.17 0.17 0.001 N2 0.170 0.000 -0.237 0.18 0.174 0.184 0.163 0.174 0.185 0.0005 N4 0.177 0.008 0.238 A 0.117 0.1155 0.1077 0.108 0.102 0.103 0.001 N2 0.109 0.006 -3.940 0.155 0.164 0.153 0.162 0.156 0.151 0.0005 N1 0.157 0.005 -1.041 A 0.1743 0.1718 0.1698 0.1694 0.1729 0.1733 0.00047 N2 0.172 0.002 0.0
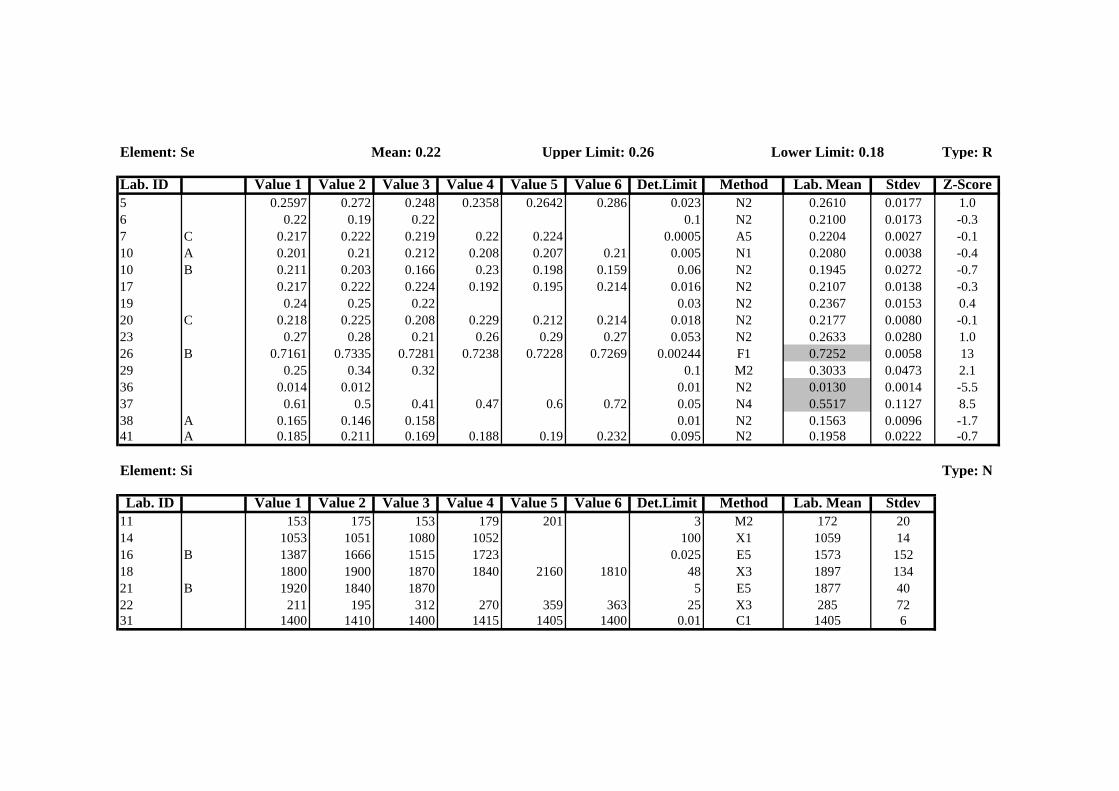
Element: Se Mean: 0.22 Upper Limit: 0.26 Lower Limit: 0.18 Type: R
Lab. ID Value 1 Value 2 Value 3 Value 4 Value 5 Value 6 Det.Limit Method Lab. Mean Stdev Z-Score5 0.2597 0.272 0.248 0.2358 0.2642 0.286 0.023 N2 0.2610 0.0177 1.06 0.22 0.19 0.22 0.1 N2 0.2100 0.0173 -0.37 C 0.217 0.222 0.219 0.22 0.224 0.0005 A5 0.2204 0.0027 -0.110 A 0.201 0.21 0.212 0.208 0.207 0.21 0.005 N1 0.2080 0.0038 -0.410 B 0.211 0.203 0.166 0.23 0.198 0.159 0.06 N2 0.1945 0.0272 -0.717 0.217 0.222 0.224 0.192 0.195 0.214 0.016 N2 0.2107 0.0138 -0.319 0.24 0.25 0.22 0.03 N2 0.2367 0.0153 0.420 C 0.218 0.225 0.208 0.229 0.212 0.214 0.018 N2 0.2177 0.0080 -0.123 0.27 0.28 0.21 0.26 0.29 0.27 0.053 N2 0.2633 0.0280 1.026 B 0.7161 0.7335 0.7281 0.7238 0.7228 0.7269 0.00244 F1 0.7252 0.0058 1329 0.25 0.34 0.32 0.1 M2 0.3033 0.0473 2.136 0.014 0.012 0.01 N2 0.0130 0.0014 -5.537 0.61 0.5 0.41 0.47 0.6 0.72 0.05 N4 0.5517 0.1127 8.538 A 0.165 0.146 0.158 0.01 N2 0.1563 0.0096 -1.741 A 0.185 0.211 0.169 0.188 0.19 0.232 0.095 N2 0.1958 0.0222 -0.7
Element: Si Type: N
Lab. ID Value 1 Value 2 Value 3 Value 4 Value 5 Value 6 Det.Limit Method Lab. Mean Stdev11 153 175 153 179 201 3 M2 172 2014 1053 1051 1080 1052 100 X1 1059 1416 B 1387 1666 1515 1723 0.025 E5 1573 15218 1800 1900 1870 1840 2160 1810 48 X3 1897 13421 B 1920 1840 1870 5 E5 1877 4022 211 195 312 270 359 363 25 X3 285 7231 1400 1410 1400 1415 1405 1400 0.01 C1 1405 6
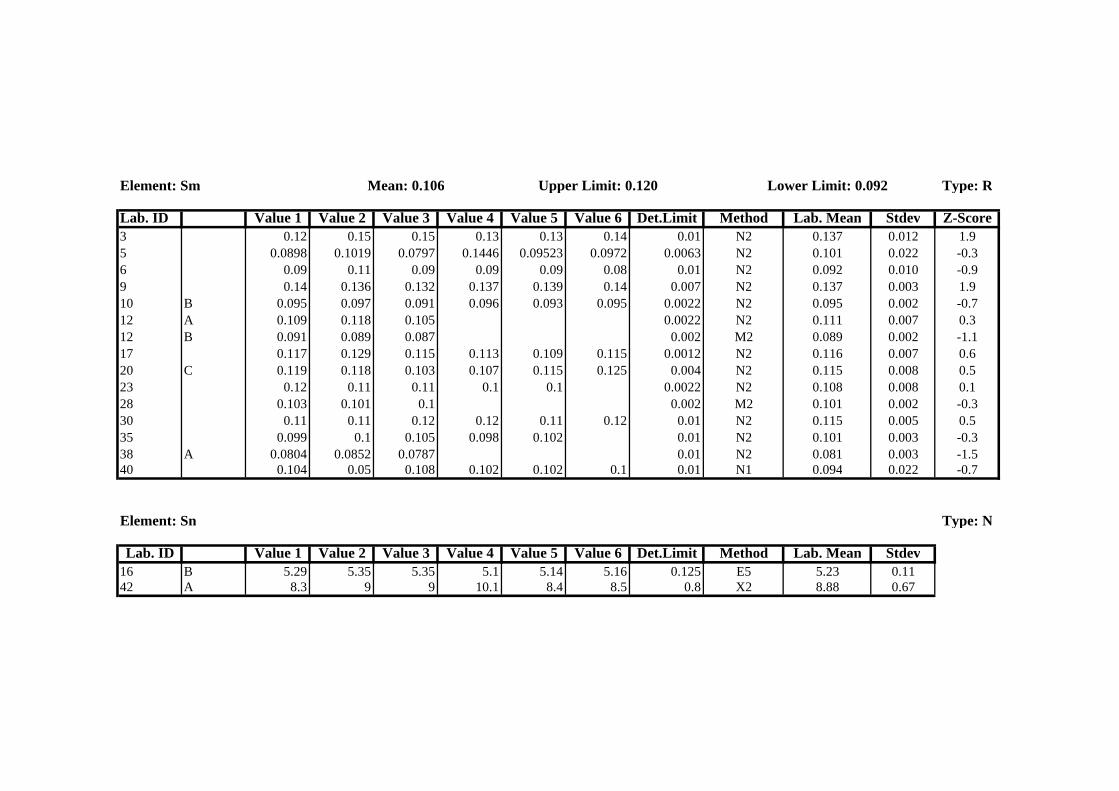
Element: Sm Mean: 0.106 Upper Limit: 0.120 Lower Limit: 0.092 Type: R
Lab. ID Value 1 Value 2 Value 3 Value 4 Value 5 Value 6 Det.Limit Method Lab. Mean Stdev Z-Score3 0.12 0.15 0.15 0.13 0.13 0.14 0.01 N2 0.137 0.012 1.95 0.0898 0.1019 0.0797 0.1446 0.09523 0.0972 0.0063 N2 0.101 0.022 -0.36 0.09 0.11 0.09 0.09 0.09 0.08 0.01 N2 0.092 0.010 -0.99 0.14 0.136 0.132 0.137 0.139 0.14 0.007 N2 0.137 0.003 1.910 B 0.095 0.097 0.091 0.096 0.093 0.095 0.0022 N2 0.095 0.002 -0.712 A 0.109 0.118 0.105 0.0022 N2 0.111 0.007 0.312 B 0.091 0.089 0.087 0.002 M2 0.089 0.002 -1.117 0.117 0.129 0.115 0.113 0.109 0.115 0.0012 N2 0.116 0.007 0.620 C 0.119 0.118 0.103 0.107 0.115 0.125 0.004 N2 0.115 0.008 0.523 0.12 0.11 0.11 0.1 0.1 0.0022 N2 0.108 0.008 0.128 0.103 0.101 0.1 0.002 M2 0.101 0.002 -0.330 0.11 0.11 0.12 0.12 0.11 0.12 0.01 N2 0.115 0.005 0.535 0.099 0.1 0.105 0.098 0.102 0.01 N2 0.101 0.003 -0.338 A 0.0804 0.0852 0.0787 0.01 N2 0.081 0.003 -1.540 0.104 0.05 0.108 0.102 0.102 0.1 0.01 N1 0.094 0.022 -0.7
Element: Sn Type: N
Lab. ID Value 1 Value 2 Value 3 Value 4 Value 5 Value 6 Det.Limit Method Lab. Mean Stdev16 B 5.29 5.35 5.35 5.1 5.14 5.16 0.125 E5 5.23 0.1142 A 8.3 9 9 10.1 8.4 8.5 0.8 X2 8.88 0.67
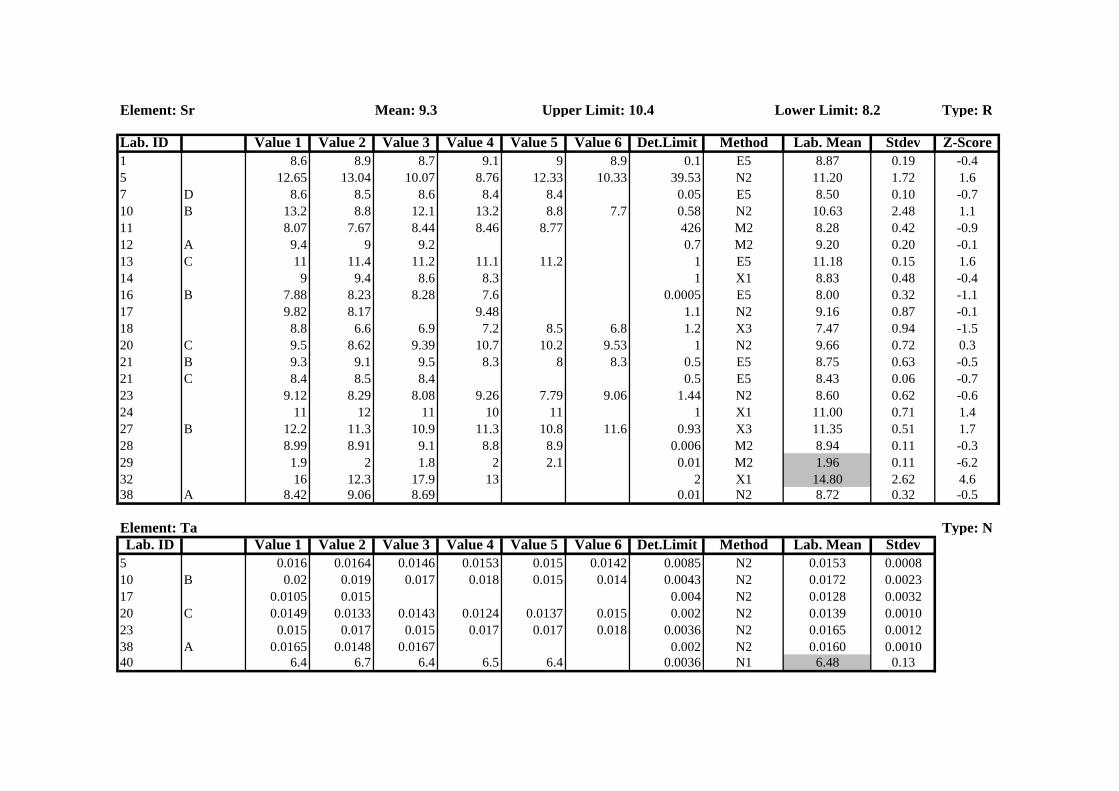
Element: Sr Mean: 9.3 Upper Limit: 10.4 Lower Limit: 8.2 Type: R
Lab. ID Value 1 Value 2 Value 3 Value 4 Value 5 Value 6 Det.Limit Method Lab. Mean Stdev Z-Score1 8.6 8.9 8.7 9.1 9 8.9 0.1 E5 8.87 0.19 -0.45 12.65 13.04 10.07 8.76 12.33 10.33 39.53 N2 11.20 1.72 1.67 D 8.6 8.5 8.6 8.4 8.4 0.05 E5 8.50 0.10 -0.710 B 13.2 8.8 12.1 13.2 8.8 7.7 0.58 N2 10.63 2.48 1.111 8.07 7.67 8.44 8.46 8.77 426 M2 8.28 0.42 -0.912 A 9.4 9 9.2 0.7 M2 9.20 0.20 -0.113 C 11 11.4 11.2 11.1 11.2 1 E5 11.18 0.15 1.614 9 9.4 8.6 8.3 1 X1 8.83 0.48 -0.416 B 7.88 8.23 8.28 7.6 0.0005 E5 8.00 0.32 -1.117 9.82 8.17 9.48 1.1 N2 9.16 0.87 -0.118 8.8 6.6 6.9 7.2 8.5 6.8 1.2 X3 7.47 0.94 -1.520 C 9.5 8.62 9.39 10.7 10.2 9.53 1 N2 9.66 0.72 0.321 B 9.3 9.1 9.5 8.3 8 8.3 0.5 E5 8.75 0.63 -0.521 C 8.4 8.5 8.4 0.5 E5 8.43 0.06 -0.723 9.12 8.29 8.08 9.26 7.79 9.06 1.44 N2 8.60 0.62 -0.624 11 12 11 10 11 1 X1 11.00 0.71 1.427 B 12.2 11.3 10.9 11.3 10.8 11.6 0.93 X3 11.35 0.51 1.728 8.99 8.91 9.1 8.8 8.9 0.006 M2 8.94 0.11 -0.329 1.9 2 1.8 2 2.1 0.01 M2 1.96 0.11 -6.232 16 12.3 17.9 13 2 X1 14.80 2.62 4.638 A 8.42 9.06 8.69 0.01 N2 8.72 0.32 -0.5
Element: Ta Type: NLab. ID Value 1 Value 2 Value 3 Value 4 Value 5 Value 6 Det.Limit Method Lab. Mean Stdev
5 0.016 0.0164 0.0146 0.0153 0.015 0.0142 0.0085 N2 0.0153 0.000810 B 0.02 0.019 0.017 0.018 0.015 0.014 0.0043 N2 0.0172 0.002317 0.0105 0.015 0.004 N2 0.0128 0.003220 C 0.0149 0.0133 0.0143 0.0124 0.0137 0.015 0.002 N2 0.0139 0.001023 0.015 0.017 0.015 0.017 0.017 0.018 0.0036 N2 0.0165 0.001238 A 0.0165 0.0148 0.0167 0.002 N2 0.0160 0.001040 6.4 6.7 6.4 6.5 6.4 0.0036 N1 6.48 0.13
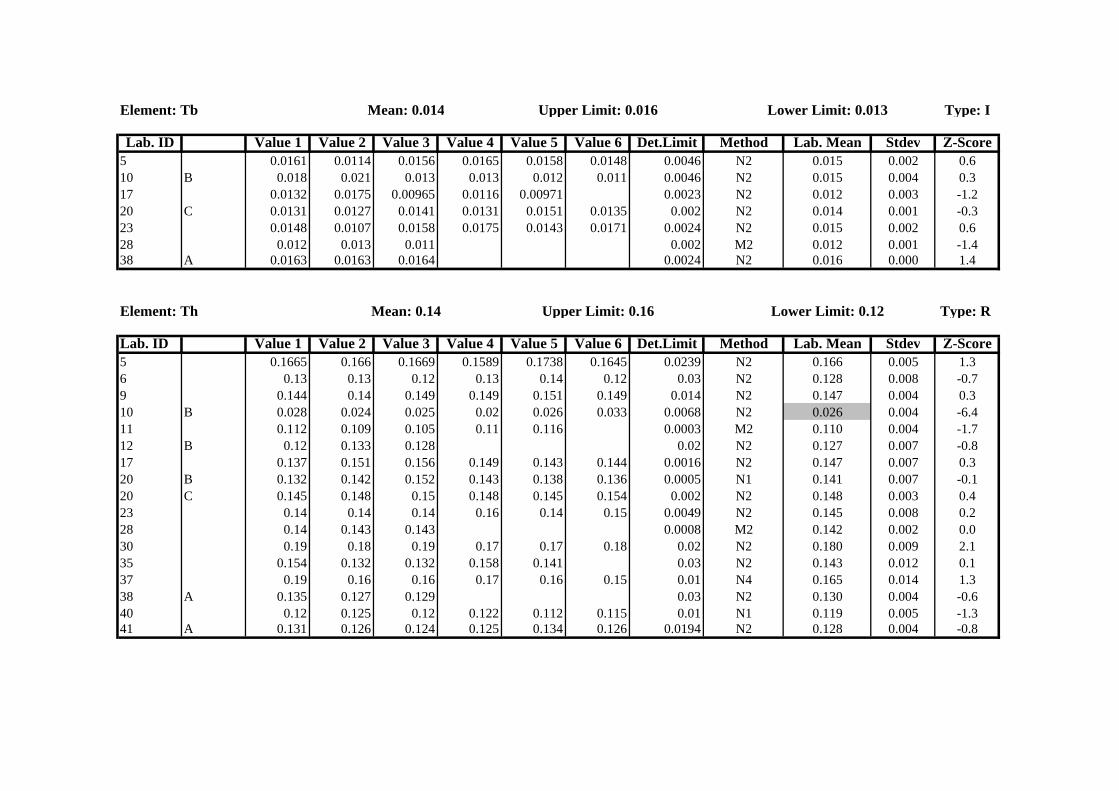
Element: Tb Mean: 0.014 Upper Limit: 0.016 Lower Limit: 0.013 Type: I
Lab. ID Value 1 Value 2 Value 3 Value 4 Value 5 Value 6 Det.Limit Method Lab. Mean Stdev Z-Score5 0.0161 0.0114 0.0156 0.0165 0.0158 0.0148 0.0046 N2 0.015 0.002 0.610 B 0.018 0.021 0.013 0.013 0.012 0.011 0.0046 N2 0.015 0.004 0.317 0.0132 0.0175 0.00965 0.0116 0.00971 0.0023 N2 0.012 0.003 -1.220 C 0.0131 0.0127 0.0141 0.0131 0.0151 0.0135 0.002 N2 0.014 0.001 -0.323 0.0148 0.0107 0.0158 0.0175 0.0143 0.0171 0.0024 N2 0.015 0.002 0.628 0.012 0.013 0.011 0.002 M2 0.012 0.001 -1.438 A 0.0163 0.0163 0.0164 0.0024 N2 0.016 0.000 1.4
Element: Th Mean: 0.14 Upper Limit: 0.16 Lower Limit: 0.12 Type: R
Lab. ID Value 1 Value 2 Value 3 Value 4 Value 5 Value 6 Det.Limit Method Lab. Mean Stdev Z-Score5 0.1665 0.166 0.1669 0.1589 0.1738 0.1645 0.0239 N2 0.166 0.005 1.36 0.13 0.13 0.12 0.13 0.14 0.12 0.03 N2 0.128 0.008 -0.79 0.144 0.14 0.149 0.149 0.151 0.149 0.014 N2 0.147 0.004 0.310 B 0.028 0.024 0.025 0.02 0.026 0.033 0.0068 N2 0.026 0.004 -6.411 0.112 0.109 0.105 0.11 0.116 0.0003 M2 0.110 0.004 -1.712 B 0.12 0.133 0.128 0.02 N2 0.127 0.007 -0.817 0.137 0.151 0.156 0.149 0.143 0.144 0.0016 N2 0.147 0.007 0.320 B 0.132 0.142 0.152 0.143 0.138 0.136 0.0005 N1 0.141 0.007 -0.120 C 0.145 0.148 0.15 0.148 0.145 0.154 0.002 N2 0.148 0.003 0.423 0.14 0.14 0.14 0.16 0.14 0.15 0.0049 N2 0.145 0.008 0.228 0.14 0.143 0.143 0.0008 M2 0.142 0.002 0.030 0.19 0.18 0.19 0.17 0.17 0.18 0.02 N2 0.180 0.009 2.135 0.154 0.132 0.132 0.158 0.141 0.03 N2 0.143 0.012 0.137 0.19 0.16 0.16 0.17 0.16 0.15 0.01 N4 0.165 0.014 1.338 A 0.135 0.127 0.129 0.03 N2 0.130 0.004 -0.640 0.12 0.125 0.12 0.122 0.112 0.115 0.01 N1 0.119 0.005 -1.341 A 0.131 0.126 0.124 0.125 0.134 0.126 0.0194 N2 0.128 0.004 -0.8

Element: Ti Type: N
Lab. ID Value 1 Value 2 Value 3 Value 4 Value 5 Value 6 Det.Limit Method Lab. Mean Stdev5 59.7 66.2 59.8 41.1 57.3 35.2 N2 56.8 9.410 B 46 53 45 60 45 62 4 N2 51.8 7.711 24.59 24.03 23.82 23.86 27.44 0.089 M2 24.7 1.513 C 8.41 8.13 7.89 8.01 8.01 1 E5 8.1 0.214 87.3 70.8 86.5 75.8 10 X1 80.1 8.116 B 52.4 50.5 48.6 51.5 0.004 E5 50.8 1.617 68.5 49.3 67.5 67.9 65.1 56.3 4.3 N2 62.4 7.918 56 52 52 49 50 51 2 X3 51.7 2.422 42.6 40.9 34.9 36.2 36.8 33.2 0.3 X3 37.4 3.625 77 61 76 66 70 13.6 X3 70.0 6.727 B 66.1 50.8 61.6 56.7 53 58.2 2.33 X3 57.7 5.632 130 150 150 210 45 X1 160 35
Element: Tl Type: N
Lab. ID Value 1 Value 2 Value 3 Value 4 Value 5 Value 6 Det.Limit Method Lab. Mean Stdev7 E 0.0107 0.0112 0.011 0.0114 0.0108 0.0116 0.0002 M1 0.011 0.00011 0.007 0.011 0.008 0.006 M2 0.009 0.00228 0.008 0.009 0.005 0.006 0.007 0.004 M2 0.007 0.002
Element: Tm Type: N
Lab. ID Value 1 Value 2 Value 3 Value 4 Value 5 Value 6 Det.Limit Method Lab. Mean Stdev5 0.0039 0.0069 0.006 0.0062 0.0028 N2 0.005 0.00220 C 0.0078 0.013 0.014 0.0096 0.014 0.011 0.004 N2 0.012 0.00328 0.005 0.005 0.003 0.002 M2 0.004 0.001
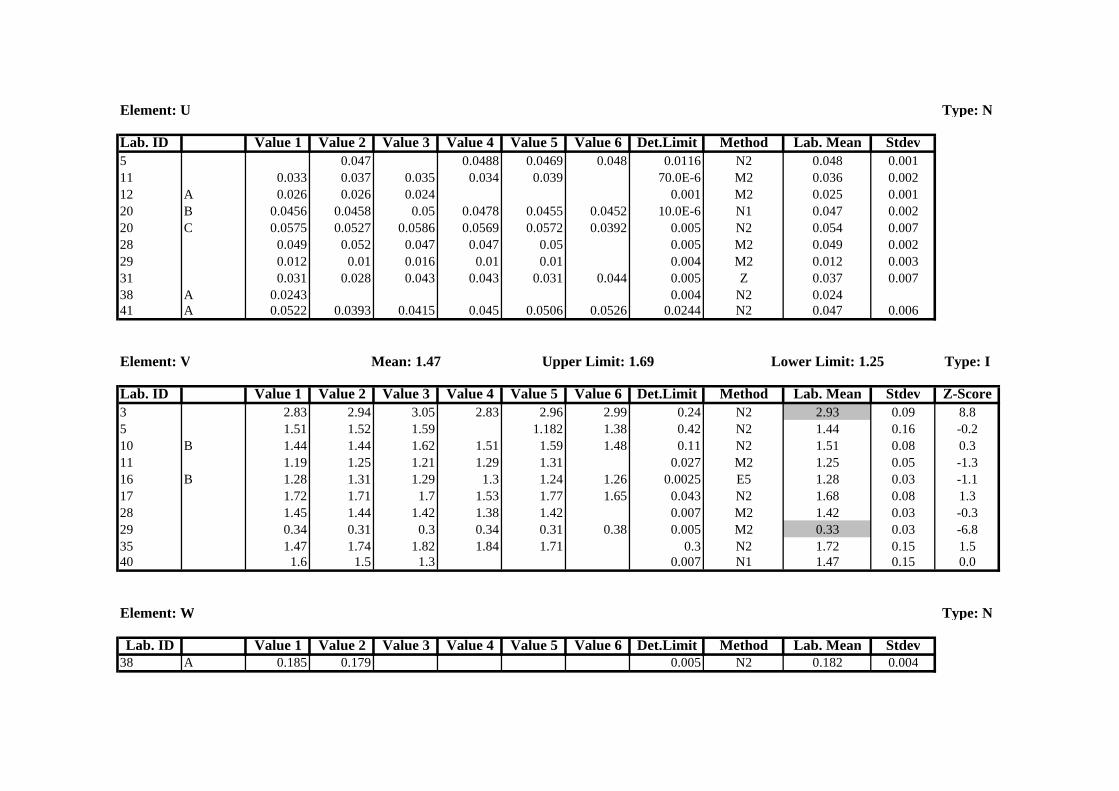
Element: U Type: N
Lab. ID Value 1 Value 2 Value 3 Value 4 Value 5 Value 6 Det.Limit Method Lab. Mean Stdev5 0.047 0.0488 0.0469 0.048 0.0116 N2 0.048 0.00111 0.033 0.037 0.035 0.034 0.039 70.0E-6 M2 0.036 0.00212 A 0.026 0.026 0.024 0.001 M2 0.025 0.00120 B 0.0456 0.0458 0.05 0.0478 0.0455 0.0452 10.0E-6 N1 0.047 0.00220 C 0.0575 0.0527 0.0586 0.0569 0.0572 0.0392 0.005 N2 0.054 0.00728 0.049 0.052 0.047 0.047 0.05 0.005 M2 0.049 0.00229 0.012 0.01 0.016 0.01 0.01 0.004 M2 0.012 0.00331 0.031 0.028 0.043 0.043 0.031 0.044 0.005 Z 0.037 0.00738 A 0.0243 0.004 N2 0.02441 A 0.0522 0.0393 0.0415 0.045 0.0506 0.0526 0.0244 N2 0.047 0.006
Element: V Mean: 1.47 Upper Limit: 1.69 Lower Limit: 1.25 Type: I
Lab. ID Value 1 Value 2 Value 3 Value 4 Value 5 Value 6 Det.Limit Method Lab. Mean Stdev Z-Score3 2.83 2.94 3.05 2.83 2.96 2.99 0.24 N2 2.93 0.09 8.85 1.51 1.52 1.59 1.182 1.38 0.42 N2 1.44 0.16 -0.210 B 1.44 1.44 1.62 1.51 1.59 1.48 0.11 N2 1.51 0.08 0.311 1.19 1.25 1.21 1.29 1.31 0.027 M2 1.25 0.05 -1.316 B 1.28 1.31 1.29 1.3 1.24 1.26 0.0025 E5 1.28 0.03 -1.117 1.72 1.71 1.7 1.53 1.77 1.65 0.043 N2 1.68 0.08 1.328 1.45 1.44 1.42 1.38 1.42 0.007 M2 1.42 0.03 -0.329 0.34 0.31 0.3 0.34 0.31 0.38 0.005 M2 0.33 0.03 -6.835 1.47 1.74 1.82 1.84 1.71 0.3 N2 1.72 0.15 1.540 1.6 1.5 1.3 0.007 N1 1.47 0.15 0.0
Element: W Type: N
Lab. ID Value 1 Value 2 Value 3 Value 4 Value 5 Value 6 Det.Limit Method Lab. Mean Stdev38 A 0.185 0.179 0.005 N2 0.182 0.004
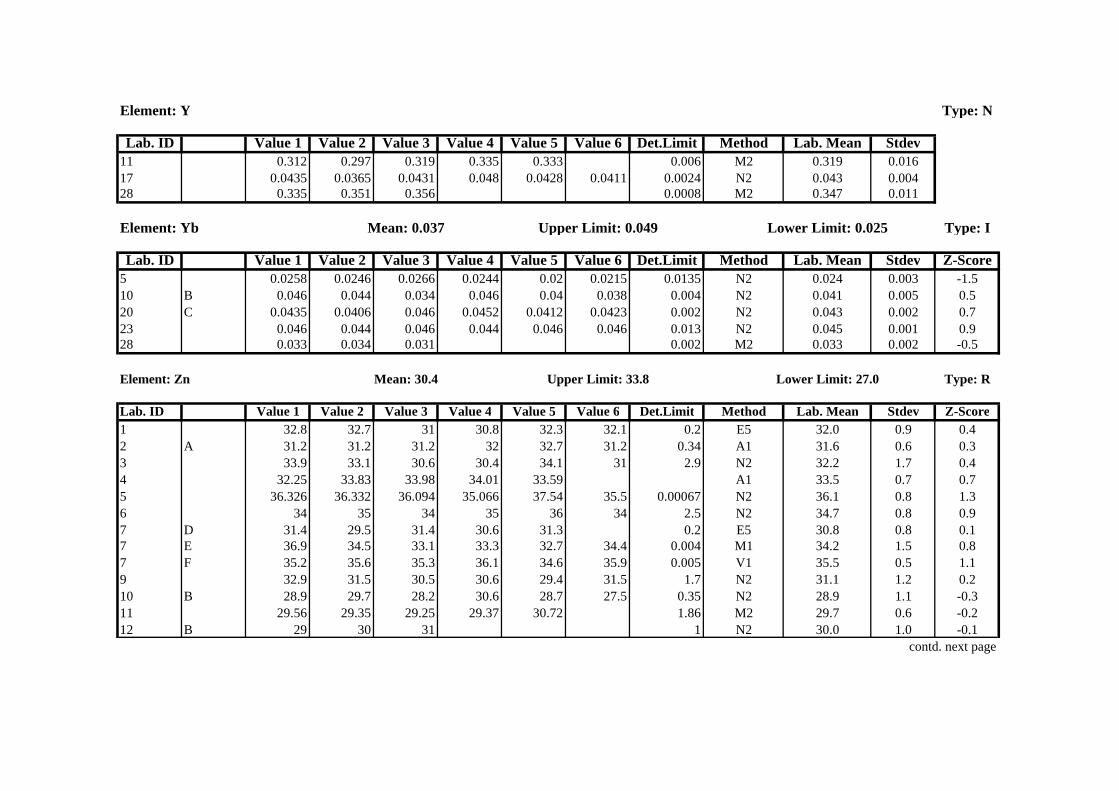
Element: Y Type: N
Lab. ID Value 1 Value 2 Value 3 Value 4 Value 5 Value 6 Det.Limit Method Lab. Mean Stdev11 0.312 0.297 0.319 0.335 0.333 0.006 M2 0.319 0.01617 0.0435 0.0365 0.0431 0.048 0.0428 0.0411 0.0024 N2 0.043 0.00428 0.335 0.351 0.356 0.0008 M2 0.347 0.011
Element: Yb Mean: 0.037 Upper Limit: 0.049 Lower Limit: 0.025 Type: I
Lab. ID Value 1 Value 2 Value 3 Value 4 Value 5 Value 6 Det.Limit Method Lab. Mean Stdev Z-Score5 0.0258 0.0246 0.0266 0.0244 0.02 0.0215 0.0135 N2 0.024 0.003 -1.510 B 0.046 0.044 0.034 0.046 0.04 0.038 0.004 N2 0.041 0.005 0.520 C 0.0435 0.0406 0.046 0.0452 0.0412 0.0423 0.002 N2 0.043 0.002 0.723 0.046 0.044 0.046 0.044 0.046 0.046 0.013 N2 0.045 0.001 0.928 0.033 0.034 0.031 0.002 M2 0.033 0.002 -0.5
Element: Zn Mean: 30.4 Upper Limit: 33.8 Lower Limit: 27.0 Type: R
Lab. ID Value 1 Value 2 Value 3 Value 4 Value 5 Value 6 Det.Limit Method Lab. Mean Stdev Z-Score1 32.8 32.7 31 30.8 32.3 32.1 0.2 E5 32.0 0.9 0.42 A 31.2 31.2 31.2 32 32.7 31.2 0.34 A1 31.6 0.6 0.33 33.9 33.1 30.6 30.4 34.1 31 2.9 N2 32.2 1.7 0.44 32.25 33.83 33.98 34.01 33.59 A1 33.5 0.7 0.75 36.326 36.332 36.094 35.066 37.54 35.5 0.00067 N2 36.1 0.8 1.36 34 35 34 35 36 34 2.5 N2 34.7 0.8 0.97 D 31.4 29.5 31.4 30.6 31.3 0.2 E5 30.8 0.8 0.17 E 36.9 34.5 33.1 33.3 32.7 34.4 0.004 M1 34.2 1.5 0.87 F 35.2 35.6 35.3 36.1 34.6 35.9 0.005 V1 35.5 0.5 1.19 32.9 31.5 30.5 30.6 29.4 31.5 1.7 N2 31.1 1.2 0.210 B 28.9 29.7 28.2 30.6 28.7 27.5 0.35 N2 28.9 1.1 -0.311 29.56 29.35 29.25 29.37 30.72 1.86 M2 29.7 0.6 -0.212 B 29 30 31 1 N2 30.0 1.0 -0.1
contd. next page
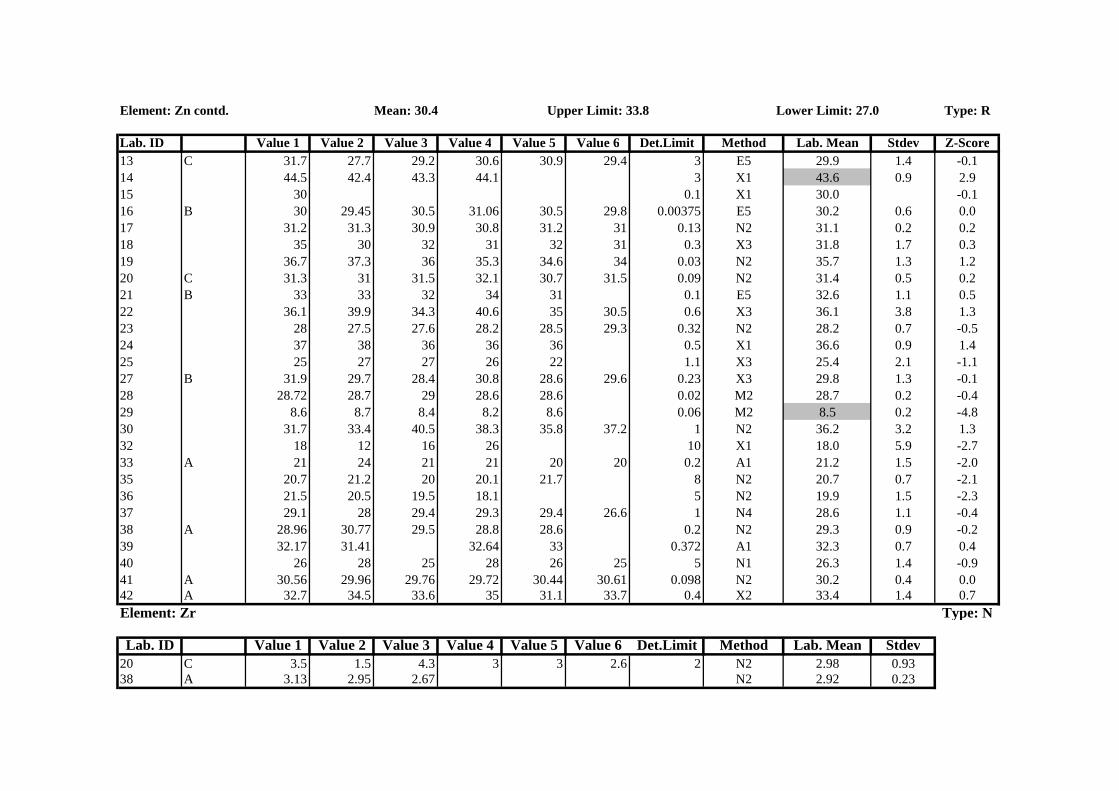
Element: Zn contd. Mean: 30.4 Upper Limit: 33.8 Lower Limit: 27.0 Type: R
Lab. ID Value 1 Value 2 Value 3 Value 4 Value 5 Value 6 Det.Limit Method Lab. Mean Stdev Z-Score13 C 31.7 27.7 29.2 30.6 30.9 29.4 3 E5 29.9 1.4 -0.114 44.5 42.4 43.3 44.1 3 X1 43.6 0.9 2.915 30 0.1 X1 30.0 -0.116 B 30 29.45 30.5 31.06 30.5 29.8 0.00375 E5 30.2 0.6 0.017 31.2 31.3 30.9 30.8 31.2 31 0.13 N2 31.1 0.2 0.218 35 30 32 31 32 31 0.3 X3 31.8 1.7 0.319 36.7 37.3 36 35.3 34.6 34 0.03 N2 35.7 1.3 1.220 C 31.3 31 31.5 32.1 30.7 31.5 0.09 N2 31.4 0.5 0.221 B 33 33 32 34 31 0.1 E5 32.6 1.1 0.522 36.1 39.9 34.3 40.6 35 30.5 0.6 X3 36.1 3.8 1.323 28 27.5 27.6 28.2 28.5 29.3 0.32 N2 28.2 0.7 -0.524 37 38 36 36 36 0.5 X1 36.6 0.9 1.425 25 27 27 26 22 1.1 X3 25.4 2.1 -1.127 B 31.9 29.7 28.4 30.8 28.6 29.6 0.23 X3 29.8 1.3 -0.128 28.72 28.7 29 28.6 28.6 0.02 M2 28.7 0.2 -0.429 8.6 8.7 8.4 8.2 8.6 0.06 M2 8.5 0.2 -4.830 31.7 33.4 40.5 38.3 35.8 37.2 1 N2 36.2 3.2 1.332 18 12 16 26 10 X1 18.0 5.9 -2.733 A 21 24 21 21 20 20 0.2 A1 21.2 1.5 -2.035 20.7 21.2 20 20.1 21.7 8 N2 20.7 0.7 -2.136 21.5 20.5 19.5 18.1 5 N2 19.9 1.5 -2.337 29.1 28 29.4 29.3 29.4 26.6 1 N4 28.6 1.1 -0.438 A 28.96 30.77 29.5 28.8 28.6 0.2 N2 29.3 0.9 -0.239 32.17 31.41 32.64 33 0.372 A1 32.3 0.7 0.440 26 28 25 28 26 25 5 N1 26.3 1.4 -0.941 A 30.56 29.96 29.76 29.72 30.44 30.61 0.098 N2 30.2 0.4 0.042 A 32.7 34.5 33.6 35 31.1 33.7 0.4 X2 33.4 1.4 0.7Element: Zr Type: N
Lab. ID Value 1 Value 2 Value 3 Value 4 Value 5 Value 6 Det.Limit Method Lab. Mean Stdev20 C 3.5 1.5 4.3 3 3 2.6 2 N2 2.98 0.9338 A 3.13 2.95 2.67 N2 2.92 0.23
APPENDIX III
GRAPHICAL PRESENTATION (S-PLOTS)
OF THE RESULTS
SORTED BY ANALYTE
(For a description of the terms and codes used, please refer to Section 7)
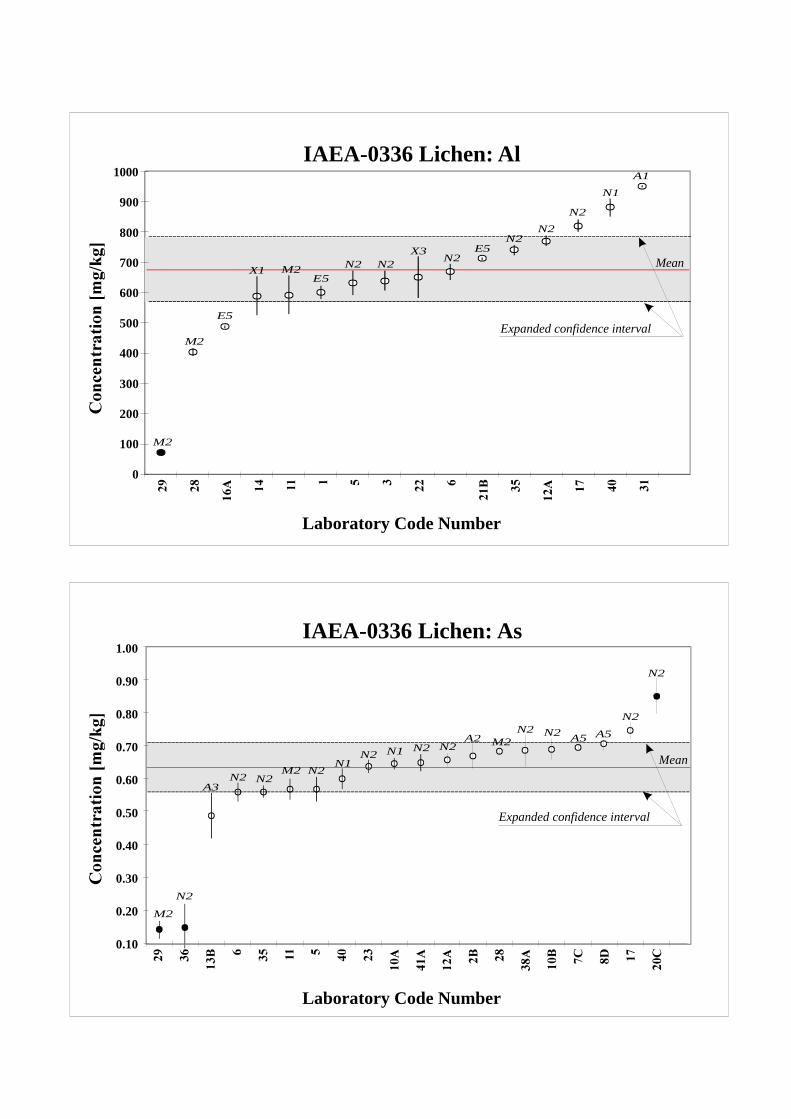
IAEA-0336 Lichen: Al
Laboratory Code Number
Mean
Expanded confidence interval
M2
N2N2
M2
E5
X1E5
X3
N1
A1
N2
E5
M2
N2N2
N2
0
100
200
300
400
500
600
700
800
900
1000
IAEA-0336 Lichen: As
Laboratory Code Number
Mean
Expanded confidence interval
M2
N2
N2 N2N2
N1N2 N1 N2 N2
A2N2 N2 A5
N2
A5
N2
M2
M2
A3
0.10
0.20
0.30
0.40
0.50
0.60
0.70
0.80
0.90
1.00
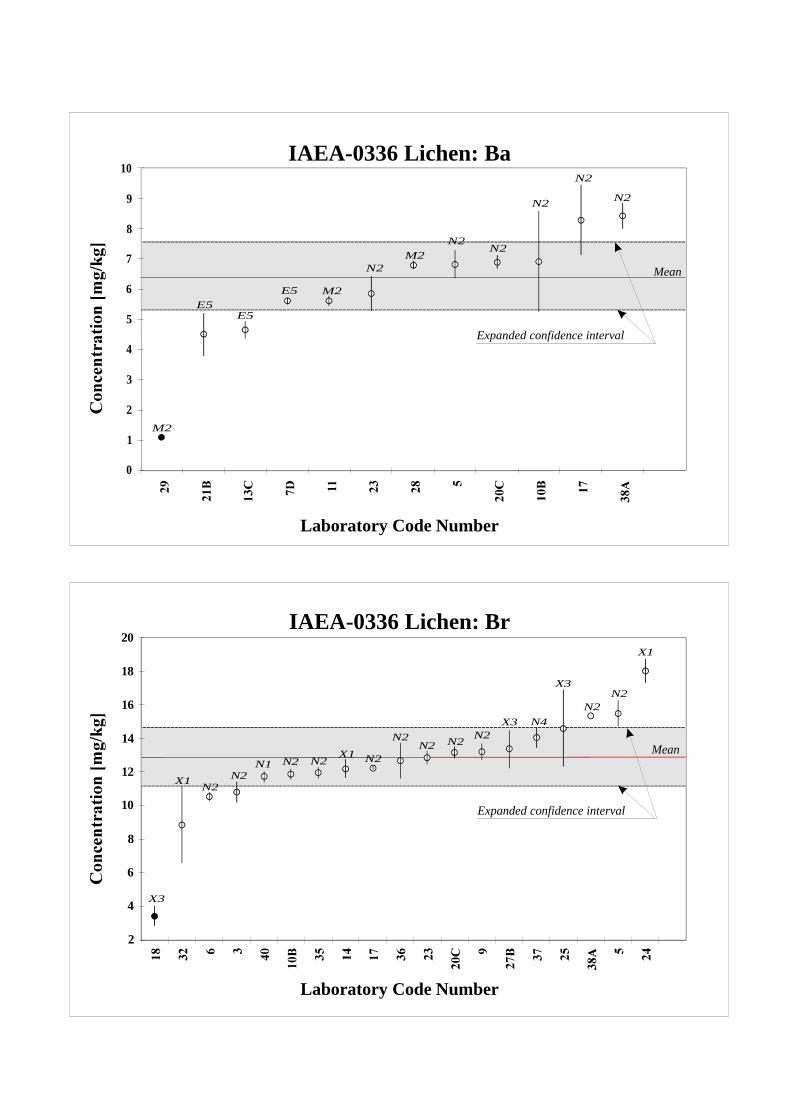
Laboratory Code Number
IAEA-0336 Lichen: Br
2
4
6
8
10
12
14
16
18
20
Mean
Expanded confidence interval
N2N2
N1 N2 N2 N2
N2N2 N2
N2
N2N2
N4
X3
X3
X3
X1
X1
X1
Laboratory Code Number
IAEA-0336 Lichen: Ba
1
0
2
3
4
5
6
7
8
9
10
Mean
Expanded confidence interval
M2
M2
M2
E5E5
E5
N2
N2
N2
N2
N2N2
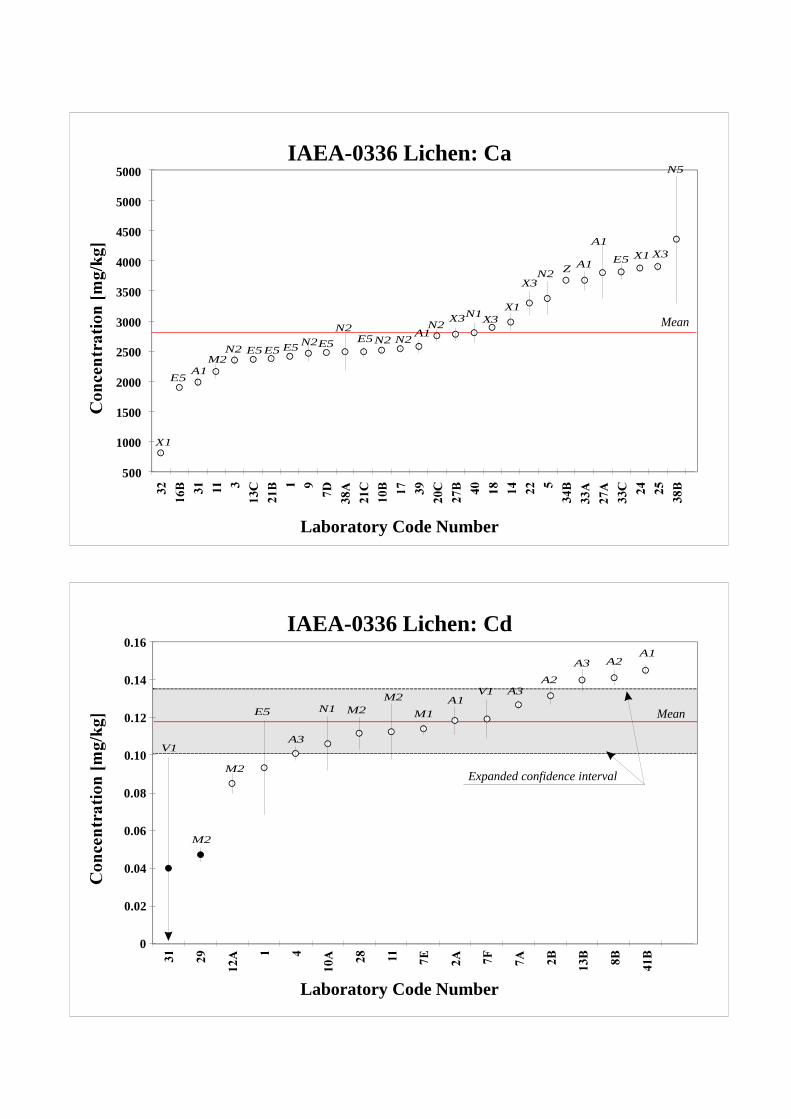
Laboratory Code Number
500
1000
1500
2000
2500
3000
3500
4000
4500
5000
5000
Mean
X1
X1
X1
X3 X3
X3
X3
N2 Z
N5
M2N2
N2N1
N2N2 N2N2
E5
E5E5E5
E5
E5 E5 A1
A1
A1
A1
IAEA-0336 Lichen: Ca
Laboratory Code Number
0
0.02
0.04
0.06
0.08
0.10
0.12
0.14
0.16
Expanded confidence interval
Mean
V1
M2
M2
M2
M2
M1A1
A1
V1 A3
A3
A2
A2
E5
A3
N1
IAEA-0336 Lichen: Cd
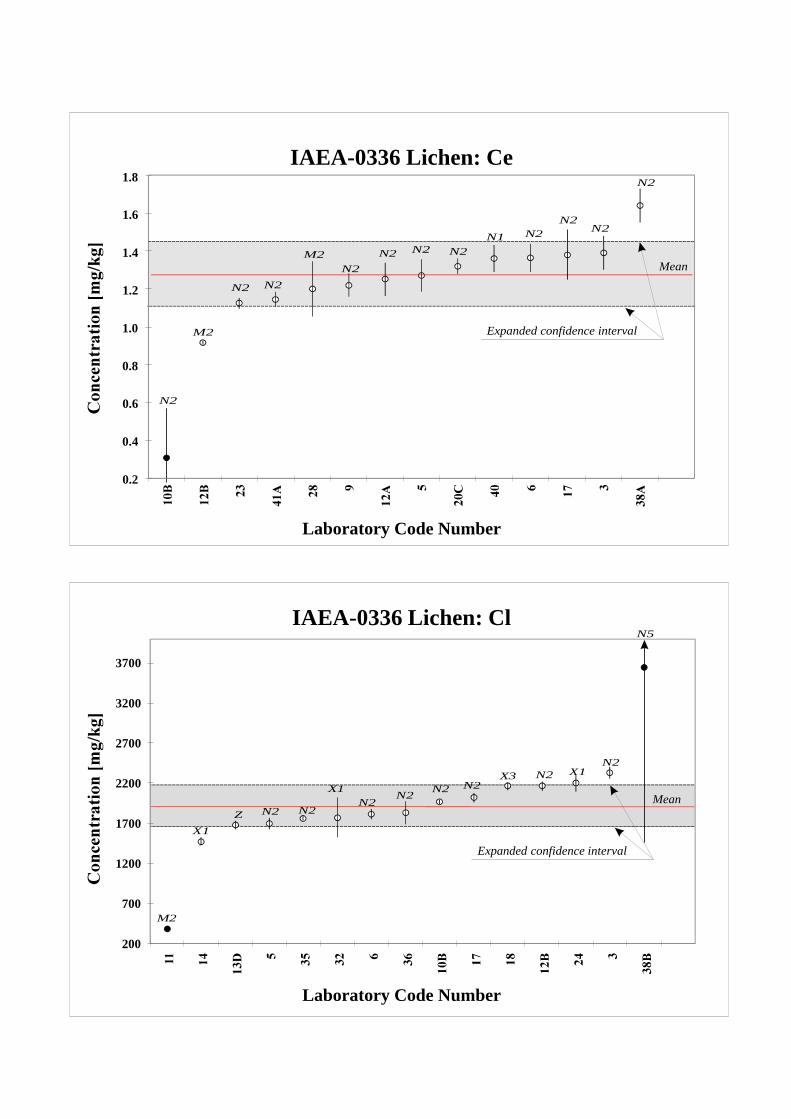
Laboratory Code Number
IAEA-0336 Lichen: Ce
0.2
0.4
0.6
0.8
1.0
1.2
1.4
1.6
1.8
Mean
Expanded confidence intervalM2
M2
N2
N2 N2
N2
N2 N2 N2
N2N2
N2
N2
N1
Laboratory Code Number
IAEA-0336 Lichen: Cl
200
700
1200
1700
2200
2700
3200
3700
Mean
Expanded confidence interval
M2
X1
X3 X1
X1
N2 N2N2
N2N2 N2
N2
N5
N2
Z
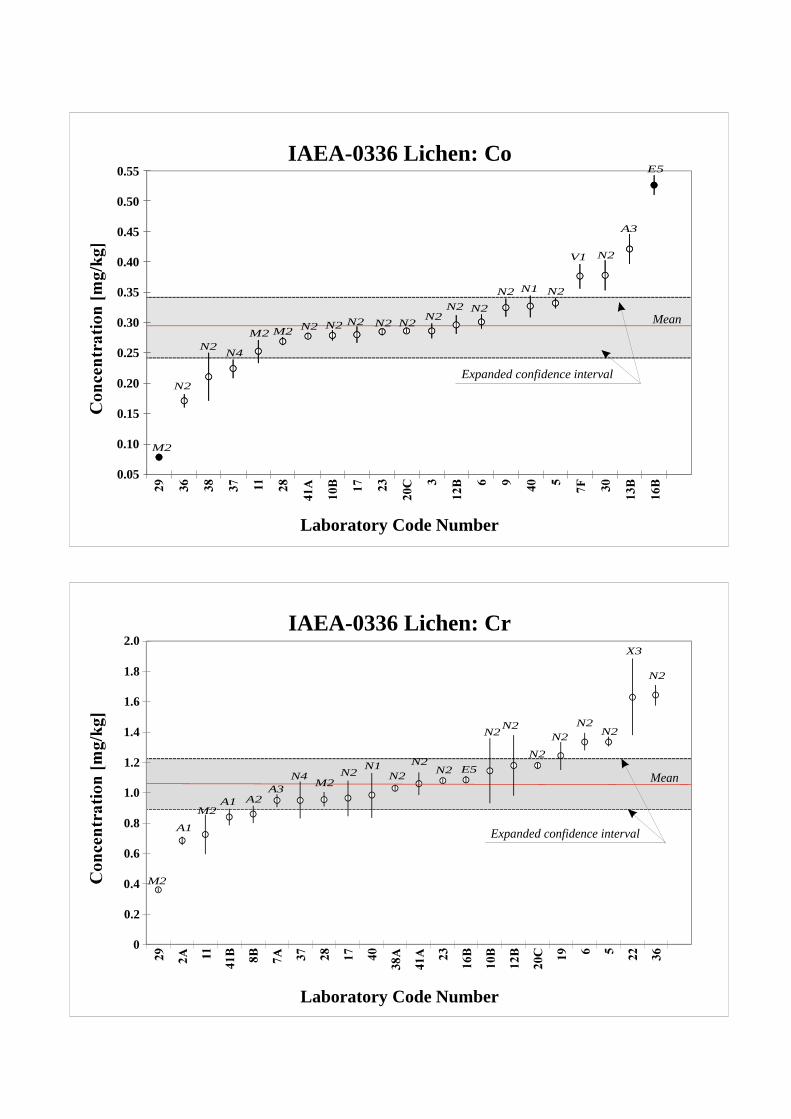
Laboratory Code Number
IAEA-0336 Lichen: Cr2.0
1.8
1.6
1.4
1.2
1.0
0.8
0.6
0.4
0.2
0
Mean
Expanded confidence interval
M2
M2
M2
A1
A1 A2A3
X3
E5N2 N2
N2
N2N2
N2
N2
N2N2
N1N2
N2N4
Laboratory Code Number
IAEA-0336 Lichen: Co0.55
0.50
0.45
0.40
0.35
0.30
0.25
0.20
0.15
0.10
0.05
Mean
Expanded confidence interval
M2
N2M2
N2
N2N4
N2N2
N2 N2
N2 N1 N2
V1 N2
A3
E5
N2N2N2M2
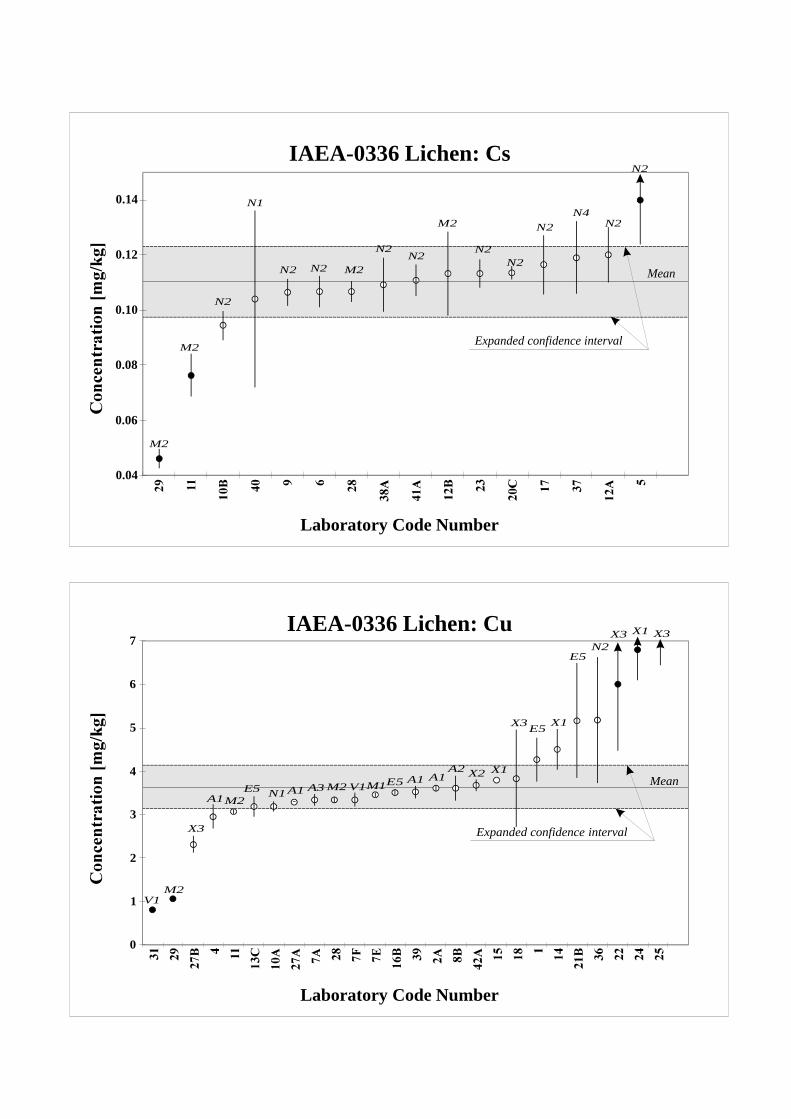
Laboratory Code Number
IAEA-0336 Lichen: Cs
0.14
0.12
0.10
0.08
0.06
0.04
Mean
Expanded confidence interval
M2
M2
M2
M2
N2
N2
N2N4
N2
N2
N2N2
N2N2N2
N1
Laboratory Code Number
IAEA-0336 Lichen: Cu
Mean
Expanded confidence interval
M2
M1M2M2
E5
E5
E5
E5N1
N2
V1
V1
X3
X3
X3X3
A1
A1 A1A2 X2 X1
X1
X1
A1 A3
0
1
2
3
4
5
6
7
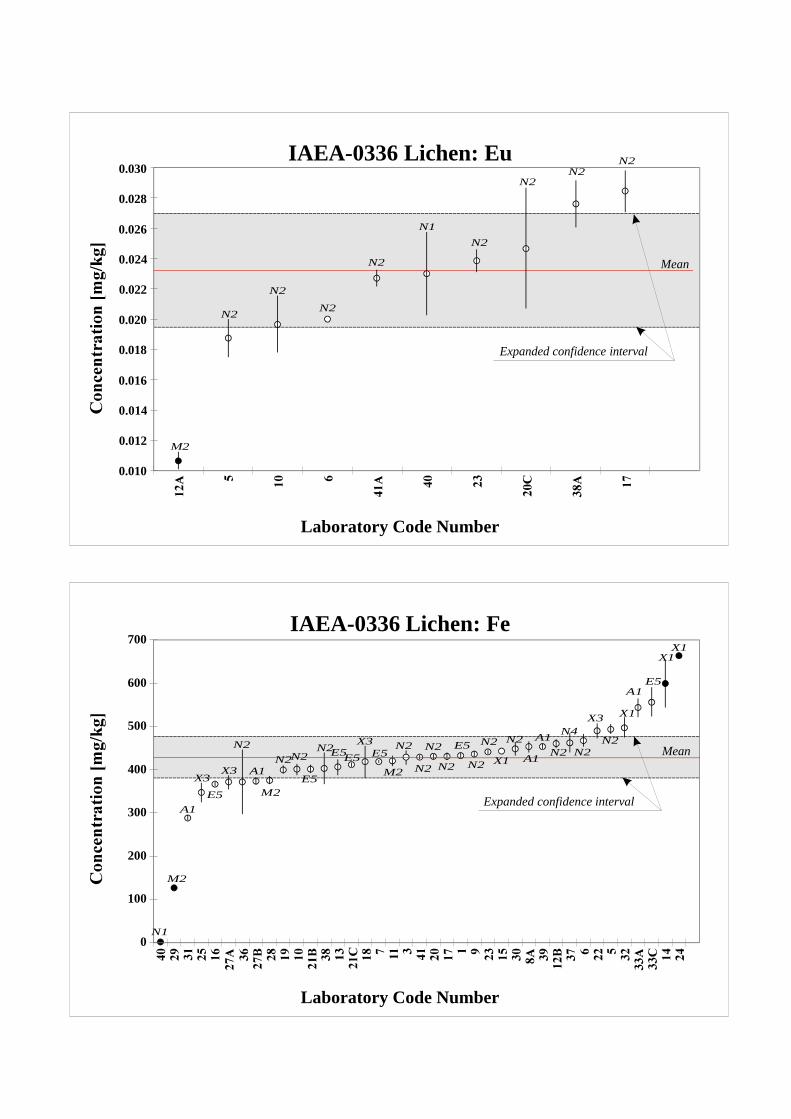
Laboratory Code Number
IAEA-0336 Lichen: Eu0.030
0.028
0.026
0.024
0.022
0.020
0.018
0.016
0.014
0.012
0.010
Mean
Expanded confidence interval
M2
N1
N2
N2
N2
N2
N2N2
N2
N2
Laboratory Code Number
IAEA-0336 Lichen: Fe
0
100
200
300
400
500
600
700
Mean
Expanded confidence interval
M2
M2
M2
E5E5
E5E5
E5
E5
E5
N1
N2N2
N2
N2N2
N2
N2N2
N2N4
N2N2
N2N2
N2
X3
X3X3
X3
X1
X1X1
X1
A1
A1
A1
A1A1
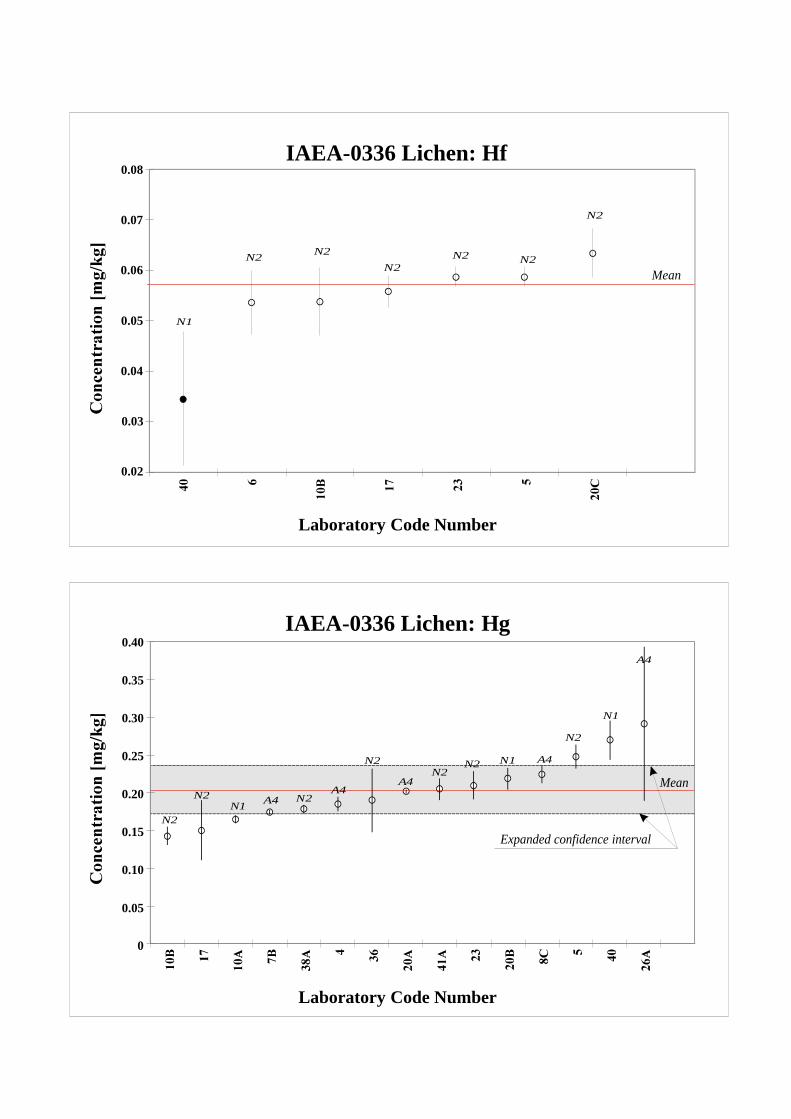
Laboratory Code Number
IAEA-0336 Lichen: Hf0.08
0.07
0.06
0.05
0.04
0.03
0.02
MeanN2
N2N2 N2
N2
N2
N1
Laboratory Code Number
IAEA-0336 Lichen: Hg
0
0.40
0.35
0.30
0.25
0.20
0.15
0.10
0.05
Mean
Expanded confidence intervalN2
N2N1
N1
N1
N2
N2N2
N2
N2
A4
A4
A4
A4
A4

Laboratory Code Number
IAEA-0336 Lichen: K
500
1500
2500
1000
2000
3000
Mean
Expanded confidence interval
E5
N2
N2N2N2
N2N2N5N2N2
N2N2
N2N1
X3
X3
X3
X3
A1A1A1 A1 A1
A1
A1
X1X1
X1
0
0.1
0.2
0.3
0.4
0.5
0.6
0.7
0.8
0.9
Mean
Expanded confidence interval
N2
M2
M2 N2
N2N2
N2
N2N2
N2N2N2
N2
Laboratory Code Number
IAEA-0336 Lichen: La
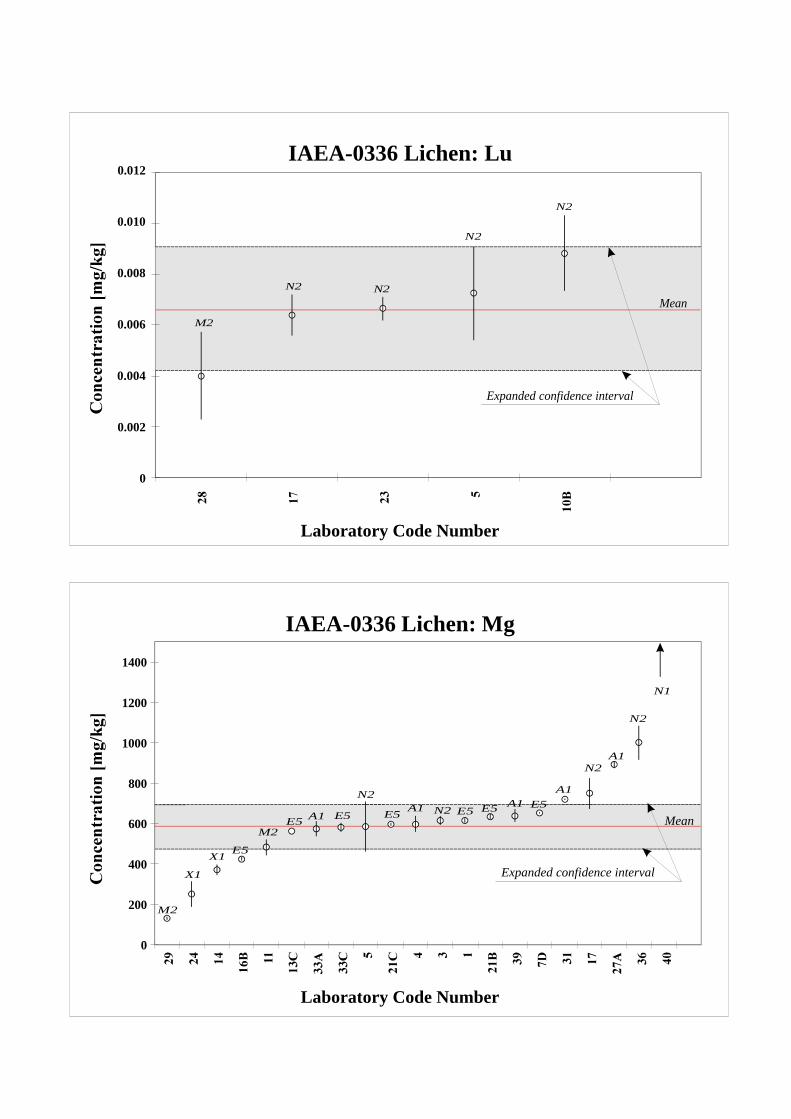
Laboratory Code Number
IAEA-0336 Lichen: Lu
0
0.002
0.004
0.006
0.008
0.010
0.012
Mean
Expanded confidence interval
M2
N2 N2
N2
N2
0
200
400
600
800
1000
1200
1400
Expanded confidence interval
E5
E5 E5E5E5E5E5
M2
M2
N1
N2
N2
N2
N2A1
A1
A1
A1A1
X1
X1
Mean
Laboratory Code Number
IAEA-0336 Lichen: Mg
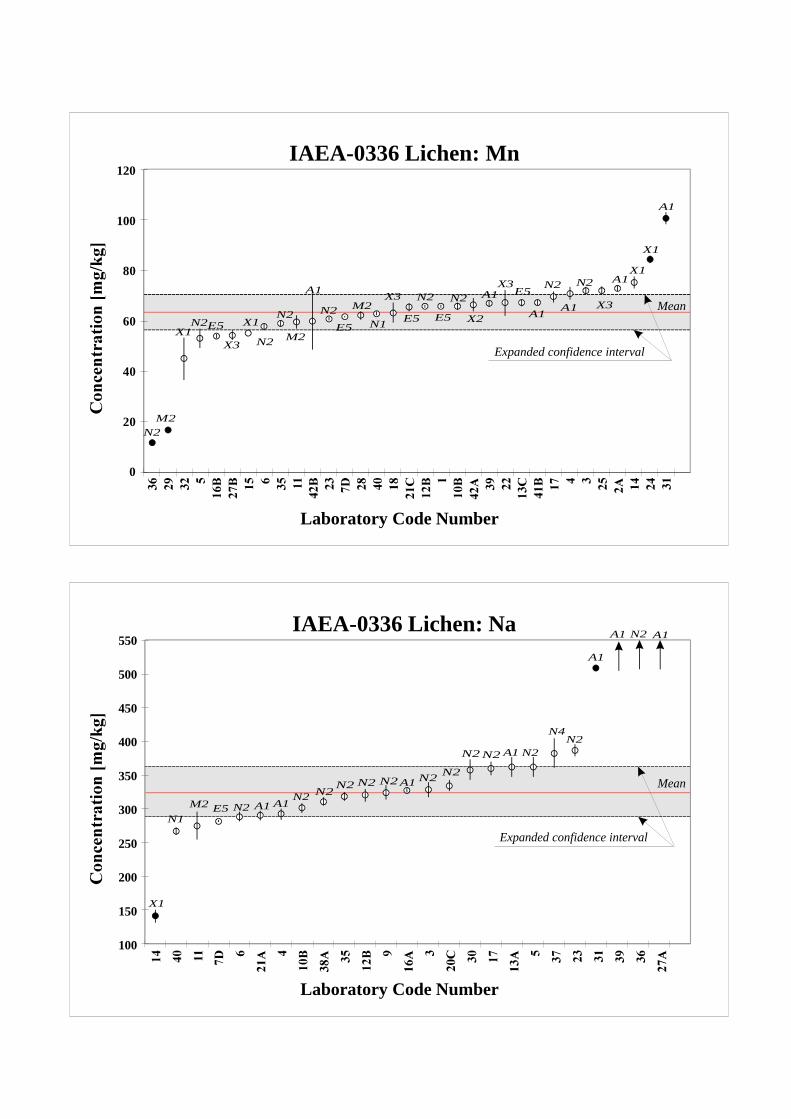
Laboratory Code Number
IAEA-0336 Lichen: Mn
0
20
40
60
80
100
120
Mean
Expanded confidence interval
E5
E5E5 E5
E5N2
N2M2
M2
M2N2
N2 N2
N2 N2
N2N2
N1
X3X3
X3
X3A1 A1
A1A1
A1
A1
X1
X1
X1
X1
X2
Laboratory Code Number
IAEA-0336 Lichen: Na
100
150
200
250
300
350
400
450
500
550
Mean
Expanded confidence interval
E5
N2
N1N2
N2N2 N2 N2 N2 N2
N2 N2
N2
N2
N4N2
M2 A1 A1
A1
A1
A1A1
A1
X1
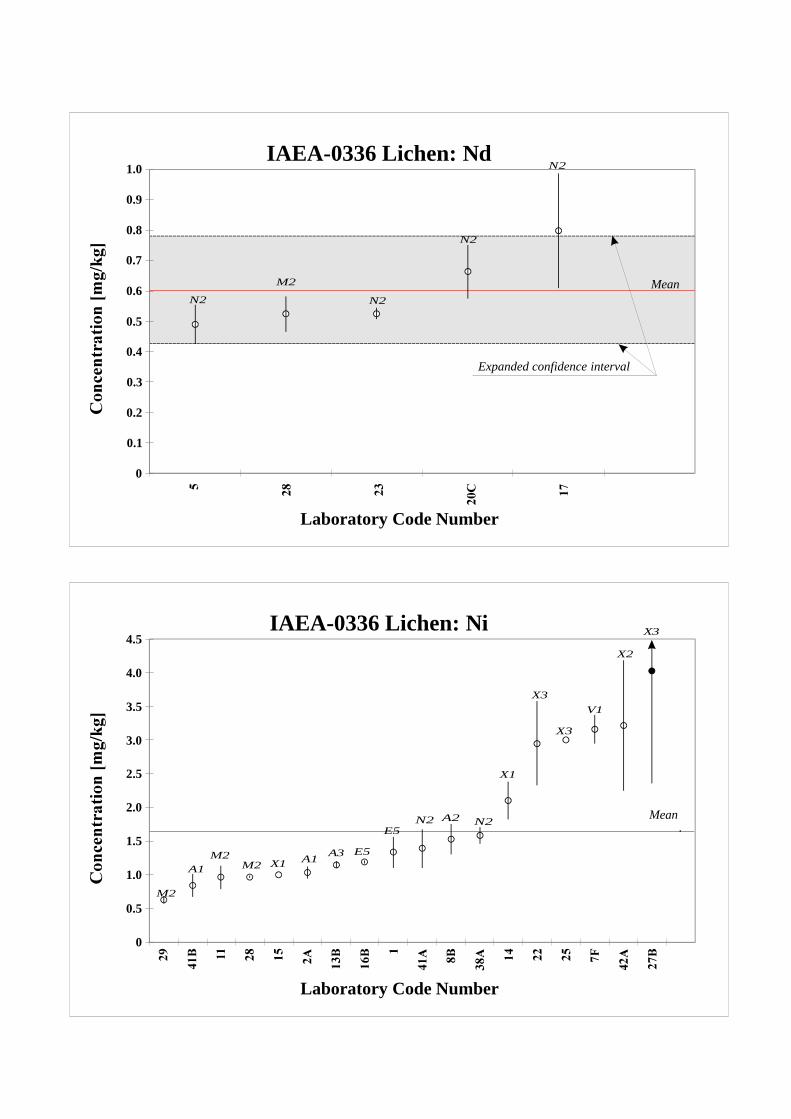
Laboratory Code Number
0
0.1
0.2
0.3
0.4
0.5
0.6
0.7
0.8
0.9
1.0
Mean
Expanded confidence interval
N2 N2
N2
N2
M2
IAEA-0336 Lichen: Nd
Laboratory Code Number
0
0.5
1.0
1.5
2.0
2.5
3.0
3.5
4.0
4.5
Mean
E5
E5
X1
X3
X3
X2
X3
X1
N2 N2A2
M2
M2M2A1
A1 A3
V1
IAEA-0336 Lichen: Ni
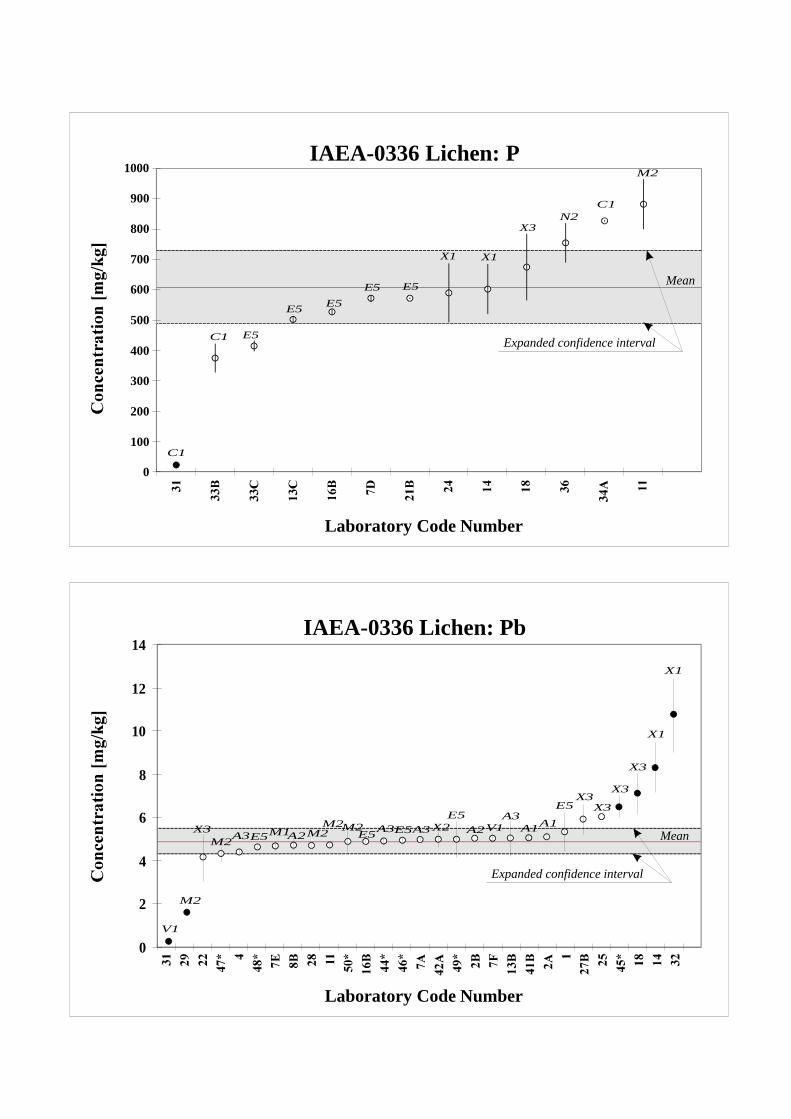
0
100
200
300
400
500
600
700
800
900
1000
Mean
Expanded confidence intervalE5
E5 E5
E5 E5
X3
X1X1
N2
C1
C1
M2
C1
Laboratory Code Number
IAEA-0336 Lichen: P
Laboratory Code Number
IAEA-0336 Lichen: Pb
Mean
Expanded confidence interval
V1
V1
M2
X3M2A3
A3A3
A1A1A3X2
E5 E5 E5E5
E5X3
X3
X3
X3
X1
X1
M1 M2M2M2
A2 A2
0
2
4
6
8
10
12
14
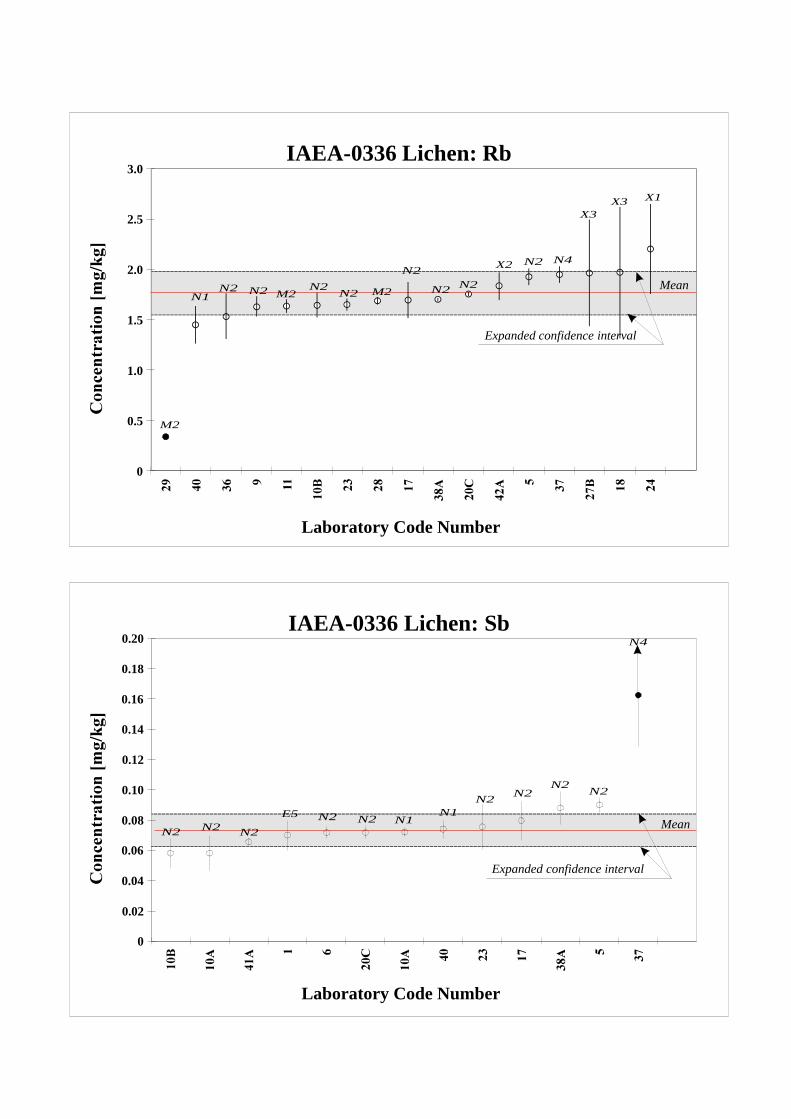
0
0.5
1.0
1.5
2.0
2.5
3.0
Mean
Expanded confidence interval
X3X3
M2
M2 M2
X1
X2
N2 N2 N2N2
N2N2
N2N4N2
N1
Laboratory Code Number
IAEA-0336 Lichen: Rb
Laboratory Code Number
Mean
Expanded confidence interval
E5
N2 N2 N2
N2N2
N2N2
N2N2
N4
N1N1
0
0.02
0.04
0.06
0.08
0.20
0.10
0.12
0.14
0.16
0.18
IAEA-0336 Lichen: Sb
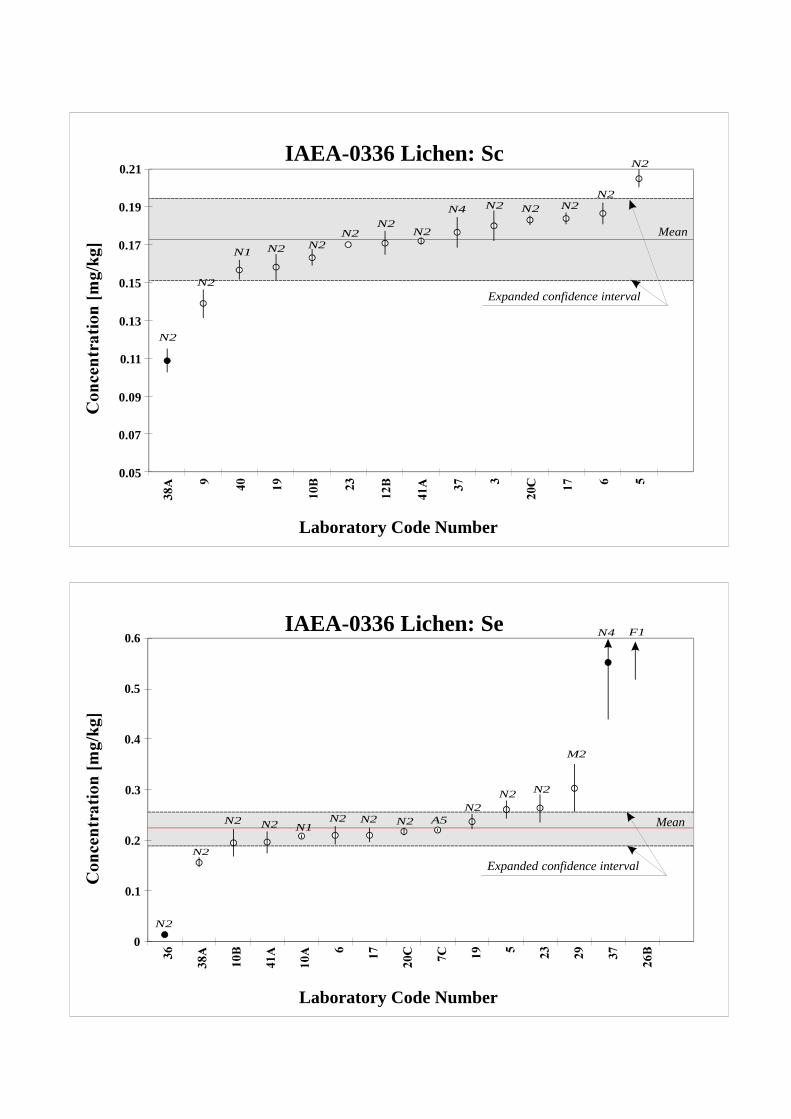
0.05
0.07
0.09
0.11
0.13
0.15
0.17
0.19
0.21
Mean
Expanded confidence interval
N2
N2
N2
N2N2
N2
N4 N2 N2 N2N2
N2
N2N1
Laboratory Code Number
IAEA-0336 Lichen: Sc
0
0.1
0.2
0.3
0.4
0.5
0.6
Mean
Expanded confidence interval
A5
M2
N2
N2 N2 N2N2N2
N2 N2
N2
N2
N4 F1
N1
Laboratory Code Number
IAEA-0336 Lichen: Se
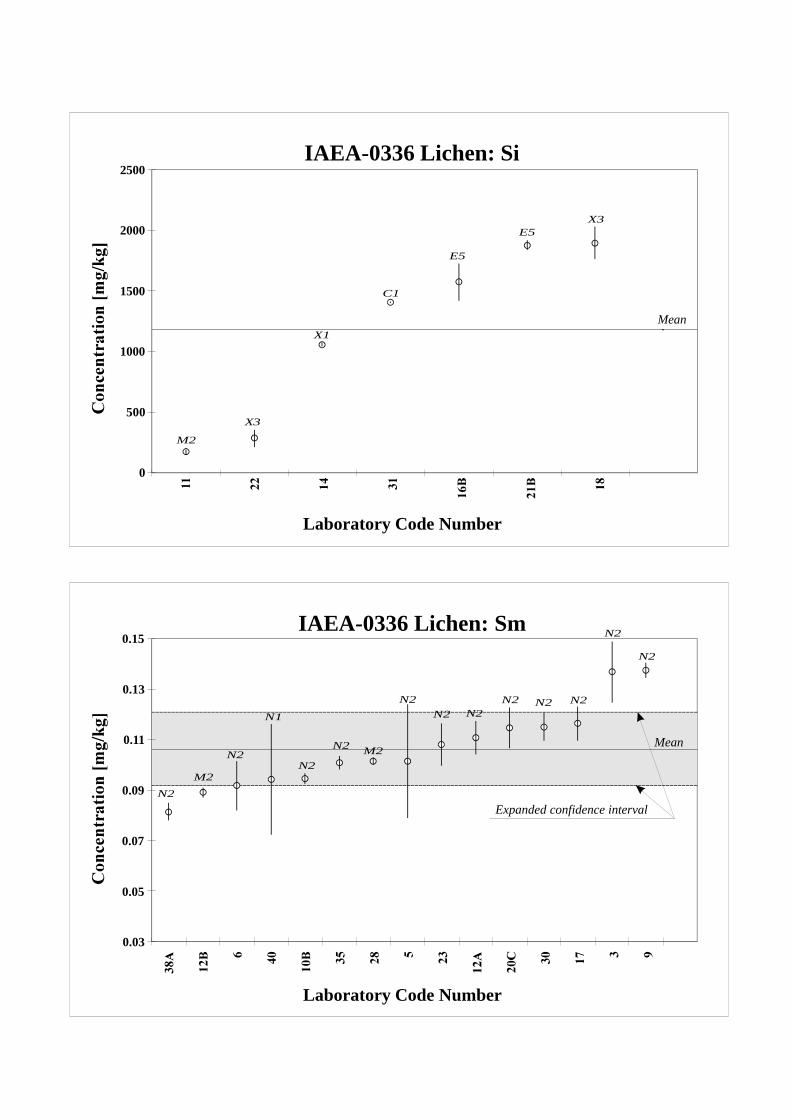
0
500
1000
1500
2000
2500
Mean
M2
E5
E5
X3
X3
X1
C1
Laboratory Code Number
IAEA-0336 Lichen: Si
0.03
0.05
0.07
0.09
0.11
0.13
0.15
Mean
Expanded confidence interval
M2
M2
N2
N2
N1
N2
N2
N2N2 N2
N2 N2
N2
N2
N2
Laboratory Code Number
IAEA-0336 Lichen: Sm
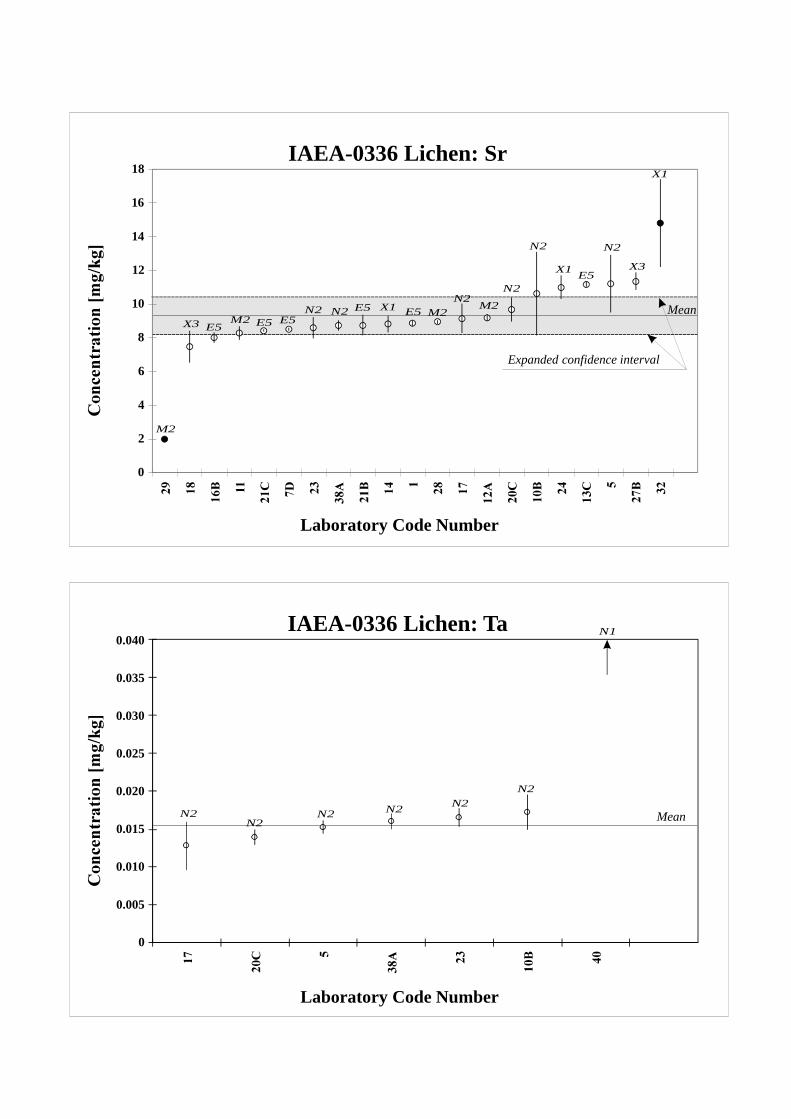
0
2
4
6
8
10
12
14
16
18
Mean
Expanded confidence interval
M2M2
M2
M2
E5 E5 E5E5
E5
E5
X3
X3
X1
X1
X1
N2N2 N2
N2
N2 N2
Laboratory Code Number
IAEA-0336 Lichen: Sr
0
0.005
0.010
0.015
0.020
0.025
0.030
0.035
0.040
Mean
N1
N2N2
N2 N2 N2N2
Laboratory Code Number
IAEA-0336 Lichen: Ta
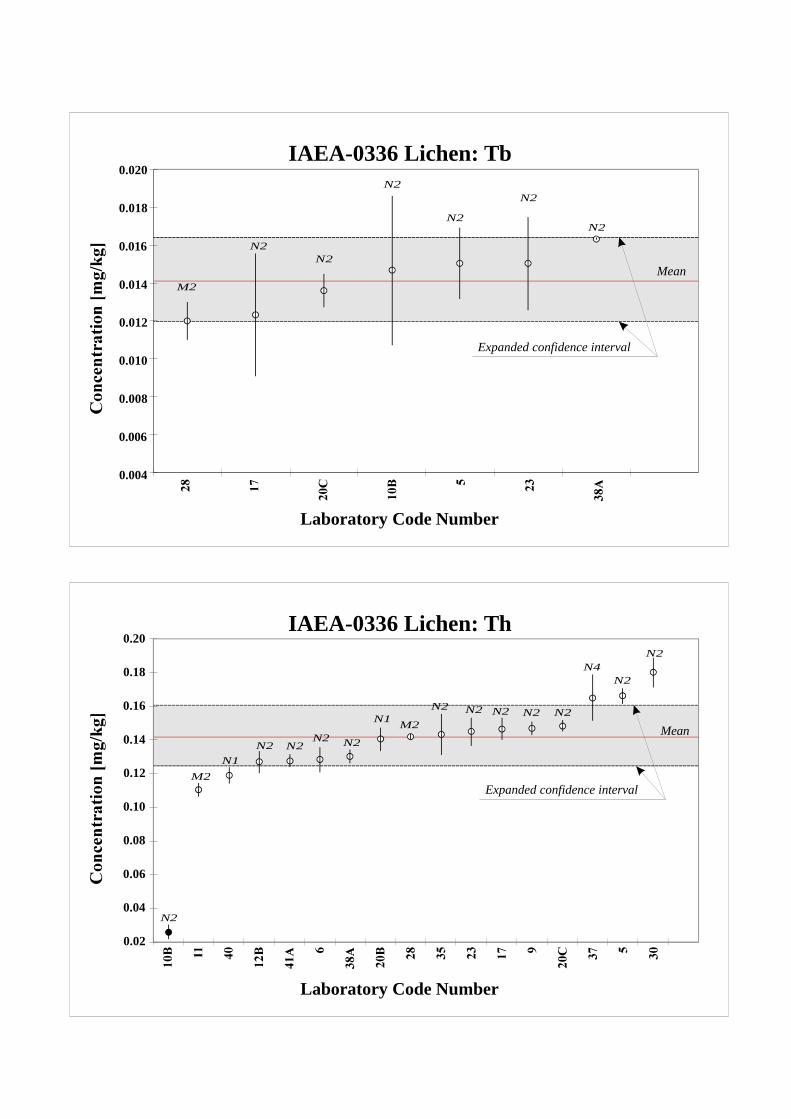
0.004
0.006
0.008
0.010
0.012
0.014
0.016
0.018
0.020
Mean
Expanded confidence interval
M2
N2
N2N2
N2N2
N2
Laboratory Code Number
IAEA-0336 Lichen: Tb
0.02
0.04
0.06
0.08
0.10
0.12
0.14
0.16
0.18
0.20
Mean
Expanded confidence intervalM2
M2
N1
N1
N2
N2
N2N2 N2
N4N2
N2
N2 N2
N2N2N2
Laboratory Code Number
IAEA-0336 Lichen: Th
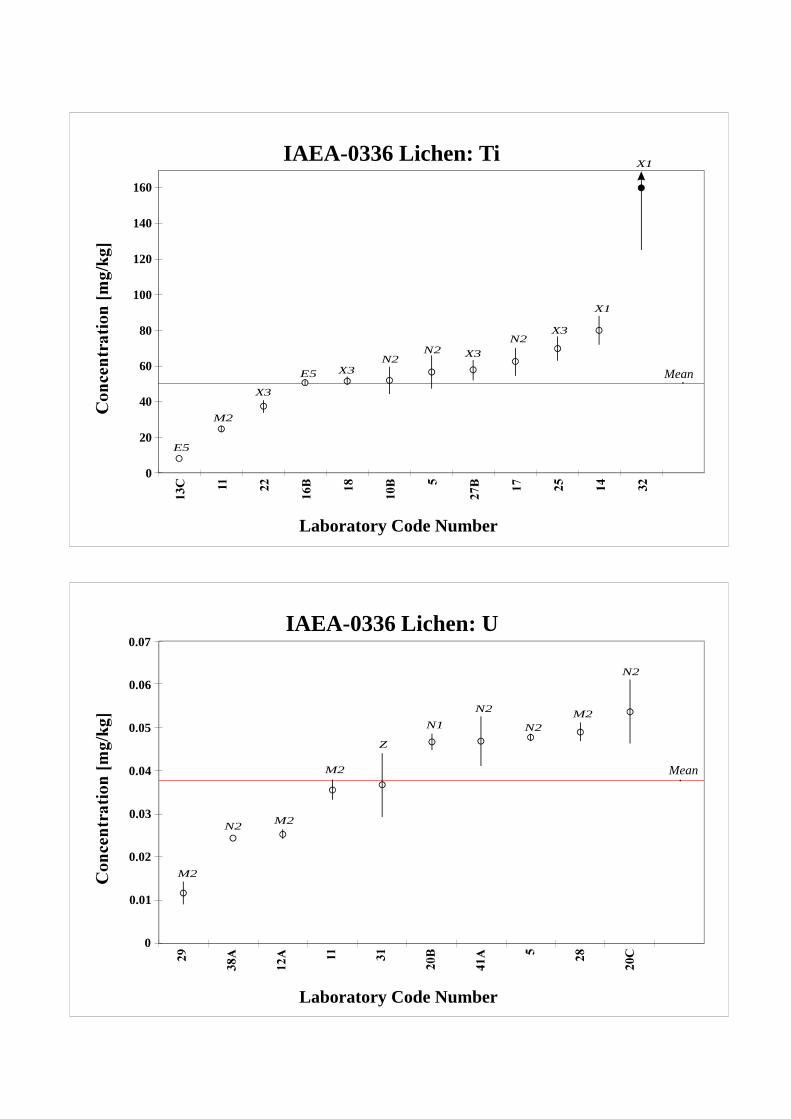
0
20
40
60
80
100
120
140
160
Mean
M2
E5
E5 X3
X3
X3
X3
X1
X1
N2N2
N2
Laboratory Code Number
IAEA-0336 Lichen: Ti
0
0.01
0.02
0.03
0.04
0.05
0.06
0.07
Mean
M2
M2
M2
M2
N2
N2
N2
N2
N1
Z
Laboratory Code Number
IAEA-0336 Lichen: U
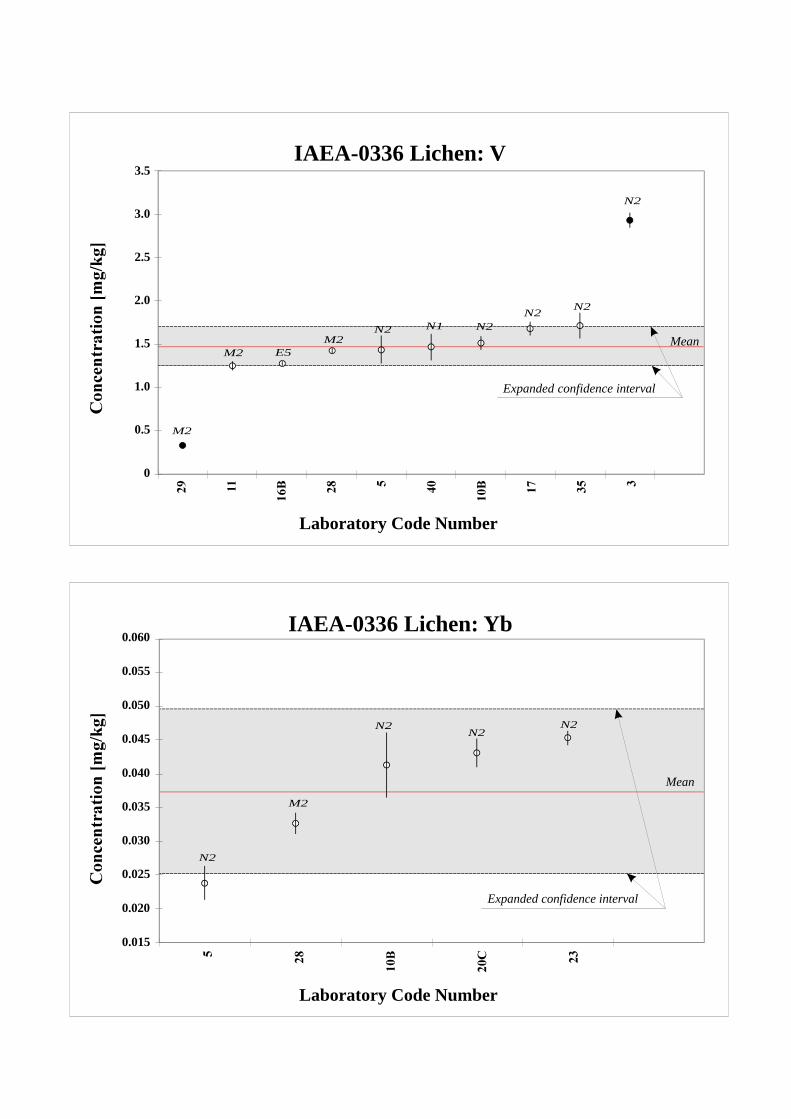
0
0.5
1.0
1.5
2.0
2.5
3.0
3.5
Mean
Expanded confidence interval
M2
M2M2 E5
N2
N2N2
N2
N2N1
Laboratory Code Number
IAEA-0336 Lichen: V
0.015
0.020
0.025
0.030
0.035
0.040
0.045
0.050
0.055
0.060
Mean
Expanded confidence interval
M2
N2N2
N2
N2
Laboratory Code Number
IAEA-0336 Lichen: Yb
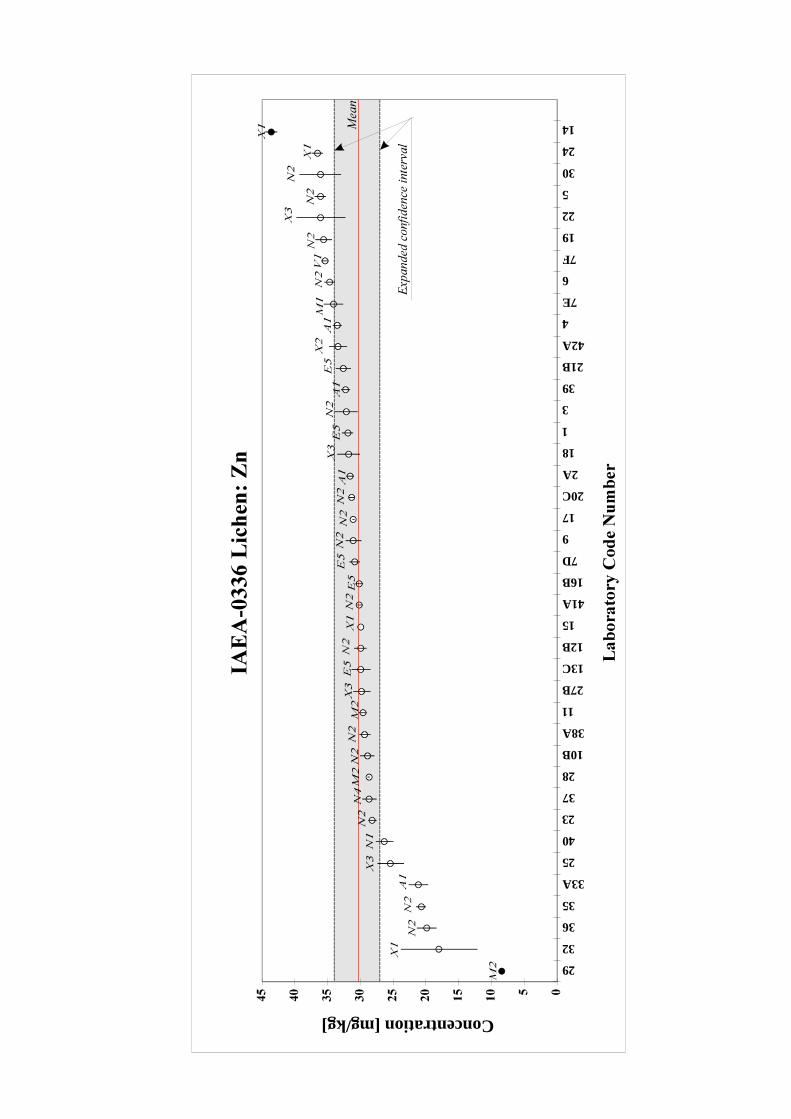
29
32
36
35
33A
25
40
23
37
28
10B
38A
11
27B
13C
12B
15
41A
16B
7D
9
17
20C
2A
18
1
3
39
21B
42A
4
7E
6
7F
19
22
5
30
24
14
Concentration[mg/kg]

APPENDIX IV
LIST OF PARTICIPATING LABORATORIES
Appendix IV Page 1
Dr. M. MakarewiczIAEA-SeibersdorfChemistry UnitP.O. Box 100A-1400 ViennaAUSTRIA
Dr. A. H. KhanDepartment of ChemistryUniversity of DhakaDhaka-1000BANGLADESH
Prof. Alain HerboschUniversite Libre de BruxellesLaboratoires Associés de Géologie, Dept.Sciences de la Terre et de l'Envirom.Avenue F. D. RooseveltCP 160/02,50, 1050 BruxellesBELGIUM
Dr. E. A. N. FernandesUniversidade de Sao PauloCENA-Radioisotopes SectionAvenida Centenario, 303P. 0. Box 9613400 Piracicaba, Sao PauloBRAZIL
Dr. V. ArenasUniversidad de AntofagastaDepartamento de QuimicaCampus ColosoAntofagastaCHILE
Dr. Jan KuceraAcademy of Sciences of the Czech RepublicNuclear Physics Laboratory250 58 Rez near PragueTHE CZECH REPUBLIC
Dr. J. KumpulainenAgricultural Research Centre of FinlandCentral LaboratorySF-31600 JokioinenFINLAND
Dr. Maija LipponenTechnical Research Centre of FinlandReactor LaboratoryP. 0. Box 200, SF-02151 EspooFINLAND
Dr. Pentti Mannien
VTT, Reactor LaboratoryP. 0. Box 200SF-02151 EspooFINLAND
Dr. M. Norbert DeschampsGroupe d'Applications des Méthodes Nucléairesa l'Anthropologie, la Biologie et la Chimie(CEA-CNRS), CE/SaclayF-91191 Gif sur Yvette CedexFRANCE
Dr. KlockenkämperISASPostfach 101352D-44013 DortmundGERMANY
Dr. Manfred KöppeDow Deutschland Inc.Dept- Research and DevelopmentPostfach 1160D-21651 StadeGERMANY
Dr. P. OstapczukResearch Centre JuelichInstitute for Physical ChemistryP. 0. Box 1913D-52405 JuelichGERMANY
Dr. Matthias RossbachForschungszentrum Juelich GmbHIPCPostfach 1913D-552405 JuelichGERMANY
Dr. Fran E. SchnoorNiedersächisches Landesamt fur ÖkologieGöttingerstrasse 14D-30449 HannoverGERMANY
Dr. A. N. GargUniversity of NagpurDepartment of ChemistryNagpur 440 010INDIA
Dr. S. SadasivanBhabha Atomic Research Centre
Appendix IV Page 2
Environmental Assessment DivisionTrombayMumbai 400 085INDIA
Dr. R. SubramanianJawaharlal Nehru UniversitySchool of Environmental SciencesNew Delhi 110067INDIA
Dr. H. GhafourianAtomic Energy Organization of IranFuel DepartmentGamma Irradiation CenterP. 0. Box 11365-8486TeheranIRAN
Dr. N. SaitoJapan Chemical Analysis Centre295-3, Sanno-cho, Inage-ku,Chiba-shi, chiba-ken 263JAPAN
Dr. Kwang Woo LeeKorea Research Institute of Standards andScienceDivision of Analytical ChemistryTaeduk Science TownP. 0. Box 3, Taejon, 305-606KOREA
Dr. Mike CampbellIAEA, Marine Environment Laboratory19, Ave. Des CastellansMC 98000MONACO
Dr. Peter BodeDelft University of TechnologyInterfaculty Reactor InstituteMekelweg 15NL-2629 JB DelftTHE NETHERLANDS
Ing. Syverin LierhagenNorwegian Institute for Nature ResearchTungasletta 2N-7004 TrondheimNORWAY
Dr. Oddvar RoysetNorwegian Institute for Air ResearchP. 0. Box 64, N-2001 LillestromNORWAY
Dr. Din MohammadPakistan Institute of Nuclear Science andTechnologyNuclear Chemistry Division (SRM Labs.)P.0. Box 1356, P.0. Nilore, IslamabadPAKISTAN
Dr. Rosario S. SagumFood and Nutrition Research Inst.Dept. of Science and TechnologyPedro Gil Street, Manila 1000P. 0. Box EA-467, Ermita, ManilaPHILIPPINES
Dr. Rajmund DybczynskiInstitute of Nuclear Chemistry and TechnologyDepartment of Analytical ChemistryUl. Dorodna 16, PL-03-195 WarzawaPOLAND
Dr. Wojciech M. KwiatekInstitute of Nuclear PhysicsDepartment of Nuclear SpectroscopyRadzikowskiego 152PL-31-342 KrakowPOLAND
Dr. Eligiusz Serafin, MSc.University of KódzLaboratory of Biological SciencesUL. Banacha 12/1690-237 KódzPOLAND
Dr. Ma. Fatima AraujoInstituto Tecnologico Nuclear (ITN)Dept. QuimicaEstrada Nacional 102686 Sacavém CodexPORTUGAL
Appendix IV Page 3
Eng. J. Seabra e BarrosInstituto Tecnologico Nuclear (ITN)Azinhaga dos Lameiros aEstrada do Pogo do Lumiar1699 Lisboa CodexPORTUGAL
Dr. Manuela Bordalo CostaInstituto Tecnologico Nuclear (ITN)Azinhaga dos Lameiros aEstrada do Pogo do Lumiar1699 Lisboa CodexPORTUGAL
Dr. Maria do Carmo FreitasInstituto Tecnologico Nuclear (ITN)Estrada Nacional 102686 Sacavém CodexPORTUGAL
Eng. Ma. Angela GouveiaInstituto Tecnologico Nuclear (ITN)Dept. QuimicaEstrada Nacional 102686 Sacavém CodexPORTUGAL
Dr. Miguel ReisInstituto Tecnologico Nuclear (ITN)Dept.- FisicaEstrada Nacional 102686 Sacavém CodexPORTUGAL
Dr. I. I. GeogescuPolytechnical InstituteFaculty of Chemical TechnologySplaiul Independenter, Nr. 313BucharestROMANIA
RN Dr. Ales VránaEcolab ZnojmoDr. Janského 11669 02 ZnojmoSLOVAK REPUBLIC
Dr. B. SmodisInstitute J. StefanDept. of Environmental SciencesLab. for RadiochemistryJamova 39, P. 0. Box 100SI-1000 LjubljanaSLOVENIA
Dr. A. FaanhofAtomic Energy Corporation of South AfricaP.O. Box 582, Pretoria 0001REPUBLIC OF SOUTH AFRICA
Dr. Chien ChungNational Tsing Hua UniversityInst. of Nuclear ScienceHsinchu 30043TAIWAN
Prof. A. A. KistUzbek Academy of SciencesInst. of Nuclear PhysicsTashkent, Ulughbek 702132UZBEKISTAN
Appendix IV Page 4
Laboratories which submitted additional Pb results
Dr. Andrea HanusUmweltbundesamt WienSpittelauerlaende 5A-1090 ViennaAUSTRIA
Dr. Eero KubinFinnish Forest Research InstituteMuhos Research StationKirkkosaarentie 7FIN-91500 MuhosFINLAND
Univ. Prof. Bernd Albert MarkertInternational Graduate School ZittauDept. of High Environmental TechnologyMarkt 23D-02763 ZittauGERMANY
Dr. Jayaraman ArunachalamNational Centre for CompositionalCharacterization of MaterialsDepartment of Atomic EnergyEcil Post Hyderabad 500062INDIA
Dr. Jacob GartyTel Aviv UniversityGeorge S. Wise Faculty of Life SciencesDepartment of Plant Sciences69978 Tel AvivISRAEL
Dr. Eiliv SteinnesNorwegian University of Science and TechnologyDepartment of ChemistryGroup of Environmental ChemistryN-7034 TrondheimNORWAY
Dr. Maria do Carmo Freitas MoreiraInstituto Tecnologico e NuclearDepartamento de QuimicaEstrada Nacional 102685 SacavémPORTUGAL

APPENDIX V
REFERENCE SHEET FOR
IAEA-336 LICHEN
Appendix V Page 1
REFERENCE SHEETREFERENCE MATERIAL
IAEA-336TRACE AND MINOR ELEMENTS IN LICHEN
Date of issue: June 1999Å
Recommended Values(Based on dry weight)
Element Recommended Valuemg/kg
Confidence Interval*mg/kg
N**
As 0.63 0.55 - 0.71 17Ba 6.4 5.3 - 7.5 11Br 12.9 11.2 - 14.6 18Ce 1.28 1.11 - 1.45 13Co 0.29 0.24 - 0.34 19Cs 0.110 0.097 - 0.123 13Cu 3.6 3.1 - 4.1 21Fe 430 380 - 480 35Hg 0.20 0.16 - 0.24 15K 1840 1640 - 2040 24La 0.66 0.56 - 0.76 12Mn 63 56 - 70 29Na 320 280 - 360 20Sb 0.073 0.063 - 0.083 12Se 0.22 0.18 - 0.26 12Sm 0.106 0.092 - 0.120 15Sr 9.3 8.2 - 10.4 19Th 0.14 0.12 - 0.16 16Zn 30.4 27.0 - 33.8 38
* It should be noted that the confidence interval was calculated from the combination of the standard deviation ofthe mean value and an additional 5% to account for any variation due to sample inhomogeneity.
** Number of accepted laboratory means which were used to calculate the recommended values and confidenceintervals.
Å Revision of the original reference sheet dated October 1994
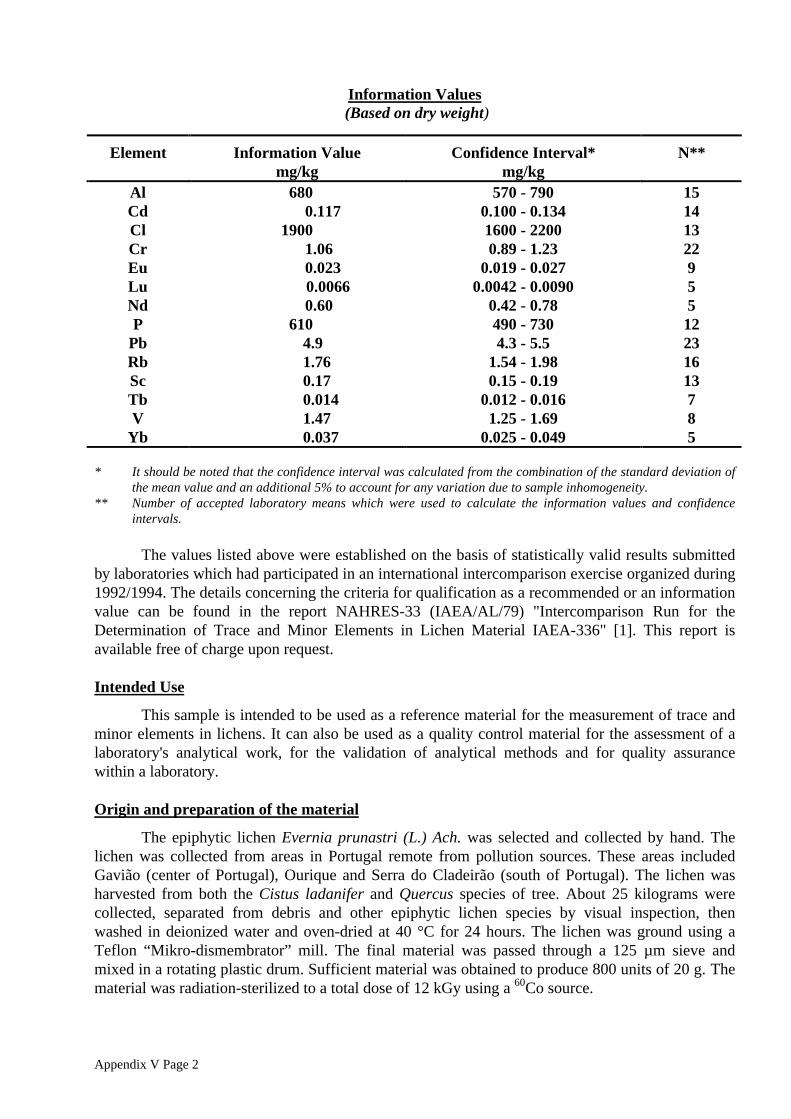
Appendix V Page 2
Information Values (Based on dry weight)
Element Information Valuemg/kg
Confidence Interval*mg/kg
N**
Al 680 570 - 790 15Cd 0.117 0.100 - 0.134 14Cl 1900 1600 - 2200 13Cr 1.06 0.89 - 1.23 22Eu 0.023 0.019 - 0.027 9Lu 0.0066 0.0042 - 0.0090 5Nd 0.60 0.42 - 0.78 5P 610 490 - 730 12
Pb 4.9 4.3 - 5.5 23Rb 1.76 1.54 - 1.98 16Sc 0.17 0.15 - 0.19 13Tb 0.014 0.012 - 0.016 7V 1.47 1.25 - 1.69 8
Yb 0.037 0.025 - 0.049 5
* It should be noted that the confidence interval was calculated from the combination of the standard deviation ofthe mean value and an additional 5% to account for any variation due to sample inhomogeneity.
** Number of accepted laboratory means which were used to calculate the information values and confidenceintervals.
The values listed above were established on the basis of statistically valid results submittedby laboratories which had participated in an international intercomparison exercise organized during1992/1994. The details concerning the criteria for qualification as a recommended or an informationvalue can be found in the report NAHRES-33 (IAEA/AL/79) "Intercomparison Run for theDetermination of Trace and Minor Elements in Lichen Material IAEA-336" [1]. This report isavailable free of charge upon request.
Intended Use
This sample is intended to be used as a reference material for the measurement of trace andminor elements in lichens. It can also be used as a quality control material for the assessment of alaboratory's analytical work, for the validation of analytical methods and for quality assurancewithin a laboratory.
Origin and preparation of the material
The epiphytic lichen Evernia prunastri (L.) Ach. was selected and collected by hand. Thelichen was collected from areas in Portugal remote from pollution sources. These areas includedGavião (center of Portugal), Ourique and Serra do Cladeirão (south of Portugal). The lichen washarvested from both the Cistus ladanifer and Quercus species of tree. About 25 kilograms werecollected, separated from debris and other epiphytic lichen species by visual inspection, thenwashed in deionized water and oven-dried at 40 °C for 24 hours. The lichen was ground using aTeflon “Mikro-dismembrator” mill. The final material was passed through a 125 µm sieve andmixed in a rotating plastic drum. Sufficient material was obtained to produce 800 units of 20 g. Thematerial was radiation-sterilized to a total dose of 12 kGy using a 60Co source.
Appendix V Page 3
Homogeneity
Homogeneity tests were performed on two 100 mg sub-samples taken from each of 20bottles. The homogeneity was evaluated based on the variation in the concentration of the elementsAs, Br, Fe, K, La, Mn, and Sm which were determined by instrumental neutron activation analysisusing the k0 method [2]. The results of a one way ANOVA test showed no significant differencebetween the within-bottle variance and the between-bottle variance. The relative standard deviationof these results varied from 3 to 11 %. Taking into account the measurement uncertainty, therelative uncertainty due to inhomogeneity was estimated to be between 3 and 6%. Additionalmeasurements for Br, Ca, Fe, Sr, and Zn using X-ray fluorescence [3] supported these results. Forthese latter measurements the additional uncertainty due to inhomogeneity was estimated to bebetween 1 and 5 %. Although the degree of inhomogeneity was not the same for all the elements, anadditional component of uncertainty (5%) was added in quadrature to expand the confidenceinterval of each analyte. The final confidence interval includes this additional uncertainty.
Dry weight determination
All recommended and information values are expressed on a dry weight basis. Therefore thedry weight must be determined at the time of analysis, using separate sub-samples of 500 mg driedto constant weight in a drying oven set to 100 °C. Subsequent weighings should differ by less than5 mg
Instructions for use
The recommended minimum sample size for analysis is 100 mg. Analysts are reminded totake appropriate precautions in order to avoid contaminating the remaining material in the bottle. Itis recommended that the material be stored in a dark place, below 20°C (refrigeration is advised).
Legal disclaimer
The IAEA makes no warranties, expressed or implied, with respect to the data contained inthis reference sheet and shall not be liable for any damage that may result from the use of such data.
Appendix V Page 4
References
[1] HELLER-ZEISLER, S. F., ZEISLER, R., ZEILLER, PARR, R. M, E., RADECKI, Z.,BURNS, K. I., DE REGGE, P., Intercomparison run for the determination of trace and minorelements in lichen material IAEA-336, NAHRES-33, (IAEA/AL/79), IAEA, Vienna,June 1999.
[2] FREITAS, M. C., CATARINO, F. M., BRANQUINHO, C., MAGUAS, C., Preparation of alichen reference material, J. Radioanal. Nucl. Chem. 169 (1993) 47-55.
[3] STONE, S. F., FREITAS, M. C., PARR, R. M., ZEISLER, R., Elemental characterization of acandidate lichen research material-IAEA-336, Fresenius J. Anal. Chem. 352 (1995) 227-231.
Issued byAnalytical Quality Control Services (AQCS)
Agency‘s Laboratories, SeibersdorfInternational Atomic Energy Agency
P.O. Box 100A-1400 Vienna, Austria
in co-operation with
Section of Nutritional and Health-Related Environmental Studies (NAHRES)Department of Nuclear Sciences & Applications
International Atomic Energy Agency
Prepared by
S. F. Heller-Zeisler, R. Zeisler, E. Zeiller, R. M. Parr,Z. Radecki, K. I. Burns, P. De Regge