Embed Size (px)
Citation preview

IBHE Presentation 1
Proposed Four-Year UniversityPerformance Funding Model
Performance Funding Steering Committee Meeting
October 24, 2011
Dr. Alan Phillips

Objective
• To propose a performance funding model for public universities that is…
– Linked directly to the Goals of the Illinois Public Agenda and the principles of Public Act 97-320
– Equipped to recognize and account for each university’s mission and set of circumstances
– Adjustable to account for changes in policy and priorities
– Not prescriptive in how to achieve excellence and success
2IBHE Presentation
Illinois Public Agenda Goals
1. Increase Educational Attainment.
2. Ensure college affordability for students, families, and taxpayers.
3. Increase the number of high-quality post-secondary credentials.
4. Better integrate Illinois’ education, research, and innovation assets to meet economic needs of the state.
IBHE Presentation 3

Public Act 97-320 (HB 1503) Performance metrics shall be developed in accordance with the following principles:
IBHE Presentation 4

Performance Funding Model
• Step 1 – Identify the performance measures or metrics that support the achievement of the state goals.
IBHE Presentation 5
For Example: Completions Measure Number of Bachelor’s Degrees, 3-Year Average
Notes: Using an average will help to adjust for the normal highs and lows experienced by an institution.
All measures and results are counts, rather than rates.

Performance Funding Model
• Step 2 – Collect the data on the selected performance measures
IBHE Presentation 6
University A has a 3-year average of 1,000 bachelor’s degrees awarded.
Source: IPEDS data.

Performance Funding Model
• Step 3 – Award an additional premium (i.e. 40%) for the production of certain desired outcomes such as completions by underserved or underrepresented populations
IBHE Presentation 7
1,000 3-year average for the Institution
Sub-populationsBlack, non-Hispanic 50 A subset of the 3-year averageHispanic 50 A subset of the 3-year average
Total 100
Premium Percentage 40% Premium percentage should reflect Illinois goals
Additional Value 40 Total x Premium Percentage
Data + Premium 1,040 Number of degrees after adjusting for sub-population premiums.
Performance Funding Model
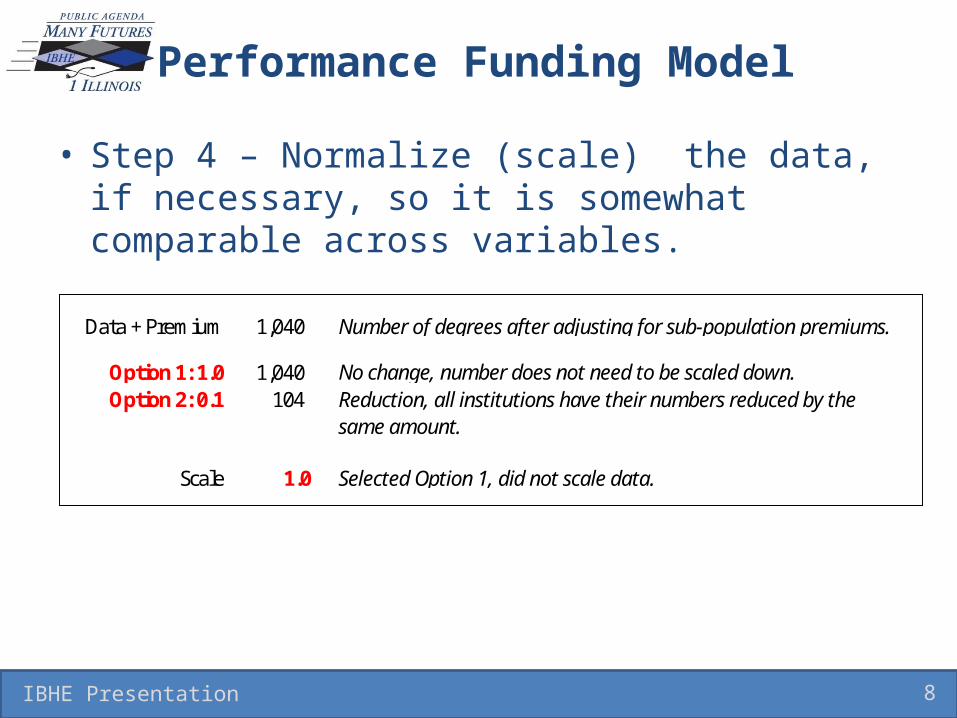
• Step 4 – Normalize (scale) the data, if necessary, so it is somewhat comparable across variables.
IBHE Presentation 8
Data + Premium 1,040 Number of degrees after adjusting for sub-population premiums.
Option 1: 1.0 1,040 No change, number does not need to be scaled down.Option 2: 0.1 104 Reduction, all institutions have their numbers reduced by the
same amount.
Scale 1.0 Selected Option 1, did not scale data.

Performance Funding Model
• Step 5 – Weight each of the Performance Measures that reflects the priority of the Measure and the mission of the institution.
IBHE Presentation 9
University A University B University CBachelor's Degrees, 3-Year Average 15% 25% 20%Performance Measure #2 15% 30% 20%Performance Measure #3 15% 30% 25%Performance Measure #4 20% 10% 15%Performance Measure #5 20% 0% 10%Performance Measure #6 15% 5% 10%
100% 100% 100%
Performance Funding Model
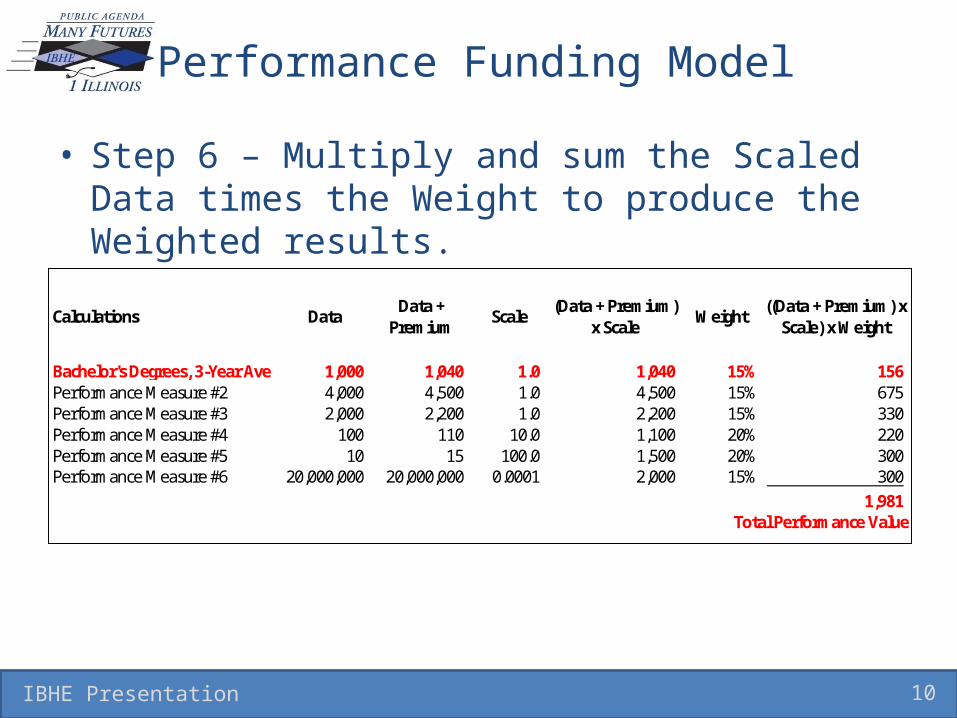
• Step 6 – Multiply and sum the Scaled Data times the Weight to produce the Weighted results.
IBHE Presentation 10
Calculations DataData +
PremiumScale
(Data + Premium) x Scale
Weight((Data + Premium) x
Scale) x Weight
Bachelor's Degrees, 3-Year Ave 1,000 1,040 1.0 1,040 15% 156 Performance Measure #2 4,000 4,500 1.0 4,500 15% 675 Performance Measure #3 2,000 2,200 1.0 2,200 15% 330 Performance Measure #4 100 110 10.0 1,100 20% 220 Performance Measure #5 10 15 100.0 1,500 20% 300 Performance Measure #6 20,000,000 20,000,000 0.0001 2,000 15% 300
1,981 Total Performance Value
Performance Funding Model
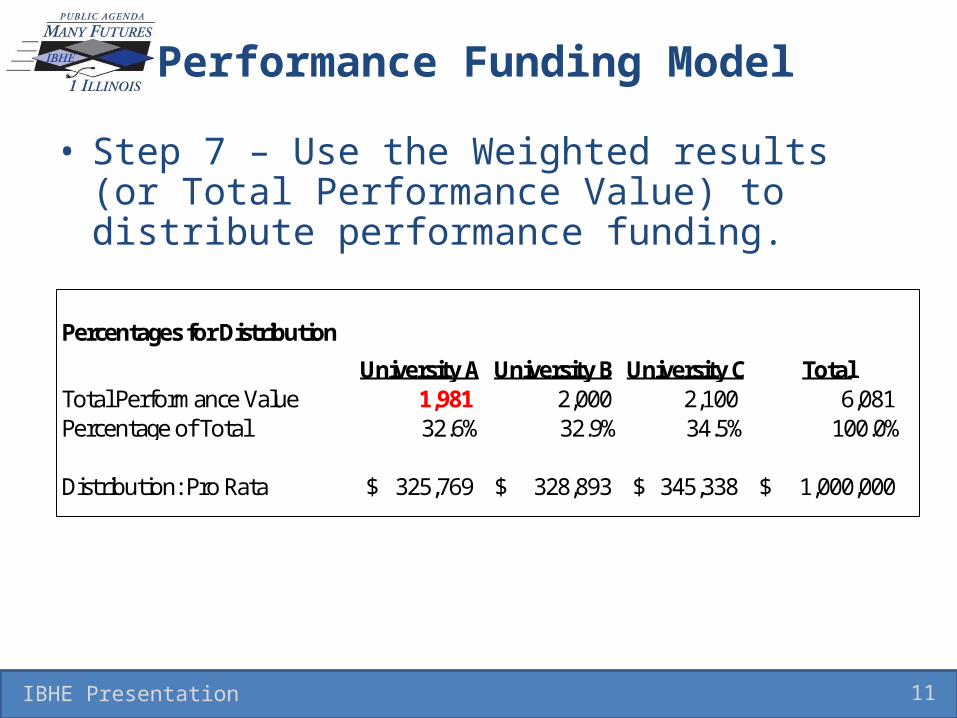
• Step 7 – Use the Weighted results (or Total Performance Value) to distribute performance funding.
IBHE Presentation 11
Percentages for Distribution
University A University B University C TotalTotal Performance Value 1,981 2,000 2,100 6,081 Percentage of Total 32.6% 32.9% 34.5% 100.0%
Distribution: Pro Rata 325,769$ 328,893$ 345,338$ 1,000,000$

Performance Funding Model
• All steps are identical at each university• Accounts for each institution’s unique mission by
adding a weight to each measure• Each institution’s formula calculation is independent• Funding allocation is competitive• Distribution of performance funding is on a pro-rata
share of each institution’s formula calculation• Performance funding appropriations will have to be
earned anew each year
IBHE Presentation 12
Conclusion on Proposed Model
• Linked to Goals of the Illinois Public Agenda and the principles of Public Act 97-320
• Equipped to recognize and account for each university’s mission and set of circumstances
• Adjustable to account for changes in policy and priorities
• Not prescriptive in how to achieve excellence and success
13IBHE Presentation

Questions/Comments?Questions/Comments?
IBHE Presentation 14

Proposed Performance Measures• Retention, Enroll in 2nd Year
– Low Income, received Pell Grant– Age 25 and Over & Directly from high school– Transfer students
• Bachelor’s Degrees, 3-year Average– Black, non-Hispanic– Hispanic
• Bachelor’s within 150% of Time (six years)– Transfer students
• Master’s Degrees, STEM & health programs– Black, non-Hispanic and Hispanic
• Doctor’s Degrees, STEM & health programs– Black, non-Hispanic and Hispanic
• Research Expenditures
15IBHE Presentation