Embed Size (px)
Citation preview
ICD Tutorial
TRACE32 Online Help
TRACE32 Directory
TRACE32 Index
TRACE32 Debugger Getting Started ..............................................................................................
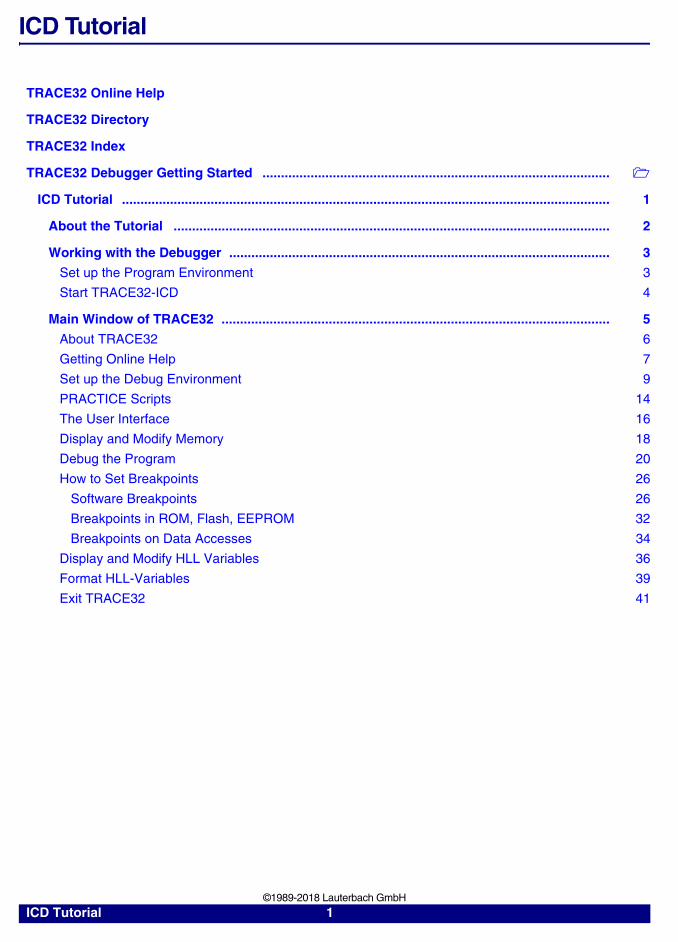
ICD Tutorial .................................................................................................................................... 1
About the Tutorial ...................................................................................................................... 2
Working with the Debugger ....................................................................................................... 3
Set up the Program Environment 3
Start TRACE32-ICD 4
Main Window of TRACE32 ......................................................................................................... 5
About TRACE32 6
Getting Online Help 7
Set up the Debug Environment 9
PRACTICE Scripts 14
The User Interface 16
Display and Modify Memory 18
Debug the Program 20
How to Set Breakpoints 26
Software Breakpoints 26
Breakpoints in ROM, Flash, EEPROM 32
Breakpoints on Data Accesses 34
Display and Modify HLL Variables 36
Format HLL-Variables 39
Exit TRACE32 41
ICD Tutorial 1 ©1989-2018 Lauterbach GmbH
ICD Tutorial
Version 16-Nov-2018
About the Tutorial
What is it about?
This is a tutorial for all In-Circuit Debuggers (TRACE32-ICD) that are implemented using an on-chip debug interface. Typical examples for on-chip debug interfaces are BDM, JTAG, or ONCE.
Preconditions:
The tutorial assumes that the TRACE32 debugger software is already installed. Also a basic knowledge of software debugging and the C-programming language is helpful. This is required in order to be able to follow the example code found in this tutorial. In addition working with the Windows operating system is assumed as known. Also a basic knowledge of the target processor and used assembler/compiler is necessary to get your debug system running.
Purpose of this tutorial:
The purpose of this tutorial is to do the basic steps in setting up the debug environment. This means we will configured the TRACE32 for the host computer, start the debugger, write PRACTICE scripts (*.cmm) to automate the start-up and to make you familiar with the main features of the In-Circuit Debugger.
How to use this tutorial:
The tutorial contains a guided debug session. It uses a simple C-program example to show you the most important debug features. You should perform a number of exercises as you read this tutorial. We recommend to go completely through all chapters, since besides the tour (written in normal text format) there are very helpful remarks (written in italics) which will not be repeated in other chapters.
Where can I get more information:
The common TRACE32 user interface contains a detailed online help that offers the most current description of all debug features. Refer to the “Online Help” on how to start the online help system.
How long does it take?
60 minutes
ICD Tutorial 2 ©1989-2018 Lauterbach GmbH
Working with the Debugger
Set up the Program Environment
After installing the TRACE32 on your host PC in accordance to Quick Installation for TRACE32-ICD you will the get the system files of TRACE32 (the program executables) in the TRACE32 system directory. You will also find entries in the Windows Start program list. The installation set up a default working environment for TRACE32. This configuration should be adapted to your debugging environment on your host PC. NOTE: The abbreviation PC in the context of TRACE32 is mostly used for Program Counter; therefore we will use the term host rather than PC for the debugging device which runs the debugger-GUI.
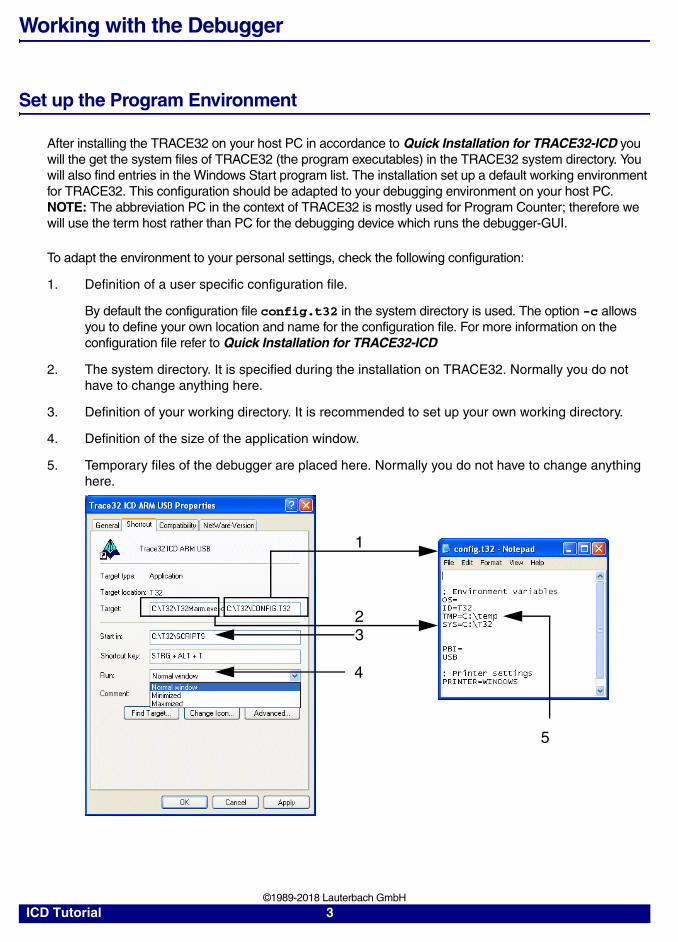
To adapt the environment to your personal settings, check the following configuration:
1. Definition of a user specific configuration file.
By default the configuration file config.t32 in the system directory is used. The option -c allows you to define your own location and name for the configuration file. For more information on the configuration file refer to Quick Installation for TRACE32-ICD
2. The system directory. It is specified during the installation on TRACE32. Normally you do not have to change anything here.
3. Definition of your working directory. It is recommended to set up your own working directory.
4. Definition of the size of the application window.
5. Temporary files of the debugger are placed here. Normally you do not have to change anything here.
1
2
4
3
5
ICD Tutorial 3 ©1989-2018 Lauterbach GmbH
Start TRACE32-ICD
Next power up your debug system first and then the target.
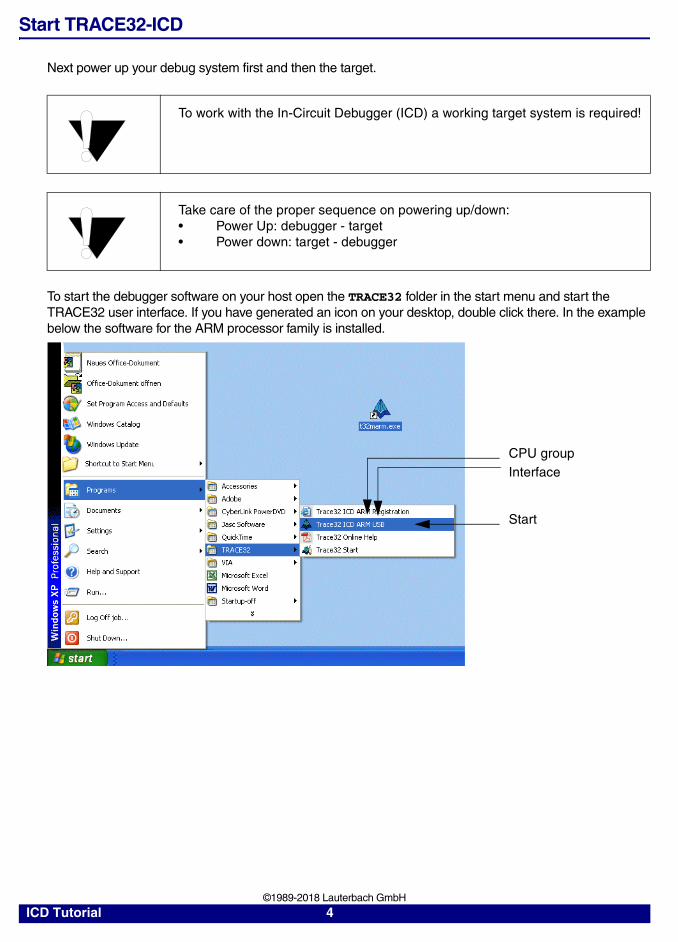
To start the debugger software on your host open the TRACE32 folder in the start menu and start the TRACE32 user interface. If you have generated an icon on your desktop, double click there. In the example below the software for the ARM processor family is installed.
To work with the In-Circuit Debugger (ICD) a working target system is required!
Take care of the proper sequence on powering up/down:• Power Up: debugger - target• Power down: target - debugger
CPU groupInterface
Start
ICD Tutorial 4 ©1989-2018 Lauterbach GmbH
Main Window of TRACE32
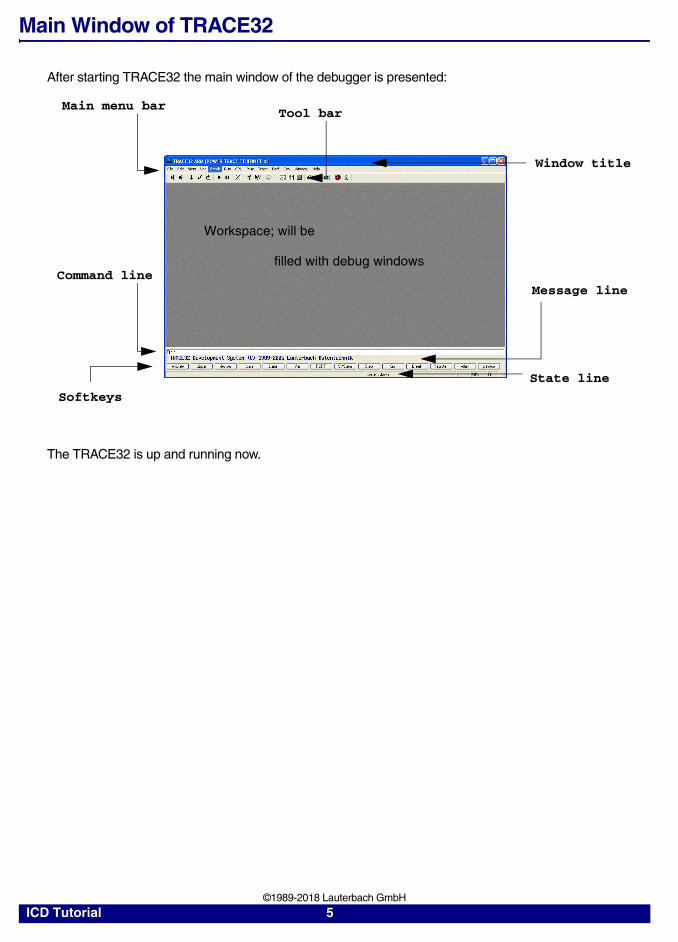
After starting TRACE32 the main window of the debugger is presented:
The TRACE32 is up and running now.
Workspace; will be
filled with debug windows
Main menu bar
Window title
Softkeys
Tool bar
Message lineCommand line
State line
ICD Tutorial 5 ©1989-2018 Lauterbach GmbH

About TRACE32
The About TRACE32… command in the Help menu provides version information for all parts of TRACE32-ICD.
Pushing the buttons “Hardware” or “Software” at the bottom of the window will display further information about the installed debugging hardware and software and should be known, if support is needed. You will also see, the program environment as set up in accordance with Set up the Program Environment.
Serial number and CPU group
SYStem directory
Software build
TMP directory
ICD Tutorial 6 ©1989-2018 Lauterbach GmbH
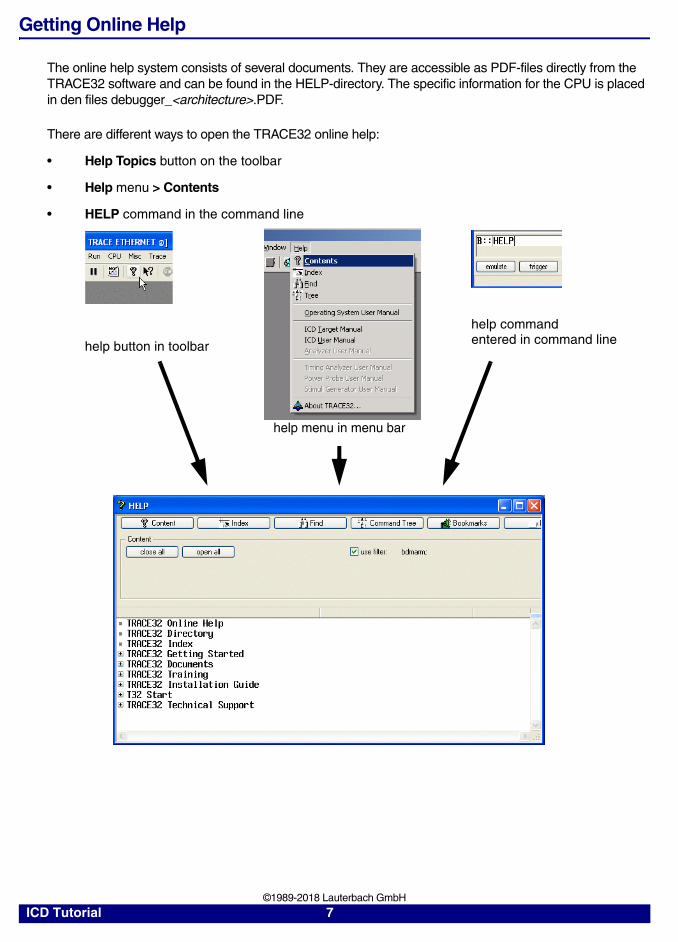
Getting Online Help
The online help system consists of several documents. They are accessible as PDF-files directly from the TRACE32 software and can be found in the HELP-directory. The specific information for the CPU is placed in den files debugger_<architecture>.PDF.
There are different ways to open the TRACE32 online help:
• Help Topics button on the toolbar
• Help menu > Contents
• HELP command in the command line
help button in toolbar
help command
help menu in menu bar
entered in command line
ICD Tutorial 7 ©1989-2018 Lauterbach GmbH
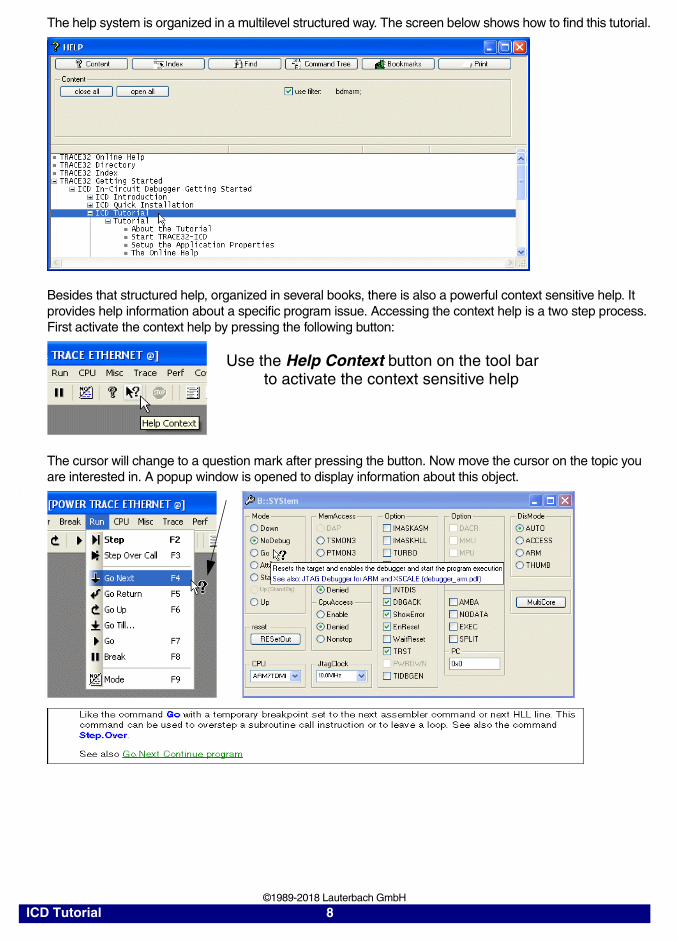
The help system is organized in a multilevel structured way. The screen below shows how to find this tutorial.
Besides that structured help, organized in several books, there is also a powerful context sensitive help. It provides help information about a specific program issue. Accessing the context help is a two step process. First activate the context help by pressing the following button:
The cursor will change to a question mark after pressing the button. Now move the cursor on the topic you are interested in. A popup window is opened to display information about this object.
.
Use the Help Context button on the tool bar to activate the context sensitive help
ICD Tutorial 8 ©1989-2018 Lauterbach GmbH
Set up the Debug Environment
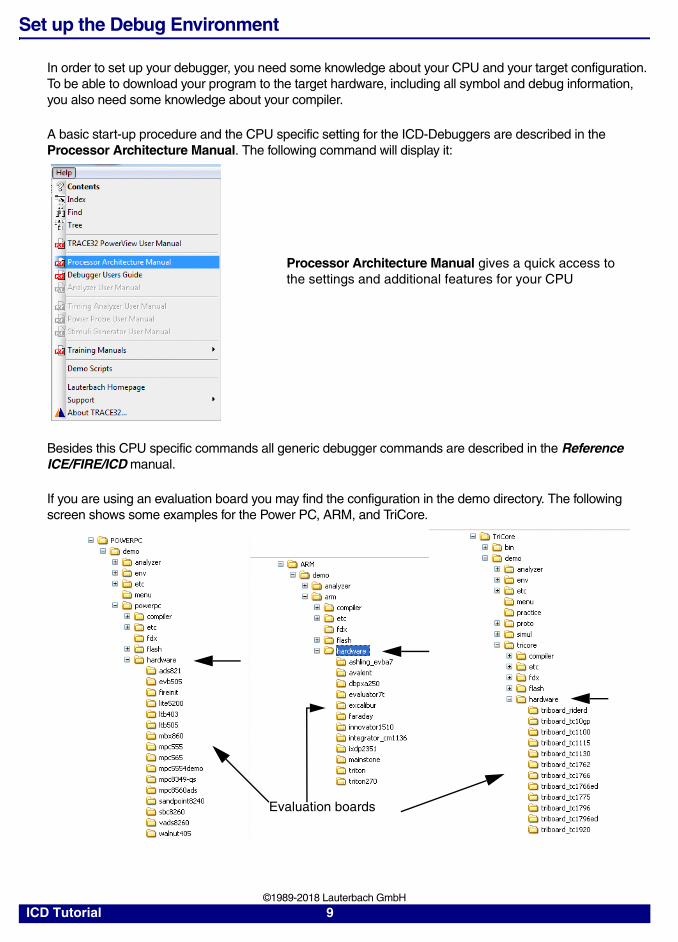
In order to set up your debugger, you need some knowledge about your CPU and your target configuration. To be able to download your program to the target hardware, including all symbol and debug information, you also need some knowledge about your compiler.
A basic start-up procedure and the CPU specific setting for the ICD-Debuggers are described in the Processor Architecture Manual. The following command will display it:
Besides this CPU specific commands all generic debugger commands are described in the Reference ICE/FIRE/ICD manual.
If you are using an evaluation board you may find the configuration in the demo directory. The following screen shows some examples for the Power PC, ARM, and TriCore.
Processor Architecture Manual gives a quick access to the settings and additional features for your CPU
Evaluation boards
ICD Tutorial 9 ©1989-2018 Lauterbach GmbH

The next steps will describe a typical start-up procedure for the debugger. To demonstrate the steps needed, we will do a manual setup. Later on we will show a much faster way and use PRACTICE scripts (*.cmm) instead. The SYStem Window provides all CPU specific settings. Use one of the following ways to open the System Settings dialog:
CPUs are grouped (e.g. ARM, TriCore or Power PC).The SYStem window will show all parameters which are specific for the CPU group given. It will have different parameters for different CPU‘s. Below you will see the SYSTem window for the ARM family.
.
To open System settings dialog
ICD Tutorial 10 ©1989-2018 Lauterbach GmbH
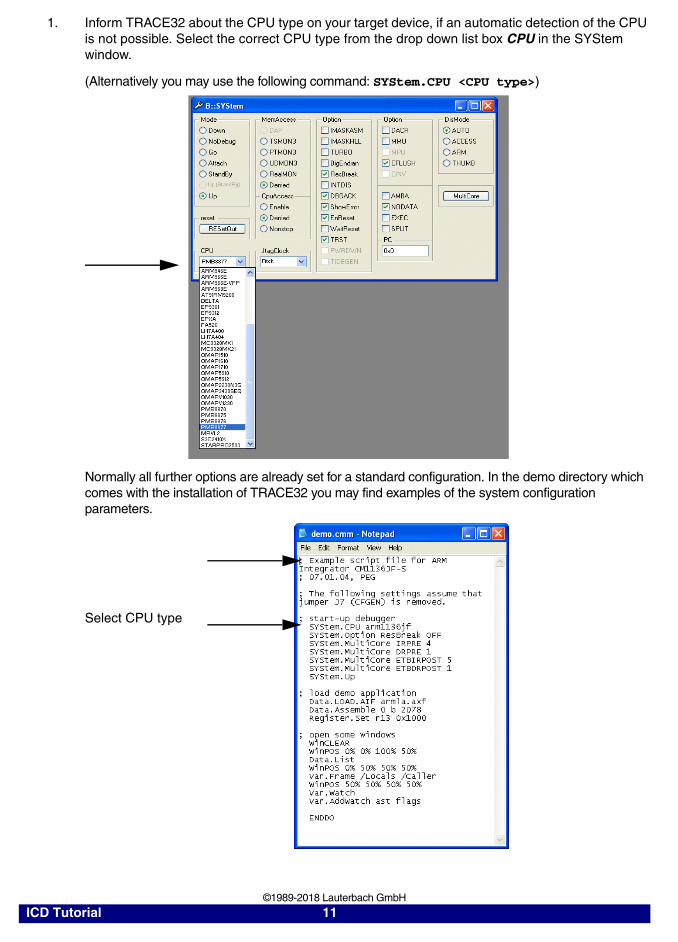
1. Inform TRACE32 about the CPU type on your target device, if an automatic detection of the CPU is not possible. Select the correct CPU type from the drop down list box CPU in the SYStem window.
(Alternatively you may use the following command: SYStem.CPU <CPU type>)
Normally all further options are already set for a standard configuration. In the demo directory which comes with the installation of TRACE32 you may find examples of the system configuration parameters.
Select CPU type
ICD Tutorial 11 ©1989-2018 Lauterbach GmbH
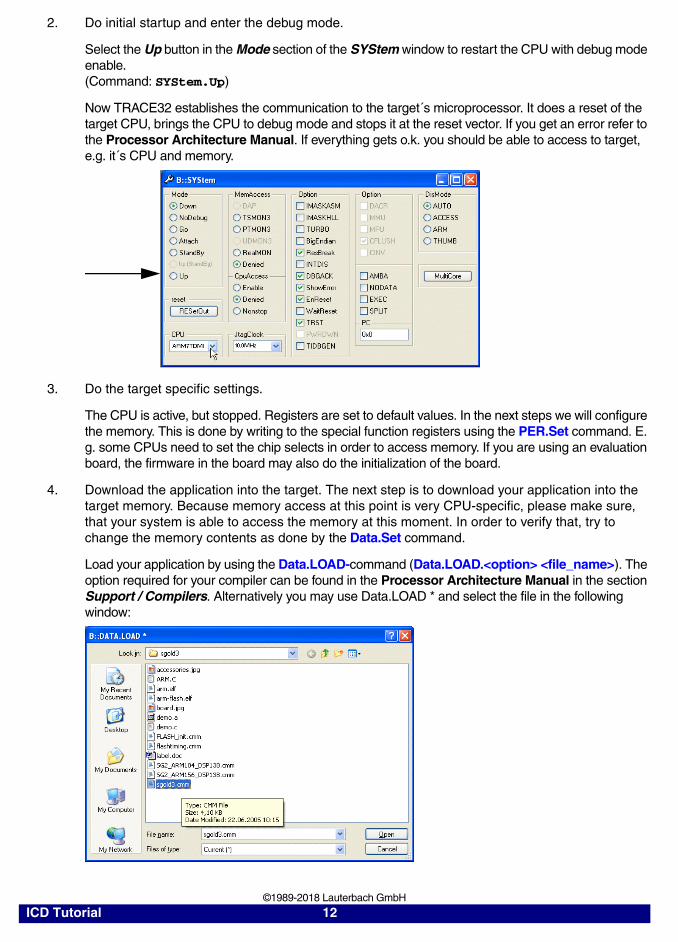
2. Do initial startup and enter the debug mode.
Select the Up button in the Mode section of the SYStem window to restart the CPU with debug mode enable.(Command: SYStem.Up)
Now TRACE32 establishes the communication to the target´s microprocessor. It does a reset of the target CPU, brings the CPU to debug mode and stops it at the reset vector. If you get an error refer to the Processor Architecture Manual. If everything gets o.k. you should be able to access to target, e.g. it´s CPU and memory.
3. Do the target specific settings.
The CPU is active, but stopped. Registers are set to default values. In the next steps we will configure the memory. This is done by writing to the special function registers using the PER.Set command. E. g. some CPUs need to set the chip selects in order to access memory. If you are using an evaluation board, the firmware in the board may also do the initialization of the board.
4. Download the application into the target. The next step is to download your application into the target memory. Because memory access at this point is very CPU-specific, please make sure, that your system is able to access the memory at this moment. In order to verify that, try to change the memory contents as done by the Data.Set command.
Load your application by using the Data.LOAD-command (Data.LOAD.<option> <file_name>). The option required for your compiler can be found in the Processor Architecture Manual in the section Support / Compilers. Alternatively you may use Data.LOAD * and select the file in the following window:
ICD Tutorial 12 ©1989-2018 Lauterbach GmbH
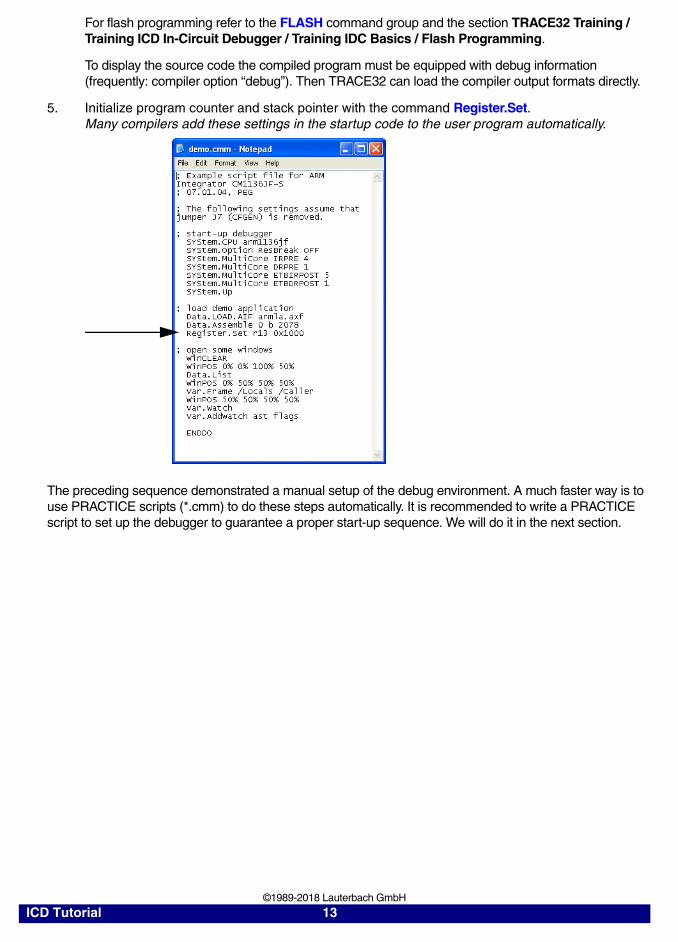
For flash programming refer to the FLASH command group and the section TRACE32 Training / Training ICD In-Circuit Debugger / Training IDC Basics / Flash Programming.
To display the source code the compiled program must be equipped with debug information (frequently: compiler option “debug”). Then TRACE32 can load the compiler output formats directly.
5. Initialize program counter and stack pointer with the command Register.Set.Many compilers add these settings in the startup code to the user program automatically.
The preceding sequence demonstrated a manual setup of the debug environment. A much faster way is to use PRACTICE scripts (*.cmm) to do these steps automatically. It is recommended to write a PRACTICE script to set up the debugger to guarantee a proper start-up sequence. We will do it in the next section.
ICD Tutorial 13 ©1989-2018 Lauterbach GmbH
PRACTICE Scripts
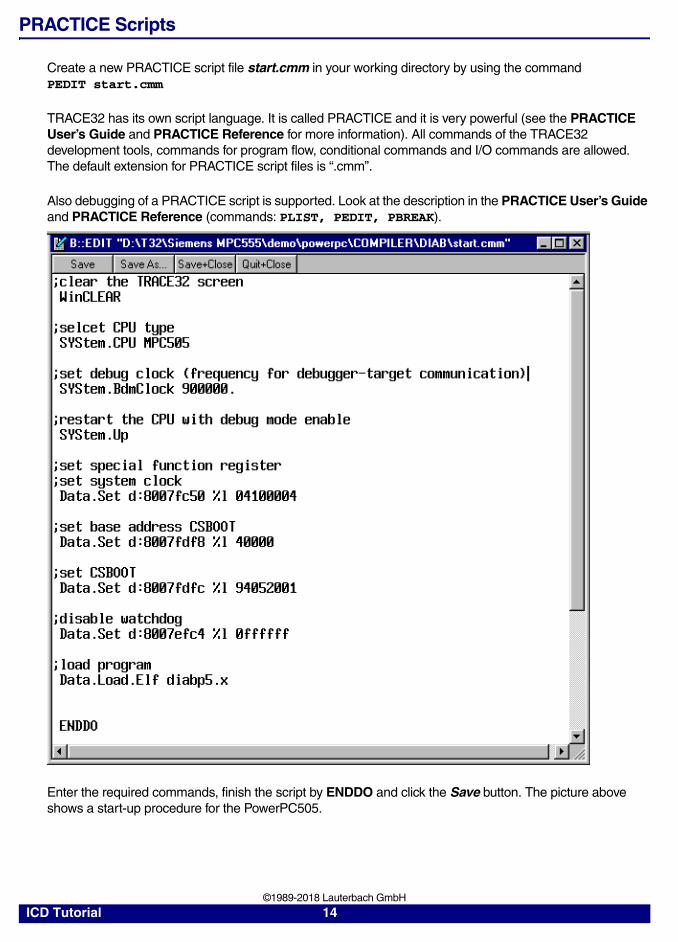
Create a new PRACTICE script file start.cmm in your working directory by using the commandPEDIT start.cmm
TRACE32 has its own script language. It is called PRACTICE and it is very powerful (see the PRACTICE User’s Guide and PRACTICE Reference for more information). All commands of the TRACE32 development tools, commands for program flow, conditional commands and I/O commands are allowed. The default extension for PRACTICE script files is “.cmm”.
Also debugging of a PRACTICE script is supported. Look at the description in the PRACTICE User’s Guide and PRACTICE Reference (commands: PLIST, PEDIT, PBREAK).
Enter the required commands, finish the script by ENDDO and click the Save button. The picture above shows a start-up procedure for the PowerPC505.
ICD Tutorial 14 ©1989-2018 Lauterbach GmbH
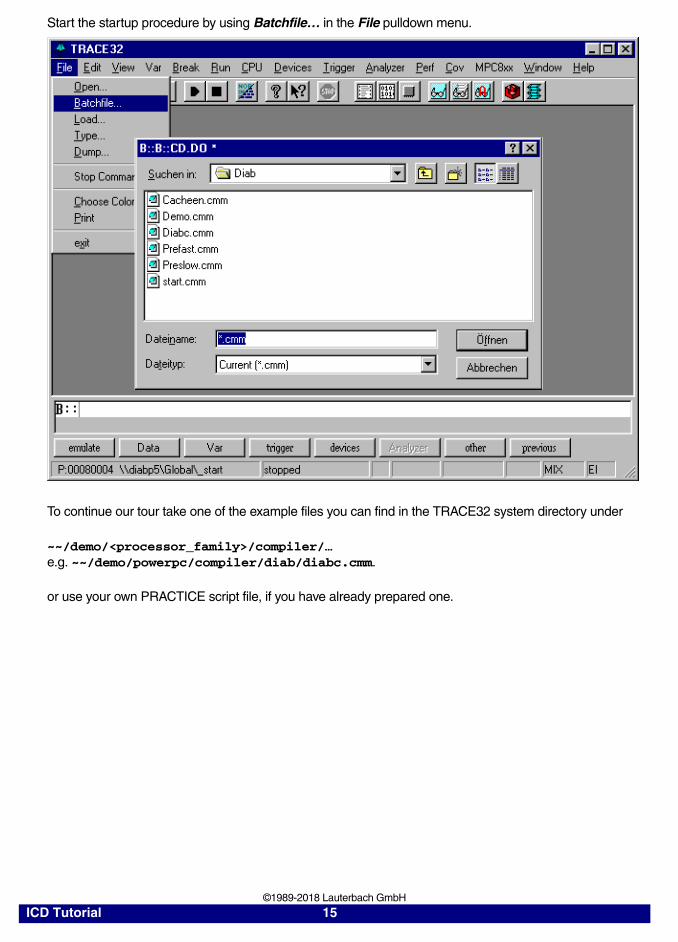
Start the startup procedure by using Batchfile… in the File pulldown menu.
To continue our tour take one of the example files you can find in the TRACE32 system directory under
~~/demo/<processor_family>/compiler/… e.g. ~~/demo/powerpc/compiler/diab/diabc.cmm.
or use your own PRACTICE script file, if you have already prepared one.
ICD Tutorial 15 ©1989-2018 Lauterbach GmbH
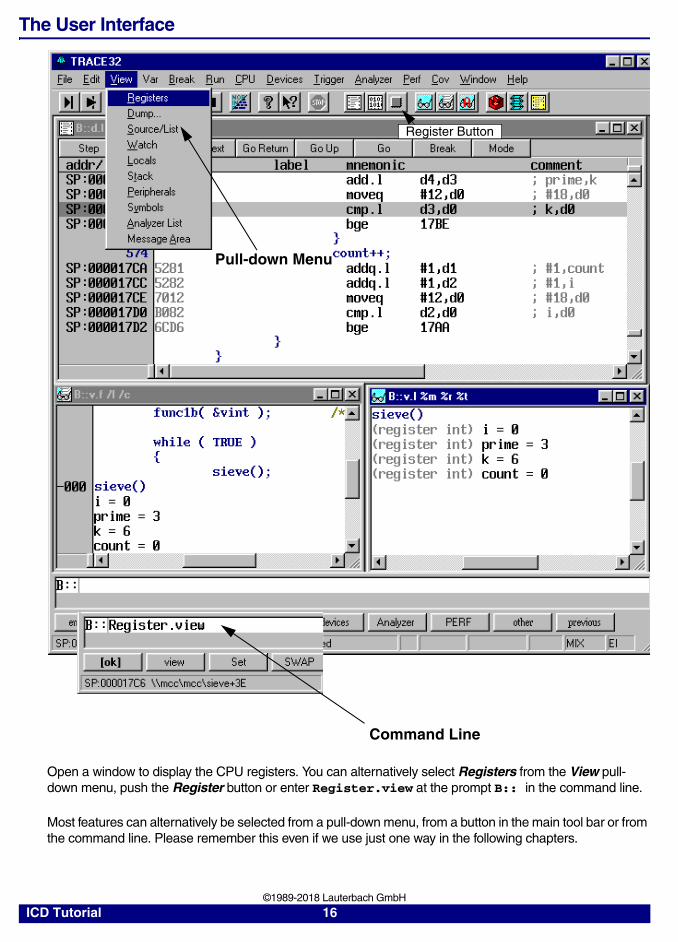
The User Interface
Open a window to display the CPU registers. You can alternatively select Registers from the View pull-down menu, push the Register button or enter Register.view at the prompt B:: in the command line.
Most features can alternatively be selected from a pull-down menu, from a button in the main tool bar or from the command line. Please remember this even if we use just one way in the following chapters.
Pull-down Menu
Command Line
Register Button
ICD Tutorial 16 ©1989-2018 Lauterbach GmbH
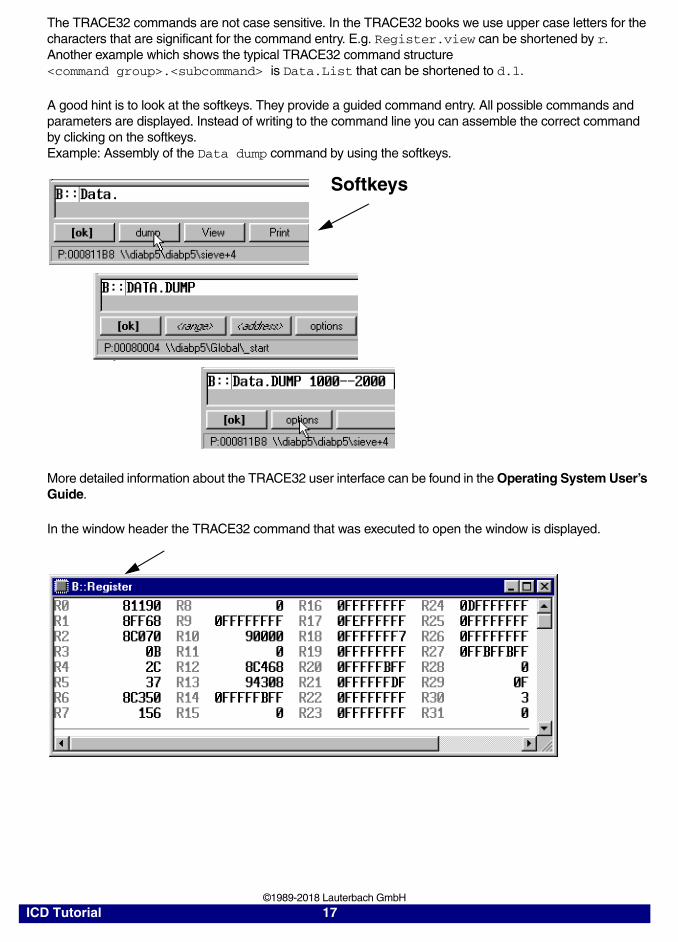
The TRACE32 commands are not case sensitive. In the TRACE32 books we use upper case letters for the characters that are significant for the command entry. E.g. Register.view can be shortened by r. Another example which shows the typical TRACE32 command structure <command group>.<subcommand> is Data.List that can be shortened to d.l.
A good hint is to look at the softkeys. They provide a guided command entry. All possible commands and parameters are displayed. Instead of writing to the command line you can assemble the correct command by clicking on the softkeys. Example: Assembly of the Data dump command by using the softkeys.
More detailed information about the TRACE32 user interface can be found in the Operating System User’s Guide.
In the window header the TRACE32 command that was executed to open the window is displayed.
Softkeys
ICD Tutorial 17 ©1989-2018 Lauterbach GmbH
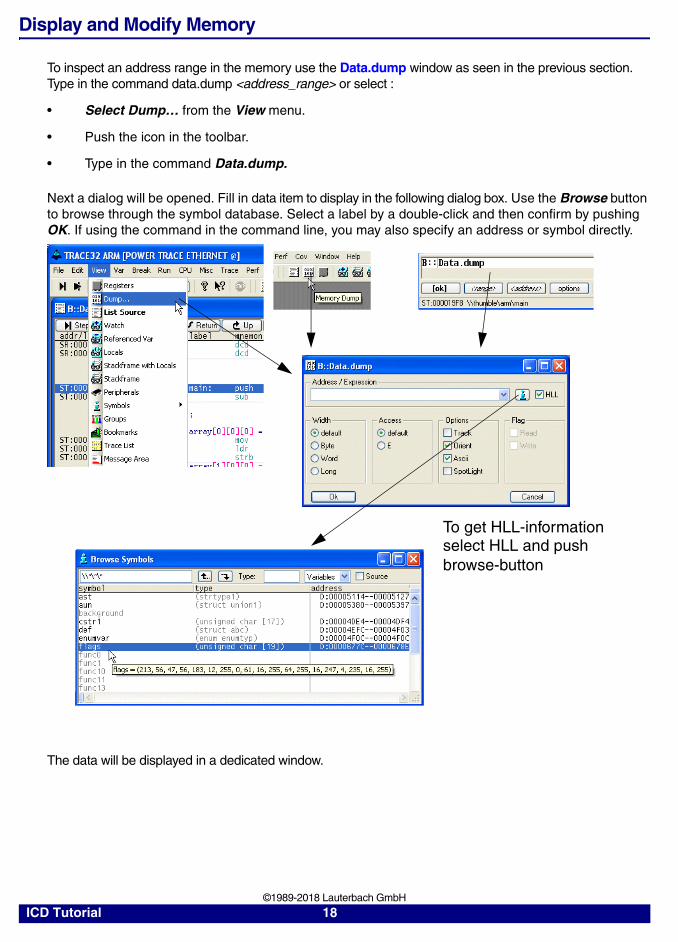
Display and Modify Memory
To inspect an address range in the memory use the Data.dump window as seen in the previous section. Type in the command data.dump <address_range> or select :
• Select Dump… from the View menu.
• Push the icon in the toolbar.
• Type in the command Data.dump.
Next a dialog will be opened. Fill in data item to display in the following dialog box. Use the Browse button to browse through the symbol database. Select a label by a double-click and then confirm by pushing OK. If using the command in the command line, you may also specify an address or symbol directly.
The data will be displayed in a dedicated window.
To get HLL-information select HLL and push browse-button
ICD Tutorial 18 ©1989-2018 Lauterbach GmbH
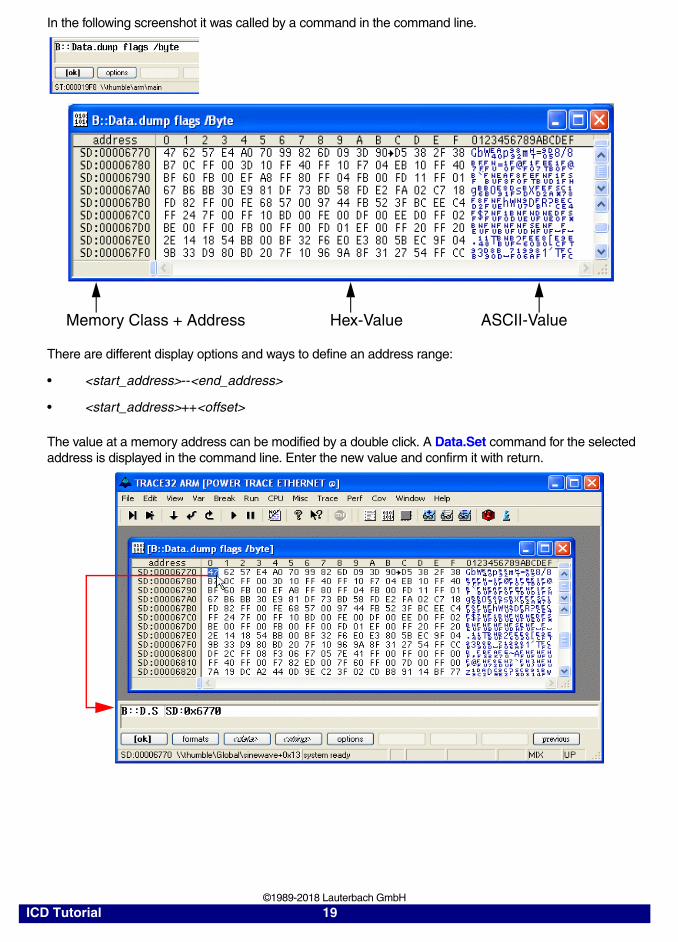
In the following screenshot it was called by a command in the command line.
There are different display options and ways to define an address range:
• <start_address>--<end_address>
• <start_address>++<offset>
The value at a memory address can be modified by a double click. A Data.Set command for the selected address is displayed in the command line. Enter the new value and confirm it with return.
Memory Class + Address Hex-Value ASCII-Value
ICD Tutorial 19 ©1989-2018 Lauterbach GmbH
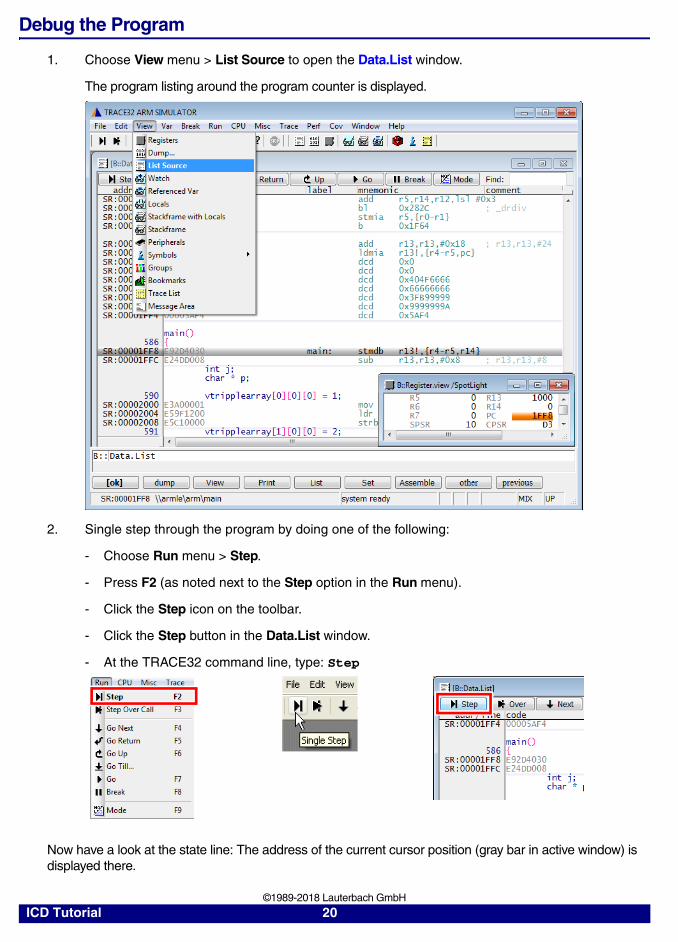
Debug the Program
1. Choose View menu > List Source to open the Data.List window.
The program listing around the program counter is displayed.
2. Single step through the program by doing one of the following:
- Choose Run menu > Step.
- Press F2 (as noted next to the Step option in the Run menu).
- Click the Step icon on the toolbar.
- Click the Step button in the Data.List window.
- At the TRACE32 command line, type: Step
Now have a look at the state line: The address of the current cursor position (gray bar in active window) is displayed there.
ICD Tutorial 20 ©1989-2018 Lauterbach GmbH
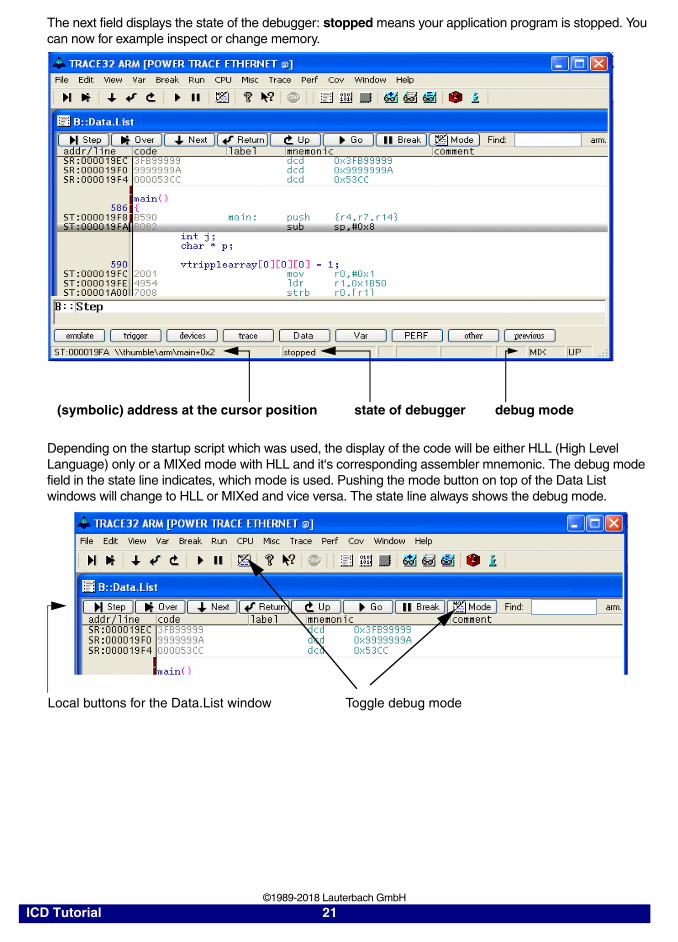
The next field displays the state of the debugger: stopped means your application program is stopped. You can now for example inspect or change memory.
Depending on the startup script which was used, the display of the code will be either HLL (High Level Language) only or a MIXed mode with HLL and it‘s corresponding assembler mnemonic. The debug mode field in the state line indicates, which mode is used. Pushing the mode button on top of the Data List windows will change to HLL or MIXed and vice versa. The state line always shows the debug mode.
(symbolic) address at the cursor position state of debugger debug mode
Toggle debug modeLocal buttons for the Data.List window
ICD Tutorial 21 ©1989-2018 Lauterbach GmbH
.
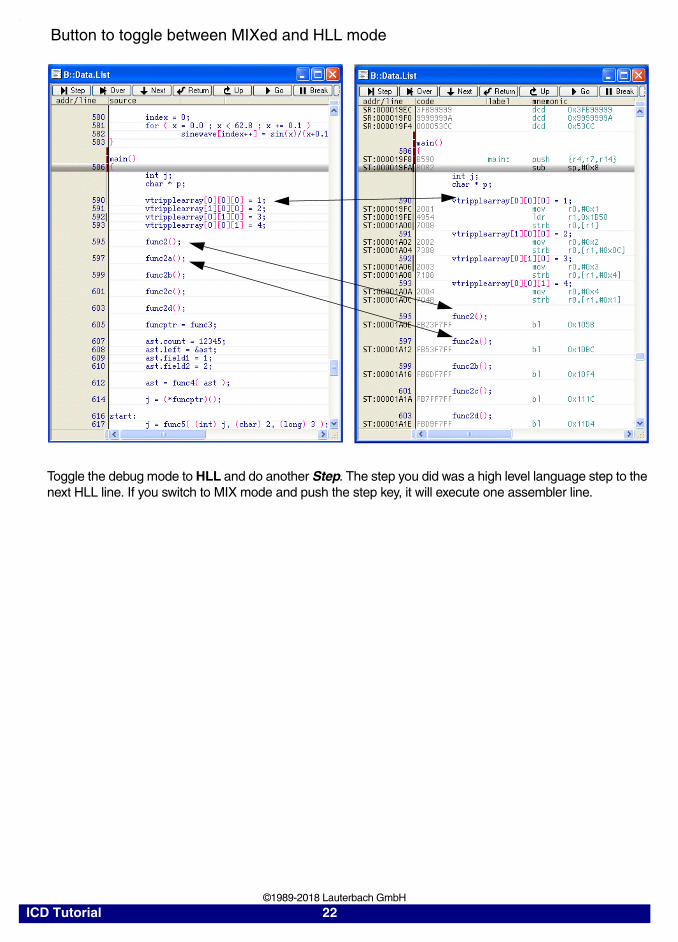
Toggle the debug mode to HLL and do another Step. The step you did was a high level language step to the next HLL line. If you switch to MIX mode and push the step key, it will execute one assembler line.
Button to toggle between MIXed and HLL mode
ICD Tutorial 22 ©1989-2018 Lauterbach GmbH
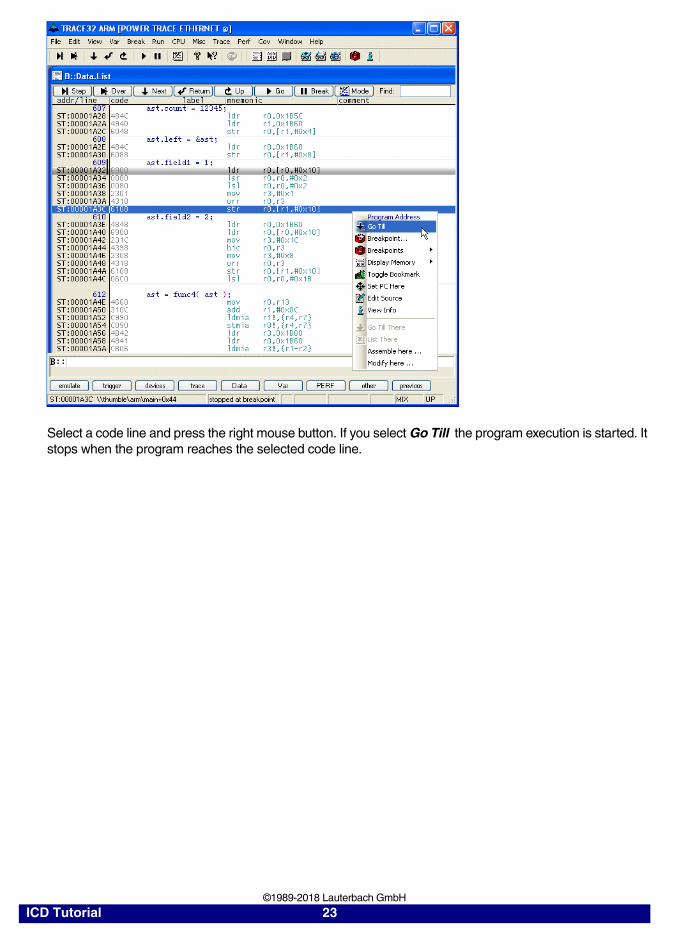
Select a code line and press the right mouse button. If you select Go Till the program execution is started. It stops when the program reaches the selected code line.
ICD Tutorial 23 ©1989-2018 Lauterbach GmbH
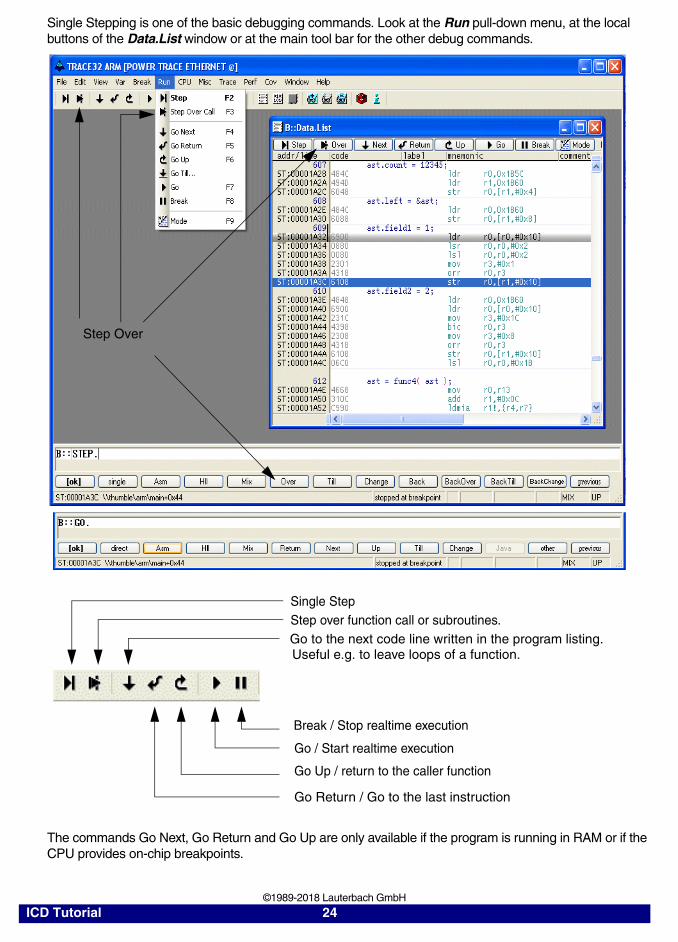
Single Stepping is one of the basic debugging commands. Look at the Run pull-down menu, at the local buttons of the Data.List window or at the main tool bar for the other debug commands.
The commands Go Next, Go Return and Go Up are only available if the program is running in RAM or if the CPU provides on-chip breakpoints.
Step over function call or subroutines.Go to the next code line written in the program listing.
Go Return / Go to the last instruction
Useful e.g. to leave loops of a function.
Step Over
Single Step
Break / Stop realtime execution
Go / Start realtime execution
Go Up / return to the caller function
ICD Tutorial 24 ©1989-2018 Lauterbach GmbH
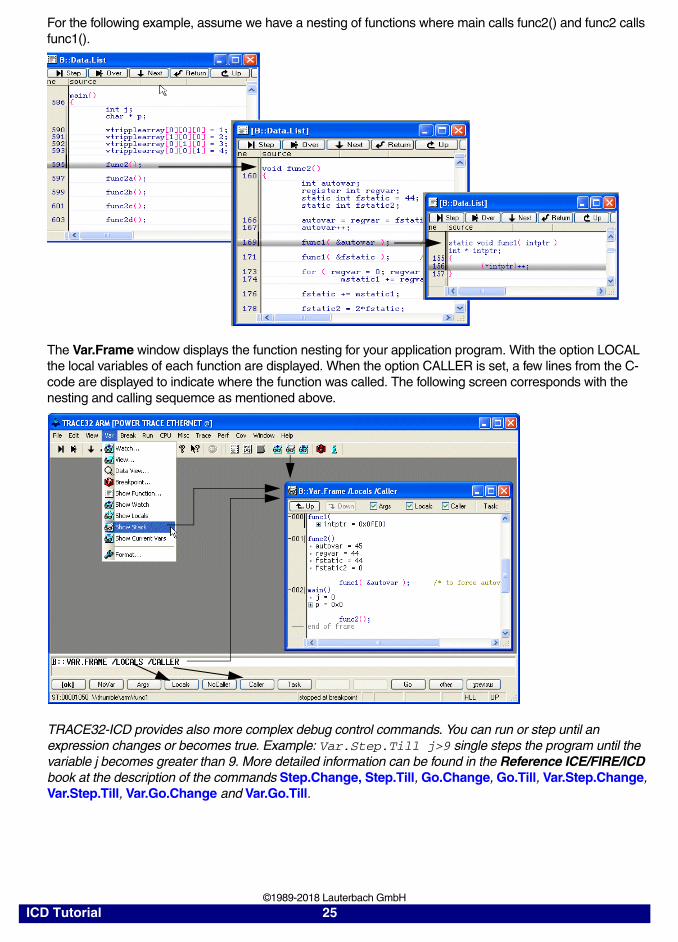
For the following example, assume we have a nesting of functions where main calls func2() and func2 calls func1().
The Var.Frame window displays the function nesting for your application program. With the option LOCAL the local variables of each function are displayed. When the option CALLER is set, a few lines from the C-code are displayed to indicate where the function was called. The following screen corresponds with the nesting and calling sequemce as mentioned above.
TRACE32-ICD provides also more complex debug control commands. You can run or step until an expression changes or becomes true. Example: Var.Step.Till j>9 single steps the program until the variable j becomes greater than 9. More detailed information can be found in the Reference ICE/FIRE/ICD book at the description of the commands Step.Change, Step.Till, Go.Change, Go.Till, Var.Step.Change, Var.Step.Till, Var.Go.Change and Var.Go.Till.
ICD Tutorial 25 ©1989-2018 Lauterbach GmbH
How to Set Breakpoints
Software Breakpoints
The ICD debugger use software breakpoints by default. When a software breakpoint is set to an instruction, the code at this address is replaced by a special instruction e.g. TRAP, that stops the realtime execution and returns the control to the on-chip debug system. This method requires RAM at the break positions! If you run your program within RAM the number of software breakpoints is unlimited.
If your program does not run in RAM, refer to Breakpoints in ROM, FLASH or EEPROM.
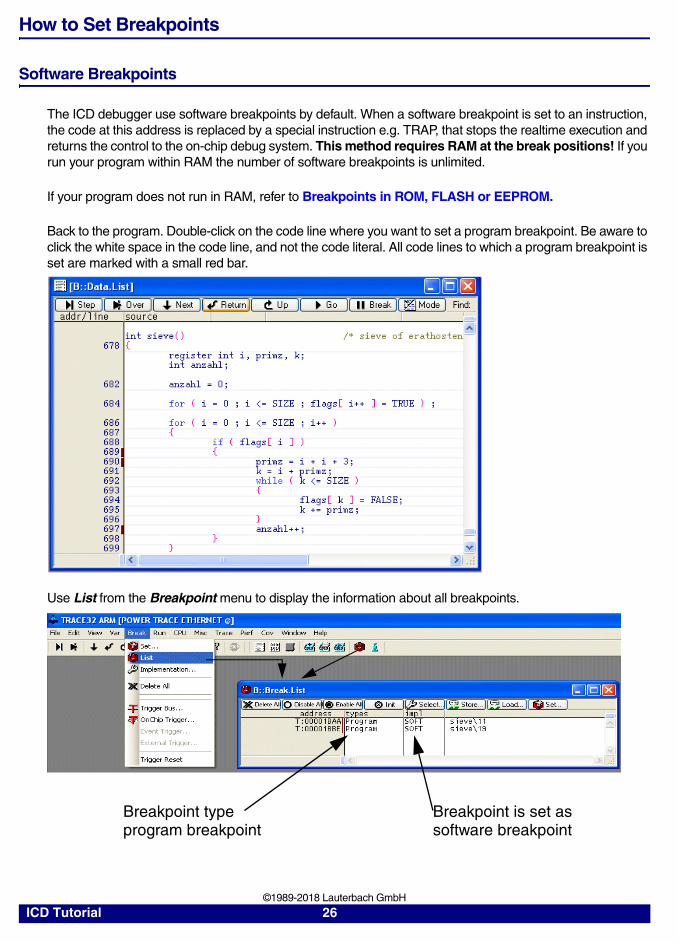
Back to the program. Double-click on the code line where you want to set a program breakpoint. Be aware to click the white space in the code line, and not the code literal. All code lines to which a program breakpoint is set are marked with a small red bar.
Use List from the Breakpoint menu to display the information about all breakpoints.
program breakpointBreakpoint is set assoftware breakpoint
Breakpoint type
ICD Tutorial 26 ©1989-2018 Lauterbach GmbH
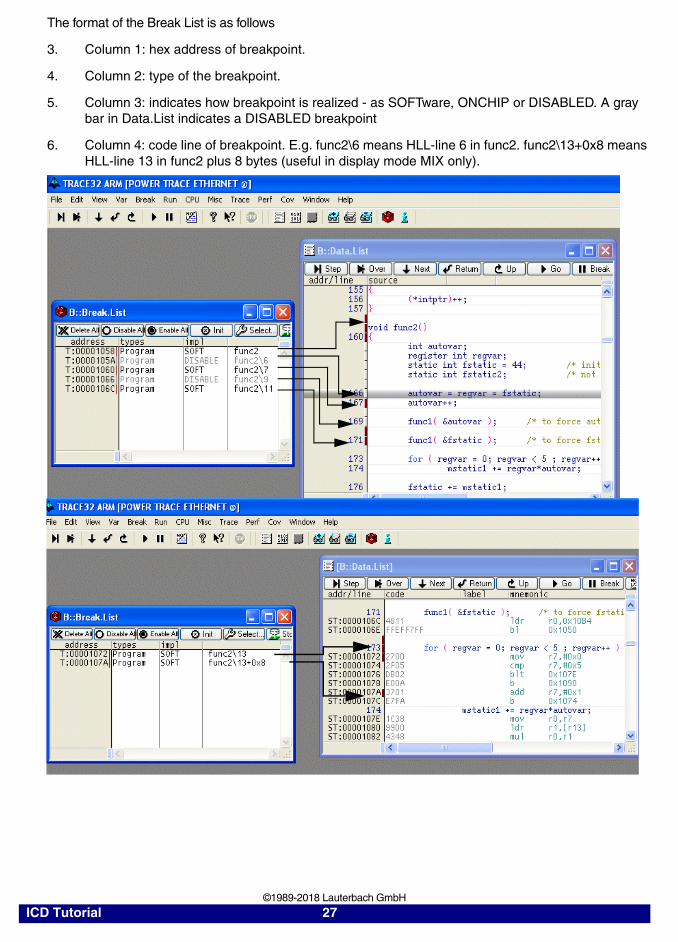
The format of the Break List is as follows
3. Column 1: hex address of breakpoint.
4. Column 2: type of the breakpoint.
5. Column 3: indicates how breakpoint is realized - as SOFTware, ONCHIP or DISABLED. A gray bar in Data.List indicates a DISABLED breakpoint
6. Column 4: code line of breakpoint. E.g. func2\6 means HLL-line 6 in func2. func2\13+0x8 means HLL-line 13 in func2 plus 8 bytes (useful in display mode MIX only).
ICD Tutorial 27 ©1989-2018 Lauterbach GmbH
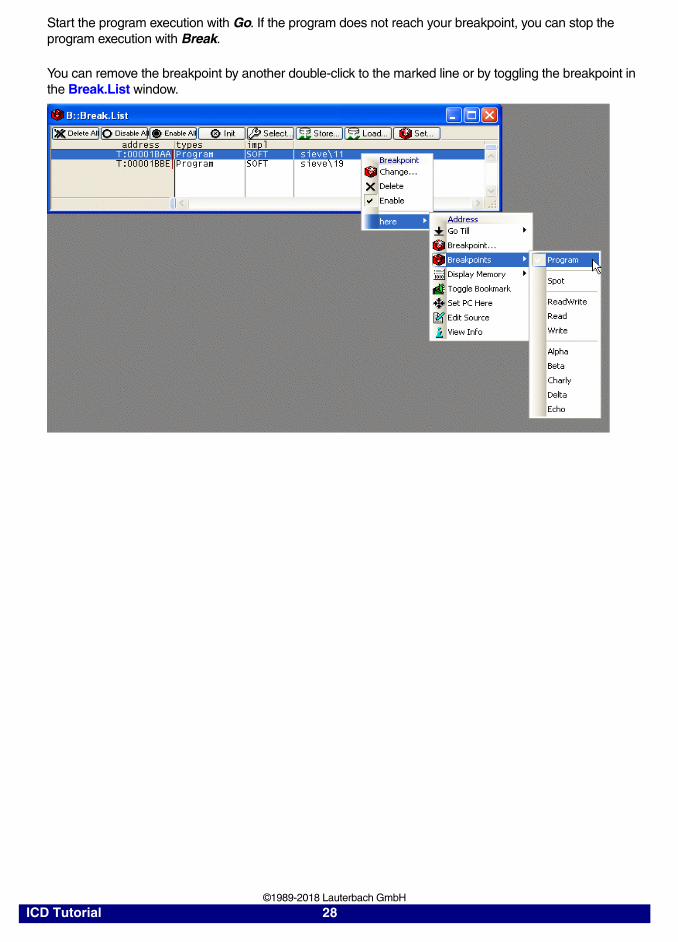
Start the program execution with Go. If the program does not reach your breakpoint, you can stop the program execution with Break.
You can remove the breakpoint by another double-click to the marked line or by toggling the breakpoint in the Break.List window.
ICD Tutorial 28 ©1989-2018 Lauterbach GmbH
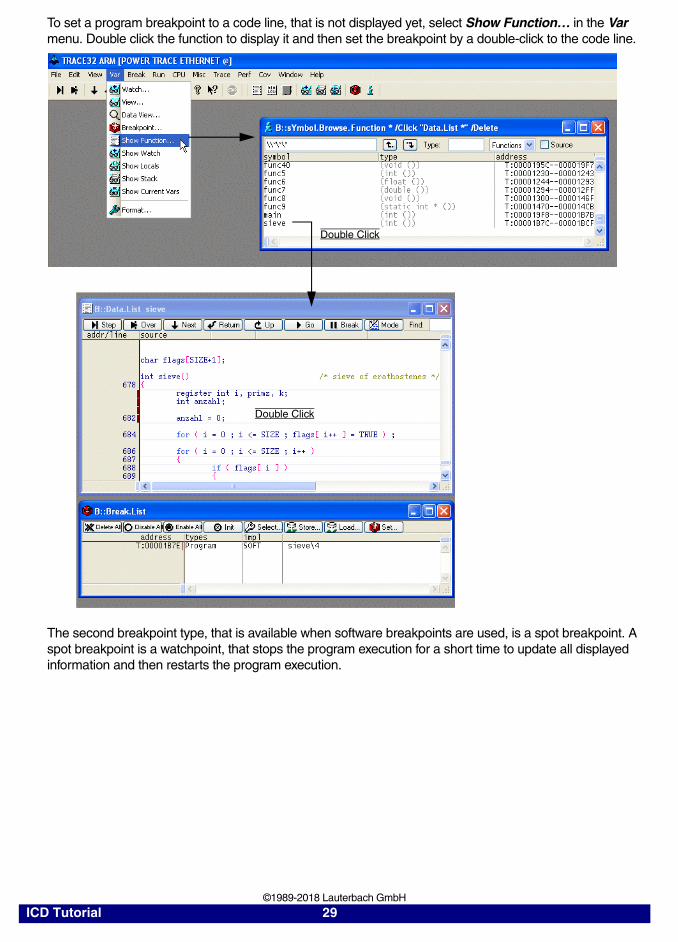
To set a program breakpoint to a code line, that is not displayed yet, select Show Function… in the Var menu. Double click the function to display it and then set the breakpoint by a double-click to the code line.
The second breakpoint type, that is available when software breakpoints are used, is a spot breakpoint. A spot breakpoint is a watchpoint, that stops the program execution for a short time to update all displayed information and then restarts the program execution.
Double Click
Double Click
ICD Tutorial 29 ©1989-2018 Lauterbach GmbH
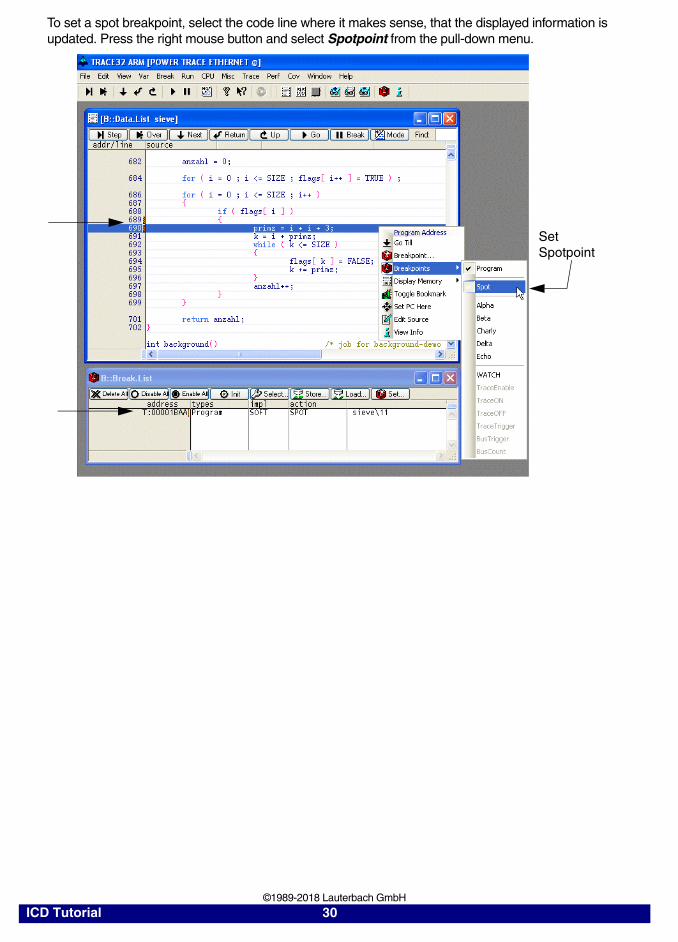
To set a spot breakpoint, select the code line where it makes sense, that the displayed information is updated. Press the right mouse button and select Spotpoint from the pull-down menu.
Set Spotpoint
ICD Tutorial 30 ©1989-2018 Lauterbach GmbH
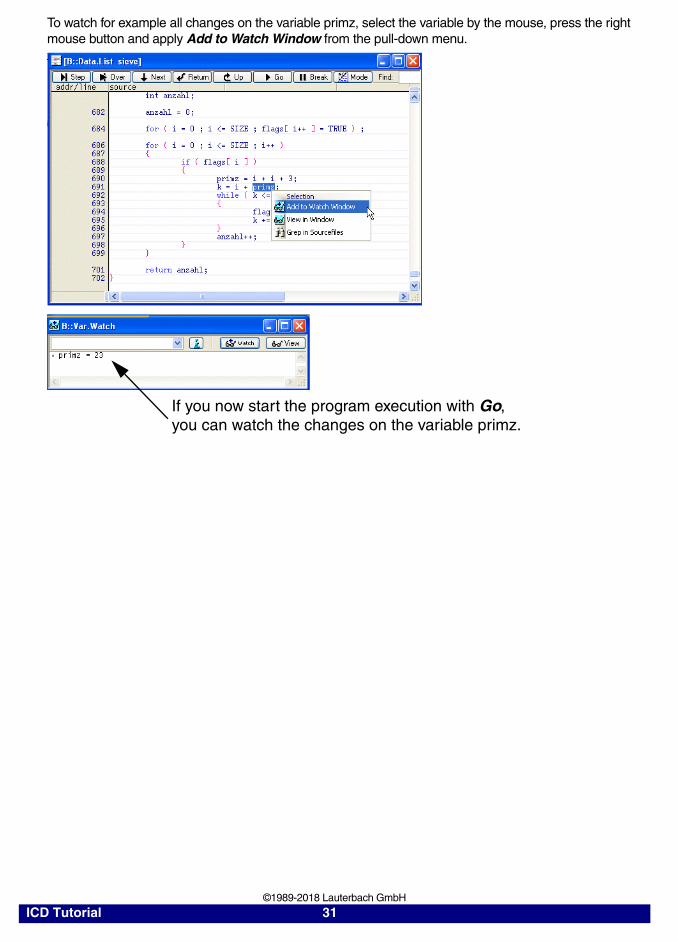
To watch for example all changes on the variable primz, select the variable by the mouse, press the right mouse button and apply Add to Watch Window from the pull-down menu.
If you now start the program execution with Go, you can watch the changes on the variable primz.
ICD Tutorial 31 ©1989-2018 Lauterbach GmbH

Breakpoints in ROM, Flash, EEPROM
Most processor types (not 6833x and 6834x) provide a small number of on-chip breakpoints. These breakpoints are used by TRACE32-ICD to set program or spot breakpoints even if the program doesn’t run in RAM.
In the following example we will set up an on-chip breakpoint together with a regular soft breakpoint. For the ease of the example we assume, that func2a resides in non-volatile Memory like ROM, FLASH or EEPROM and func2b stays in RAM. As a consequence func2a needs on-chip breakpoints whereas func2b may use soft breakpoints:
1. Get address range of func2a and func2b (“Show Function” in menu “Var”)
2. Assign func2a to be in non-volatile Memory (MAP.BOnchip). In order to check the mapping of the memory use: MAP.List.
3. Assign a breakpoint in func2a and func2b.
4. Check breakpoints by doing a Break.List.
Since the debugger uses software breakpoints by default, you must inform the debugger that the on-chip breakpoints should be used!
MAP.BOnchip <address_range>The command MAP.BOnchip indicates, that whenever a program or spot breakpoint is set within the specified address range, the debugger should use an on-chip breakpoint.
ICD Tutorial 32 ©1989-2018 Lauterbach GmbH
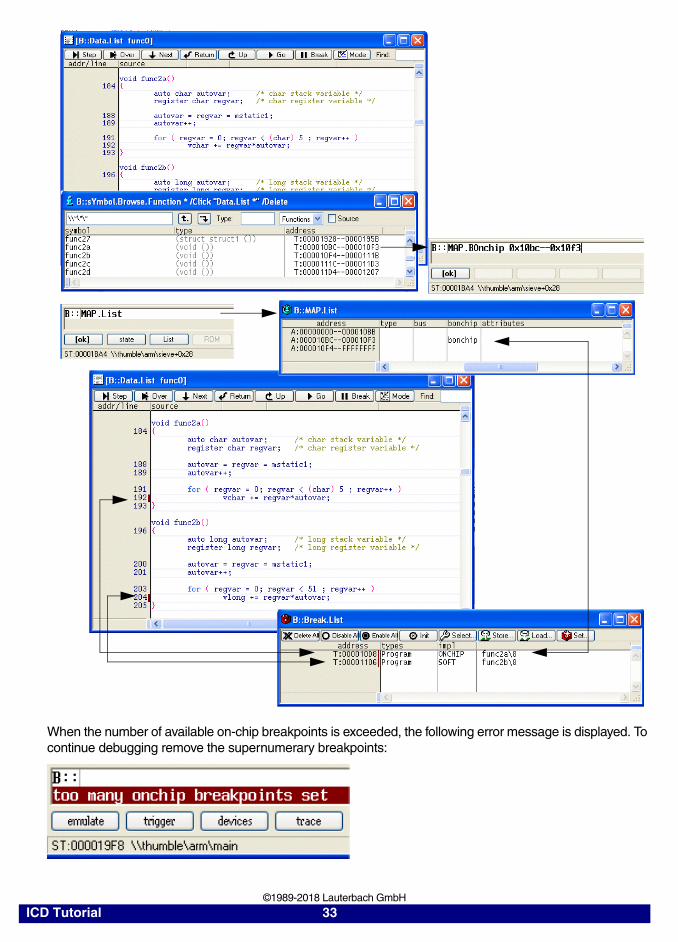
When the number of available on-chip breakpoints is exceeded, the following error message is displayed. To continue debugging remove the supernumerary breakpoints:
ICD Tutorial 33 ©1989-2018 Lauterbach GmbH
Breakpoints on Data Accesses
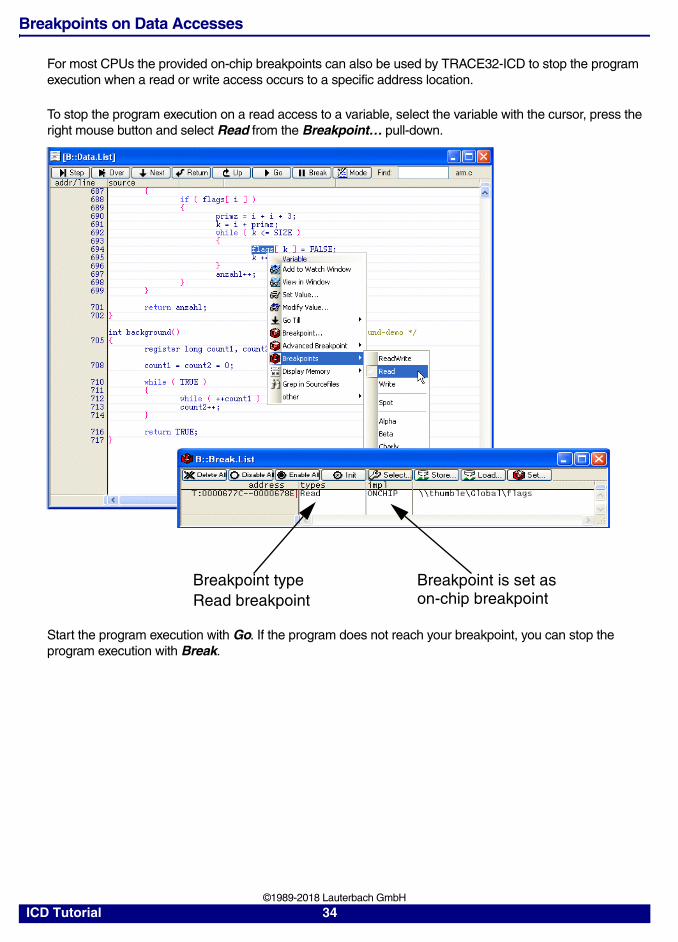
For most CPUs the provided on-chip breakpoints can also be used by TRACE32-ICD to stop the program execution when a read or write access occurs to a specific address location.
To stop the program execution on a read access to a variable, select the variable with the cursor, press the right mouse button and select Read from the Breakpoint… pull-down.
Start the program execution with Go. If the program does not reach your breakpoint, you can stop the program execution with Break.
Read breakpointBreakpoint is set ason-chip breakpoint
Breakpoint type
ICD Tutorial 34 ©1989-2018 Lauterbach GmbH
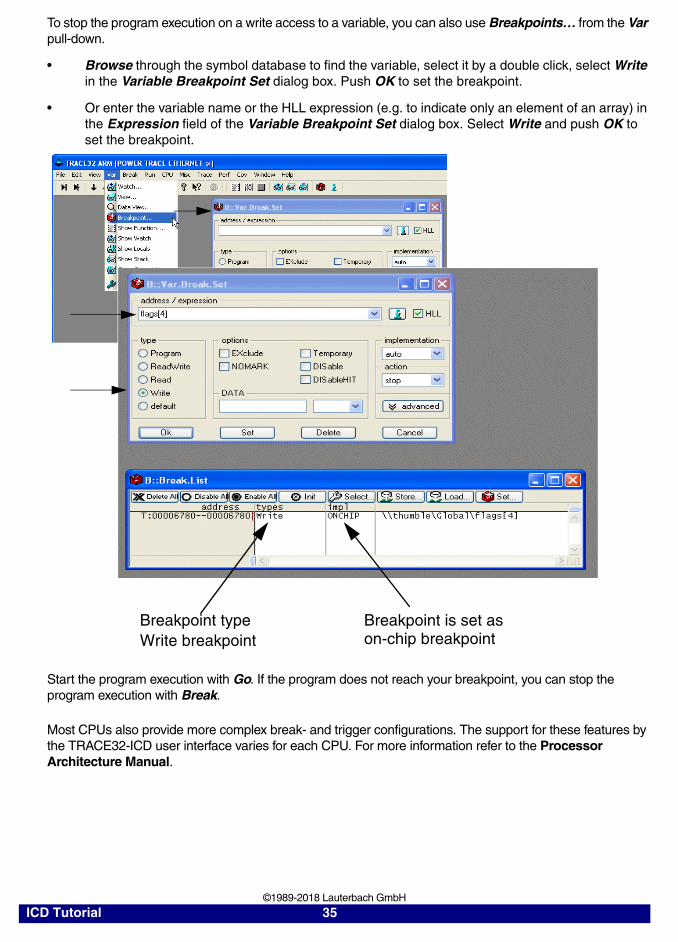
To stop the program execution on a write access to a variable, you can also use Breakpoints… from the Var pull-down.
• Browse through the symbol database to find the variable, select it by a double click, select Write in the Variable Breakpoint Set dialog box. Push OK to set the breakpoint.
• Or enter the variable name or the HLL expression (e.g. to indicate only an element of an array) in the Expression field of the Variable Breakpoint Set dialog box. Select Write and push OK to set the breakpoint.
Start the program execution with Go. If the program does not reach your breakpoint, you can stop the program execution with Break.
Most CPUs also provide more complex break- and trigger configurations. The support for these features by the TRACE32-ICD user interface varies for each CPU. For more information refer to the Processor Architecture Manual.
Write breakpointBreakpoint is set ason-chip breakpoint
Breakpoint type
ICD Tutorial 35 ©1989-2018 Lauterbach GmbH
Display and Modify HLL Variables
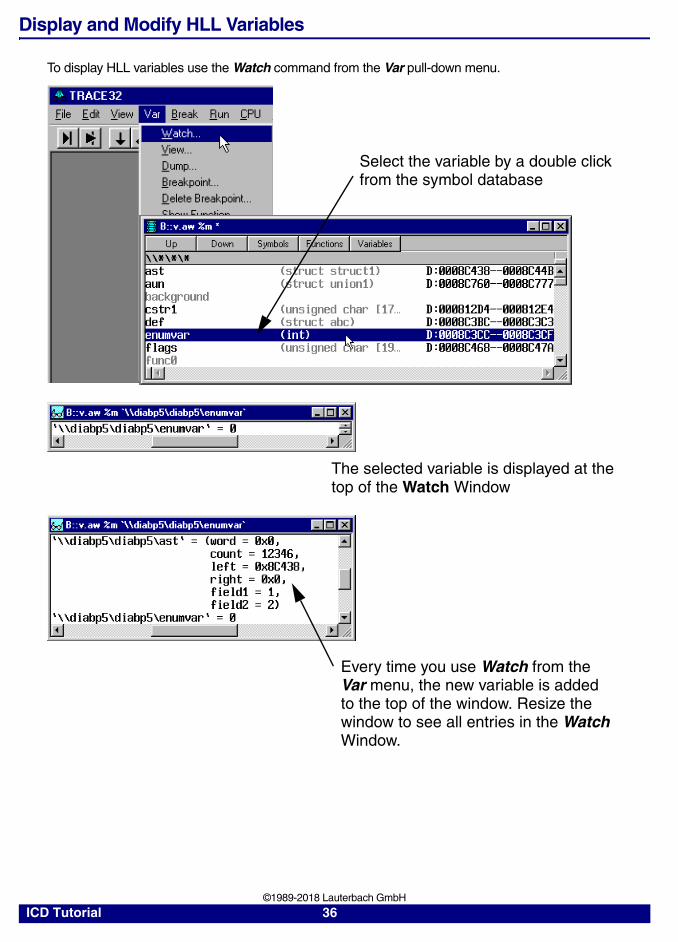
To display HLL variables use the Watch command from the Var pull-down menu.
Select the variable by a double click from the symbol database
The selected variable is displayed at the top of the Watch Window
Every time you use Watch from theVar menu, the new variable is added to the top of the window. Resize the window to see all entries in the WatchWindow.
ICD Tutorial 36 ©1989-2018 Lauterbach GmbH
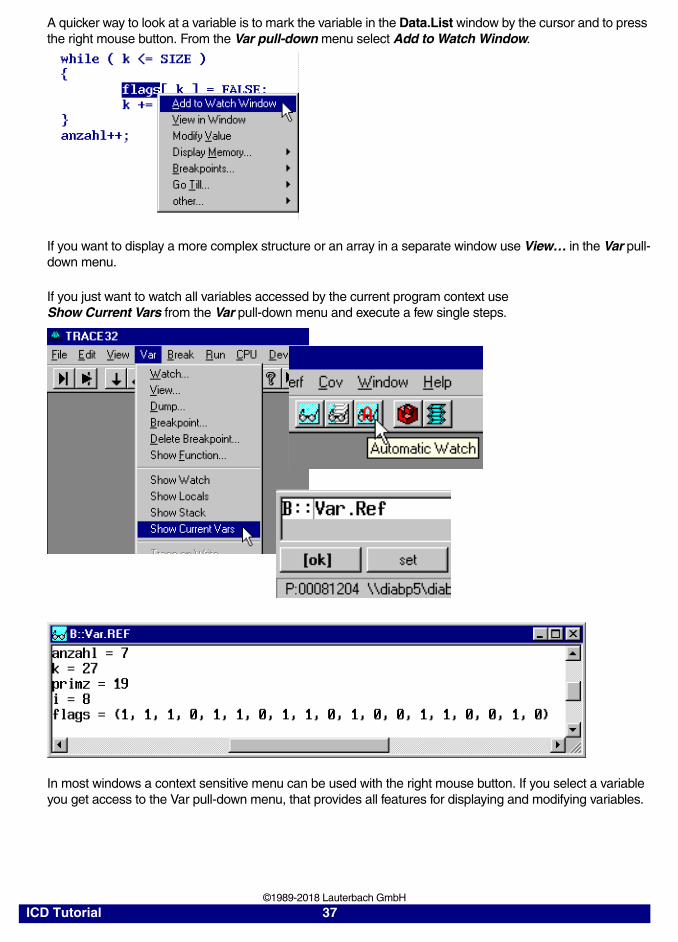
A quicker way to look at a variable is to mark the variable in the Data.List window by the cursor and to press the right mouse button. From the Var pull-down menu select Add to Watch Window.
If you want to display a more complex structure or an array in a separate window use View… in the Var pull-down menu.
If you just want to watch all variables accessed by the current program context use Show Current Vars from the Var pull-down menu and execute a few single steps.
In most windows a context sensitive menu can be used with the right mouse button. If you select a variable you get access to the Var pull-down menu, that provides all features for displaying and modifying variables.
ICD Tutorial 37 ©1989-2018 Lauterbach GmbH
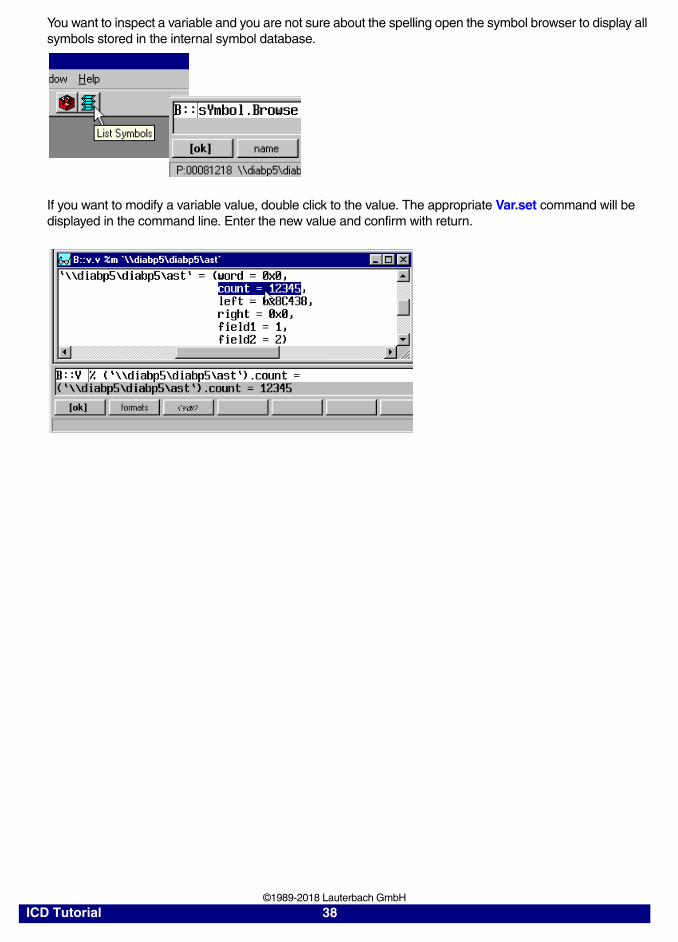
You want to inspect a variable and you are not sure about the spelling open the symbol browser to display all symbols stored in the internal symbol database.
If you want to modify a variable value, double click to the value. The appropriate Var.set command will be displayed in the command line. Enter the new value and confirm with return.
ICD Tutorial 38 ©1989-2018 Lauterbach GmbH
Format HLL-Variables
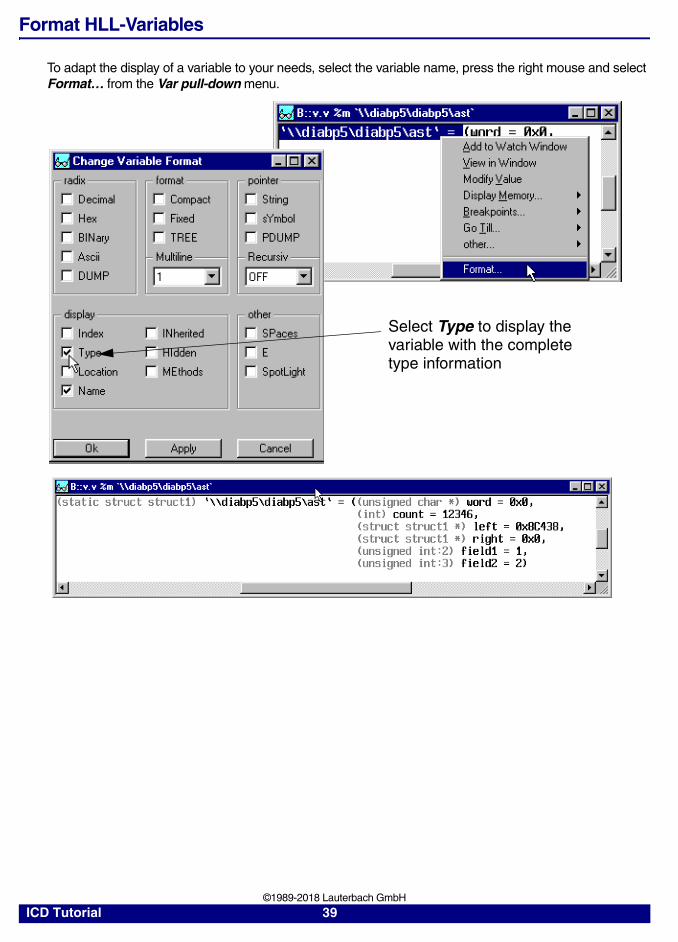
To adapt the display of a variable to your needs, select the variable name, press the right mouse and select Format… from the Var pull-down menu.
Select Type to display thevariable with the completetype information
ICD Tutorial 39 ©1989-2018 Lauterbach GmbH
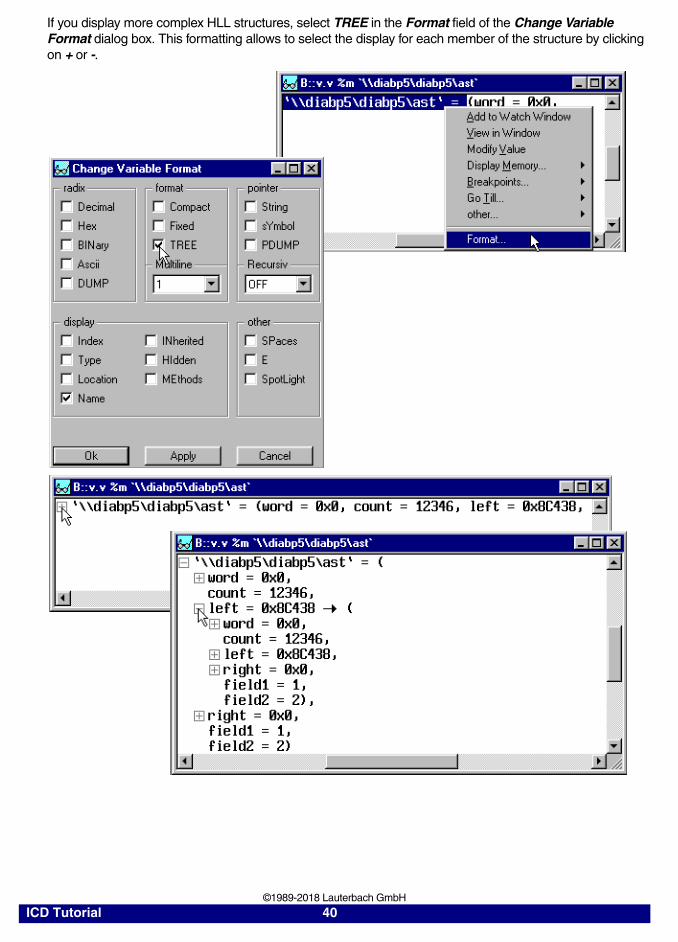
If you display more complex HLL structures, select TREE in the Format field of the Change Variable Format dialog box. This formatting allows to select the display for each member of the structure by clicking on + or -.
ICD Tutorial 40 ©1989-2018 Lauterbach GmbH
Exit TRACE32
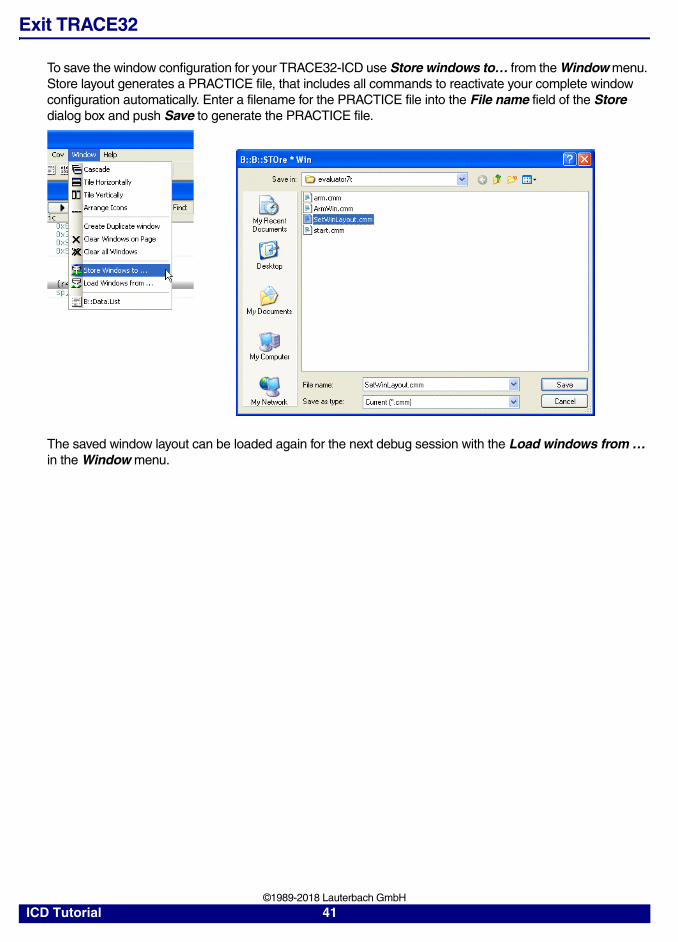
To save the window configuration for your TRACE32-ICD use Store windows to… from the Window menu. Store layout generates a PRACTICE file, that includes all commands to reactivate your complete window configuration automatically. Enter a filename for the PRACTICE file into the File name field of the Store dialog box and push Save to generate the PRACTICE file.
The saved window layout can be loaded again for the next debug session with the Load windows from … in the Window menu.
ICD Tutorial 41 ©1989-2018 Lauterbach GmbH
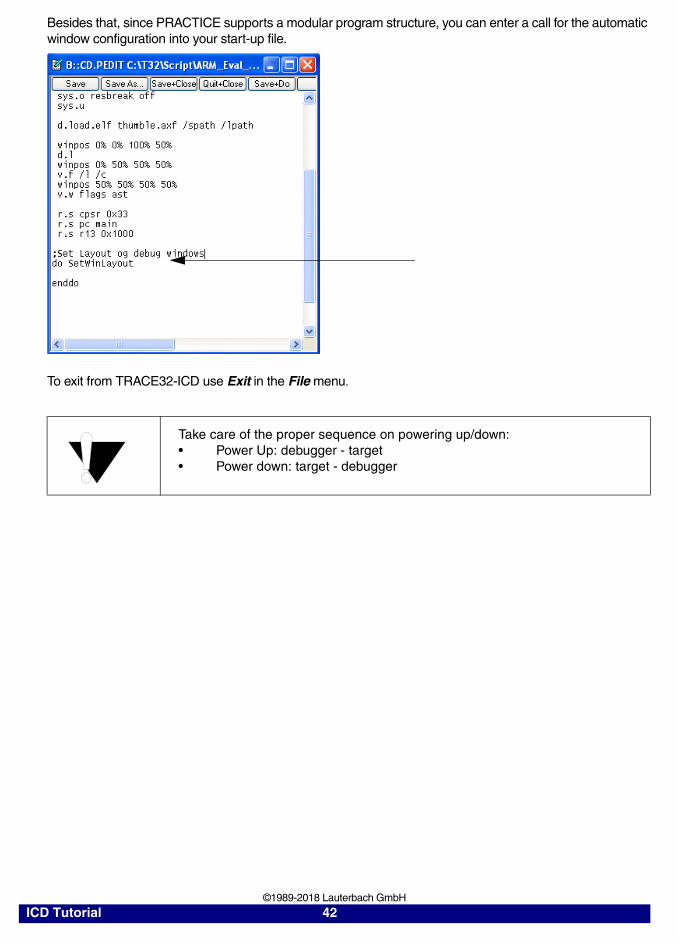
Besides that, since PRACTICE supports a modular program structure, you can enter a call for the automatic window configuration into your start-up file.
To exit from TRACE32-ICD use Exit in the File menu.
Take care of the proper sequence on powering up/down:• Power Up: debugger - target• Power down: target - debugger
ICD Tutorial 42 ©1989-2018 Lauterbach GmbH