Embed Size (px)
Citation preview

Stephen T. McClainBaylor University, Waco, Texas
Peter TinoThe University of Birmingham, Birmingham, B15 2TT, United Kingdom
Richard E. KreegerGlenn Research Center, Cleveland, Ohio
Ice Shape Characterization Using Self-Organizing Maps
NASA/TM—2011-217013
May 2011
AIAA–2009–3865
https://ntrs.nasa.gov/search.jsp?R=20110012461 2018-07-07T08:26:23+00:00Z

NASA STI Program . . . in Profile
Since its founding, NASA has been dedicated to the advancement of aeronautics and space science. The NASA Scientific and Technical Information (STI) program plays a key part in helping NASA maintain this important role.
The NASA STI Program operates under the auspices of the Agency Chief Information Officer. It collects, organizes, provides for archiving, and disseminates NASA’s STI. The NASA STI program provides access to the NASA Aeronautics and Space Database and its public interface, the NASA Technical Reports Server, thus providing one of the largest collections of aeronautical and space science STI in the world. Results are published in both non-NASA channels and by NASA in the NASA STI Report Series, which includes the following report types: • TECHNICAL PUBLICATION. Reports of
completed research or a major significant phase of research that present the results of NASA programs and include extensive data or theoretical analysis. Includes compilations of significant scientific and technical data and information deemed to be of continuing reference value. NASA counterpart of peer-reviewed formal professional papers but has less stringent limitations on manuscript length and extent of graphic presentations.
• TECHNICAL MEMORANDUM. Scientific
and technical findings that are preliminary or of specialized interest, e.g., quick release reports, working papers, and bibliographies that contain minimal annotation. Does not contain extensive analysis.
• CONTRACTOR REPORT. Scientific and
technical findings by NASA-sponsored contractors and grantees.
• CONFERENCE PUBLICATION. Collected papers from scientific and technical conferences, symposia, seminars, or other meetings sponsored or cosponsored by NASA.
• SPECIAL PUBLICATION. Scientific,
technical, or historical information from NASA programs, projects, and missions, often concerned with subjects having substantial public interest.
• TECHNICAL TRANSLATION. English-
language translations of foreign scientific and technical material pertinent to NASA’s mission.
Specialized services also include creating custom thesauri, building customized databases, organizing and publishing research results.
For more information about the NASA STI program, see the following:
• Access the NASA STI program home page at http://www.sti.nasa.gov
• E-mail your question via the Internet to help@
sti.nasa.gov • Fax your question to the NASA STI Help Desk
at 443–757–5803 • Telephone the NASA STI Help Desk at 443–757–5802 • Write to:
NASA Center for AeroSpace Information (CASI) 7115 Standard Drive Hanover, MD 21076–1320

Stephen T. McClainBaylor University, Waco, Texas
Peter TinoThe University of Birmingham, Birmingham, B15 2TT, United Kingdom
Richard E. KreegerGlenn Research Center, Cleveland, Ohio
Ice Shape Characterization Using Self-Organizing Maps
NASA/TM—2011-217013
May 2011
AIAA–2009–3865
National Aeronautics andSpace Administration
Glenn Research Center Cleveland, Ohio 44135
Prepared for theFirst Atmospheric and Space Environments Conferencesponsored by the American Institute of Aeronautics and AstronauticsSan Antonio, Texas, June 22–25, 2009

Available from
NASA Center for Aerospace Information7115 Standard DriveHanover, MD 21076–1320
National Technical Information Service5301 Shawnee Road
Alexandria, VA 22312
Available electronically at http://www.sti.nasa.gov
Trade names and trademarks are used in this report for identification only. Their usage does not constitute an official endorsement, either expressed or implied, by the National Aeronautics and
Space Administration.
Level of Review: This material has been technically reviewed by technical management.
This report contains preliminary findings, subject to revision as analysis proceeds.

NASA/TM—2011-217013 1
Ice Shape Characterization Using Self-Organizing Maps
Stephen T. McClain Baylor University
Waco, Texas 76798
Peter Tino The University of Birmingham
Birmingham, B15 2TT, United Kingdom
Richard E. Kreeger National Aeronautics and Space Administration
Glenn Research Center Cleveland, Ohio 44135
Abstract A method for characterizing ice shapes using a self-organizing map (SOM) technique is presented.
Self-organizing maps are neural-network techniques for representing noisy, multi-dimensional data aligned along a lower-dimensional and possibly nonlinear manifold. For a large set of noisy data, each element of a finite set of codebook vectors is iteratively moved in the direction of the data closest to the winner codebook vector. Through successive iterations, the codebook vectors begin to align with the trends of the higher-dimensional data. In information processing, the intent of SOM methods is to transmit the codebook vectors, which contains far fewer elements and requires much less memory or bandwidth, than the original noisy data set. When applied to airfoil ice accretion shapes, the properties of the codebook vectors and the statistical nature of the SOM methods allows for a quantitative comparison of experimentally measured mean or average ice shapes to ice shapes predicted using computer codes such as LEWICE. The nature of the codebook vectors also enables grid generation and surface roughness descriptions for use with the discrete-element roughness approach. In the present study, SOM characterizations are applied to a rime ice shape, a glaze ice shape at an angle of attack, a bi-modal glaze ice shape, and a multi-horn glaze ice shape. Improvements and future explorations will be discussed.
Nomenclature b code book vector element h(i,j) neighborhood function of i to j codebook vectors j codebook vector index M number of codebook vectors Rd high-dimensional data space x element of data set δ scaling parameter governing neighborhood size η learning rate
Introduction During the validation and verification of ice accretion codes, predicted ice shapes must be compared
to experimental measurements of wind-tunnel or atmospheric ice shapes. Current methods for ice accretion code validation are either are based on ice shape features such as horn angle, horn thickness, stagnation thickness, and wrap limits, depicted in Figure 1.

NASA/TM—2011-217013 2
While the shape features noted by Wright and Chung (Ref. 1) are important and can be related to airfoil performance, in many instances, distinct horns are not apparent and horn and ice features can change considerably along the span of a two-dimensional airfoil. Figure 2 shows the comparison of a measured ice shape to three different ice shape predictions for a NACA 0012 airfoil (Ref. 2). Like most other comparisons of computational predictions to ice shape measurements, Fortin et al. (Ref. 2) only provide an ad hoc comparison of the predicted ice shapes to a “typical” two-dimensional ice shape trace. Most importantly, no definition of what makes the measured ice shape “typical” is provided, and no statistical data are provided to determine how well the predictions compare to the “typical” ice shape.
Most “two-dimensional” ice shapes on straight wings have considerable three-dimensional variations along the span of the wing. Figure 3 shows a three-dimensional point cloud from an ice shape measured after a test in the NASA Icing Research Tunnel at Glenn. The ice shape point cloud shows significant variation along the spanwise direction. This variation along the spanwise direction is evident when the point cloud is projected onto the chord-thickness plane, shown in Figure 4. Figure 4 shows that the “typical” ice shape may have a deviation of as much as 0.1 in. any direction on the horn. However, current ice shape comparison techniques do not consider this experimental uncertainty in the comparisons. More rigorous “typical” ice shapes and comparison methods are required to advance ice accretion codes.

NASA/TM—2011-217013 3
Because of the spanwise variation of ice shape measurements, a new method is needed to determine what constitutes a “typical” ice shape. The following sections present the basics of a neural network concept called a self-organizing map (Ref. 3) has the potential for enabling this more rigorous comparison of ice shape predictions to three-dimensional ice shape measurements. A neural network concept called a self-organizing map (SOM) has the potential for enabling this more rigorous comparison of ice shape predictions to three-dimensional ice shape measurements.
Self Organizing Maps Figure 5 shows three-dimensional data scattered about β, which is inherently one-dimensional
(a manifold). In a signal-processing application, the data in Figure 5 is noisy and requires significant memory. If information about β could be obtained, the “trend” of the noisy data could be transmitted much less expensively than transmitting the complete noisy data set. The important question is “how can the nature of β be determined using the experimental data?”
Self-organizing maps depend on the use of codebook vectors, b, to represent “clumps” of data, depicted in Figure 6. When a series of codebook vectors are connected, the one-dimensional manifold guiding the data in Figure 6 is represented by the spline through the codebook vectors. To develop the codebook vectors, an initial shape or random distribution of the vectors is determined. The codebook vectors are then moved in the direction of the “clump” of points to which the codebook vector is closest. Like most neural network approaches, the SOM requires a learning or training process. Over iterative moves, the codebook vectors spread out and settle into their local clumps.
The self-organizing map (SOM) can be best described as a constrained clustering method (Ref. 3). Consider a data set of high dimensional points aligned (up to some noise) along a lower dimensional manifold embedded in the high dimensional data space Rd, as depicted in Figure 5. In SOM such a data set is described through a collection of M codebook vectors bj ∈ Rd, j = 1,2,...,M, living in the data space. Each codebook vector bj represents the region of the data space around it (Voronoi compartment of bj), such that all data points in that region are closer to bj than to any other codebook vector. Crucially, a topological neighborhood structure is imposed on the codebook using a neighborhood function h(i,j), i,j = 1,2,...M. Higher values of h(i,j) signify that codebook vectors bi, bj, should be neighbors (e.g., lie close to each other in the data space). Smaller values of h(i,j) mean that no such requirement applies.
During the training process, the codebook vectors get adapted to the data set so that the quantization error (resulting from representing each original data point x by the codebook vector bwin(x) closest to it) is minimized and, at the same time, the layout of codebook vectors bj in the data space respects the neighborhood properties dictated by the neighborhood function h(i, j). For a one-dimensional data

NASA/TM—2011-217013 4
structure, e.g., Figure 5, one simply prescribes that the representative codebook vectors bj must lie on a “bicycle chain” embedded in the data space. This corresponds to imposing a linear order on the codebook vector indexes 1<2<3<...<M and defining
( ) ( ) ,exp, 2
2
δ
−−=
jijih i,j = 1,2,...,M, (1)
where δ is the scale parameter governing the neighborhood size.
During the training phase, data points are iteratively selected from the data set and for each data point x, all codebook vectors are moved from their current positions closer to x. By how much each codebook vector bj gets moved depends on how close we want bj to be to the principal representative bwin(x) of x. The closer bj should be to bwin(x), as measured by the value h(win(x), j) of the neighborhood function, the more it gets moved towards x. The update equation can be summarized as ( )( ) ( )jjj bxjxwinhbb −⋅η⋅+← , , j = 1,2,...,M, (2) where η is a positive real number (called learning rate) modulating the proportions of codebook vector updates.

NASA/TM—2011-217013 5
To ensure convergence of the algorithm, the learning rate η is made to decrease over time (e.g., exponentially) from some initial value to 0. It can be shown that in order to preserve the neighborhood relations among the codebook vectors, it is recommended that the neighborhood scale parameter δ decreases over time as well. Starting with a broader neighborhood (higher value of δ) enabling rough ordering of codebook vectors in the data space, the neighborhood size is gradually decreased, leading to a more selective codebook ordering.
When the SOM method is applied to the two-dimensional projection of the ice shape data, the result is Figure 7. Figure 7 presents a 30-point SOM representation of the ice shape. The SOM results demonstrate that the codebook vectors spread out and, since many points are usually packed in feature changes (like horn tips), that most of the important shape features are captured well by the SOM representation.
Application to Ice Shape Characterization
The nature of the SOM method and the positioning of the codebook vectors also enable a more rigorous validation method for ice accretion codes. Since the “clumps” of points are distributed about the codebook vectors, the deviations of the point measurements in the clumps can be used to evaluate the coverage statistics and uncertainty of the codebook vector representation. Figure 8 demonstrates how each surface measurement is used to determine a deviation from the spline surface through the control points or codebook vectors.
When the deviation of all of the points in a clump are used to calculate the spatial standard deviation about the codebook vectors, coverage limits that contain a set percentage of the points may be determined. An example of the generation of 95 percent coverage limits is presented in Figure 9. Figure 10 shows the resulting 95 percent coverage limits when the method is applied to the three-dimensional ice shape using the central difference estimate for local derivatives at a codebook vector as opposed to the true spline normals.
The coverage limits provide a mechanism for comparison of the measured ice shapes to predicted ice shapes. If the predicted ice shape is within the coverage limits or uncertainty bands, then the predicted ice shape agrees with the experimental measurements. An experimental uncertainty can also be assigned to horn dimensions and wrap limits. However, many questions remain regarding the repeatable application of SOM methods. For example, the most important is “how many codebook vectors are needed to fully characterize a shape?” Others are “If an initially random set of codebook vectors is used, is the method repeatable?” and “Can initial shapes be used that provide repeatable and quick ice shape characterization?”

NASA/TM—2011-217013 6
In the next sections, the SOM will be applied to a rime ice shape, to a glaze ice shape formed on an airfoil at an angle of attack (depicted in Fig. 3), a bi-modal glaze ice shape, and a glaze ice shape with multiple upper and lower horns. Initial observations based on the ice shape characterizations are presented, and improvements and future explorations are discussed.

NASA/TM—2011-217013 7
Application to Selected Ice Shapes Four ice shapes were examined using self organizing maps. The ice shapes were generated in the
Icing Research Tunnel at NASA Glenn Research Center in Cleveland, Ohio. Castings were made of the ice shapes to enable better reflectivity of the laser off the ice accretion surfaces. The castings were scanned with different laser systems and used to create point clouds of the ice shapes. Each of the point clouds consisted of well over 100,000 point measurements. Because of the memory limits with the SOM tool used with more than 30 codebook vectors, only the 50 percent spanwise-center section and approximately the 20 percent of the chord-wise airfoil measurements closest to the leading–edge (approximately 20,000 points for each ice-shape) were analyzed.
The shortened point clouds were then analyzed using the JAVA applet BSOM1 (Ref. 5). Initially, BSOM1 places a random distribution of codebook vectors in the ice shape domain. Running BSOM1 with a random initial placing of the codebook vectors produces a final ice shape characterization where the codebook vectors adequately capture the ice shape, but the points are out of order along the arc-length of the manifold. To create ice shape characterizations with ordered points along the arc-length of the ice shape, the initial points were manually placed in order along a shape that resembled the first 15 percent of a NACA airfoil. BSOM1 was then set to “automatic learning” and run until significant movement of the codebook vectors could not be detected by sight. The resulting codebook vectors from BSOM1 and the point clouds were the read into Mathcad to generate the statistical coverage limits.
The next sections describe the results of the SOM and statistical coverage limits for the four icing shapes. Those ice shapes include: 1) a rime ice shape, 2) a glazed ice shape created with the airfoil positioned with a nonzero angle of attack, 3) a bi-modal glaze ice shape, and 4) a multi-horn glaze ice shape. The ice shapes and corresponding SOM representations explore issues with the rapid and repeatable application of SOM methods to ice shapes.
Rime Ice Shape
Figure 11 presents a rime ice shape point cloud and its 30-point SOM representation. A significant observation about the SOM representation is the inability of the SOM to capture the sharp leading edge of the ice shape. Because the codebook vectors are automatically moved in the direction of the closest clump, the do not seem to capture abrupt changes in the manifold (discontinuous manifold derivatives) such as the leading edge on the rime ice shape where there is a low level of roughness. Otherwise, the codebook vectors capture the ice shape very well qualitatively.

NASA/TM—2011-217013 8
Figure 12 presents the SOM representation of the rime ice shape and the 95 percent coverage limits. While the SOM does not capture the location of the “point” of the leading edge of the airfoil, the computed coverage limits enclose the point cloud.
Glaze Ice Shape With Angle of Attack
Figures 3, 7, and 10 present a gaze ice shape formed on an airfoil placed in the wind tunnel with an angle of attack. Inspecting Figures 3, 7, and 10, the far spanwise sections of the ice shape are bare airfoil surfaces, i.e., the edges of the airfoil have no ice accumulation. While the codebook vectors adequately seem to represent the ice shape, Figure 10 demonstrates that the inclusion of these non-iced airfoil points significantly increases the coverage limits on the bottom surface of the airfoil.
To investigate the question of how many codebook vectors are needed to represent an ice shape, the shortened section of the ice shape of Figure 3, without the “clean” airfoil sections, was analyzed using a 40-point SOM and a 50-point SOM. Figures 13 and 14 present the 40-point SOM representation and coverage limits of a glaze ice accretion formed on an airfoil at an angle of attack. Figure 13 demonstrates that increasing the number of codebook vectors to 40 continues to capture the form of the ice shape, qualitatively. Figure 14 demonstrates that eliminating the “clean” airfoil points that were included in the original ice-shape file greatly improves the coverage limits captured by the SOM. That is from observation, not more or not less than 5 percent of the shortened point cloud measurements appear outside the spline through the coverage limit points.
Figures 15 and 16 present the results of a 50-point SOM for the shortened point cloud from the ice shape of Figure 3. Figures 15 and 16 demonstrate that increasing the number of codebook vectors does not necessarily improve the point cloud representation. Figure 15 shows that on the downstream section of the top horn, the codebook vectors begin to deviate about the perceived manifold in a meandering (i.e., zigzag) pattern. Figure 15 identifies a natural limiting factor of quality of BSOM representation. That limiting case being the minimum arc length between two codebook vectors should not be less than twice the local standard deviation of the data points from the manifold in order to adequately represent the original manifold.

NASA/TM—2011-217013 9
Bi-Modal Glaze Ice Shape
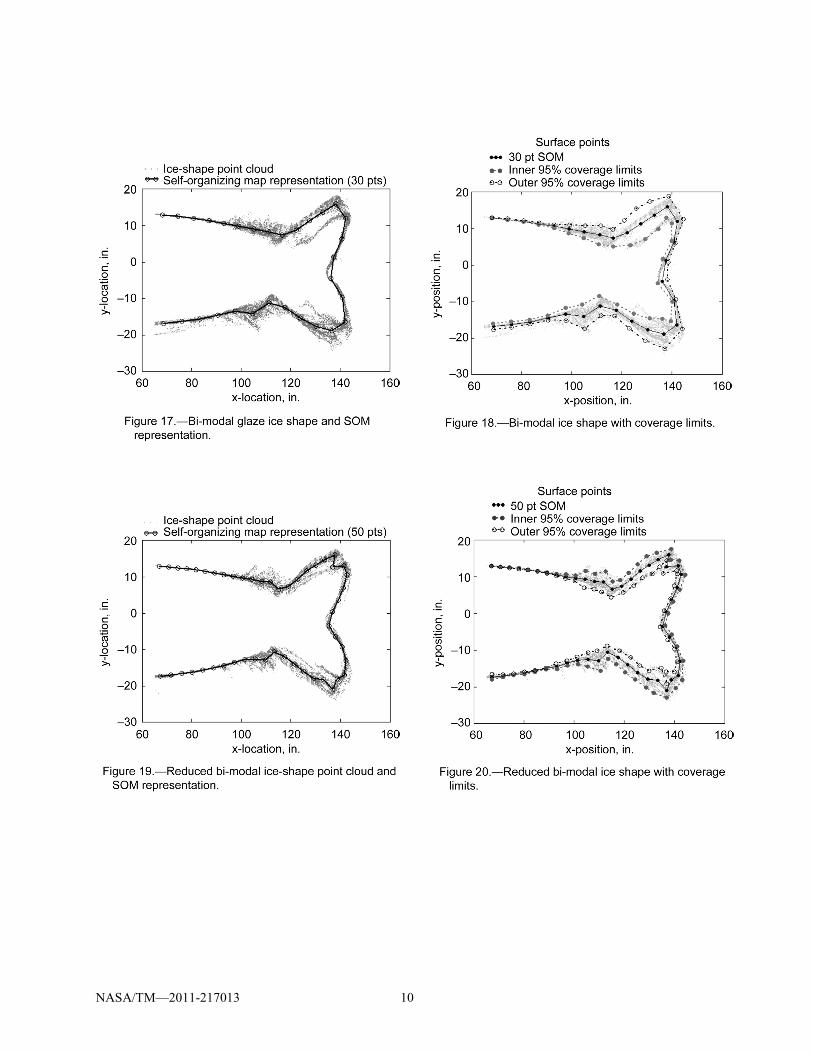
Some ice shapes have a significant variation in form, as opposed to smaller scale changes referred to as roughness, across the span of the airfoil and ice shape. In some instances, two distinct modes of ice shape can be identified within one ice shape point cloud. Figures 17 and 18 present the SOM results and coverage limits for a bi-modal ice shape. Figure 17 shows that for the shortened point cloud from the ice shape, the outer mode is dominant. The codebook vectors most closely follow the outer mode, but the codebook vectors are slightly skewed inward because of the points following the inner mode of the ice shape. Likewise, Figure 18 demonstrates that inclusion of the inner mode points inflates the coverage limits such that the outer limit points are far outside the true scatter of the point cloud outside of the codebook vectors.
For a bi-modal ice shape, a meaningful representation of the ice shape would be obtained by characterizing both the inner and outer modes separately. For example, Figures 19 and 20 present a 50-point SOM representation of the bi-modal ice shape with most of the points following the inner mode removed from the point cloud. While a few of the point begin to deviate from the outer mode shape, the new SOM representation and coverage limits represent the outer mode manifold very well.
Multi-Horn Ice Shape
Finally, the SOM approach was applied to a glaze ice shape that presented multiple horns on both the upper and lower surfaces of the airfoil. A 38-point SOM representation and the resulting coverage limits for an ice shape with multiple upper and lower surface horns are presented in Figures 21 and 22. Figures 21 and 22 demonstrate that the 38-point SOM representation effectively captures the overall manifold shape and the two dominant horn features; however, the smaller features of the surface are smoothed. Also, the coverage limits on the secondary bottom horn are somewhat inflated because the feature is actually a spanwise-developing feature. That is, the form of the secondary-bottom horn is not constant across shortened point cloud, but it is actually changing along the spanwise distance across the shortened point cloud. (As a side note, Figs. 21 and 22 present a 38-point SOM representation because two points were deleted from a 40-point data set from BSOM1. It is not clear why, but the BSOM1 algorithm placed two codebook vectors almost exactly “on top” of two other codebook vectors. Co-location of codebook vectors should not be an issue with SOM methods. Operator error with the initial placement of the codebook vectors, learning rate constant, and neighborhood scaling parameters during the learning process is suspected in causing the issue.)
NASA/TM—2011-217013 10

NASA/TM—2011-217013 11
Conclusions The neural network concept called a self-organizing map was presented for the identification of
“typical” ice shapes for comparison of measured wind tunnel ice shapes with the results from ice accretion prediction codes. In addition to the ice shape characterization, a method was presented for the generation of coverage limits for the SOM representation using the statistics of the surface points around each point’s winning codebook vector. The coverage limits represent a first step in identifying a rigorous approach to verification and validation of ice accretion codes. The results of the SOM characterizations and coverage limits for four ice shapes were presented. The self organizing maps provided captured the significant trends of each of the ice shapes studied. While significant trends were captured, issues noted during the application of the SOM and coverage limit methods to the four ice shapes include: 1. Errors in the SOM representation or coverage limit inflation may be caused by spurious points,
non-ice shape artifacts (such as bare airfoil points), and bi-modal ice shapes; and 2. When low noise (roughness) is present in the ice shape, the SOM methods may smooth regions with
discontinuous slopes on the manifold such as at the tip of a rime ice shape; and 3. There is an upper limit on the number of points able to capture the true form of the manifold
(ice shape). This limit is set by the deviation of the point cloud about the manifold and the arc length along the manifold between two codebook vectors.
While the results of this study are primarily qualitative based on visual inspection, the self-organizing map process represents a promising approach to rigorous characterization of three-dimensional ice shape point clouds.

NASA/TM—2011-217013 12
References 1. Wright, W. and Chung, J., “Correlation Between Geometric Similarity of Ice Shapes and the
Resulting Aerodynamic Performance Degradation—A Preliminary Investigation Using WIND,” NASA/CR-1999-209417 and AIAA–2000–0097, 2000.
2. Fortin, G., Laforte, J. and Beisswenger, A., “Prediction of Ice Shapes on NACA0012 2D Airfoil,” SAE Paper No.: 2003-01-2154, 2003.
3. Kohonen, T., Self-Organizing Maps, Berlin: Springer-Verlag, 3rd ed., 2001. 4. Tino, P., “Intelligent Data Analysis: Topographic Maps of Vectorial Data,” COMP/06-20233/LM
Intelligent Data Analysis, Course Notes, University of Birmingham, 2006. 5. Utsugi, A., “BSOM1: Bayesian Self-Organizing Map Ver. 1.0,” 1996.

REPORT DOCUMENTATION PAGE Form Approved OMB No. 0704-0188
The public reporting burden for this collection of information is estimated to average 1 hour per response, including the time for reviewing instructions, searching existing data sources, gathering and maintaining the data needed, and completing and reviewing the collection of information. Send comments regarding this burden estimate or any other aspect of this collection of information, including suggestions for reducing this burden, to Department of Defense, Washington Headquarters Services, Directorate for Information Operations and Reports (0704-0188), 1215 Jefferson Davis Highway, Suite 1204, Arlington, VA 22202-4302. Respondents should be aware that notwithstanding any other provision of law, no person shall be subject to any penalty for failing to comply with a collection of information if it does not display a currently valid OMB control number. PLEASE DO NOT RETURN YOUR FORM TO THE ABOVE ADDRESS.
1. REPORT DATE (DD-MM-YYYY) 01-05-2011
2. REPORT TYPE Technical Memorandum
3. DATES COVERED (From - To)
4. TITLE AND SUBTITLE Ice Shape Characterization Using Self-Organizing Maps
5a. CONTRACT NUMBER
5b. GRANT NUMBER
5c. PROGRAM ELEMENT NUMBER
6. AUTHOR(S) McClain, Stephen, T.; Tino, Peter; Kreeger, Richard, E.
5d. PROJECT NUMBER
5e. TASK NUMBER
5f. WORK UNIT NUMBER WBS 877868.02.07.03.03.01
7. PERFORMING ORGANIZATION NAME(S) AND ADDRESS(ES) National Aeronautics and Space Administration John H. Glenn Research Center at Lewis Field Cleveland, Ohio 44135-3191
8. PERFORMING ORGANIZATION REPORT NUMBER E-17677
9. SPONSORING/MONITORING AGENCY NAME(S) AND ADDRESS(ES) National Aeronautics and Space Administration Washington, DC 20546-0001
10. SPONSORING/MONITOR'S ACRONYM(S) NASA
11. SPONSORING/MONITORING REPORT NUMBER NASA/TM-2011-217013
12. DISTRIBUTION/AVAILABILITY STATEMENT Unclassified-Unlimited Subject Category: 02 Available electronically at http://www.sti.nasa.gov This publication is available from the NASA Center for AeroSpace Information, 443-757-5802
13. SUPPLEMENTARY NOTES
14. ABSTRACT A method for characterizing ice shapes using a self-organizing map (SOM) technique is presented. Self-organizing maps are neural-network techniques for representing noisy, multi-dimensional data aligned along a lower-dimensional and possibly nonlinear manifold. For a large set of noisy data, each element of a finite set of codebook vectors is iteratively moved in the direction of the data closest to the winner codebook vector. Through successive iterations, the codebook vectors begin to align with the trends of the higher-dimensional data. In information processing, the intent of SOM methods is to transmit the codebook vectors, which contains far fewer elements and requires much less memory or bandwidth, than the original noisy data set. When applied to airfoil ice accretion shapes, the properties of the codebook vectors and the statistical nature of the SOM methods allows for a quantitative comparison of experimentally measured mean or average ice shapes to ice shapes predicted using computer codes such as LEWICE. The nature of the codebook vectors also enables grid generation and surface roughness descriptions for use with the discrete-element roughness approach. In the present study, SOM characterizations are applied to a rime ice shape, a glaze ice shape at an angle of attack, a bi-modal glaze ice shape, and a multi-horn glaze ice shape. Improvements and future explorations will be discussed.15. SUBJECT TERMS Aircraft icing
16. SECURITY CLASSIFICATION OF: 17. LIMITATION OF ABSTRACT UU
18. NUMBER OF PAGES
18
19a. NAME OF RESPONSIBLE PERSON STI Help Desk (email:[email protected])
a. REPORT U
b. ABSTRACT U
c. THIS PAGE U
19b. TELEPHONE NUMBER (include area code) 443-757-5802
Standard Form 298 (Rev. 8-98)Prescribed by ANSI Std. Z39-18